Embed Size (px)
Citation preview
1
Comparability of Accelerometer- and IPAQ-Derived Physical Activity and Sedentary
Time in South Asian Women: A Cross-Sectional Study
Manuscript type: ORIGINAL ARTICLE
Key words: Accelerometry, health behavior, measurement, physical activity assessment
Abstract word count: 195
Manuscript word count:
Date of submission: 10 December 2013
2
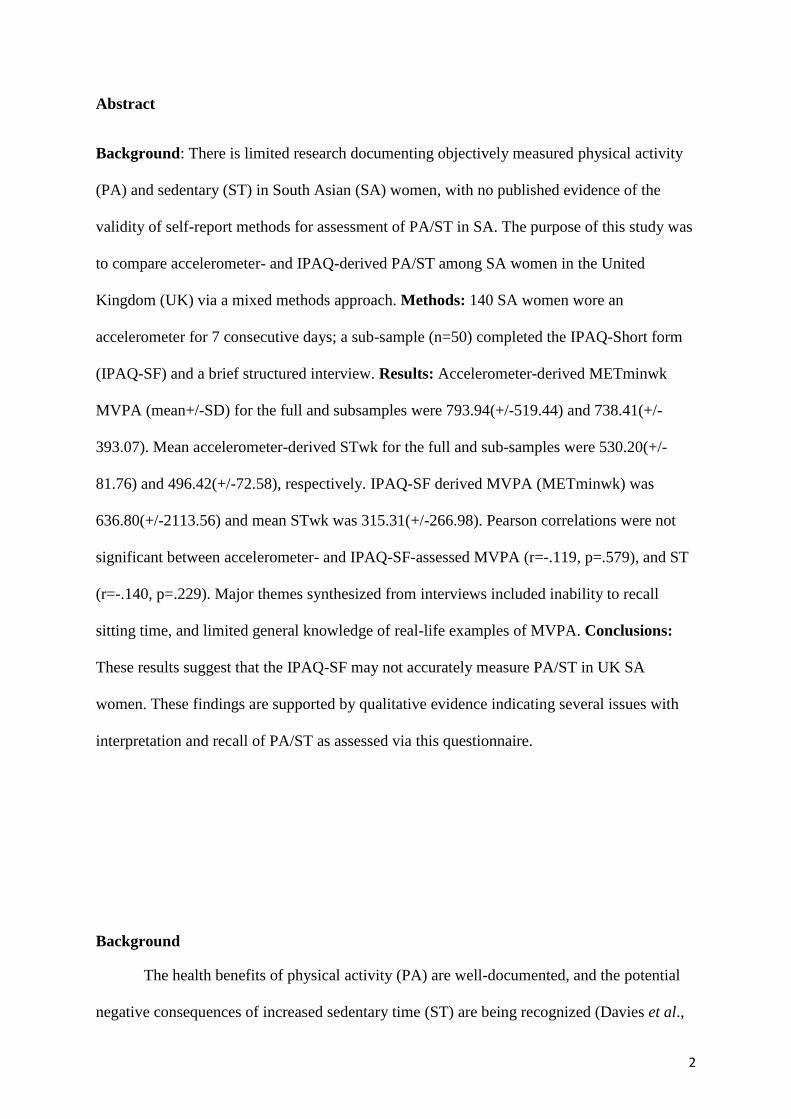
Abstract
Background: There is limited research documenting objectively measured physical activity
(PA) and sedentary (ST) in South Asian (SA) women, with no published evidence of the
validity of self-report methods for assessment of PA/ST in SA. The purpose of this study was
to compare accelerometer- and IPAQ-derived PA/ST among SA women in the United
Kingdom (UK) via a mixed methods approach. Methods: 140 SA women wore an
accelerometer for 7 consecutive days; a sub-sample (n=50) completed the IPAQ-Short form
(IPAQ-SF) and a brief structured interview. Results: Accelerometer-derived METminwk
MVPA (mean+/-SD) for the full and subsamples were 793.94(+/-519.44) and 738.41(+/-
393.07). Mean accelerometer-derived STwk for the full and sub-samples were 530.20(+/-
81.76) and 496.42(+/-72.58), respectively. IPAQ-SF derived MVPA (METminwk) was
636.80(+/-2113.56) and mean STwk was 315.31(+/-266.98). Pearson correlations were not
significant between accelerometer- and IPAQ-SF-assessed MVPA (r=-.119, p=.579), and ST
(r=-.140, p=.229). Major themes synthesized from interviews included inability to recall
sitting time, and limited general knowledge of real-life examples of MVPA. Conclusions:
These results suggest that the IPAQ-SF may not accurately measure PA/ST in UK SA
women. These findings are supported by qualitative evidence indicating several issues with
interpretation and recall of PA/ST as assessed via this questionnaire.
Background
The health benefits of physical activity (PA) are well-documented, and the potential
negative consequences of increased sedentary time (ST) are being recognized (Davies et al.,
3
2011; Gill &Malkova, 2006). Major health organizations agree that 150 minutes of moderate
intensity PA or 75 minutes of vigorous activity per week are needed to reduce risks for
chronic disease morbidities and premature mortality (UKDH, 2011; USDHHS, 2011;). There
are currently no guidelines for ST; however it is suggested that reducing ST as much as
possible and breaking up bouts of ST are important strategies to promote health (USDHHS,
2011; UKDH, 2011). Those who are physically active can reduce their risk for cardiovascular
disease by up to 50% (Eapen et al., 2009; Williams et al, 2010a), and reducing ST may
improve metabolic profiles of adults with type 2 diabetes (Cooper et al., 2012).
Self-report data from the Health Survey for England indicate that Bangladeshi and
Pakistani women in the UK are less likely to meet PA guidelines than their white
counterparts (Higgins & Dale, 2009). Limited data suggest that South Asian (SA) women are
also more sedentary than the general population (Babakus & Thompson, 2012). As such,
increasing PA and reducing ST in this population are important public health priorities, as SA
are at higher risk than the general population for morbidity and premature mortality resulting
from various chronic diseases (Eapen et al., 2009; Gill & Malkova, 2006; Williams et al.,
2010a). As in all populations, it is important to accurately assess PA/ST in SA to enhance
surveillance and examine trends, and develop and evaluate appropriate and effective
prevention and intervention strategies to increase PA and reduce ST (Lee et al., 2011).
There is currently no generally accepted standardised method of accurately assessing
PA/ST, although self-report questionnaires and objective methods such as accelerometry are
now widely used (Kurtze et al., 2008). A recent mixed-methods systematic review
examining PA/ST among SA women (aged 16 to 90yrs) found that there is limited published
research documenting objectively measured PA/ST levels in SA women. Further, this review
revealed no published evidence of the validity of self-report methods of PA assessment in this
group, and indicated that findings published to date on PA/ST in SA women is of relatively
4
low quality (Babakus & Thompson, 2012). Moreover, only two studies used objective
measurements of PA and only two studies assessed self-reported ST (Babakus & Thompson,
2012).
Accelerometry is a popular method of objectively measuring PA/ST due to small
device size and ease of use (Lee et al., 2011). These devices are lightweight motion sensors
that record frequency, intensity and duration of PA and can detect ST; they monitor activity
in a free-living environment and are practical for measuring PA/ST in large groups (Mathie et
al., 2004). However, due to their relatively high cost, accelerometers are not always an option
for large-scale studies. Therefore questionnaires are commonly used to assess PA/ST. There
are over 85 self-administered questionnaires available to measure PA/ST for adults, children
and the elderly (Williams et al., 2010). Among these, the International Physical Activity
Questionnaire (IPAQ) has become a widely used self-report tool to assess PA/ST (Williams
et al., 2010a). The IPAQ is designed to provide data on PA/ST that can be compared
nationally and internationally and validated using accelerometry (IPAQ, 2013). This
questionnaire is intended to be translated and culturally adapted as needed, although to date,
there appear to be no published studies examining how it may need to be adapted for use
within groups with a range of English literacy (such as SA women living in the UK).
To our knowledge, no studies have explored the validity of using the IPAQ to assess
PA and ST in SA women (Babakus & Thompson 2012; Kurtze et al., 2008). Thus, the aims
of this mixed-method study were to: 1) assess the comparability of accelerometer and IPAQ
derived PA/ST in SA women (specifically Bangladeshi and Pakistani) in the UK, a group
with limited English language skills and at high risk for low PA, high ST, and CVD and other
chronic diseases (Landman & Cruickshank, 2001); and 2) provide a description of SA
women’s understanding of the terminology, content and context of the IPAQ-SF using brief
structured interviews.
5
Methods
Participants
A convenience sample of Bangladeshi and Pakistani women aged 18-72 years living
in Cardiff, Wales were recruited from January 2012 through March 2013. Recruitment was
initiated with contacts from a previous study conducted within the Bangladeshi community
(Project MINA, 2013), with additional recruitment conducted via referral from those
contacts, and various community groups in Cardiff. Women were eligible to participate if
they were 18 years or older, born in Bangladesh or Pakistan and now living in the UK, or
born in the UK with Bangladeshi or Pakistani parents, healthy enough to participate, and able
to give full informed consent. Translators fluent in Punjabi, Urdu, Bengali and Sylheti were
available during all phases of recruitment and data collection for women who were not fully
fluent in English. All participants were invited to wear an accelerometer and have
demographic and anthropometric measurements taken. On the day of measurement, a sub-
sample of women across the age range and levels of English literacy was invited to complete
the IPAQ-Short Form (IPAQ- SF). Written and verbal consent was obtained from
participants; ethical approval was granted by the University Ethical Review Committee of the
University of Birmingham (reference # ERN_12-1316).
Descriptive Characteristics
Descriptive data included height (to the nearest mm with a SECA Leicester
Stadiometer), weight (to the nearest 0.1 kg using a SECA 899 digital scale), and waist
circumference (to the nearest cm) using standard protocols. Age, current health/disease status,
medications, place of birth and years in the UK were self-reported. Body fat percentage was
estimated (to the nearest 0.1%) using bioelectrical impedance (BodyStat Quadscan 4000 unit,
BodyStat Ltd, Douglas, Isle of Man, British Isles) and an equation validated among SA
6
women (Kolt et al., 2007). Body mass index (BMI) was calculated by dividing weight in
kilograms by the square of height in meters.
IPAQ-Short Form
The IPAQ-SF is a 9-question self-report tool that documents PA/ST performed over
the previous 7 days (IPAQ, 2013). The tool is intended to be translated, culturally adapted,
and self-administered, and as such was considered to be an appropriate self-report tool to use
within the current sample. English literacy levels of participants were as follows: 1) 38.6%
were fully fluent in written and spoken English, and completed the English version of the
IPAQ-SF in the presence of a researcher (WBC); 2) 34.2% had some written and spoken
English literacy, but preferred to complete the IPAQ-SF in their native language in the
presence of the researcher and a trained translator; and 3) 26.3% had little or no English
literacy skills and thus completed the IPAQ-SF in their native language in the presence of the
researcher and a trained translator.
Data were converted into MET-minutes per week based on the IPAQ scoring protocol
(IPAQ, 2013). One MET (Metabolic Equivalent) is equivalent to resting energy expenditure.
Total minutes over the 7 days spent in moderate- and vigorous-intensity PA were multiplied
by 4.0 and 8.0, respectively, to obtain a MET score for each intensity level. Moderate and
vigorous intensity scores were then summed to estimate overall PA (Lee et al., 2011).
Accelerometer
The Actigraph GT1M and GT3X were used to collect objective measures of PA/ST.
These models are widely employed and data obtained from them are reported to be valid and
7
reliable in adults, children and the elderly (Lee et al., 2011). A recent study (Vanhelst et al.,
2012) comparing the GT1M and the GT3X models found no significant difference in
measurement of PA/ST between the models, therefore no additional calibration or validation
between the two models was undertaken. Participants were instructed to wear the
accelerometer around their waist for 7 consecutive days during waking hours, and to remove
it for sleeping, swimming, or bathing.
Data Reduction
Accelerometer data were downloaded using Actilife 6 data analysis software (Actigraph,
LLC, Pensacola, Florida). The epoch for analysis was 60 seconds (Dinesh et al, 2012). A
valid day of accelerometry measurement was defined as a recording of at least 600 minutes of
registered time (Dinesh et al, 2012). Participants with a minimum of 3 valid days of activity
that included one weekend day were included in analyses (Gemmill et al., 2011). Non-wear
time was defined as more than 60 successive minutes of zero counts. Data were reduced
using Kinesoft software (v3.3.75; Kinesoft, Saskatchewan, Canada) to provide counts per
minute (CPM) of activity, minutes of moderate-to-vigorous physical activity (MVPA), and
minutes spent in ST. Cut points used to determine minutes spent at intensity levels were:
sedentary = <50counts/min.; light activity = 51-500 counts/min.; moderate activity = 501-
1400 counts/min; vigorous activity = 1401-2300/min; and very vigorous activity = 2301- ∞
/min (Freedson et al., 1998). Nonparametric data were log transformed for statistical
analyses.
Comparison Variable
8
The IPAQ-SF calculates and reports physical activity in MET minutes per week
(METminWK). For comparison purposes, accelerometer data were converted into
METminWK. MVPA was calculated as [(8 x minutes of vigorous PA) + (4 x minutes of
moderate activity)] (Freedson et al., 1998). ST is reported as mean minutes per week (STwk)
for both accelerometer and IPAQ-SF data.
Brief Structured Interview
Following the administration of the IPAQ-SF, participants were invited to participate
in a brief interview to determine ease of use, understanding of terms used in the IPAQ-SF,
and cultural contextualisations of PA/ST in daily life. The interview consisted of 12 questions
based on a review of the literature and guided by the research aims of the study. A trained
translator was available for women with limited or no fluency in English. Interviews were
audio recorded and transcribed verbatim.
Data Analysis
Descriptive statistics (means, SDs, percentages) were calculated for all variables
(Table 1). T-tests were conducted to determine whether there were any significant
differences between the full and sub-sample for age, BMI, or accelerometer and IPAQ-SF
derived MVPA and ST. Pearson correlations were determined to examine the relationship
between accelerometer and IPAQ-SF by PA intensity level. Additionally, Bland-Altman plots
were used to explore the differences in the two methods of measurement. All statistical
analyses were conducted using PASW 18.0 (Quarry Bay, Hong Kong). Transcripts from the
brief interviews were coded independently by two researchers (WBC and JLT). Data from the
9
interview transcripts were coded using directed content analysis (Ferriday & Muir-Cochrane,
2006).
Results
140 (84%) of the 167 participants recruited into the study, had a minimum of 3-days
of valid accelerometry data and were included in analyses. A sub-sample of 50 participants
(36% of the 140 with valid accelerometer data) provided complete self-reported data from the
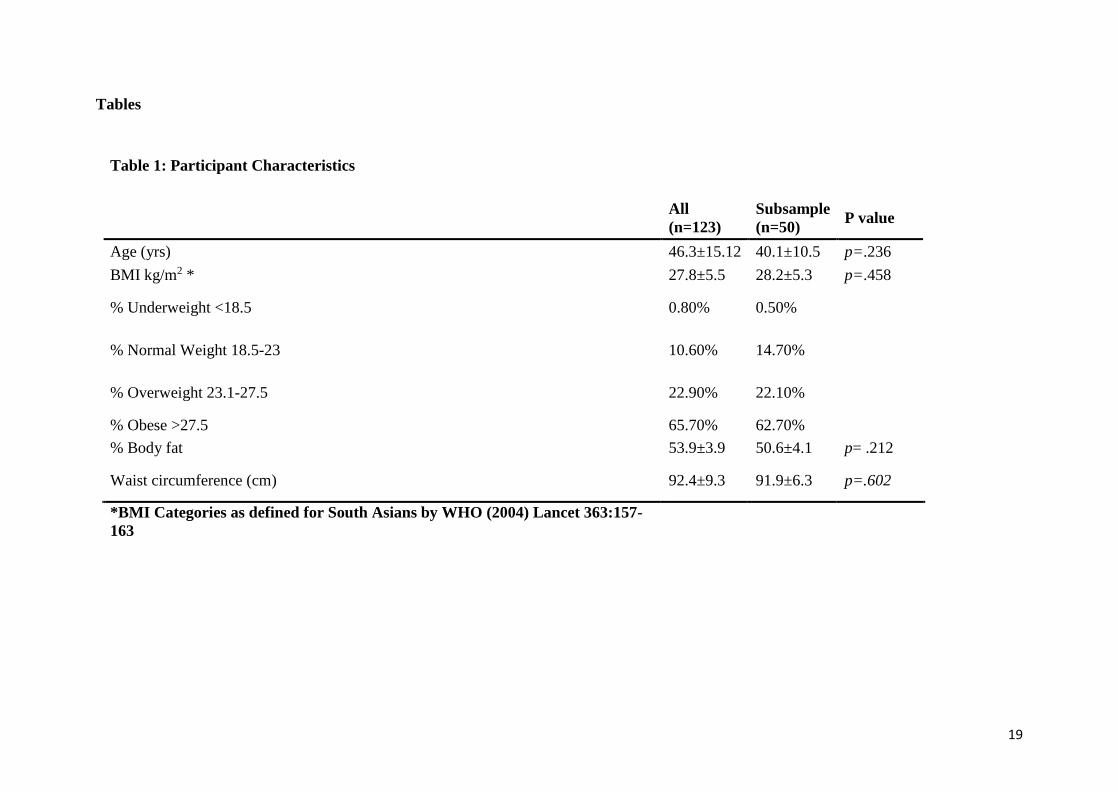
IPAQ-SF. As reported in Table 1, the mean age and BMI for the full sample were 46.3+/-
15.12 yr and 27.8+/-5.5 kg/m2, respectively; 22.9% and 65.7% were categorized as
overweight and obese, respectively, according to the World Health Organization’s definition
for SA BMI (WHO, 2004) (Table 1). Mean age and BMI for the sub-sample were 45.76+/-
13.6 and 28.0+/-6.3 kg/m2 respectively; 22.1% and 65.7% were categorized as overweight
and obese, respectively (Table 1).
Accelerometer-derived mean CPM was 313.43+/-118.38 min/day and mean MPVA
was 34.66+/-21.52 min/day for the full sample. Accelerometer derived METminwk MVPA
for the full and subsamples were 793.94(+/-519.44) and 738.41(+/-393.07), and mean
accelerometer derived ST (min/day) for the full and sub-sample was 530.20(+/-81.76) and
496.42(+/-72.58), respectively. IPAQ-SF derived MVPA (METminwk) was 636.80(+/-
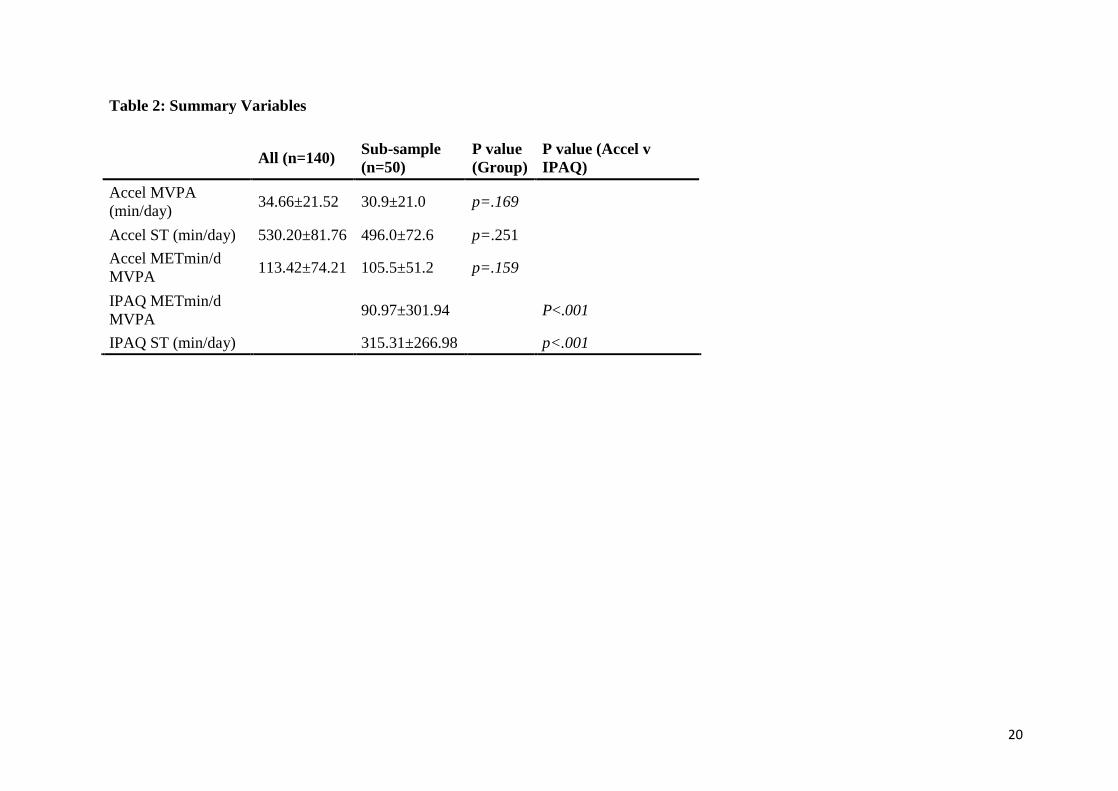
2113.55) and mean ST (min/day) was 315.31(+/-266.98) (Table 2). T-tests indicate no
significant difference (p>0.05) between the full and sub-sample in age, BMI, waist
circumference or accelerometer derived MVPA and ST.
There were significant differences between accelerometer METmin/wk MVPA and
IPAQ-SF METmin/wk MVPA (p<.001), and between accelerometer ST (min/day) and
10
IPAQ-SF ST (min/day) (p<.001), with the values lower for the IPAQ-SF in both instances.
Pearson correlations indicated no significant associations between accelerometer- and IPAQ-
SF-derived METminwk for MVPA (r=-.119, p=.579), or ST (r=-.140, p=.229). The Bland-
Altman plot of the differences in two methods of measurement of MVPA (Figure 1) indicates
that the mean of the differences between the two methods of measuring PA is not close to
zero; therefore the two methods are producing different results. Figure 2 shows a Bland-
Altman plot for differences in ST as measured by the two methods. Based on the differences
that plotted near zero, the accelerometer and IPAQ-SF methods may be more likely to
measure ST similarly. Caution should still be used when interpreting these results however,
since many of the differences also plotted below zero. This suggests that there are instances
where the two methods do not measure ST similarly.
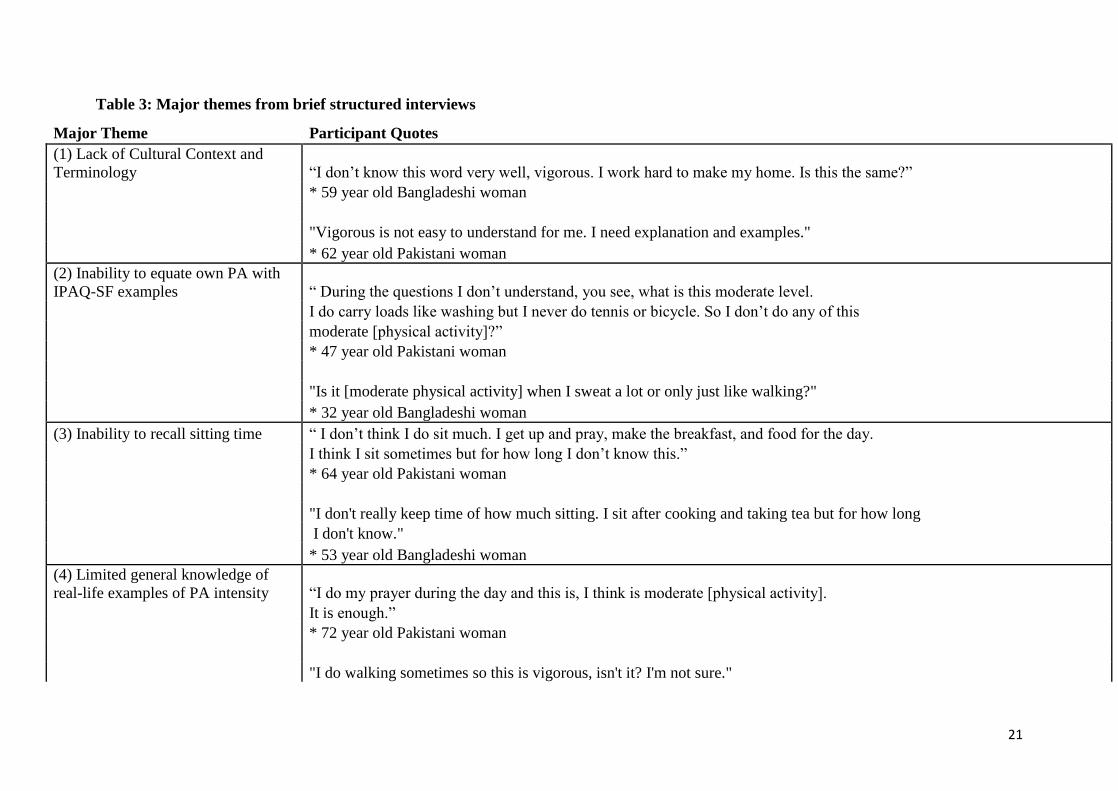
Major themes emerging from the brief structured interview included: (1) lack of
cultural context and terminology for participation in leisure-based PA; (2) inability of
participants to equate their own PA with examples of intensity levels from the IPAQ-SF; (3)
inability of participants to recall sitting time; and (4) limited general knowledge of real-life
examples of activities that are of moderate or vigorous intensity. Table 3 provides exemplar
quotes for each major theme. These themes were identified as the most salient issues
affecting participants’ ability to self-report PA/ST among this sample, with theme (1)
reported in 68% of interviews, theme (2) in reported in 53% of interviews, theme (3) reported
in 83% of interviews, and theme (4) reported in 57% of interviews.
Discussion & Conclusions
This study assessed the comparability of objectively measured PA/ST using
accelerometry with self-reported PA/ST using the IPAQ-SF in a sample of UK-residing SA
11
women. Results indicate that the IPAQ-SF may not accurately measure PA/ST in women of
Bangladeshi and Pakistani descent. There were no significant correlations between
accelerometer derived PA/ST and IPAQ-SF derived PA/ST; in fact, the correlation between
accelerometer- and IPAQ-SF-derived PA was negative, indicating that those with higher
objectively measured PA tended to report lower PA levels within the IPAQ-SF. In both the
measurement of PA and ST, the IPAQ-SF underestimated the level of activity of participants
when compared to accelerometer-derived data.
These findings are supported by the Bland-Altman plot showing the mean of the
differences to be above zero, and qualitative evidence indicating several issues with
interpretation and recall of PA/ST. Specifically the underestimation of MVPA may have been
affected by the lack of cultural context and terminology of leisure-based PA, the inability of
participants to relate PA examples given in the IPAQ-SF to their own PA, as well as their
difficulty in recalling sitting time. These results are consistent with those from similar studies
conducted with predominantly white participants and indicate an inherent recall bias
(Gemmill et al., 2011). Recall bias may be compounded in the present study by the
respondents’ lack of knowledge and cultural contextualisations related to participating in PA
for leisure, and to defining and describing their own PA/ST.
A recent systematic review highlights the difficulties in comparing levels the PA/ST
among SA due to the lack of standardized measurement, though some comparisons can be
made with studies using the IPAQ and accelerometer data (Babakus & Thompson, 2012).
Using the IPAQ, Williams et al. (2010) found that 45.6% of SA men and women in the study
were sedentary (using the benchmark of more than 3 hours/day of sedentary time) and Yates
et al. (2010) found 40% of SA women were sedentary (according to IPAQ-SF data). Our
study found a much higher percentage of participants to be sedentary according to the IPAQ-
12
SF (86%). A possible explanation for this difference may be, as the qualitative interviews
identify, an inability for participants’ to accurately recall sitting time. Kolt et al. (2007), in
one of only 2 published studies reporting PA from accelerometer data in SAs, and the only
one to report ST, reported 48% of SA men and women were sedentary when measured by
accelerometer. Similarly, accelerometer-derived data from our study showed 47.7% of our
sample to be sedentary. [thus we may want to add here that self-report may be different
between ours and other studies due to differences in including men, differences in literacy
level, or do they live in different places (i.e., US or India) where people may feel they can get
out and about more, reducing their ST – thus see if you can add these details from the studies
you mention here, as it gives a more clear and critical analysis of the existing limited
literature]
To date, the Health Survey for England (HSE) (2008) has not published data for
objectively measured PA and ST by ethnic group, but reports 33% of women aged XX-XX
sampled were sedentary for 6 or more hours per day and 71% as not meeting PA
recommendations (Roth, 2009). The HSE reports all women (aged XX-XX) as spending an
average of 584 minutes/day in ST and 24 minutes/day in MVPA (Chaudhury & Esliger,
2009). Our results indicate SA women spent 530.20(+/-81.76) and 496.42(+/-72.58)
minutes/day in ST for the full and sub-samples, respectively, and spent 34.66(+/-21.52) and
30.9(+/-21.0) minutes/day in MVPA for the full and sub-samples, respectively. These
findings suggest that SA women in the current sample may be less sedentary and slightly
more active than the general population of women in the UK. These findings are unique and
important, as to date all conclusions drawn about PA amongst SA women are based on self-
report and assume that they are substantially less active than the general White population.
13
There are some limitations to this study. Firstly, the study sample is a relatively small
convenience sample, and is not representative of all SA women living in the UK. It is
possible that the participants in this study are more active and less sedentary than the general
population of SA women in Cardiff and the UK. Strengths of this study include this being the
largest reported sample of SA women measured by accelerometer to date, the recruitment of
individuals who are traditionally defined as “hard-to-reach”, inclusion of SA women across
the range of age, activity levels, and English literacy levels, and triangulation of quantitative
data with qualitative interview data.
To our knowledge, there have been no other studies published to date that have
assessed the comparability of accelerometer- and IPAQ-SF-derived PA/ST among SA
women in the UK. Our data suggest that further validation of the IPAQ-SF with a larger
sample of SA women is needed to determine its suitability within this population. These
results strengthen the argument for the development of more culturally tailored and
contextualized self-report tools for the assessment of PA/ST among SA women, and
emphasize the need for the wider use of accelerometers to objectively measure PA/ST and
use these to validate self-report tools in multi-cultural populations. Moreover, the amount of
ST and daily patterns of sedentary behaviours among SAs should be explored further, as our
accelerometer data indicate a less sedentary group that might have been expected based on
published self-report data.
Acknowledgements
14
The authors thank all of the women who participated in this study, and the community group
workers who assisted with interpretation, translation and transcription of interviews.
Funding Source

15
This research was part of a self-funded PhD and had no external funding.
16
References [as I state above, you may want to cut out a few references to get the word
count down]
1. Babakus WS, Thompson JL: Physical activity among South Asian women: a
systematic, mixed-methods review. Int J Behav Nutr Phys Act 2012; 9:150-167.
2. Chaudhury, M, Esliger D. Accelerometry in adults. Health Survey for England 2008.
2009; 1:59-78.
3. Cooper AR, Sebire S, Montgomery AA, et al.: Sedentary time, breaks in sedentary
time and metabolic variables in people with newly diagnosed type 2 diabetes.
Diabetologia 2012; 55:589-99.
4. Davies, A A, Blake C, Dhana P: Social determinants and risk factors for non-
communicable diseases (NCDs) in South Asian migrant populations in Europe. Asia
Europe Journal 2011; 8:461-473.
5. Dinesh, J, Tyo B, Bassett DR: Comparison of four Actigraph accelerometers during
walking and running. Medicine & Science in Sports & Exercise 2010;42(2):368-374.
6. Eapen D, Kalra GL, Mercharnt N, Arora A, Khan BV. Metabolic syndrome and
cardiovascular disease in South Asians. Vascular Health and Risk Management 2009;
5: 731-743.
7. Ferriday, J, Muir-Cochrane E: Demonstrating rigor using thematic analysis: A hybrid
approach of inductive and deductive coding and theme development. International
Journal of Qualitative Methods 2006; 5(1):1-11.
8. Freedson, PS, Melanson, E, Sirard, J: Calibration of the Computer Science and
Applications, Inc. Medicine & Science in Sports & Exercise 1998; 30(5): 777-781.
17
9. Gemmill, E, Bayles CM, McTigue K, et al.: Factors associated with adherence to an
accelerometer protocol in older adults. Journal of Physical Activity and Health 2011;
8:1152-1159.
10. Gill, JMR, Malkova D: Physical activity, fitness and cardiovascular disease risk in
adults: interactions with insulin resistance and obesity. Clinical Science 2006;
110:409-425.
11. Higgins & Dale: Ethnic differences in physical activity and obesity. 2010 In: Ethnicity
and Integration: Understanding Population Trends and Processes: Volume 3. Edited
by Stillwell & van Ham. New York: Springer, 2009;20-31.
12. International Physical Activity Questionnaire
website[http://www.ipaq.ki.se/ipaq.htm]. (Accessed April 23, 2011).
13. Kolt GS, Schofiel GM, Rush EC, Oliver M, Chadha NK. Body fatness, physical
activity, and nutritional behaviours in Asian Indian immigrants to New Zealand. Asia
Pac J Clin Nutr. 2007;16(4):663-670.
14. Kurtze, N, Rangul, V, Hustvedt B: Reliability and validity of the international
physical activity questionnaire in the Nord-Trondelag health study(HUNT) population
of men. BMC Med Res Meth 2008; 8:63-71.
15. Landman J, Cruickshank JK. A review of ethnicity, health and nutrition-related
diseases in relation to migration in the United Kingdom. Public Health Nutrition
2001; 4: 647-657.
16. Lee PH, Macfarlane J, Lam TH, et al.: Validity of the international physical activity
questionnaire short form (IPAQ-SF): A systematic review. Int J Behav Nutr Phys Act
2011; 8:115-125.
18
17. Mathie, MJ, Coster ACF, Lovell NH, et al.: Accelerometry: providing an integrated,
practical method for long-term, ambulatory monitoring of human movement.
Physiological Measurement 2004,;25:R1–R20.
18. Project MINA Web site (Internet): http://projectmina.org/. [Accessed May 11,2013].
19. Roth, M. Self-reported physical activity in adults. Health Survey for England 2008.
2009; 1:21-43.
20. UK Department of Health. Physical activity guideline for adults (19-64 years). 2011:
1.
21. US Department of Health and Human Services
[http://www.health.gov/paguidelines/contact.aspx] (Accessed April 23, 2011).
22. Vanhelst J, Mikulovic J, Bui-Xuan G, et al.: Comparison of two ActiGraph
accelerometer generations in the assessment of physical activity in free living
conditions. BMC Research Notes 2012; 5:187-190.
23. World Health Organization. Appropriate body-mass index for Asian populations and
its implications for policy and intervention strategies. Lancet 2004; 13:157-163.
24. Williams ED, Nazroo JY, Kooner JS, Steptoe A. Subgroup differences in
psychosocial factors relating to coronary heart disease in the UK South Asian
population. Journal of Psychosomatic Research 2010; 69: 379-387.
25. Williams ED, Stamatakis E, Chandola T, Hamer M. Physical activity behaviour and
coronary heart disease mortality among South Asian people in the UK: an
observational longitudinal study. Heart 2010a; 97: 655-659.
26. Yates T, Davies MJ, Gray LJ. Levels of physical activity and relationship with
markers of diabetes and cardiovascular disease risk in 5474 white European and South
Asian adults screened for type 2 diabetes. Preventative Medicine 2010; 51: 290-294.
19
Tables
Table 1: Participant Characteristics
All
(n=123)
Subsample
(n=50) P value
Age (yrs) 46.3±15.12 40.1±10.5 p=.236
BMI kg/m2 * 27.8±5.5 28.2±5.3 p=.458
% Underweight <18.5 0.80% 0.50%
% Normal Weight 18.5-23 10.60% 14.70%
% Overweight 23.1-27.5 22.90% 22.10%
% Obese >27.5 65.70% 62.70%
% Body fat 53.9±3.9 50.6±4.1 p= .212
Waist circumference (cm) 92.4±9.3 91.9±6.3 p=.602
*BMI Categories as defined for South Asians by WHO (2004) Lancet 363:157-
163
20
Table 2: Summary Variables
All (n=140)
Sub-sample
(n=50)
P value
(Group)
P value (Accel v
IPAQ)
Accel MVPA
(min/day) 34.66±21.52 30.9±21.0 p=.169
Accel ST (min/day) 530.20±81.76 496.0±72.6 p=.251
Accel METmin/d
MVPA 113.42±74.21 105.5±51.2 p=.159
IPAQ METmin/d
MVPA
90.97±301.94
P<.001
IPAQ ST (min/day) 315.31±266.98 p<.001
21
Table 3: Major themes from brief structured interviews
Major Theme Participant Quotes
(1) Lack of Cultural Context and
Terminology “I don’t know this word very well, vigorous. I work hard to make my home. Is this the same?”
* 59 year old Bangladeshi woman
"Vigorous is not easy to understand for me. I need explanation and examples."
* 62 year old Pakistani woman
(2) Inability to equate own PA with
IPAQ-SF examples “ During the questions I don’t understand, you see, what is this moderate level.
I do carry loads like washing but I never do tennis or bicycle. So I don’t do any of this
moderate [physical activity]?”
* 47 year old Pakistani woman
"Is it [moderate physical activity] when I sweat a lot or only just like walking?"
* 32 year old Bangladeshi woman
(3) Inability to recall sitting time “ I don’t think I do sit much. I get up and pray, make the breakfast, and food for the day.
I think I sit sometimes but for how long I don’t know this.”
* 64 year old Pakistani woman
"I don't really keep time of how much sitting. I sit after cooking and taking tea but for how long
I don't know."
* 53 year old Bangladeshi woman
(4) Limited general knowledge of
real-life examples of PA intensity “I do my prayer during the day and this is, I think is moderate [physical activity].
It is enough.”
* 72 year old Pakistani woman
"I do walking sometimes so this is vigorous, isn't it? I'm not sure."

22
* 35 year old Bangladeshi woman
23
Figures
Figure 1: Bland-Altman plot of differences between accelerometer and IPAQ-SF derived MVPA
(MVPAdiff= difference between accelerometer and IPAQ-SF scores; MVPAmean= mean of accelerometer and IPAQ-SF scores)
Figure 2: Bland-Altman plot of differences between accelerometer and IPAQ-SF derived sedentary time
(STdiff= difference between accelerometer and IPAQ-SF scores; ST mean= mean of accelerometer and IPAQ-SF scores)