Embed Size (px)
Citation preview
Comparative Advantage: Trading Pizzas and Brownies
Lesson Author Curt Anderson, Ph.D., Professor Emeritus, University of Minnesota-Duluth
Scott Wolla, Ph.D., Federal Reserve Bank of St. Louis
Standards and Benchmarks (see page 20)
Lesson DescriptionIn this lesson, students play the role of producers in two fictional countries, Acca and Dur. Stu-dents use production cards to construct production possibilities tables and graphs. These tables and graphs are used to discuss productivity, opportunity costs, and comparative advantage. Producers in each country discover that if they specialize and trade, they are able to produce and consume more goods than they would have been able to produce and consume on their own.
Grade LevelHigh School or College
ConceptsAbsolute advantage
Comparative advantage
Opportunity cost
Production possibilities graph
Production possibilities table
Productivity
Specialization
Trade
ObjectivesStudents will be able to
• define productivity and comparative advantage;
• distinguish between absolute and comparative advantage;
• determine which country has a comparative advantage in producing certain goods;
©2020, Minnesota Council on Economic Education. Developed in partnership with the Federal Reserve Bank of St. Louis. Permission is granted to reprint or photocopy this lesson in its entirety for educational purposes, provided the user credits the Minnesota Council on Economic Education.
1
Comparative Advantage: Trading Pizzas and Brownies
• explain the gains from specialization;
• explain how specialization increases production possibilities; and
• explain how trade increases consumption possibilities.
Compelling QuestionHow do specialization and trade increase both production and consumption of goods?
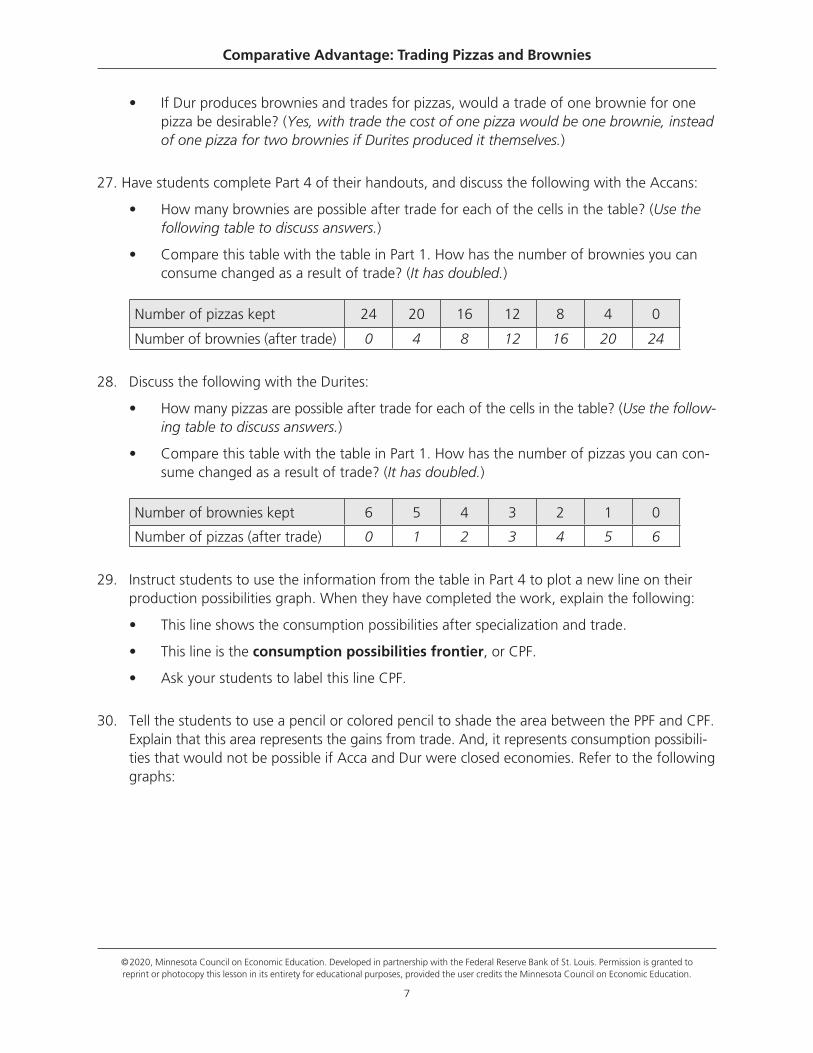
Time Required50 minutes
Materials• PowerPoint slides
• Handouts 1 and 3, one copy for each student in half of the class
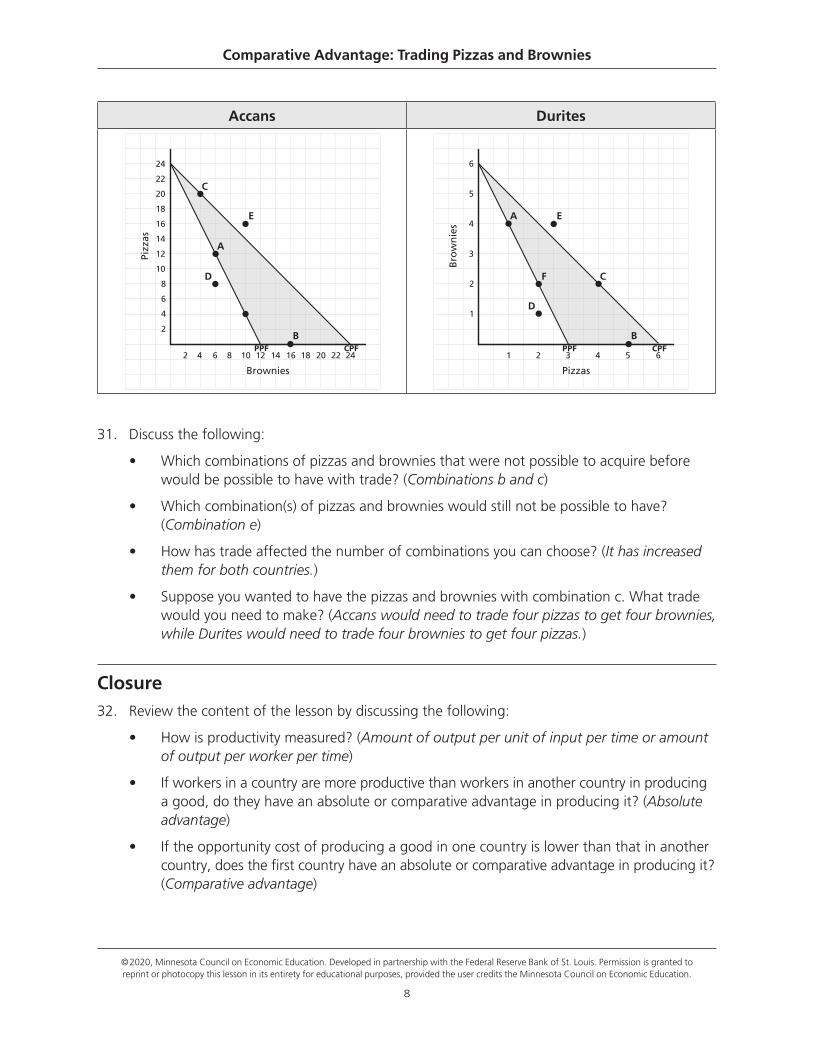
• Handouts 2 and 4, one copy for each student in the other half of the class
• Handout 5, one copy for each student in the class
• Handout 5 Answer Key, one copy for the teacher
• Staplers, tape, or glue
• Scissors
Procedure1. Begin the lesson by discussing the following:
• Why do people in one country trade with people in other countries? (Answers will vary.)
• How productive do you think U.S. workers are? (Most will answer that U.S. workers are among the most productive in the world.)
• If U.S. workers are so productive, why do we trade with other countries? Shouldn’t we produce everything for ourselves? (Answers will vary.)
2. Tell the students that they are going to play the role of workers in two different fictional countries to investigate the relationship between productivity and trade and to understand the benefits of trade.
3. Divide the class into two groups. Have one half of the class move their desks to one side of the room and the other half move their desks to the other side.
©2020, Minnesota Council on Economic Education. Developed in partnership with the Federal Reserve Bank of St. Louis. Permission is granted to reprint or photocopy this lesson in its entirety for educational purposes, provided the user credits the Minnesota Council on Economic Education.
2
Comparative Advantage: Trading Pizzas and Brownies
4. Tell the students that they represent the people of two great countries, Acca and Dur (assign a country to each half of the class). Share the story of Acca and Dur using Slides 2-5.
5. Distribute a copy of Handout 1: Accan Production Cards to each Accan and a copy of Handout 2: Durite Production Cards to each Durite. Have students cut out and make their production cards as described in the instructions on each handout.
6. Distribute a copy of Handout 3: Accan Worksheet to each Accan and a copy of Handout 4: Durite Worksheet to each Durite. Have students complete Part 1 on their handouts and then discuss the following with the Accans:
• What is the total number of pizzas you could produce in six hours? (24)
• If you produced this many pizzas, how many brownies could you produce? (0)
7. Discuss the following with the Durites:
• What is the total number of brownies you could produce in six hours? (6)
• If you produced this many brownies, how many pizzas could you produce? (0)
8. Discuss the following with both the Accans and Durites:
• How does the number of brownies you can produce change as you produce more pizzas? (It decreases.)
• How does the number of pizzas you can produce change as you produce more brownies? (It decreases.)
• Why does this happen? (It takes time to produce each good. Since time is limited, spend-ing more time producing one good means spending less time to produce the other good.)
9. Discuss the following with the Accans:
• As you turned over your production cards to the brownie side one at a time, what com-binations of pizza and brownies were you able to produce? (Use the table below to discuss and check answers.)
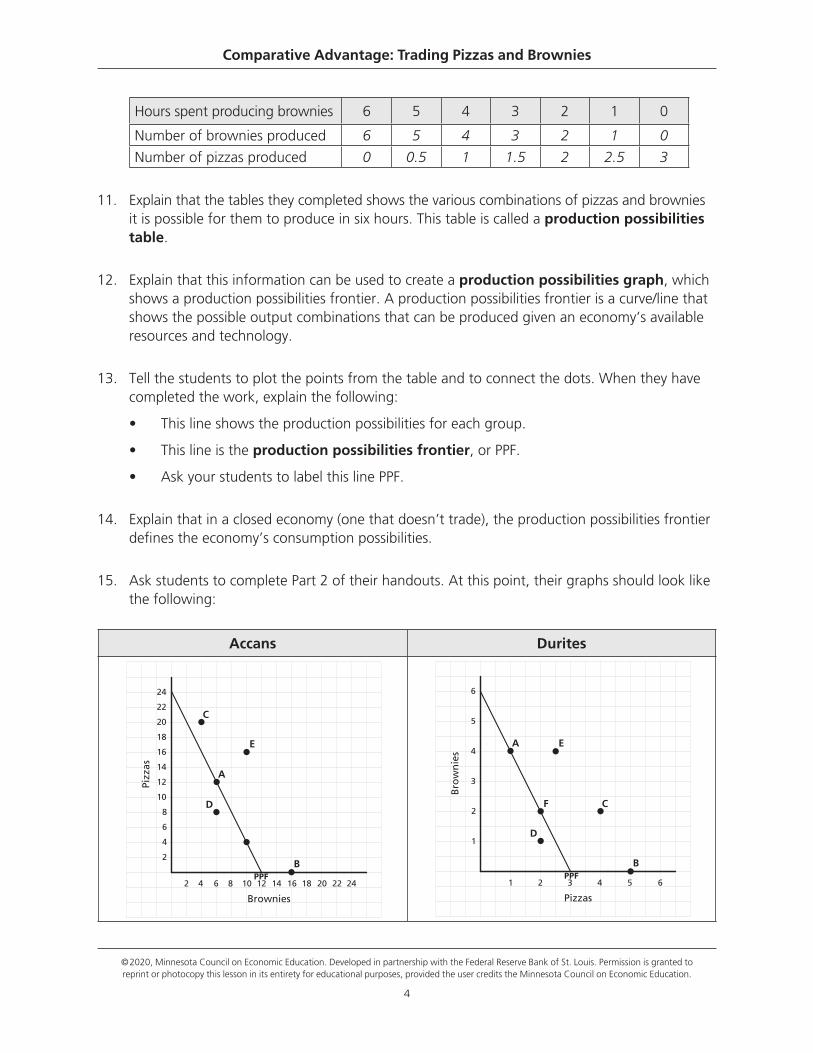
Hours spent producing pizzas 6 5 4 3 2 1 0
Number of pizzas produced 24 20 16 12 8 4 0
Number of brownies produced 0 2 4 6 8 10 12
10. Discuss the following with the Durites:
• As you turned over your production cards to the pizza side one at a time, what combina-tions of brownies and pizza were you able to produce? (Use the table below to discuss and check answers.)
©2020, Minnesota Council on Economic Education. Developed in partnership with the Federal Reserve Bank of St. Louis. Permission is granted to reprint or photocopy this lesson in its entirety for educational purposes, provided the user credits the Minnesota Council on Economic Education.
3
Comparative Advantage: Trading Pizzas and Brownies
Hours spent producing brownies 6 5 4 3 2 1 0
Number of brownies produced 6 5 4 3 2 1 0
Number of pizzas produced 0 0.5 1 1.5 2 2.5 3
11. Explain that the tables they completed shows the various combinations of pizzas and brownies it is possible for them to produce in six hours. This table is called a production possibilities table.
12. Explain that this information can be used to create a production possibilities graph, which shows a production possibilities frontier. A production possibilities frontier is a curve/line that shows the possible output combinations that can be produced given an economy’s available resources and technology.
13. Tell the students to plot the points from the table and to connect the dots. When they have completed the work, explain the following:
• This line shows the production possibilities for each group.
• This line is the production possibilities frontier, or PPF.
• Ask your students to label this line PPF.
14. Explain that in a closed economy (one that doesn’t trade), the production possibilities frontier defines the economy’s consumption possibilities.
15. Ask students to complete Part 2 of their handouts. At this point, their graphs should look like the following:
Accans Durites
2 4 6 8 10 12 14 16 18 20 22 24
2
4
6
8
10
12
14
16
18
20
22
24
Pizz
as
Brownies
A
B
C
D
E
PPF1 2 3 4 5 6
1
2
3
4
5
6
Bro
wn
ies
Pizzas
A
B
C
D
E
F
PPF
©2020, Minnesota Council on Economic Education. Developed in partnership with the Federal Reserve Bank of St. Louis. Permission is granted to reprint or photocopy this lesson in its entirety for educational purposes, provided the user credits the Minnesota Council on Economic Education.
4
16. After students have completed Part 2, discuss the following:
• Which combinations of pizzas and brownies are possible for you to produce in the time allowed? (Combinations a, d, and f are possible for both. NOTE: While the answers are the same on both versions of the worksheet, the combinations listed on the two versions are not the same.)
• Which combinations of pizzas and brownies are not possible for you to produce in the time allowed? (Combinations b, c, and e are not possible for either. NOTE: While the answers are the same on both versions of the worksheet, the combinations listed on the two versions are not the same.)
• What would make it possible to produce the combinations of pizzas and brownies that are not possible to produce? (If more time were allowed; if the workers were more pro-ductive—that is, if they were able to produce more pizzas and brownies per hour)
• Is it possible for either group to consume at combination b, c, or e? (No, they can only consume what they produce.)
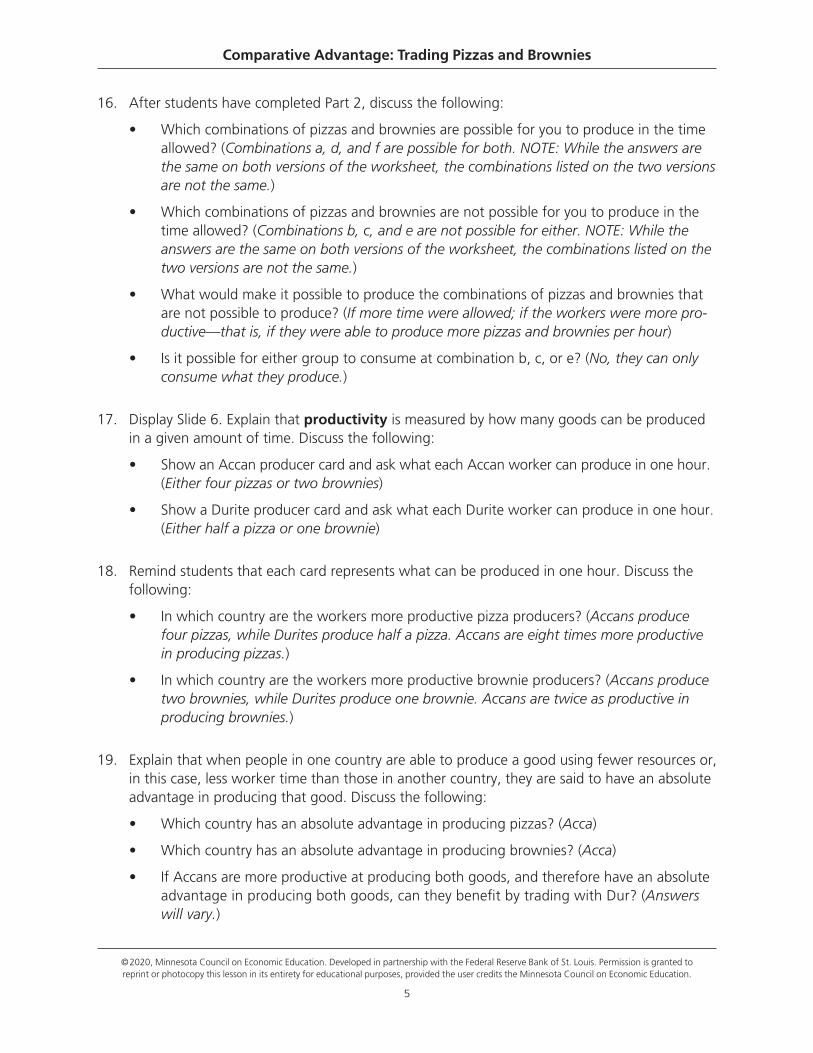
17. Display Slide 6. Explain that productivity is measured by how many goods can be produced in a given amount of time. Discuss the following:
• Show an Accan producer card and ask what each Accan worker can produce in one hour. (Either four pizzas or two brownies)
• Show a Durite producer card and ask what each Durite worker can produce in one hour. (Either half a pizza or one brownie)
18. Remind students that each card represents what can be produced in one hour. Discuss the following:
• In which country are the workers more productive pizza producers? (Accans produce four pizzas, while Durites produce half a pizza. Accans are eight times more productive in producing pizzas.)
• In which country are the workers more productive brownie producers? (Accans produce two brownies, while Durites produce one brownie. Accans are twice as productive in producing brownies.)
19. Explain that when people in one country are able to produce a good using fewer resources or, in this case, less worker time than those in another country, they are said to have an absolute advantage in producing that good. Discuss the following:
• Which country has an absolute advantage in producing pizzas? (Acca)
• Which country has an absolute advantage in producing brownies? (Acca)
• If Accans are more productive at producing both goods, and therefore have an absolute advantage in producing both goods, can they benefit by trading with Dur? (Answers will vary.)
Comparative Advantage: Trading Pizzas and Brownies
©2020, Minnesota Council on Economic Education. Developed in partnership with the Federal Reserve Bank of St. Louis. Permission is granted to reprint or photocopy this lesson in its entirety for educational purposes, provided the user credits the Minnesota Council on Economic Education.
5
Comparative Advantage: Trading Pizzas and Brownies
20. Have students complete Part 3 of their handouts, and then ask them what the opportunity cost of doing something is. (The highest-valued alternative that must be given up to do it)
21. Display Slide 7, which shows opportunity costs. Ask the students to consider the opportunity cost of producing pizza in each country. Discuss the following:
• For the Accans, what is the opportunity cost of producing one pizza? (Half a brownie)
• For the Durites, what is the opportunity cost of producing one pizza? (Two brownies)
22. Let’s consider the opportunity cost of producing brownies in each country. Discuss the following:
• For the Accans, what is the opportunity cost of producing one brownie? (Two pizzas)
• For the Durites, what is the opportunity cost of producing one brownie? (Half a pizza)
23. Display Slide 8. Explain that when the opportunity cost of producing a good is lower in one country than it is in another, the people in the first country—the country with the lower oppor-tunity cost—are said to have a comparative advantage in producing that good. Discuss the following:
• In which country is the opportunity cost of producing pizzas lower? (Acca)
• Which country has the comparative advantage in producing pizzas? (Acca)
• In which country is the opportunity cost of producing brownies lower? (Dur)
• Which country has the comparative advantage in producing brownies? (Dur)
24. Explain that when people have a comparative advantage in producing a good, they can end up with more total goods by producing that good and trading some of it for goods that other people have a comparative advantage in producing. Concentrating on producing one (or a few) goods is called specialization. Discuss the following:
• Which country should specialize in producing pizzas? Why? (Acca, because it has a lower opportunity cost)
• Which country should specialize in producing brownies? Why? (Dur, because it has a lower opportunity cost)
25. Tell the Accans to turn their production cards to the pizza side and tell the Durites to turn their production cards to the brownie side to support this specialization.
26. Refer students to Slide 9 and discuss the following:
• If Acca produces pizzas and trades for brownies, would a trade of one pizza for one brownie be desirable? (Yes, with trade the cost of a brownie would be one pizza, instead of one brownie for two pizzas if Accans produced it themselves.)
©2020, Minnesota Council on Economic Education. Developed in partnership with the Federal Reserve Bank of St. Louis. Permission is granted to reprint or photocopy this lesson in its entirety for educational purposes, provided the user credits the Minnesota Council on Economic Education.
6
Comparative Advantage: Trading Pizzas and Brownies
• If Dur produces brownies and trades for pizzas, would a trade of one brownie for one pizza be desirable? (Yes, with trade the cost of one pizza would be one brownie, instead of one pizza for two brownies if Durites produced it themselves.)
27. Have students complete Part 4 of their handouts, and discuss the following with the Accans:
• How many brownies are possible after trade for each of the cells in the table? (Use the following table to discuss answers.)
• Compare this table with the table in Part 1. How has the number of brownies you can consume changed as a result of trade? (It has doubled.)
Number of pizzas kept 24 20 16 12 8 4 0
Number of brownies (after trade) 0 4 8 12 16 20 24
28. Discuss the following with the Durites:
• How many pizzas are possible after trade for each of the cells in the table? (Use the follow-ing table to discuss answers.)
• Compare this table with the table in Part 1. How has the number of pizzas you can con-sume changed as a result of trade? (It has doubled.)
Number of brownies kept 6 5 4 3 2 1 0
Number of pizzas (after trade) 0 1 2 3 4 5 6
29. Instruct students to use the information from the table in Part 4 to plot a new line on their production possibilities graph. When they have completed the work, explain the following:
• This line shows the consumption possibilities after specialization and trade.
• This line is the consumption possibilities frontier, or CPF.
• Ask your students to label this line CPF.
30. Tell the students to use a pencil or colored pencil to shade the area between the PPF and CPF. Explain that this area represents the gains from trade. And, it represents consumption possibili-ties that would not be possible if Acca and Dur were closed economies. Refer to the following graphs:
©2020, Minnesota Council on Economic Education. Developed in partnership with the Federal Reserve Bank of St. Louis. Permission is granted to reprint or photocopy this lesson in its entirety for educational purposes, provided the user credits the Minnesota Council on Economic Education.
7
Comparative Advantage: Trading Pizzas and Brownies
31. Discuss the following:
• Which combinations of pizzas and brownies that were not possible to acquire before would be possible to have with trade? (Combinations b and c)
• Which combination(s) of pizzas and brownies would still not be possible to have? (Combination e)
• How has trade affected the number of combinations you can choose? (It has increased them for both countries.)
• Suppose you wanted to have the pizzas and brownies with combination c. What trade would you need to make? (Accans would need to trade four pizzas to get four brownies, while Durites would need to trade four brownies to get four pizzas.)
Closure32. Review the content of the lesson by discussing the following:
• How is productivity measured? (Amount of output per unit of input per time or amount of output per worker per time)
• If workers in a country are more productive than workers in another country in producing a good, do they have an absolute or comparative advantage in producing it? (Absolute advantage)
• If the opportunity cost of producing a good in one country is lower than that in another country, does the first country have an absolute or comparative advantage in producing it? (Comparative advantage)
Accans Durites
2 4 6 8 10 12 14 16 18 20 22 24
2
4
6
8
10
12
14
16
18
20
22
24
Pizz
as
Brownies
A
B
C
D
E
PPF CPF1 2 3 4 5 6
1
2
3
4
5
6
Bro
wn
ies
Pizzas
A
B
C
D
E
F
PPF CPF
©2020, Minnesota Council on Economic Education. Developed in partnership with the Federal Reserve Bank of St. Louis. Permission is granted to reprint or photocopy this lesson in its entirety for educational purposes, provided the user credits the Minnesota Council on Economic Education.
8
Comparative Advantage: Trading Pizzas and Brownies
• Which goods should people and countries specialize in producing to trade for other goods? (Those they have a comparative advantage in producing)
• What are the gains from specialization? (Increased production of goods)
• What are the gains from trade? (Increased consumption of goods)
• How is it possible for a country’s consumption possibilities to exceed its production possi-bilities? (Specialization and trade)
Assessment33. Distribute a copy of Handout 5: Assessment to each student. Allow time for students to work,
then review their answers using Handout 5: Assessment—Answer Key.
©2020, Minnesota Council on Economic Education. Developed in partnership with the Federal Reserve Bank of St. Louis. Permission is granted to reprint or photocopy this lesson in its entirety for educational purposes, provided the user credits the Minnesota Council on Economic Education.
9
Comparative Advantage: Trading Pizzas and Brownies
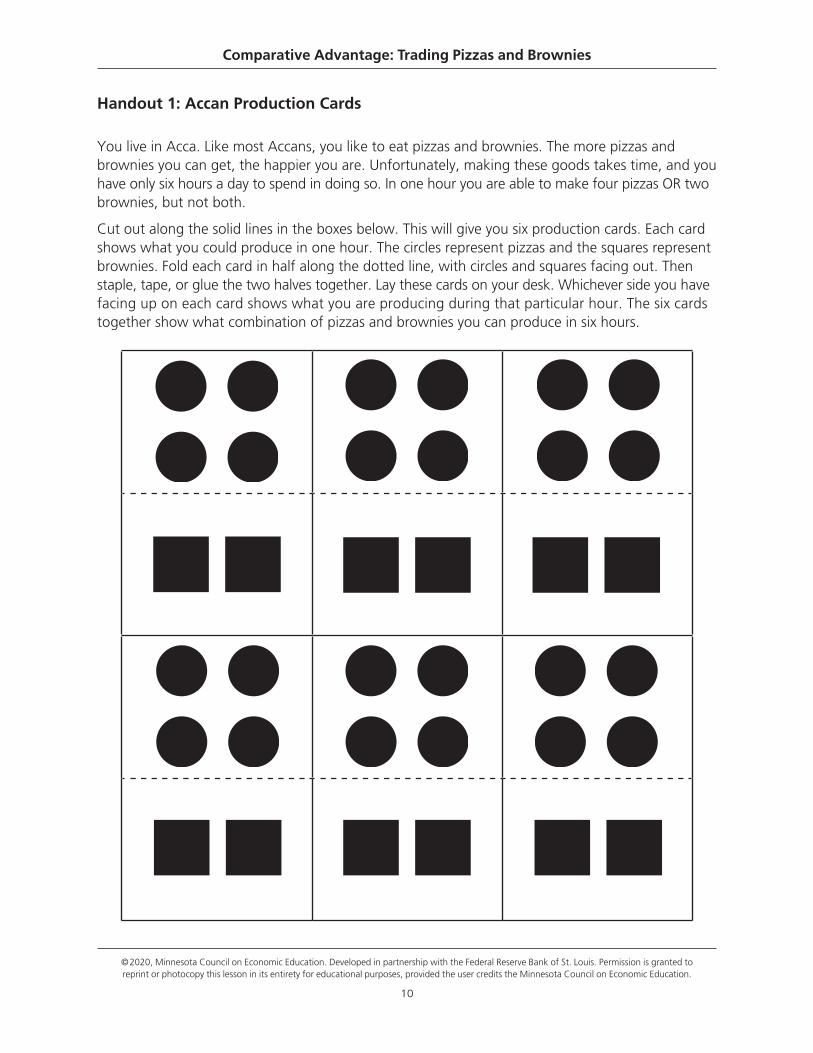
Handout 1: Accan Production Cards
You live in Acca. Like most Accans, you like to eat pizzas and brownies. The more pizzas and brownies you can get, the happier you are. Unfortunately, making these goods takes time, and you have only six hours a day to spend in doing so. In one hour you are able to make four pizzas OR two brownies, but not both.
Cut out along the solid lines in the boxes below. This will give you six production cards. Each card shows what you could produce in one hour. The circles represent pizzas and the squares represent brownies. Fold each card in half along the dotted line, with circles and squares facing out. Then staple, tape, or glue the two halves together. Lay these cards on your desk. Whichever side you have facing up on each card shows what you are producing during that particular hour. The six cards together show what combination of pizzas and brownies you can produce in six hours.
©2020, Minnesota Council on Economic Education. Developed in partnership with the Federal Reserve Bank of St. Louis. Permission is granted to reprint or photocopy this lesson in its entirety for educational purposes, provided the user credits the Minnesota Council on Economic Education.
10
Comparative Advantage: Trading Pizzas and Brownies
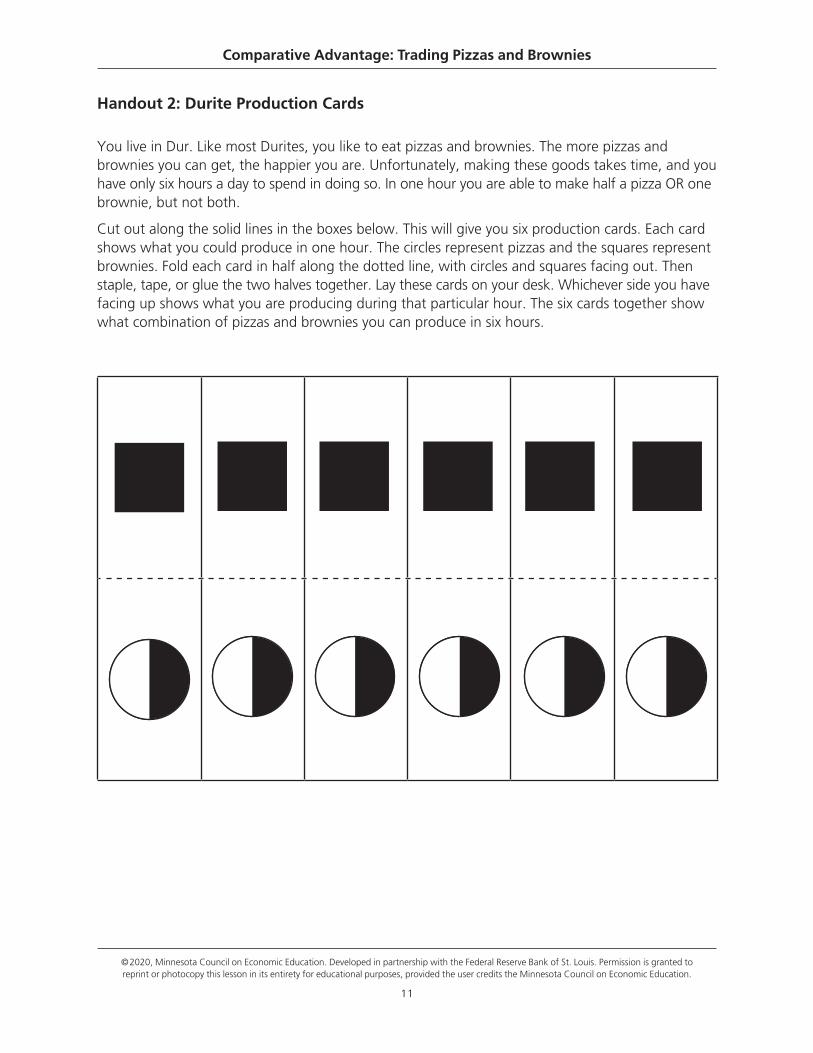
Handout 2: Durite Production Cards
You live in Dur. Like most Durites, you like to eat pizzas and brownies. The more pizzas and brownies you can get, the happier you are. Unfortunately, making these goods takes time, and you have only six hours a day to spend in doing so. In one hour you are able to make half a pizza OR one brownie, but not both.
Cut out along the solid lines in the boxes below. This will give you six production cards. Each card shows what you could produce in one hour. The circles represent pizzas and the squares represent brownies. Fold each card in half along the dotted line, with circles and squares facing out. Then staple, tape, or glue the two halves together. Lay these cards on your desk. Whichever side you have facing up shows what you are producing during that particular hour. The six cards together show what combination of pizzas and brownies you can produce in six hours.
©2020, Minnesota Council on Economic Education. Developed in partnership with the Federal Reserve Bank of St. Louis. Permission is granted to reprint or photocopy this lesson in its entirety for educational purposes, provided the user credits the Minnesota Council on Economic Education.
11
Comparative Advantage: Trading Pizzas and Brownies
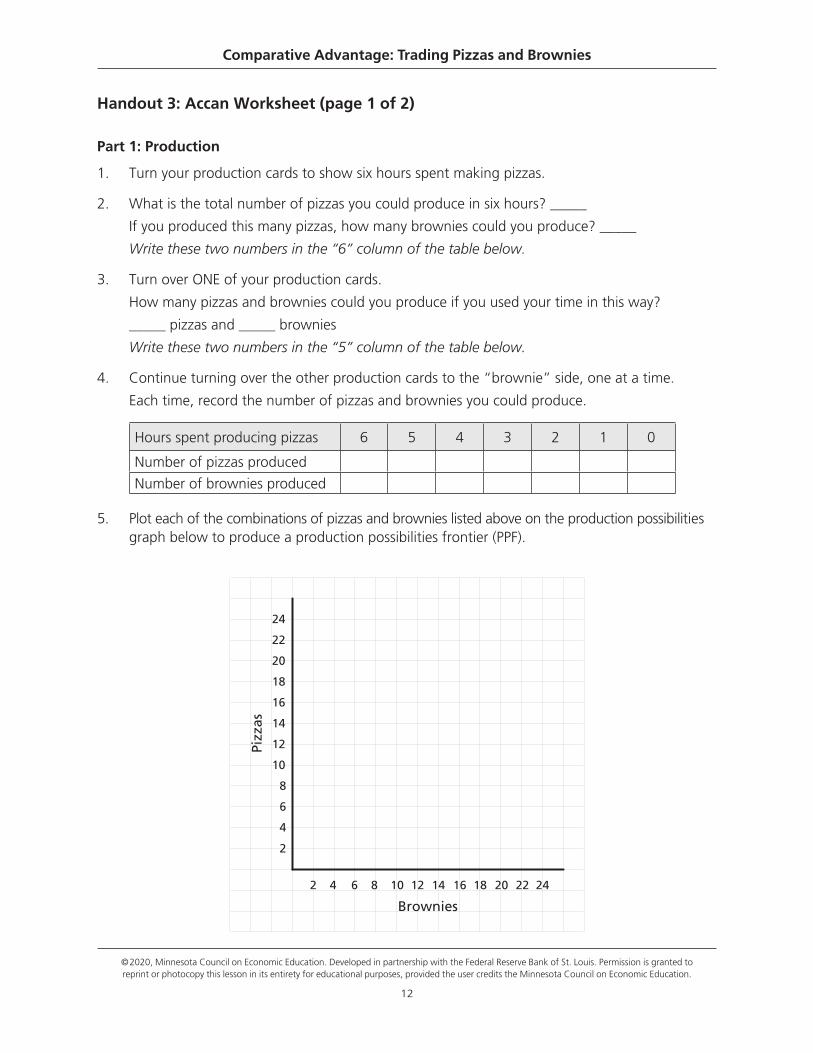
Handout 3: Accan Worksheet (page 1 of 2)
Part 1: Production
1. Turn your production cards to show six hours spent making pizzas.
2. What is the total number of pizzas you could produce in six hours? _____
If you produced this many pizzas, how many brownies could you produce? _____
Write these two numbers in the “6” column of the table below.
3. Turn over ONE of your production cards.
How many pizzas and brownies could you produce if you used your time in this way?
_____ pizzas and _____ brownies
Write these two numbers in the “5” column of the table below.
4. Continue turning over the other production cards to the “brownie” side, one at a time.
Each time, record the number of pizzas and brownies you could produce.
Hours spent producing pizzas 6 5 4 3 2 1 0
Number of pizzas produced
Number of brownies produced
5. Plot each of the combinations of pizzas and brownies listed above on the production possibilities graph below to produce a production possibilities frontier (PPF).
©2020, Minnesota Council on Economic Education. Developed in partnership with the Federal Reserve Bank of St. Louis. Permission is granted to reprint or photocopy this lesson in its entirety for educational purposes, provided the user credits the Minnesota Council on Economic Education.
12
2 4 6 8 10 12 14 16 18 20 22 24
2
4
6
8
10
12
14
16
18
20
22
24
Pizz
as
Brownies
Comparative Advantage: Trading Pizzas and Brownies
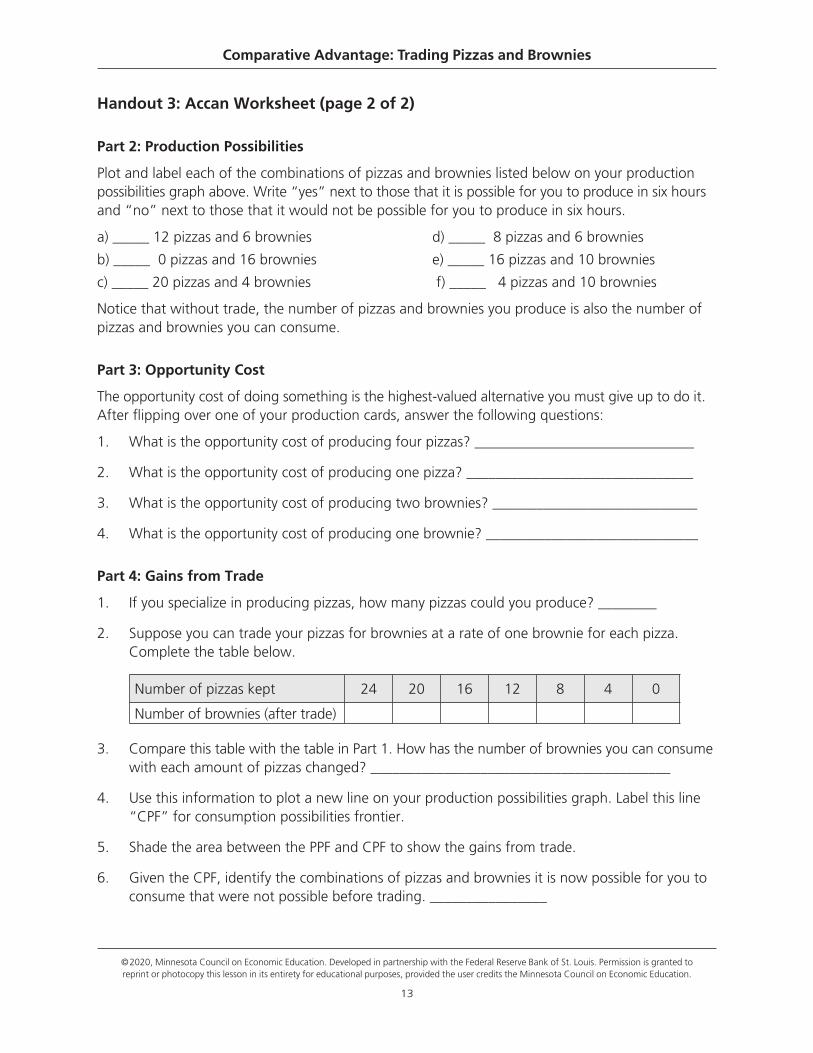
Handout 3: Accan Worksheet (page 2 of 2)
Part 2: Production Possibilities
Plot and label each of the combinations of pizzas and brownies listed below on your production possibilities graph above. Write “yes” next to those that it is possible for you to produce in six hours and “no” next to those that it would not be possible for you to produce in six hours.
a) _____ 12 pizzas and 6 brownies d) _____ 8 pizzas and 6 brownies
b) _____ 0 pizzas and 16 brownies e) _____ 16 pizzas and 10 brownies
c) _____ 20 pizzas and 4 brownies f) _____ 4 pizzas and 10 brownies
Notice that without trade, the number of pizzas and brownies you produce is also the number of pizzas and brownies you can consume.
Part 3: Opportunity Cost
The opportunity cost of doing something is the highest-valued alternative you must give up to do it. After flipping over one of your production cards, answer the following questions:
1. What is the opportunity cost of producing four pizzas? ______________________________
2. What is the opportunity cost of producing one pizza? _______________________________
3. What is the opportunity cost of producing two brownies? ____________________________
4. What is the opportunity cost of producing one brownie? _____________________________
Part 4: Gains from Trade
1. If you specialize in producing pizzas, how many pizzas could you produce? ________
2. Suppose you can trade your pizzas for brownies at a rate of one brownie for each pizza. Complete the table below.
Number of pizzas kept 24 20 16 12 8 4 0
Number of brownies (after trade)
3. Compare this table with the table in Part 1. How has the number of brownies you can consume with each amount of pizzas changed? _________________________________________
4. Use this information to plot a new line on your production possibilities graph. Label this line “CPF” for consumption possibilities frontier.
5. Shade the area between the PPF and CPF to show the gains from trade.
6. Given the CPF, identify the combinations of pizzas and brownies it is now possible for you to consume that were not possible before trading. ________________
©2020, Minnesota Council on Economic Education. Developed in partnership with the Federal Reserve Bank of St. Louis. Permission is granted to reprint or photocopy this lesson in its entirety for educational purposes, provided the user credits the Minnesota Council on Economic Education.
13
Comparative Advantage: Trading Pizzas and Brownies
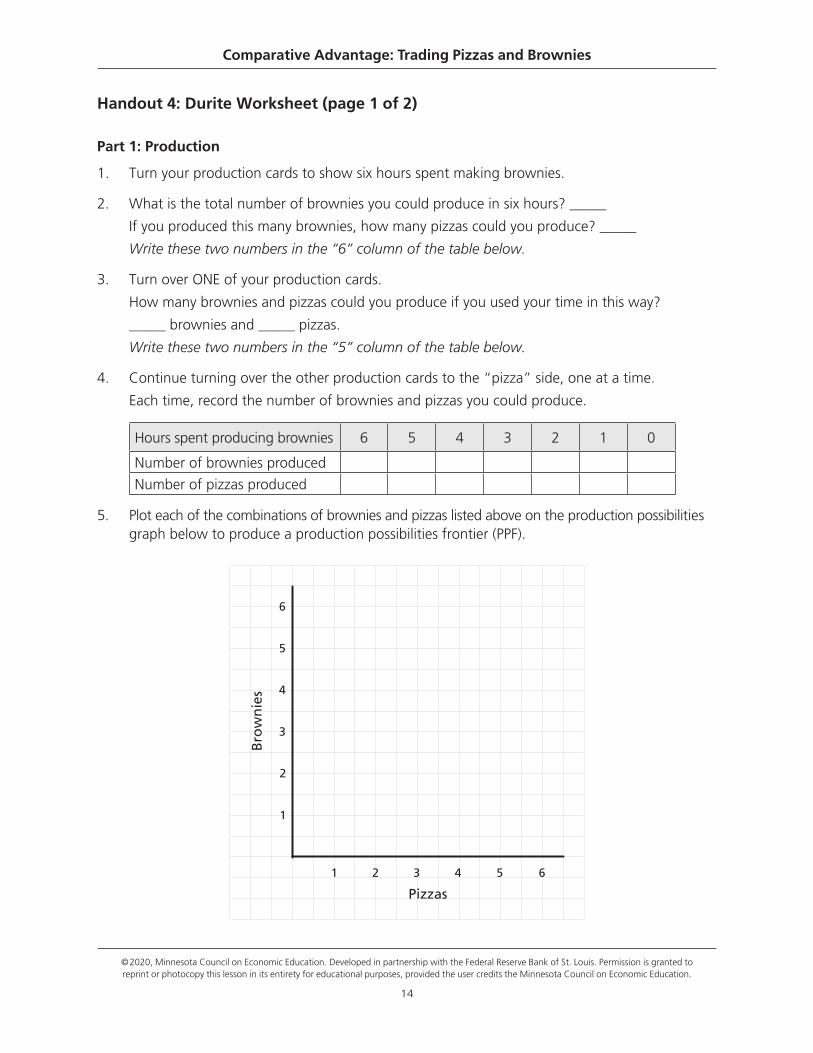
Handout 4: Durite Worksheet (page 1 of 2)
Part 1: Production
1. Turn your production cards to show six hours spent making brownies.
2. What is the total number of brownies you could produce in six hours? _____
If you produced this many brownies, how many pizzas could you produce? _____
Write these two numbers in the “6” column of the table below.
3. Turn over ONE of your production cards.
How many brownies and pizzas could you produce if you used your time in this way?
_____ brownies and _____ pizzas.
Write these two numbers in the “5” column of the table below.
4. Continue turning over the other production cards to the “pizza” side, one at a time.
Each time, record the number of brownies and pizzas you could produce.
Hours spent producing brownies 6 5 4 3 2 1 0
Number of brownies produced
Number of pizzas produced
5. Plot each of the combinations of brownies and pizzas listed above on the production possibilities graph below to produce a production possibilities frontier (PPF).
©2020, Minnesota Council on Economic Education. Developed in partnership with the Federal Reserve Bank of St. Louis. Permission is granted to reprint or photocopy this lesson in its entirety for educational purposes, provided the user credits the Minnesota Council on Economic Education.
14
1 2 3 4 5 6
1
2
3
4
5
6
Bro
wn
ies
Pizzas
Comparative Advantage: Trading Pizzas and Brownies
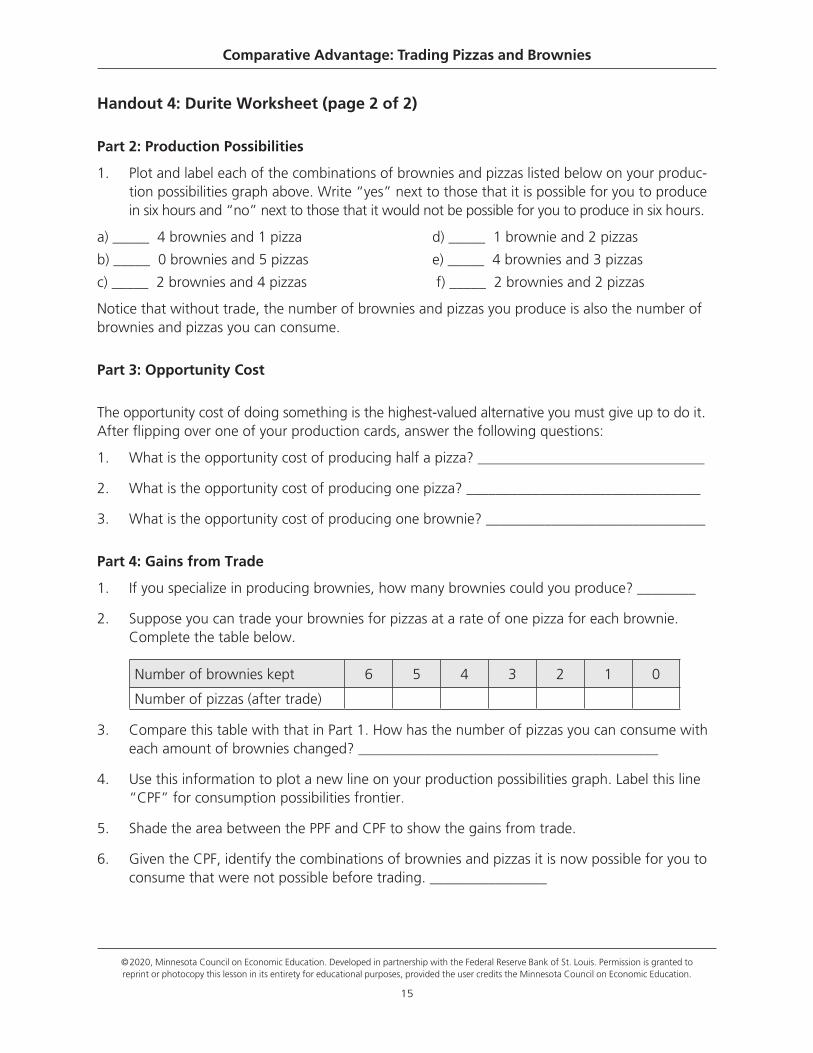
Handout 4: Durite Worksheet (page 2 of 2)
Part 2: Production Possibilities
1. Plot and label each of the combinations of brownies and pizzas listed below on your produc-tion possibilities graph above. Write “yes” next to those that it is possible for you to produce in six hours and “no” next to those that it would not be possible for you to produce in six hours.
a) _____ 4 brownies and 1 pizza d) _____ 1 brownie and 2 pizzas
b) _____ 0 brownies and 5 pizzas e) _____ 4 brownies and 3 pizzas
c) _____ 2 brownies and 4 pizzas f) _____ 2 brownies and 2 pizzas
Notice that without trade, the number of brownies and pizzas you produce is also the number of brownies and pizzas you can consume.
Part 3: Opportunity Cost
The opportunity cost of doing something is the highest-valued alternative you must give up to do it. After flipping over one of your production cards, answer the following questions:
1. What is the opportunity cost of producing half a pizza? _______________________________
2. What is the opportunity cost of producing one pizza? ________________________________
3. What is the opportunity cost of producing one brownie? ______________________________
Part 4: Gains from Trade
1. If you specialize in producing brownies, how many brownies could you produce? ________
2. Suppose you can trade your brownies for pizzas at a rate of one pizza for each brownie. Complete the table below.
Number of brownies kept 6 5 4 3 2 1 0
Number of pizzas (after trade)
3. Compare this table with that in Part 1. How has the number of pizzas you can consume with each amount of brownies changed? _________________________________________
4. Use this information to plot a new line on your production possibilities graph. Label this line “CPF” for consumption possibilities frontier.
5. Shade the area between the PPF and CPF to show the gains from trade.
6. Given the CPF, identify the combinations of brownies and pizzas it is now possible for you to consume that were not possible before trading. ________________
©2020, Minnesota Council on Economic Education. Developed in partnership with the Federal Reserve Bank of St. Louis. Permission is granted to reprint or photocopy this lesson in its entirety for educational purposes, provided the user credits the Minnesota Council on Economic Education.
15
Comparative Advantage: Trading Pizzas and Brownies
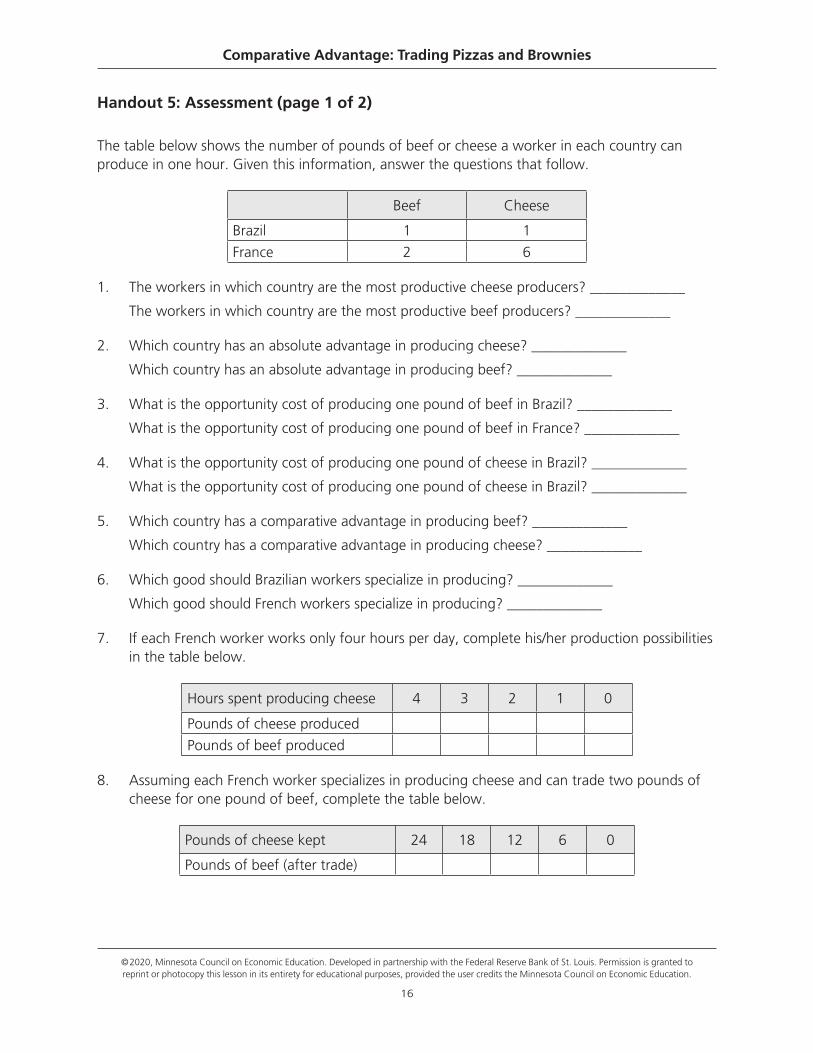
Handout 5: Assessment (page 1 of 2)
The table below shows the number of pounds of beef or cheese a worker in each country can produce in one hour. Given this information, answer the questions that follow.
Beef Cheese
Brazil 1 1
France 2 6
1. The workers in which country are the most productive cheese producers? _____________
The workers in which country are the most productive beef producers? _____________
2. Which country has an absolute advantage in producing cheese? _____________
Which country has an absolute advantage in producing beef? _____________
3. What is the opportunity cost of producing one pound of beef in Brazil? _____________
What is the opportunity cost of producing one pound of beef in France? _____________
4. What is the opportunity cost of producing one pound of cheese in Brazil? _____________
What is the opportunity cost of producing one pound of cheese in Brazil? _____________
5. Which country has a comparative advantage in producing beef? _____________
Which country has a comparative advantage in producing cheese? _____________
6. Which good should Brazilian workers specialize in producing? _____________
Which good should French workers specialize in producing? _____________
7. If each French worker works only four hours per day, complete his/her production possibilities in the table below.
Hours spent producing cheese 4 3 2 1 0
Pounds of cheese produced
Pounds of beef produced
8. Assuming each French worker specializes in producing cheese and can trade two pounds of cheese for one pound of beef, complete the table below.
Pounds of cheese kept 24 18 12 6 0
Pounds of beef (after trade)
©2020, Minnesota Council on Economic Education. Developed in partnership with the Federal Reserve Bank of St. Louis. Permission is granted to reprint or photocopy this lesson in its entirety for educational purposes, provided the user credits the Minnesota Council on Economic Education.
16
Comparative Advantage: Trading Pizzas and Brownies
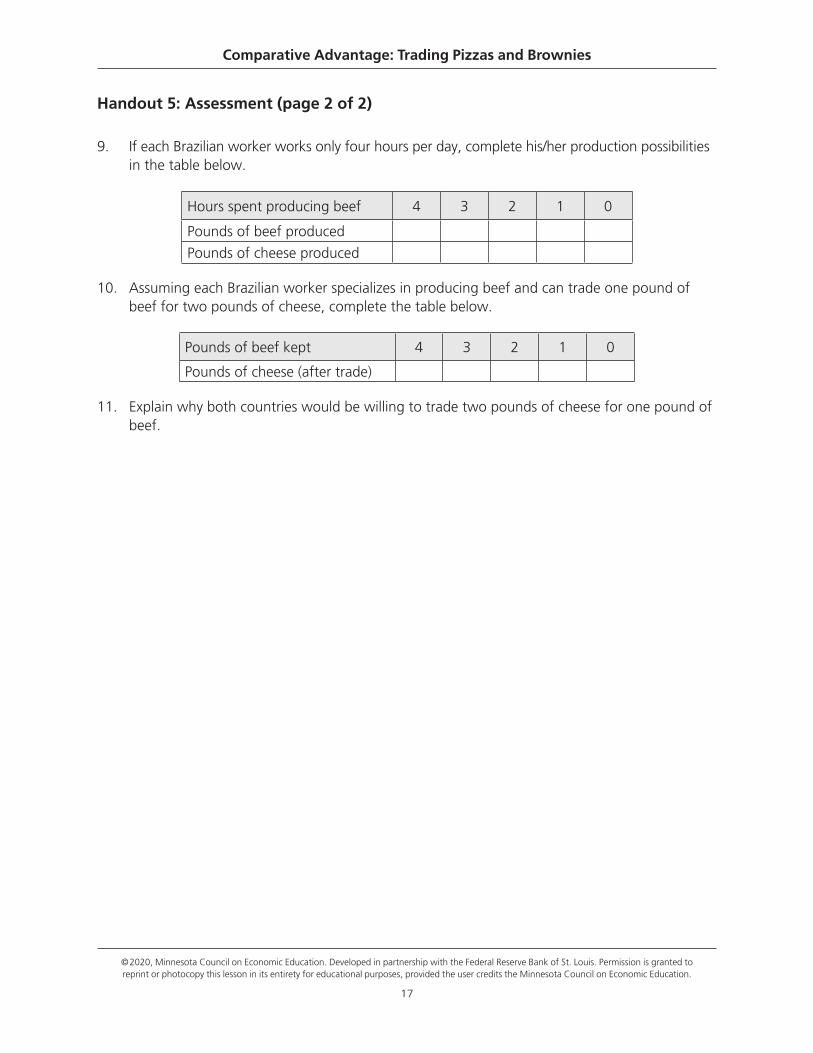
Handout 5: Assessment (page 2 of 2)
9. If each Brazilian worker works only four hours per day, complete his/her production possibilities in the table below.
Hours spent producing beef 4 3 2 1 0
Pounds of beef produced
Pounds of cheese produced
10. Assuming each Brazilian worker specializes in producing beef and can trade one pound of beef for two pounds of cheese, complete the table below.
Pounds of beef kept 4 3 2 1 0
Pounds of cheese (after trade)
11. Explain why both countries would be willing to trade two pounds of cheese for one pound of beef.
©2020, Minnesota Council on Economic Education. Developed in partnership with the Federal Reserve Bank of St. Louis. Permission is granted to reprint or photocopy this lesson in its entirety for educational purposes, provided the user credits the Minnesota Council on Economic Education.
17
Comparative Advantage: Trading Pizzas and Brownies
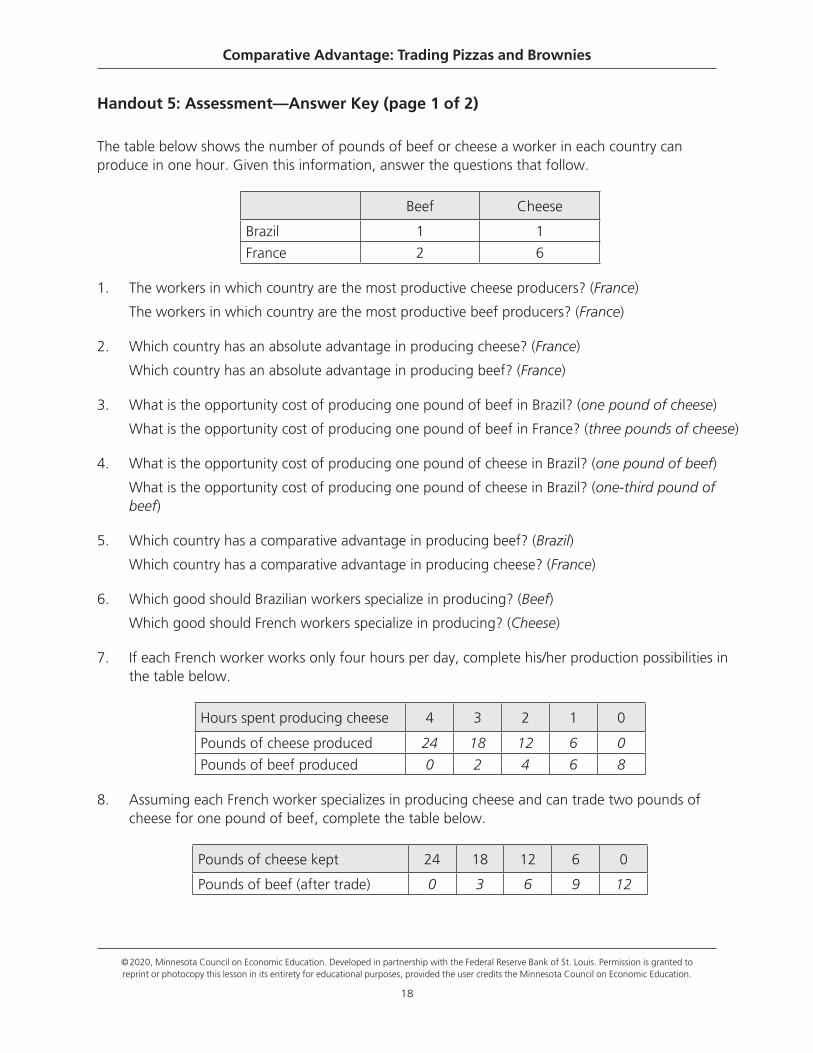
Handout 5: Assessment—Answer Key (page 1 of 2)
The table below shows the number of pounds of beef or cheese a worker in each country can produce in one hour. Given this information, answer the questions that follow.
Beef Cheese
Brazil 1 1
France 2 6
1. The workers in which country are the most productive cheese producers? (France)
The workers in which country are the most productive beef producers? (France)
2. Which country has an absolute advantage in producing cheese? (France)
Which country has an absolute advantage in producing beef? (France)
3. What is the opportunity cost of producing one pound of beef in Brazil? (one pound of cheese)
What is the opportunity cost of producing one pound of beef in France? (three pounds of cheese)
4. What is the opportunity cost of producing one pound of cheese in Brazil? (one pound of beef)
What is the opportunity cost of producing one pound of cheese in Brazil? (one-third pound of beef)
5. Which country has a comparative advantage in producing beef? (Brazil)
Which country has a comparative advantage in producing cheese? (France)
6. Which good should Brazilian workers specialize in producing? (Beef)
Which good should French workers specialize in producing? (Cheese)
7. If each French worker works only four hours per day, complete his/her production possibilities in the table below.
Hours spent producing cheese 4 3 2 1 0
Pounds of cheese produced 24 18 12 6 0
Pounds of beef produced 0 2 4 6 8
8. Assuming each French worker specializes in producing cheese and can trade two pounds of cheese for one pound of beef, complete the table below.
Pounds of cheese kept 24 18 12 6 0
Pounds of beef (after trade) 0 3 6 9 12
©2020, Minnesota Council on Economic Education. Developed in partnership with the Federal Reserve Bank of St. Louis. Permission is granted to reprint or photocopy this lesson in its entirety for educational purposes, provided the user credits the Minnesota Council on Economic Education.
18
Comparative Advantage: Trading Pizzas and Brownies
©2020, Minnesota Council on Economic Education. Developed in partnership with the Federal Reserve Bank of St. Louis. Permission is granted to reprint or photocopy this lesson in its entirety for educational purposes, provided the user credits the Minnesota Council on Economic Education.
19
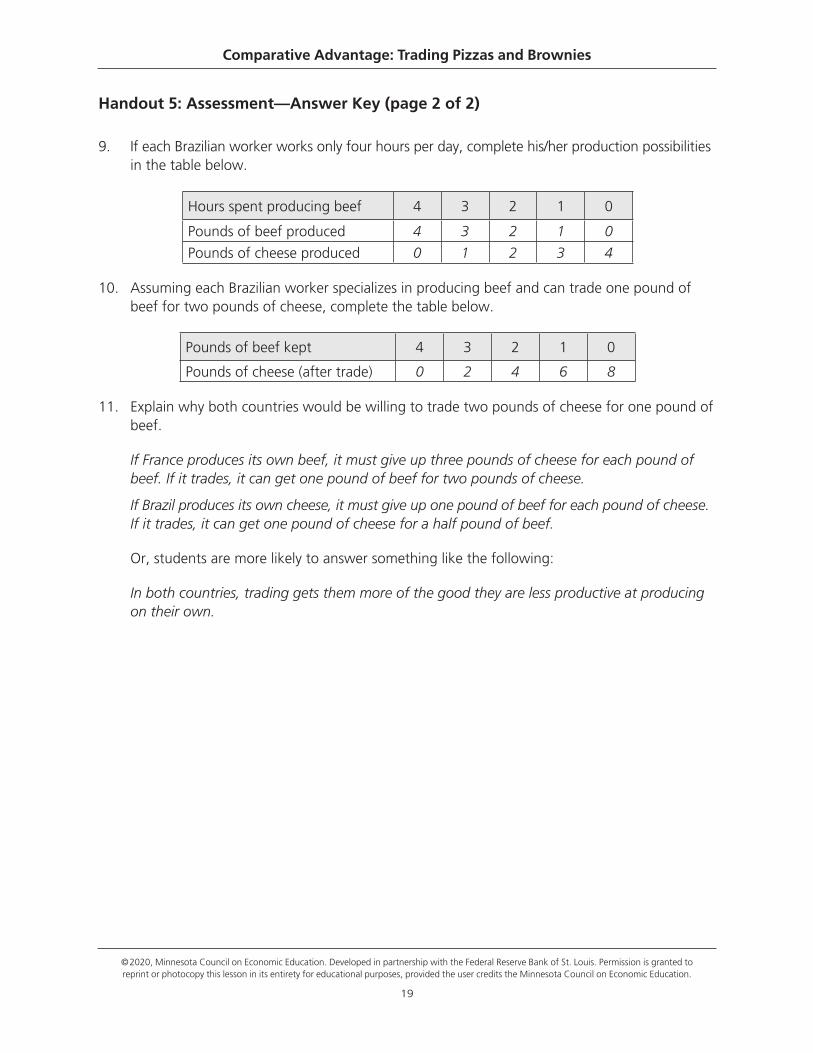
Handout 5: Assessment—Answer Key (page 2 of 2)
9. If each Brazilian worker works only four hours per day, complete his/her production possibilities in the table below.
Hours spent producing beef 4 3 2 1 0
Pounds of beef produced 4 3 2 1 0
Pounds of cheese produced 0 1 2 3 4
10. Assuming each Brazilian worker specializes in producing beef and can trade one pound of beef for two pounds of cheese, complete the table below.
Pounds of beef kept 4 3 2 1 0
Pounds of cheese (after trade) 0 2 4 6 8
11. Explain why both countries would be willing to trade two pounds of cheese for one pound of beef.
If France produces its own beef, it must give up three pounds of cheese for each pound of beef. If it trades, it can get one pound of beef for two pounds of cheese.
If Brazil produces its own cheese, it must give up one pound of beef for each pound of cheese. If it trades, it can get one pound of cheese for a half pound of beef.
Or, students are more likely to answer something like the following:
In both countries, trading gets them more of the good they are less productive at producing on their own.
Standards and Benchmarks
Content Standard 6: Specialization
When individuals, regions, and nations specialize in what they can produce at the lowest cost and then trade with others, both production and consumption increase.
• Benchmarks: Grade 8
1. Labor productivity is output per worker.
2. Like trade among individuals within one country, international trade promotes specialization and division of labor and increases the productivity of labor, output, and consumption.
• Benchmarks: Grade 12
1. Individuals and nations have a comparative advantage in the production of goods or services if they can produce a product at a lower opportunity cost than other individuals or nations.
Comparative Advantage: Trading Pizzas and Brownies
©2020, Minnesota Council on Economic Education. Developed in partnership with the Federal Reserve Bank of St. Louis. Permission is granted to reprint or photocopy this lesson in its entirety for educational purposes, provided the user credits the Minnesota Council on Economic Education.
20