Embed Size (px)
Citation preview

Computer Engineering and Intelligent Systems www.iiste.org
ISSN 2222-1719 (Paper) ISSN 2222-2863 (Online)
Vol.4, No.13, 2013
28
Comparative Analysis of Data Mining Tools and Classification
Techniques using WEKA in Medical Bioinformatics
Satish Kumar David1*
, Amr T.M. Saeb2, Khalid Al Rubeaan
3
1Department of Information Technology, Diabetes Strategic Research Center, King Saud University, P.O Box 245,
Riyadh 11411, Saudi Arabia. 2Department of Biotechnology, Diabetes Strategic Research Center, King Saud University, P.O Box 245, Riyadh
11411, Saudi Arabia. 3Director, University Diabetes Center, King Saud University, P.O Box 245, Riyadh 11411,Saudi Arabia.
* E-mail of the corresponding author: [email protected]
Abstract
The availability of huge amounts of data resulted in great need of data mining technique in order to generate
useful knowledge. In the present study we provide detailed information about data mining techniques with more
focus on classification techniques as one important supervised learning technique. We also discuss WEKA
software as a tool of choice to perform classification analysis for different kinds of available data. A detailed
methodology is provided to facilitate utilizing the software by a wide range of users. The main features of
WEKA are 49 data preprocessing tools, 76 classification/regression algorithms, 8 clustering algorithms, 3
algorithms for finding association rules, 15 attribute/subset evaluators plus 10 search algorithms for feature
selection. WEKA extracts useful information from data and enables a suitable algorithm for generating an
accurate predictive model from it to be identified. Moreover, medical bioinformatics analyses have been
performed to illustrate the usage of WEKA in the diagnosis of Leukemia.
Keywords: Data mining, WEKA, Bioinformatics, Knowledge discovery, Gene Expression.
1. INTRODUCTION Computers have brought about significant improvements to technology that lead to the creation of huge volumes
of data. Moreover, the advancement of the healthcare database management systems creates a huge number of
medical databases. Creating knowledge and management of large amounts of heterogeneous data has become a
major field of research, namely data mining. Data mining, “a major way of creating knowledge”, is a useful way
of studying medicine, genetics, bioinformatics, education [1].
Data Mining is a process of identifying novel, potentially useful, valid and ultimately understandable patterns in
data [1]. Data mining techniques can be classified into both unsupervised and supervised learning techniques.
Unsupervised learning technique is not guided by variable and does not create a hypothesis before analysis.
Based on the results, a model will be built. A common unsupervised technique is clustering [2]. Supervised
learning technique requires the building of a model that is used in prior performing analysis. Supervised learning
techniques that are used in both medical and clinical research are Classification, Statistical regression and
Association rules [3].
In the present study, we will focus on the usage of classification techniques in the field of medical bioinformatics.
Classification is the most commonly applied data mining technique, and employs a set of pre-classified examples
to develop a model that can classify the population of records at large. The major goal of the classification
technique is to predict the target class accurately for each case in the data. There are several classification
mechanisms that are used in analyzing medical data. These include Decision trees, K-Nearest Neighbor (KNN),
Bayesian network, Neural networks, Fuzzy logic and Support vector machines.
2. COMPARISONS OF CLASSIFICATION TECHNIQUES Table 1 summarizes the theoretical comparison among different classification techniques [4][5][35].

Computer Engineering and Intelligent Systems www.iiste.org
ISSN 2222-1719 (Paper) ISSN 2222-2863 (Online)
Vol.4, No.13, 2013
29
Table 1. Theoretical comparison on classification techniques
3. COMPARISONS OF DATA MINING TOOLS
There are several available types of software that employ classification techniques such as Rapid Miner[6][7],
KNIME [6][7], Tanagra [6][7], Orange [6][7] and WEKA [6][7]. Pharmine Company experts in data mining
have summarized a report on the comparison of data mining tools [6][7]. Table 2 depicts the Data Mining Tool
Comparison.
Table 2. Data mining tools Comparative Analysis
Among these, the WEKA tool has achieved the highest performance improvements in accuracy [6][7].
Importantly, WEKA can handle the problem of the multiclass data set, which is not the case in other data mining
tools. Moreover, Applicability (Run specific algorithm on a selected tool) is highest in WEKA. Furthermore,
WEKA is able to run 6 selected classifiers using all data sets.
4. WEKA DATA MINING SOFTWARE
In this manuscript we present WEKA software as useful tool in data mining techniques. Weka includes several
machine learning algorithms for data mining tasks. The algorithms can either be called from the users own Java
code or be applied directly to the ready dataset. Weka contains general purpose environment tools for data pre-
processing, regression, classification, association rules, clustering, feature selection and visualization.
Moreover, Weka software is suitable for several bioinformatics analyses. It has been used to probe selection of
gene expression arrays [8], automated protein data annotation [9][10], automatic cancer diagnosis [13], plant
genotype discrimination [14], classifying gene expression profiles [11] and computational model for frame-
shifting sites [15] and extracting rules from them [13].

Computer Engineering and Intelligent Systems www.iiste.org
ISSN 2222-1719 (Paper) ISSN 2222-2863 (Online)
Vol.4, No.13, 2013
30
WEKA includes algorithms for learning different types of model, feature selection schemes and pre-processing
methods. Weka facilitates the comparison of different solution strategies based on the same evaluation method
and identifying the best strategy for solving the problem at hand.
The following is a detailed description for WEKA software.
4.1 INTERFACES TO WEKA
There are four interfaces to WEKA which can be started from the main GUI Chooser window, as shown in
Figure 1.
Fig 1 WEKA GUI chooser
All the learning techniques in Weka can be accessed from the simple command line (CLI), as part of shell scripts,
or from within other Java programs using the Weka API. WEKA commands directly execute using CLI.
Weka also contains an alternative graphical user interface, called “Knowledge Flow,” that can be used instead of
the Explorer. Knowledge Flow is a drag-and-drop interface, and supports incremental learning. It caters for a
more process oriented view of data mining. Individual learning components (represented by Java beans) can be
connected graphically to create a “flow” of information.
Finally, there is a third graphical user interface—the “Experimenter”—which is designed for experiments that
compare the performance of (multiple) learning schemes on (multiple) datasets. Experiments can be distributed
across multiple computers running remote experiment servers and conducting statistical tests between learning
schemes.
4.2 THE WEKA EXPLORER
Explorer is the main interface in Weka, as shown in figure 2. New users can use it in running simulations, data
visualization and preprocessing. Through the explorer users can load data in various formats ARFF, CSV, C4.5,
and Library.

Computer Engineering and Intelligent Systems www.iiste.org
ISSN 2222-1719 (Paper) ISSN 2222-2863 (Online)
Vol.4, No.13, 2013
31
Fig 2 Weka Knowledge Explorer
WEKA Explorer has six (6) tabs, which can be used to perform tasks such as preprocess, classify, associate etc.
as shown in figure 3.
Fig 3 Tabs in WEKA Explorer
4.2.1 Preprocess: Preprocessing tools in WEKA are called “Filters”. The Preprocess retrieves data from a file,
SQL database or URL (For very large datasets sub sampling may be required since all the data were stored in
main memory). Data can be preprocessed using one of Weka’s preprocessing tools. The Preprocess tab shows a
histogram with statistics for the currently selected attribute. Histograms for all attributes can be viewed

Computer Engineering and Intelligent Systems www.iiste.org
ISSN 2222-1719 (Paper) ISSN 2222-2863 (Online)
Vol.4, No.13, 2013
32
simultaneously in a separate window. Some of the filters behave differently, depending on whether a class
attribute has been set or not. A filter box is used for setting up the required filter. WEKA contains filters for
Discretization, normalization, resampling, attribute selection, attribute combination [16].
4.2.2 Classify: Classify tools can be used to perform further analysis on preprocessed data. If the data demands a
classification or regression problem, it can be processed using Classify tab. A classification model produced on
the full trained data. WEKA consists of all major learning techniques for classification and regression: Bayesian
classifiers, decision trees, rule sets, support vector machines, logistic and multi-layer perceptrons, linear
regression, and nearest-neighbor methods. It also contains “meta-learners” like bagging, stacking, boosting, and
schemes that perform automatic parameter tuning using cross-validation, cost-sensitive classification, etc.
Learning algorithms can be evaluated using cross-validation or a hold-out set, and Weka provides standard
numeric performance measures (e.g. accuracy, root mean squared error), as well as graphical means for
visualizing classifier performance (e.g. ROC curves and precision-recall curves). It is possible to visualize the
predictions of a classification or regression model, enabling the identification of outliers, and to load and save
models that have been generated [16].
4.2.3 Cluster: WEKA contains “clusters” for finding groups of instances in datasets. Cluster tools give access to
Weka’s clustering algorithms, such as k-means, a heuristic incremental hierarchical clustering scheme. Cluster
assignments can be visualized and compared to actual clusters, defined by one of the attributes in the data [16].
4.2.4 Associate: Associate tools have generating association rules algorithms. It can be used to identify
relationships between groups of attributes in the data [16].
4.2.5 Select attributes: More interesting in the context of bioinformatics is the fifth tab, which offers methods
for identifying subsets of attributes that are predictive of target attribute in the data. Weka contains several
methods for searching through the space of attribute subsets, evaluation measures for attributes and attribute
subsets. Search methods such as a best-first search, genetic algorithms, forward selection, and attributes ranking.
Different search methods and evaluation methods both may be combined, making the system very flexible [16].
4.2.6 Visualize: Visualization tools show a matrix of scatter plots. Practically visualization is very much useful
which helps to determine learning problem difficulties. WEKA visualizes single dimension (1D) for single
attributes and double dimension (2D) for pairs of attributes. It is to visualize the current relation in 2D plots. Any
matrix element can be selected and enlarged in a separate window, where one can zoom in on subsets of the data
and retrieve information about individual data points. A “Jitter” option to deal with nominal attributes for
exposing obscured data points is also provided [16].
5. WEKA FOR MEDICAL BIOINFORMATICS
Bioinformatics is a field of research that focuses on a large scale understanding and organization of the
information associated with biological molecules [17]. Generally, Bioinformatics research involves problems
that can be manifested as machine learning tasks. These include classification or regression, clustering and
feature selection [18].
The Weka data mining suite offers algorithms for these types of biological problems. The Weka data mining suite
has been long used in many bioinformatics applications such as protein data annotation in the SWISS-PROT
database, with satisfactory results in term of coverage and confidence [10][9]). Moreover, naïve Bayes and
artificial neural networks, two learning algorithms, have been used in probe selection for gene-expression arrays
[8]. In addition, Weka data mining was also used in the discovery of significant rules for classifying cancer
diagnosis data [13]. Furthermore, Weka data mining has been employed in modeling frameshift mutation sites in
eukaryotes [15], use of metabolomics in plant genotype discrimination [14] and classifying gene groups
according to their expression profiles [11].
Furthermore, the available Weka framework offers a broad variety of useful tools for machine learning purposes.
For instance, the BioWeka project extends the Weka framework with additional bioinformatics functionalities,
including new input bioinformatics formats and alignments that facilitate its usage in combination with other
bioinformatics tools. These include, MAGE-ML [19] and CSV compatible formats for gene expression data,
FASTA [20], EMBL [21], Swiss-Prot [22], GenBank [23] for the storage of biological sequences in ASCII files,
InterProScan [24] for the annotation of sequence patterns.
In fact, with rapid progress in the fields of genomics, proteomics, Metabolomics, metabonomics, metabolite
profiling , gene expression, microbiomics and many others, the need for data analysis and mining techniques will
increase. Since data mining techniques provide the tools required to gain a better understanding and deeper
insight that allows biological problems to be solved [25][26][27].
DNA microarray technology and next-generation sequencing (NGS) technology are two different platforms for
gene expression measurement [28]. The Weka machine learning environment, two classical decision tree-
building techniques (J48 and SimpleCART) along with an advanced alternating decision tree (ADTree), were
used to build decision tree models to study the gene-ranking stability estimation of overlapping genes or classic

Computer Engineering and Intelligent Systems www.iiste.org
ISSN 2222-1719 (Paper) ISSN 2222-2863 (Online)
Vol.4, No.13, 2013
33
gene set enrichment analysis. This method revealed very accurate descriptive models that capture the co-
enrichment of gene sets, which are differently enriched in the compared data sets [29]. In addition, the random
forest method in the WEKA platform use used in study short read data from small RNA-seq experiments,
another NGS technology. This provided a wide range of analysis features, including quality control, read
normalization, small non-coding RNAs (ncRNA) quantification and the prediction of putative ncRNA candidates
[30]. Moreover, decision trees were generated using the j48 implementation of the C4.5 decision tree algorithm
from the Weka machine learning workbench was used to analyze deep sequencing data (NSG) in order study
bacterial communities constitute bacterial vaginosis (BV) or the normal vaginal microbiota among this
population, and how the microbiota associated with BV responds to antibiotic treatment [31].
Molecular phylogeny is a fundamental approach to study species evolution and gene function. Many
phylogenetic analysis programs are available, but each program often requires a particular type of input sequence
format. A variety of sequence formats are available for phylogenetic analysis, such as FASTA and Phylip. The
data mining tool WEKA is used in converting format through Relational File Format (ARFF), a native format of
WEKA [32]. Moreover, the WEKA platform has also been used in inferring phylogenetic relationships among
biological species [33].
6. EXPERIMENTAL WORKS AND RESULT
An experimental comparison of classification techniques is carried out in WEKA. Here, we have used a
“leukemia_all_72x7129” database for all the three techniques, and it is easy to differentiate their parameters on
a single instance. This “leukemia_all_72x7129” database has 7130 attributes and 72 instances.
Fig 4 WEKA 3.6.9 - Explorer window
Figure 4 shows the explorer window in the WEKA tool with the “leukemia_all_72x7129” dataset loaded; we
can also analyze the data in the form of a graph, as shown above in the visualization section with blue and red
code. In WEKA, all data is considered as instances attributes in the data. For easier analysis and evaluation,
simulation results are partitioned into several sub items. In the first part, correctly and incorrectly classified
instances will be partitioned in numeric and percentage value, and subsequently, Kappa statistics mean absolute
error and root mean squared error will be at a numeric value only.
This dataset is measured and analyzed with 10 folds cross validation under a specified classifier, as shown in
figure 5. Here, it computes all required parameters on given instances with the classifiers’ respective accuracy
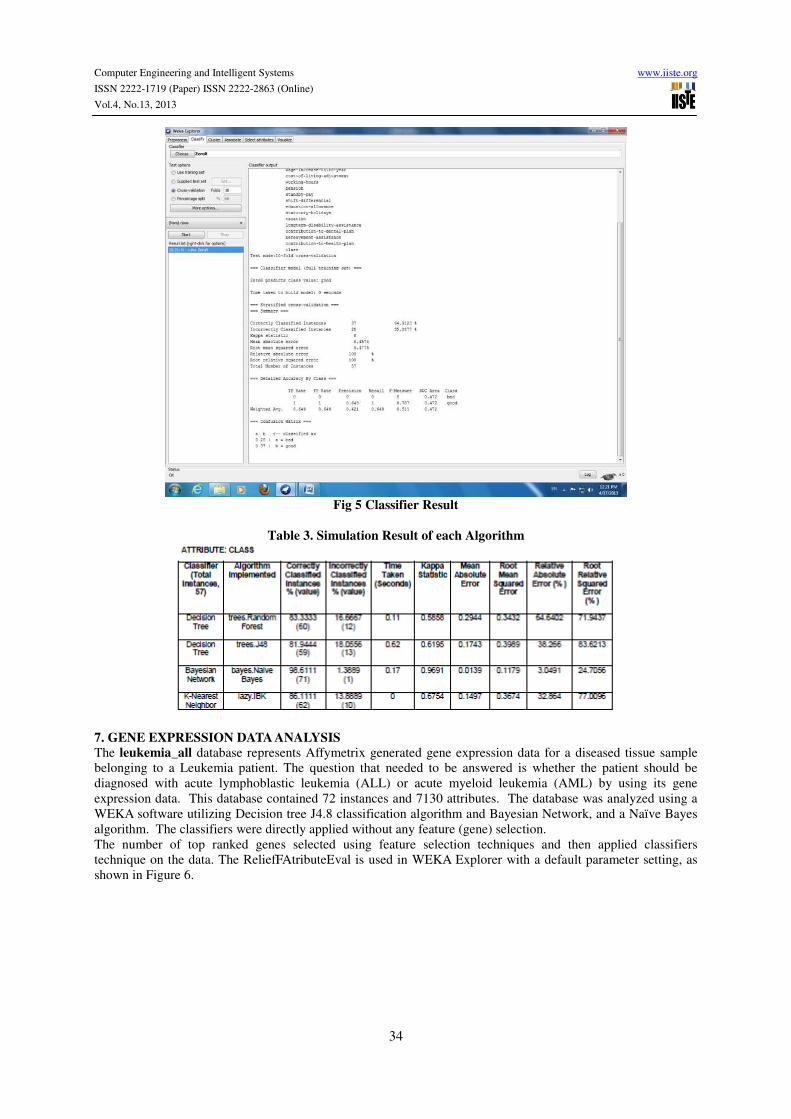
and prediction rate. Based on Table 3 we can clearly see that the highest accuracy is 98.6111% for Bayesian and
the lowest is 81.9444% for Decision tree. The time taken to build a model for Bayesian is 0.17 seconds and for
Decision tree.J48 is 0.62 seconds. In fact, in this experimental comparison, we can say that Bayesian is the best
of the three, as it is more accurate and less time consuming.
Computer Engineering and Intelligent Systems www.iiste.org
ISSN 2222-1719 (Paper) ISSN 2222-2863 (Online)
Vol.4, No.13, 2013
34
Fig 5 Classifier Result
Table 3. Simulation Result of each Algorithm
7. GENE EXPRESSION DATA ANALYSIS
The leukemia_all database represents Affymetrix generated gene expression data for a diseased tissue sample
belonging to a Leukemia patient. The question that needed to be answered is whether the patient should be
diagnosed with acute lymphoblastic leukemia (ALL) or acute myeloid leukemia (AML) by using its gene
expression data. This database contained 72 instances and 7130 attributes. The database was analyzed using a
WEKA software utilizing Decision tree J4.8 classification algorithm and Bayesian Network, and a Naïve Bayes
algorithm. The classifiers were directly applied without any feature (gene) selection.
The number of top ranked genes selected using feature selection techniques and then applied classifiers
technique on the data. The ReliefFAtributeEval is used in WEKA Explorer with a default parameter setting, as
shown in Figure 6.

Computer Engineering and Intelligent Systems www.iiste.org
ISSN 2222-1719 (Paper) ISSN 2222-2863 (Online)
Vol.4, No.13, 2013
35
Fig 6 Attribute Evaluator
Table 4 and 5 shows the average Merit, Average Rank values and Genbank ID of genes associated with AML and
ALL diseases, respectively. Data analysis results using both J4.8 classification Naïve Bayes algorithms was
identical. The average Merit of the genes associated with AML showed the highest values, indicating that the
patient should be diagnosed as an acute myeloid leukemia patient [34]. This result showed that WEKA software
can be used in disease diagnosis by linking it to different disease information databases.

Computer Engineering and Intelligent Systems www.iiste.org
ISSN 2222-1719 (Paper) ISSN 2222-2863 (Online)
Vol.4, No.13, 2013
36
Table 4. The average Merit, Average Rank and Genbank ID of genes associated with acute myeloid
leukemia (AML)
Table 5 The average Merit, Average Rank and Genbank ID of genes associated with
acute lymphoblastic leukemia (ALL).
8. CONCLUSIONS
WEKA is a full data mining suite which includes various preprocessing modules and data mining techniques.
Classification is one of the most popular techniques in data mining. In this paper, we compared algorithms based
on their accuracy, learning time and error rate. We observed that there is a direct relationship between execution
time in building the tree model and the volume of data records, while there is also an indirect relationship
between execution time in building the model and the attribute size of the data sets. Through experiment, we
conclude that Bayesian algorithms have better classification accuracy over and above compared algorithms.

Computer Engineering and Intelligent Systems www.iiste.org
ISSN 2222-1719 (Paper) ISSN 2222-2863 (Online)
Vol.4, No.13, 2013
37
Moreover, WEKA has proven to be a very useful tool for bioinformatics analysis, in this case in the diagnosis of
leukemia using a gene expression profile.
REFERENCES
[1] Fayyad, U., & Stolorz, P. (1997). Data mining and KDD: promise and challenges. Future generation
computer systems, 13(2), 99-115.
[2] Guerra L, McGarry M, Robles V, Bielza C, Larrañaga P, Yuste R. (2011). Comparison between supervised
and unsupervised classifications of neuronal cell types: A case study. Developmental neurobiology, 71(1): 71-82.
[3] Yoo I, Alafaireet P, Marinov M, Pena-Hernandez K, Gopidi R, Chang JF, Hua L. (2012). Data mining in
healthcare and biomedicine: a survey of the literature. Journal of medical systems, 36(4): 2431-2448.
[4] Kaushik H. Raviya, Biren Gajjar (2013) Performance Evaluation of different data mining classification
algorithm using WEKA, Vol. 2, January 2013.
[5] Ozekes, A., & Camurcu, Y. (2002). Classification and Prediction In A Data Mining Application. Journal of
Marmara for pure and applied sciences, 18, 159-174.
[6] Pharmine data mining ”Data Mining Tool Comparison-Summary”
http://voyagememoirs.com/pharmine/2008/05/18/summary.
[7] Zupan, B., & Demsar, J. (2008). Open-source tools for data mining. Clinics in laboratory medicine, 28(1),
37-54.
[8] Tobler JB, Molla MN, Nuwaysir EF, Green RD, Shavlik JW. (2002). Evaluating machine learning
approaches for aiding probe selection for gene-expression arrays. Bioinformatics, 18(suppl 1),:S164-S171.
[9] Bazzan AL, Engel PM, Schroeder LF, da Silva SC.. (2002) Automated annotation of keywords for proteins
related to mycoplasmataceae using machine learning techniques. Bioinformatics, 18(2)35S-43S.
[10] Kretschmann E, Fleischmann W, and Apweiler R (2001). Automatic rule generation for protein annotation
with the C4. 5 data mining algorithm applied on SWISS-PROT. Bioinformatics, 17(10): 920-926.
[11] Li J, & Wong L. (2002). Identifying good diagnostic gene groups from gene expression profiles using the
concept of emerging patterns. Bioinformatics, 18(5): 725-734.
[12] Li J, Liu H, Downing JR, Yeoh A.J, Wong L. (2003a). Simple rules underlying gene expression profiles of
more than six subtypes of acute lymphoblastic leukemia (ALL) patients. Bioinformatics, 19(1): 71-78.
[13] Li J, Liu H, Ng SK., & Wong L. (2003b). Discovery of significant rules for classifying cancer diagnosis
data. Bioinformatics, 19(suppl 2): ii93-ii102.
[14] Taylor J, King RD, Altmann T, Fiehn O. (2002). Application of metabolomics to plant genotype
discrimination using statistics and machine learning. Bioinformatics, 18(2):S241-S248.
[15] Bekaert M, Bidou L, Denise A, Duchateau-Nguyen G, et al. (2003) Towards a computational model for -1
eukaryotic frame shifting sites. Bioinformatics 19(3):327-35.
[16] Bouckaert RR, Frank E, Hall M, Kirkby R, Reutemann P, Seewald A, Scuse D. (2013). WEKA Manual for
Version 3-7-8.
[17] Luscombe NM, Greenbaum D, Gerstein M. (2001). What is bioinformatics? An introduction and overview.
Yearbook of Medical Informatics, 1: 83-99.
[18] Frank E, Hall M, Trigg L, Holmes G, Witten IH. (2004). Data mining in bioinformatics using Weka.
Bioinformatics, 20(15): 2479-2481.
[19] Spellman PT, Miller M, Stewart J, Troup C, Sarkans U, Chervitz S, et al. A. (2002). Design and
implementation of microarray gene expression markup language (MAGE-ML). Genome biology, 3(9):
research0046.
[20] Pearson WR, & Lipman DJ. (1988). Improved tools for biological sequence comparison. Proceedings of the
National Academy of Sciences, 85(8): 2444-2448.
[21] Kanz C, Aldebert P, Althorpe N, Baker W, Baldwin A, Bates, K, et al. (2005). The EMBL nucleotide
sequence database. Nucleic Acids Research, 33(1) :D29-D33.
[22] Bairoch A, Boeckmann B. (1991). The SWISS-PROT protein sequence data bank. Nucleic Acids Research
19:2247.
[23] Benson D, Lipman DJ, & Ostell J. (1993). GenBank. Nucleic Acids Research, 21(13), 2963-2965.
[24] Zdobnov EM, Apweiler R. (2001). InterProScan–an integration platform for the signature-recognition
methods in InterPro. Bioinformatics, 17(9): 847-848.
[25] Bensmail H, & Haoudi A. (2005). Data mining in genomics and proteomics. Journal of Biomedicine and
Biotechnology, 2005(2), 63.
[26] Chen T, Yu WH, Izard J, Baranova OV, Lakshmanan A, Dewhirst FE. (2010). The Human Oral Microbiome
Database: a web accessible resource for investigating oral microbe taxonomic and genomic information.
Database: the journal of biological databases and curation.
[27] Theodoridis G, Gika HG, & Wilson ID. (2008). LC-MS-based methodology for global metabolite profiling

Computer Engineering and Intelligent Systems www.iiste.org
ISSN 2222-1719 (Paper) ISSN 2222-2863 (Online)
Vol.4, No.13, 2013
38
in metabonomics/metabolomics. TrAC Trends in Analytical Chemistry 27(3): 251-260.
[28] Willenbrock H, Salomon J, Søkilde R, Barken KB., Hansen TN, Nielsen FC, et al.. (2009). Quantitative
miRNA expression analysis: comparing microarrays with next-generation sequencing. Rna, 15(11): 2028-2034.
[29] Stiglic G, Bajgot M, Kokol P. (2010). Gene set enrichment meta-learning analysis: next-generation
sequencing versus microarrays. BMC bioinformatics, 11(1): 176.
[30] Fasold M, Langenberger D, Binder H, Stadler PF, Hoffmann S. (2011). DARIO: a ncRNA detection and
analysis tool for next-generation sequencing experiments. Nucleic acids research 39(suppl 2): W112-W117.
[31] Hummelen R, Fernandes AD, Macklaim JM, Dickson RJ, Changalucha J, et al. (2010). Deep sequencing of
the vaginal microbiota of women with HIV. PLoS One 5(8): e12078.
[32] Attaluri PK, Christman MC, Chen Z, Lu G. (2011). SeqMaT: A sequence manipulation tool for phylogenetic
analysis. Bioinformation, 5(9), 400.
[33] Nascimento DG, Rates B, Santos DM, Verano-Braga T, Barbosa-Silva A, Dutra AA, & Pimenta A. (2006).
Moving pieces in a taxonomic puzzle: venom 2D-LC/MS and data clustering analyses to infer phylogenetic
relationships in some scorpions from the Buthidae family (Scorpiones). Toxicon, 47(6): 628-639.
[34] Golub TR, Slonim DK, Tamayo P, Huard C, Gaasenbeek M, Mesirov JP, Lander ES. (1999). Molecular
classification of cancer: class discovery and class prediction by gene expression monitoring. science 286(5439):
531-537.
[35] Ismail, S. A., Matin, A. F. A., & Mantoro, T. (2012). A Comparison Study of Classifier Algorithms for
Mobile-phone's Accelerometer Based Activity Recognition. Procedia Engineering, 41, 224-229.

This academic article was published by The International Institute for Science,
Technology and Education (IISTE). The IISTE is a pioneer in the Open Access
Publishing service based in the U.S. and Europe. The aim of the institute is
Accelerating Global Knowledge Sharing.
More information about the publisher can be found in the IISTE’s homepage:
http://www.iiste.org
CALL FOR JOURNAL PAPERS
The IISTE is currently hosting more than 30 peer-reviewed academic journals and
collaborating with academic institutions around the world. There’s no deadline for
submission. Prospective authors of IISTE journals can find the submission
instruction on the following page: http://www.iiste.org/journals/ The IISTE
editorial team promises to the review and publish all the qualified submissions in a
fast manner. All the journals articles are available online to the readers all over the
world without financial, legal, or technical barriers other than those inseparable from
gaining access to the internet itself. Printed version of the journals is also available
upon request of readers and authors.
MORE RESOURCES
Book publication information: http://www.iiste.org/book/
Recent conferences: http://www.iiste.org/conference/
IISTE Knowledge Sharing Partners
EBSCO, Index Copernicus, Ulrich's Periodicals Directory, JournalTOCS, PKP Open
Archives Harvester, Bielefeld Academic Search Engine, Elektronische
Zeitschriftenbibliothek EZB, Open J-Gate, OCLC WorldCat, Universe Digtial
Library , NewJour, Google Scholar