Embed Size (px)
Citation preview

Promet – Traffic&Transportation, Vol. 26, 2014, No. 2, 139-149 139
A. R. Mamdoohi et al.: Comparative Analysis of Safety Performance Indicators Based on Inductive Loop Detector Data
AMIR REZA MAMDOOHI, Assistant Professor E-mail: [email protected] Tarbiat Modares University Faculty of Civil & Environmental Engineering Jalal Ale Ahmad Highway, P.O.Box 14115-111, Tehran, Iran MOHSEN FALLAH ZAVAREH, Ph.D. Candidate E-mail: [email protected] Tarbiat Modares University Faculty of Civil & Environmental Engineering Jalal Ale Ahmad Highway, P.O.Box: 14115-111, Tehran, Iran CHRISTER HYDÉN, Professor Emeritus E-mail: [email protected] Lund Institute of Technology Transport and Roads P.O Box 118, SE-221 00 Lund, Sweden TROND NORDFJÆRN, Ph.D., Dr.philos E-mail: [email protected] Norwegian Institute for Alcohol and Drug Research Øvre Slottsgate 2 B, P.O Box 565, NO-0157 Oslo, Norway
Safety and Security of Traffic Preliminary Communication
Accepted: Apr. 1, 2013 Approved: Apr. 8, 2014
COMPARATIVE ANALYSIS OF SAFETY PERFORMANCE INDICATORS BASED ON INDUCTIVE LOOP DETECTOR DATA
ABSTRACT
Conflicts in traffic stream have been detected by differ-ent safety performance indicators. This study aims to em-pirically investigate the differences between different indi-cators in detecting rear-end conflicts and assessing the risk in an uninterrupted flow. Micro-level data of a 24-hr traffic stream (including 6,657 vehicles) were captured using in-ductive loop detectors installed on a rural freeway section. Different indicators (Time Headway (H), Time to Collision (TTC), Proportion of Stopping Distance (PSD), Deceleration Rate to Avoid Collision (DRAC) and Stopping Distance Index (SDI)) were used to measure each car following event in a bivalent state (safe/unsafe). Unsafe events associated with each indicator were detected and common unsafe events characterized by different indicators were identified. Tempo-ral distributions of rear-end collision risks associated with each indicator at 15-min intervals were also compared. Fi-nally, the 15-min risk values based on different indicators were categorized and compared across three levels (Low, Medium and High). Data mining and statistical techniques showed that while SDI is the single most conservative indica-tor, DRAC and TTC detect a few risky events but very equal ones. In almost all conflicts associated with TTC, headway is still lower than the critical threshold. However, there exist considerable risky events based on headway which are still safe according to TTC. Comparison of PSD and TTC also de-clares that almost all conflicts associated with TTC are also risky according to PSD.
KEY WORDS
safety performance indicator; headway; time to collision; stopping distance; conflict; inductive loop detector
1. INTRODUCTION
Road Safety has been conventionally defined as “the number of accidents (crashes), or accident con-sequences, by kind and severity, expected to occur on the entity during a specified period” [1]. However, re-searchers have noted the deficient aspects of studies focusing on crash counts as the only data source. For example, Lord and Mannering reviewed data and meth-odological issues in research based on crash data [2]. Studies of crash counts are based on a reactive ap-proach that is inherently limited by the available data and includes no information about pre-crash events. Such an approach can hardly be advocated from an ethical point of view, because it requires crashes to happen in a relatively long time before choosing the ef-fective remedial countermeasures. While road crashes are recognized to be consequences of traffic conflicts, count-based studies only rely on reported crashes and do not include all likely interactions between the road users [3].
A. R. Mamdoohi et al.: Comparative Analysis of Safety Performance Indicators Based on Inductive Loop Detector Data
140 Promet – Traffic&Transportation, Vol. 26, 2014, No. 2, 139-149
Focus on all possible interactions between road users (from undisturbed interactions to risky conflicts) provides a proactive approach in traffic safety investi-gation. Conflict in this approach was first introduced by Perkins and Harris [4]; however, Amundsen and Hydén provided a practically applicable and univer-sally accepted definition as “an observable situation in which two or more road users approach each other in time and space to such an extent that there is risk of collision if their movements remain unchanged” [5]. Performance studies of individual road users based on this approach give an insight into potential crash situa-tions and actions for prevention [6].
The proactive approach has offered a wide range of methodologies to capture the conflicts in a traffic stream. Primitive methods relied on simple judgments by trained human observers on the road. However, re-cent innovations (such as high quality detectors and automated analysis techniques) help researchers readily measure the safety of interactions between the road users in terms of more objective safety perfor-mance indicators (also called “proximal safety indica-tors” or “surrogate safety measures”).
The degree to which the surrogates are correlated with real crashes is questionable (e.g. see [7,8]). To date very few indicators have been thoroughly vali-dated (e.g. [9]). However, different safety performance indicators have already been applied in previous studies using real world data (e.g. [3,10,11]) or data generated by well-calibrated micro-simulation models (e.g. [12]).
To detect conflicts in a traffic stream, different in-dicators use different aspects of interactions. For ex-ample, Laureshyn et al. categorized indicators to those describing proximity in space, proximity in time and the intensity of necessary evasive action [13]. Some indi-cators are suitable to capture conflicts from the data obtained on a road length, whereas a few of indicators are applicable if the data are gathered in a cross sec-tion [14]. Some indicators are also exclusively appli-cable on special features (intersections).
Almost all safety indicators are adopted based on the primitive principles of Newtonian mechanics of movement; however, the classic principles of kinemat-ics are not always applicable to examine the differenc-es between safety performance indicators. Moreover, it may be hypothesized that while a given interaction between two road users is assessed to be safe in terms of a variety of performance indicators, it may be recognized as risky by others.
Reviews of literature indicate that few previous studies examined the differences between perfor-mance indicators in capturing the conflicts. For exam-ple, comparing headway and time to collision, Vogel concluded that these indicators are independent of each other [15]. Oh et al. implemented a prototypical project to measure the real-time risk of car-following
events, based on the analysis of image processing of video captured data [16]. They compared safety evalu-ation methods in terms of the time each tracked ve-hicle was driving in an unsafe manner, based on time to collision (TTC) and stopping distance index (SDI) criteria. Guido et al. used videotaping instruments to extract trajectories of vehicles moving alongside the ring and entering/exiting points of a roundabout in Italy [3]. Tracking individual vehicles in a limited time period, they used different performance indicators to evaluate safety. Analysis of risky car-following events showed that different indicators cause different loca-tions around the roundabout to be recognized as hav-ing high safety problems.
A holistic focus on comparative analysis of safety performance indicators has been the subject of very few studies to date (e.g. see [3] and [15]). The present study aims to empirically investigate the differences between a number of indicators in terms of equally identification of conflicts and risks thereof in car-fol-lowing events captured in a cross section in an uninter-rupted traffic flow.
2. SAFETY PERFORMANCE INDICATORS
If data in use are gathered in a cross section, a range of safety performance indicators (and associat-ed thresholds) may be applicable in detecting vehicu-lar risky following events (conflicts). In this research fo-cus was placed on performance indicators addressed more in previous studies as well as being capable to be measured based on micro-level data obtained by inductive loop detectors at cross sections. Assum-ing that vehicle speed does not change considerably in the short period before and after the measure-ment section station at the cross section (isoveloxic assumption [17]), the cross-sectional attributes ob-tained can be assigned to a short distance from the section.
2.1 Time Headway
Highway Capacity Manual (HCM) defines the Time Headway (H) as “the time in seconds, between two successive vehicles passing a point, measured from the same common feature of both vehicles” [18]. (Equation 1)H t ti i 1= - - (1)where ti and ti 1- denote time of passage (s) for the following and leading vehicles, respectively.
Vogel presents different headway thresholds rec-ommended or enforced in different countries (from 0.9 s in Germany to 3.0 s in rural areas of Sweden) [15]. Moreover, a limit of more than 2 s is usually ad-vised for time headway by the European Governments [19].

Promet – Traffic&Transportation, Vol. 26, 2014, No. 2, 139-149 141
A. R. Mamdoohi et al.: Comparative Analysis of Safety Performance Indicators Based on Inductive Loop Detector Data
2.2 Time to Collision
Time to Collision (TTC) was first defined by Hayward in 1972 as “the time required for two vehicles to col-lide if they continue at their present speeds and on the same path” [20]. TTC is measured using Equation 2.
TTCX t X tX t X t l
ii i
i i i
1
1= -- -
-
-
o o^ ^
^ ^
h h
h h X t X ti i 16 2 -o o^ ^h h (2)
where X t^ h and X to ^ h denote the position and speed of vehicle at time t, respectively (i and i 1- subscripts are used to address the following and leading vehicles, respectively) and l represents the length of vehicle.
Svensson regarded the time to collision as a con-flict indicator [21]. Different thresholds for TTC have been introduced as criteria to distinguish rear-end con-flicts (e.g. see [22]). However, Van der Horst argued that 1.5 s (corresponding to the minimum perception and reaction time) is TTC critical value; below this val-ue the following vehicle is assumed to be in conflict or on an unavoidable collision path [23].
2.3 Proportion of Stopping Distance
Allen et al. defined the Proportion of Stopping Dis-tance (PSD) as the ratio of the distance to the poten-tial collision point to the acceptable minimum stopping distance [24] (Equation 3).
PSD MSDRD= (3)
In this equation, RD represents the remaining dis-tance to the potential point of collision and MSD shows the acceptable minimum stopping distance, which can be measured according to Equation 4.
MSD dV22
= (4)
where V is the approaching velocity and d is the ac-ceptable maximum deceleration rate. PSD should be always more than 1.0 to assure the safety of the fol-lowing event.
2.4 Deceleration Rate to Avoid Collision
Cooper and Ferguson were one of the first to define Deceleration Rate to Avoid Collision (DRAC) as a mea-sure of conflict [25]. For vehicles driving in the same direction, DRAC (m/s2) is calculated using Equation 5. In this equation, V and X show the velocity (m/s) and location (m) of vehicles (i and i 1- subscripts repre-sent the following and the leading vehicles, respective-ly) and Li 1- denotes the length of the leading vehicle.
DRAC X X LV V
2ii i i
i i
1 1
12
#= - -
-- -
-
^^
hh
6 @ (5)
Archer suggests that if DRAC for the following vehi-cle exceeds a threshold of 3.35 m/s2, its following situ-ation can be regarded as a conflict [26]. This threshold is a bit lower than what is recommended by AASHTO
Green Book as the deceleration rate available in most vehicles (i.e. 3.4 m/s2) [27]. Moreover, Cunto and Sac-comanno assumed that two times of Maximum Avail-able Deceleration Rate (2*MADR) follows a truncated normal distribution with an average of 7.42 m/s2 and standard deviation of 0.24 m/s2 [28]. In another study the same authors assumed a normal truncated distri-bution with an average of 8.45 m/s2, standard devia-tion of 1.40 m/s2 and the upper and lower limits of 12.68 m/s2 and 4.23 m/s2, respectively for 2*MADR for small vehicles on dry pavements [29].
2.5 Rear-End Collision Risk Index
To calculate the risk of rear-end collision on free-way cross sections, Oh et al. developed a collision risk index based on the concept of Safe Stopping Distance [30]. According to this concept, to avoid rear-end colli-sion in a car following event, the stopping distance of leading vehicle should be larger than that of the follow-ing vehicle (Equation 6).
V haV l V t
aV
2 2L
LdecL
L F RFdecF
2 22+ - + (6)
where V, adec and l represent velocity (m/s), decelera-tion rate (m/s2) and length of vehicle (m), respectively (subscripts L and F represent the leading and follow-ing vehicles, respectively). tR is the brake reaction time (s) and h denotes the time headway between the two vehicles.
Oh et al. propose Stopping Distance Index based on the comparison of Stopping Distances of leading and following vehicles, as in Equation 7. SDI in this equation represents the Stopping Distance Index.
( )
( )SDI safe
unsafe
if V h V t laV
aV
otherwise
0
12 2
0L F R LLdecL
FdecF
2 22= - - + +c m* (7)
The rear-end collision risk index (RCRI) is then pro-posed as the ratio between the total number of unsafe events and the maximum possible number of car fol-lowing situations over a certain time interval (Equation 8).
/RCRI
N T N
SDI
3600carMax
l
ii=^ h
/ (8)
where NcarMax is the maximum number of car following events per hour (derived from freeway capacity), T is the analysis duration (s) and Nl is the number of free-way lanes in the analysis direction.
3. DATA
If properly installed, inductive loop detectors (ILDs) have been shown to be useful in measuring disaggre-gate attributes (namely: speed, length and time of pas-sage) of individual vehicles passing over the sensors

A. R. Mamdoohi et al.: Comparative Analysis of Safety Performance Indicators Based on Inductive Loop Detector Data
142 Promet – Traffic&Transportation, Vol. 26, 2014, No. 2, 139-149
[30]. Automated ILDs have been used for gathering traffic data in Iran for about a decade. By the end of 2011, rural highways of the country (with total length of more than 12,600 km) will have been equipped with 531 pairs of ILDs [31].
In this study inductive loop sensors connected to a personal computer (PC) as a programmable electronic data logger enable registration of the passage time for each vehicle. The shape of received vehicle signature is related with the length (and type) of the passing ve-hicle. Installing two successive sensors also allows for vehicular speed measurement.
Empirical data used in this study were captured by ILDs installed on a four-lane divided rural freeway, connecting Arak to Salafchegan in Markazi province in central Iran. For each lane, a pair of sensors embed-ded in the pavement, were connected to a data logger to gather traffic data. Using a GPRS (General Packet Radio Service) modem, data packets (including speed, length and time of passage of individual vehicles pass-ing over the sensor) were transmitted every 5 minutes to the main server in the central office in Tehran. Micro-level traffic data obtained in a 24-hour duration on a working day of January 2012 on the slow moving lane (including 6,657 vehicles) were included in the analy-sis. Limiting the data to the slow-moving lane tends to cover more vehicles, of different types and of a wider range of speeds.
4. METHODS
A “car-following event” (called “event” hereinafter) is conventionally defined in this study as an action in which a vehicle runs behind a leading vehicle on the same lane and direction, regardless of its speed and time gap. Using the different safety performance indi-
cators reviewed in the next section and summarized in Table 1, bivalent safety state of each event i based on each performance indicator j can be determined by Safety Index SIij as Equation 9. As shown in this table, depending on maximum deceleration rate available for the following vehicle (fixed or variable), safety anal-ysis based on two kinds of DRAC and SDI have been conducted in this study.
jthreshold of perfomance indicatorSIi1
0
If event is unsafe according to associated
otherwiseij=* (9)
The present study aims to investigate the differenc-es between safety performance indicators in explain-ing the risk. This will be conducted via three phases. Firstly, the total unsafe events based on different indi-cators within the day are determined and the indica-tors’ similarities are investigated in terms of equalities of the conflicts they have detected.
Analysis of risky events in total 24-hr duration con-tains no information about temporal distribution of un-safe events over the day. Thus, in the second phase, the day is divided into shorter 15-min intervals and Rear-end Collision Risk Index by each indicator is cal-culated within each interval (Equation 10).
RCRI N
SIj
iji
N
=/
(10)
In this equation SI is Safety Index (as defined in Equation 9) by each indicator j and N is the total num-ber of events in that time interval.
Finally, to illustrate the indicators’ differences in a more understandable way, Fuzzy C-Means method is employed to categorize each 15-min risk value by each indicator, into clusters. In Fuzzy algorithms of Cluster-ing, a point may belong to all clusters at the same
Table 1- Performance indicators and their thresholds
Performance indicator Symbol Assumptions Safety requirement
(Threshold)Time Headway H N/A More than 2 sTime to Collision TTC Following vehicle is driving faster than leading vehicle More than 1.5 sProportional Stop-ping Distance PSD A Fixed Deceleration Rate of 3.4m/s2 for the following vehicle More than 1
Deceleration Rate to Avoid Collision
DRAC1 A Fixed Deceleration Rate for the following vehicle Less than 3.4m/s2
DRAC2 Maximum Available Deceleration Rate (MADR) follows Trun-cated Normal Distribution* for the following vehicles Less than MADR
Stopping Distance Index
SDI1 Fixed Deceleration Rate of 3.4m/s2 available for both Following and Leading Vehicles. A 2.5 s is considered for Perception Reaction Time
Equal to 0SDI2
Maximum Available Deceleration Rate for Following Ve-hicle follows Truncated Normal Distribution*. Upper limit of this distribution is assumed for the leading vehicles and a 2.5 s is considered for Perception Reaction Time
* Average of 4.23 m/s2, standard deviation of 0.71 m/s2 and upper and lower limits of 6.34 m/s2 and 2.12 m/s2, respectively have been proposed for the assumed truncated normal distribution function. N/A: Not applicable
Promet – Traffic&Transportation, Vol. 26, 2014, No. 2, 139-149 143
A. R. Mamdoohi et al.: Comparative Analysis of Safety Performance Indicators Based on Inductive Loop Detector Data
time, with different degrees of membership [32]. To defuzzify, each 15-min risk value is assumed to belong to the category (level) with the highest degree of mem-bership in this study.
Average difference of risk levels between the per-formance indicators is also calculated for each pair of indicators, using Equation 12.
D N
Z Zij
ki kjk
N
1=-
=r/
(12)
where: Dijr – Average difference of risk levels between
safety performance indicators i and j in analysis period (24hr in this study);
Zki – Ordinal number of category (Low=1, Medi-um=2 and High=3) in clustering risk values associated to ith performance indicator in kth time interval;
N – Total number of time interval (N=96).
5. RESULTS
5.1 Analysis of unsafe events frequencies
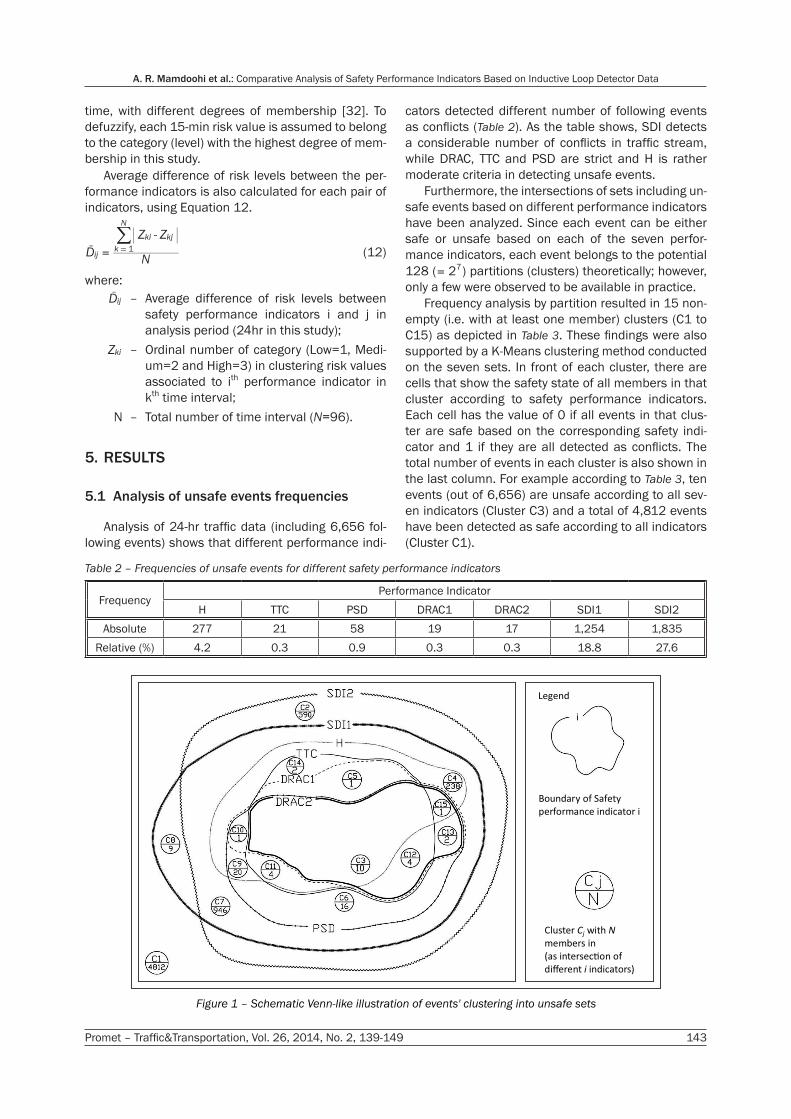
Analysis of 24-hr traffic data (including 6,656 fol-lowing events) shows that different performance indi-
cators detected different number of following events as conflicts (Table 2). As the table shows, SDI detects a considerable number of conflicts in traffic stream, while DRAC, TTC and PSD are strict and H is rather moderate criteria in detecting unsafe events.
Furthermore, the intersections of sets including un-safe events based on different performance indicators have been analyzed. Since each event can be either safe or unsafe based on each of the seven perfor-mance indicators, each event belongs to the potential 128 ( 27= ) partitions (clusters) theoretically; however, only a few were observed to be available in practice.
Frequency analysis by partition resulted in 15 non-empty (i.e. with at least one member) clusters (C1 to C15) as depicted in Table 3. These findings were also supported by a K-Means clustering method conducted on the seven sets. In front of each cluster, there are cells that show the safety state of all members in that cluster according to safety performance indicators. Each cell has the value of 0 if all events in that clus-ter are safe based on the corresponding safety indi-cator and 1 if they are all detected as conflicts. The total number of events in each cluster is also shown in the last column. For example according to Table 3, ten events (out of 6,656) are unsafe according to all sev-en indicators (Cluster C3) and a total of 4,812 events have been detected as safe according to all indicators (Cluster C1).
Table 2 – Frequencies of unsafe events for different safety performance indicators
FrequencyPerformance Indicator
H TTC PSD DRAC1 DRAC2 SDI1 SDI2Absolute 277 21 58 19 17 1,254 1,835
Relative (%) 4.2 0.3 0.9 0.3 0.3 18.8 27.6
i
Legend
Boundary of Safety
performance indicator i
Cluster withC Nj
members in
(as intersec�on of
different indicators)i
Figure 1 – Schematic Venn-like illustration of events' clustering into unsafe sets

A. R. Mamdoohi et al.: Comparative Analysis of Safety Performance Indicators Based on Inductive Loop Detector Data
144 Promet – Traffic&Transportation, Vol. 26, 2014, No. 2, 139-149
The corresponding graphical illustration (unique in this problem) generated based on set theory and Venn-diagram concepts shows these 15 clusters as partitions (no common members) of the events’ uni-verse. A schematic illustration of clusters shown in Fig-ure 1 represents a Venn diagram with boundaries in accordance with the conditions shown in Table 3. Each closed curve in this Figure represents a performance indicator and the codes inside denote the name and
number of members for each cluster. As the Figure shows, both SDI1 and SDI2 are very conservative in-dicators because almost all other clusters are subsets of SDI1 and SDI2.
5.2 Rear-end collision risk analysis
The risk of a rear-end collision for each time inter-val may be calculated by each safety performance in-
Table 3 – Events’ clustering results based on frequency analysis*
Cluster NameSafety Performance Indicator Number of
MembersH TTC PSD DRAC1 DRAC2 SDI1 SDI2C1 0 0 0 0 0 0 0 4812C2 0 0 0 0 0 0 1 590C3 1 1 1 1 1 1 1 10C4 1 0 0 0 0 1 1 238C5 1 1 0 1 0 1 1 1C6 0 0 1 0 0 1 1 16C7 0 0 0 0 0 1 1 946C8 0 0 0 0 0 1 0 9C9 1 0 1 0 0 1 1 20
C10 1 0 1 1 0 1 1 1C11 1 1 1 0 0 1 1 4C12 0 1 1 1 1 1 1 4C13 0 0 1 1 1 1 1 2C14 1 1 0 0 0 1 1 2C15 1 0 1 1 1 1 1 1
* 15 Non-empty observed clusters from among 128 (=27) potential clusters.
SDI2
SDI1
Headway
DRAC2
0
5
10
15
20
25
30
35
40
45
0:1
5
0:4
5
1:1
5
1:4
5
2:1
5
2:4
5
3:1
5
3:4
5
4:1
5
4:4
5
5:1
5
5:4
5
6:1
5
6:4
5
7:1
5
7:4
5
8:1
5
8:4
5
9:1
5
9:4
5
10
:15
10
:45
11
:15
11
:45
12
:15
12
:45
13
:15
13
:45
14
:15
14
:45
15
:15
15
:45
16
:15
16
:45
17
:15
17
:45
18
:15
18
:45
19
:15
19
:45
20
:15
20
:45
21
:15
21
:45
22
:15
22
:45
23
:15
23
:45
Ris
k(P
erc
en
t)
Time
0
1
2
3
4
5
6
7
8
0:1
5
0:4
5
1:1
5
1:4
5
2:1
5
2:4
5
3:1
5
3:4
5
4:1
5
4:4
5
5:1
5
5:4
5
6:1
5
6:4
5
7:1
5
7:4
5
8:1
5
8:4
5
9:1
5
9:4
5
10
:15
10
:45
11
:15
11
:45
12
:15
12
:45
13
:15
13
:45
14
:15
14
:45
15
:15
15
:45
16
:15
16
:45
17
:15
17
:45
18
:15
18
:45
19
:15
19
:45
20
:15
20
:45
21
:15
21
:45
22
:15
22
:45
23
:15
23
:45
Ris
k(P
erc
en
t)
Time
PSD
DRAC2
DRAC1
TTC
Figure 2 – Comparison of risk of rear-end collision during the 24 hr
based on different indicators (Analysis Interval=15 minutes)

Promet – Traffic&Transportation, Vol. 26, 2014, No. 2, 139-149 145
A. R. Mamdoohi et al.: Comparative Analysis of Safety Performance Indicators Based on Inductive Loop Detector Data
Table 4 – Risk levels at 15min time intervals associated with different performance indicators
Time IntervalSafety Performance Indicator
Time IntervalSafety Performance Indicator
H TTC PSD DRAC1 DRAC12 SDI1 SDI2 H TTC PSD DRAC1 DRAC12 SDI1 SDI2
00:00-00:15 1 1 1 1 1 1 1 12:00-12:15 2 2 2 2 2 2 3
00:15-00:30 1 1 1 1 1 1 1 12:15-12:30 3 1 2 1 1 3 3
00:30-00:45 1 1 1 1 1 1 1 12:30-12:45 2 1 1 1 1 2 2
00:45-01:00 1 1 1 1 1 1 2 12:45-13:00 3 1 2 1 1 3 3
01:00-01:15 2 3 3 3 3 1 1 13:00-13:15 2 2 2 2 2 3 3
01:15-01:30 1 1 1 1 1 1 1 13:15-13:30 3 2 2 2 2 3 3
01:30-01:45 1 1 1 1 1 1 1 13:30-13:45 3 1 1 1 1 3 3
01:45-02:00 1 1 1 1 1 1 1 13:45-14:00 2 1 1 1 1 3 3
02:00-02:15 2 1 1 1 1 1 1 14:00-14:15 2 2 2 2 2 3 3
02:15-02:30 1 1 1 1 1 1 1 14:15-14:30 3 1 2 1 1 3 3
02:30-02:45 1 1 1 1 1 1 1 14:30-14:45 2 1 2 1 1 3 3
02:45-03:00 1 1 1 1 1 1 1 14:45-15:00 3 1 1 1 1 3 3
03:00-03:15 1 1 1 1 1 1 1 15:00-15:15 3 1 1 1 1 3 3
03:15-03:30 1 1 1 1 1 1 1 15:15-15:30 3 1 1 1 1 3 3
03:30-03:45 1 1 1 1 1 1 1 15:30-15:45 3 1 2 1 1 3 3
03:45-04:00 1 1 1 1 1 1 1 15:45-16:00 3 1 3 2 2 3 3
04:00-04:15 1 1 1 1 1 1 1 16:00-16:15 3 1 2 1 1 3 3
04:15-04:30 1 1 1 1 1 1 2 16:15-16:30 2 1 2 1 1 3 3
04:30-04:45 1 1 1 1 1 1 1 16:30-16:45 1 1 2 1 1 3 3
04:45-05:00 2 1 1 1 1 1 2 16:45-17:00 2 1 2 1 1 3 3
05:00-05:15 1 1 1 1 1 1 1 17:00-17:15 3 2 2 1 1 3 3
05:15-05:30 3 3 1 3 1 1 1 17:15-17:30 1 2 2 2 2 3 3
05:30-05:45 3 3 3 3 3 1 2 17:30-17:45 2 2 2 1 1 2 3
05:45-06:00 1 1 1 1 1 1 1 17:45-18:00 3 1 2 1 1 2 2
06:00-06:15 1 1 3 1 1 1 1 18:00-18:15 2 2 2 1 1 2 2
06:15-06:30 1 1 1 1 1 1 1 18:15-18:30 2 2 2 2 2 2 2
06:30-06:45 1 1 1 1 1 1 1 18:30-18:45 2 1 1 1 1 2 2
06:45-07:00 1 1 1 1 1 1 1 18:45-19:00 1 1 1 1 1 1 1
07:00-07:15 1 1 1 1 1 1 1 19:00-19:15 2 1 1 1 1 2 3
07:15-07:30 2 1 1 1 1 2 2 19:15-19:30 2 2 2 2
07:30-07:45 2 1 2 1 1 2 2 19:30-19:45 2 1 1 1 1 1 2
07:45-08:00 2 1 2 1 1 1 2 19:45-20:00 1 1 1 1 1 1 1
08:00-08:15 2 1 2 1 1 2 2 20:00-20:15 1 1 3 2 2 2 2
08:15-08:30 1 1 1 1 1 2 1 20:15-20:30 1 1 1 1 1 2 2
08:30-08:45 1 1 1 1 1 1 1 20:30-20:45 1 1 1 1 1 1 1
08:45-09:00 2 1 1 1 1 2 2 20:45-21:00 2 1 1 1 1 2 2
09:00-09:15 2 1 1 1 1 2 2 21:00-21:15 3 2 3 2 2 1 1
09:15-09:30 2 1 1 1 1 2 2 21:15-21:30 1 1 1 1 1 1 1
09:30-09:45 2 2 2 2 2 3 3 21:30-21:45 3 2 2 1 1 2 1
09:45-10:00 2 1 2 1 1 2 2 21:45-22:00 1 1 1 1 1 1 1
10:00-10:15 2 1 2 2 1 1 2 22:00-22:15 3 3 3 3 3 2 2
10:15-10:30 3 1 1 1 1 2 3 22:15-22:30 2 1 1 1 1 1 1
10:30-10:45 2 1 2 1 1 2 2 22:30-22:45 2 1 1 1 1 1 1
10:45-11:00 2 1 2 1 1 2 2 22:45-23:00 2 1 1 1 1 3 2
11:00-11:15 2 1 1 1 1 2 2 23:00-23:15 2 1 1 1 1 3 2
11:15-11:30 3 1 2 1 1 3 3 23:15-23:30 1 1 1 1 1 1 1
11:30-11:45 2 1 1 1 1 2 3 23:30-23:45 2 1 2 1 1 2 3
11:45-12:00 2 2 2 2 2 3 3 23:45-00:00 3 2 3 2 2 2 3
Risk level 1 (Low) 2 (Medium) 3 (High)
A. R. Mamdoohi et al.: Comparative Analysis of Safety Performance Indicators Based on Inductive Loop Detector Data
146 Promet – Traffic&Transportation, Vol. 26, 2014, No. 2, 139-149
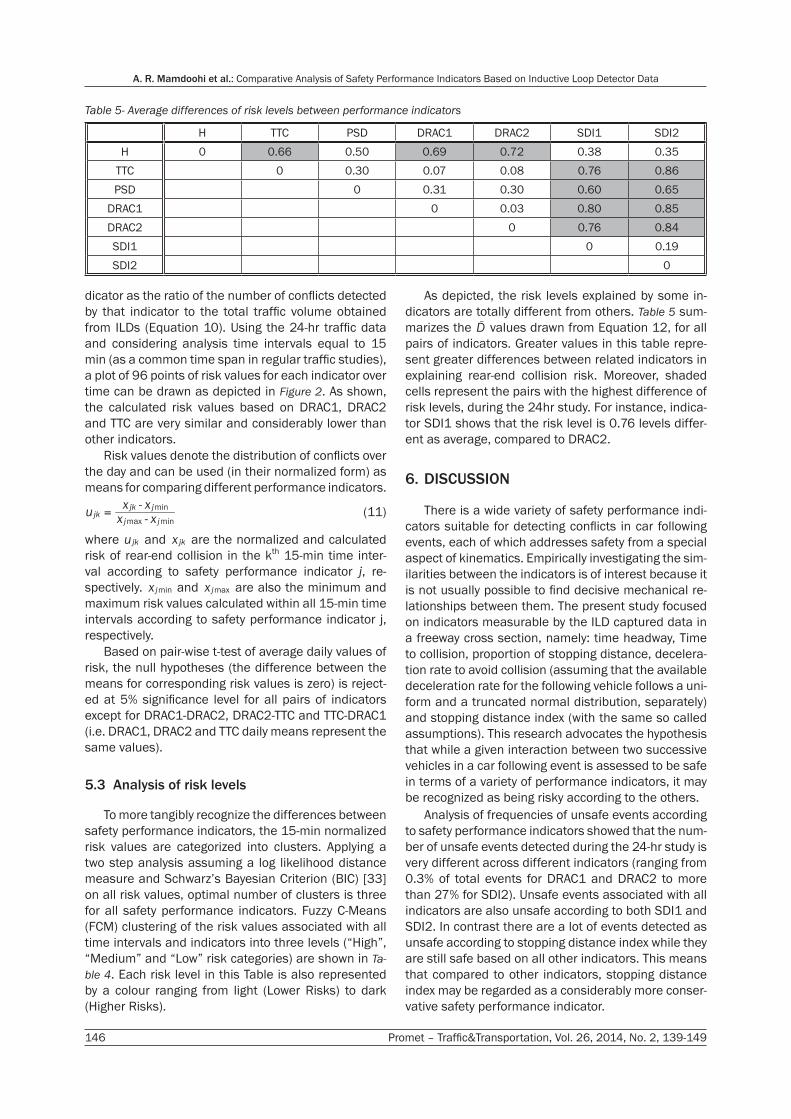
dicator as the ratio of the number of conflicts detected by that indicator to the total traffic volume obtained from ILDs (Equation 10). Using the 24-hr traffic data and considering analysis time intervals equal to 15 min (as a common time span in regular traffic studies), a plot of 96 points of risk values for each indicator over time can be drawn as depicted in Figure 2. As shown, the calculated risk values based on DRAC1, DRAC2 and TTC are very similar and considerably lower than other indicators.
Risk values denote the distribution of conflicts over the day and can be used (in their normalized form) as means for comparing different performance indicators.
u x xx xmax min
minjk
j j
jk j= -- (11)
where ujk and xjk are the normalized and calculated risk of rear-end collision in the kth 15-min time inter-val according to safety performance indicator j, re-spectively. x minj and x maxj are also the minimum and maximum risk values calculated within all 15-min time intervals according to safety performance indicator j, respectively.
Based on pair-wise t-test of average daily values of risk, the null hypotheses (the difference between the means for corresponding risk values is zero) is reject-ed at 5% significance level for all pairs of indicators except for DRAC1-DRAC2, DRAC2-TTC and TTC-DRAC1 (i.e. DRAC1, DRAC2 and TTC daily means represent the same values).
5.3 Analysis of risk levels
To more tangibly recognize the differences between safety performance indicators, the 15-min normalized risk values are categorized into clusters. Applying a two step analysis assuming a log likelihood distance measure and Schwarz’s Bayesian Criterion (BIC) [33] on all risk values, optimal number of clusters is three for all safety performance indicators. Fuzzy C-Means (FCM) clustering of the risk values associated with all time intervals and indicators into three levels (“High”, “Medium” and “Low” risk categories) are shown in Ta-ble 4. Each risk level in this Table is also represented by a colour ranging from light (Lower Risks) to dark (Higher Risks).
As depicted, the risk levels explained by some in-dicators are totally different from others. Table 5 sum-marizes the Dr values drawn from Equation 12, for all pairs of indicators. Greater values in this table repre-sent greater differences between related indicators in explaining rear-end collision risk. Moreover, shaded cells represent the pairs with the highest difference of risk levels, during the 24hr study. For instance, indica-tor SDI1 shows that the risk level is 0.76 levels differ-ent as average, compared to DRAC2.
6. DISCUSSION
There is a wide variety of safety performance indi-cators suitable for detecting conflicts in car following events, each of which addresses safety from a special aspect of kinematics. Empirically investigating the sim-ilarities between the indicators is of interest because it is not usually possible to find decisive mechanical re-lationships between them. The present study focused on indicators measurable by the ILD captured data in a freeway cross section, namely: time headway, Time to collision, proportion of stopping distance, decelera-tion rate to avoid collision (assuming that the available deceleration rate for the following vehicle follows a uni-form and a truncated normal distribution, separately) and stopping distance index (with the same so called assumptions). This research advocates the hypothesis that while a given interaction between two successive vehicles in a car following event is assessed to be safe in terms of a variety of performance indicators, it may be recognized as being risky according to the others.
Analysis of frequencies of unsafe events according to safety performance indicators showed that the num-ber of unsafe events detected during the 24-hr study is very different across different indicators (ranging from 0.3% of total events for DRAC1 and DRAC2 to more than 27% for SDI2). Unsafe events associated with all indicators are also unsafe according to both SDI1 and SDI2. In contrast there are a lot of events detected as unsafe according to stopping distance index while they are still safe based on all other indicators. This means that compared to other indicators, stopping distance index may be regarded as a considerably more conser-vative safety performance indicator.
Table 5- Average differences of risk levels between performance indicators
H TTC PSD DRAC1 DRAC2 SDI1 SDI2H 0 0.66 0.50 0.69 0.72 0.38 0.35
TTC 0 0.30 0.07 0.08 0.76 0.86PSD 0 0.31 0.30 0.60 0.65
DRAC1 0 0.03 0.80 0.85DRAC2 0 0.76 0.84SDI1 0 0.19SDI2 0

Promet – Traffic&Transportation, Vol. 26, 2014, No. 2, 139-149 147
A. R. Mamdoohi et al.: Comparative Analysis of Safety Performance Indicators Based on Inductive Loop Detector Data
Contrary to SDI, DRAC is not sensitive to the func-tion of distribution assumed for the available decelera-tion rate for the following vehicles; all unsafe events associated with DRAC2 are also unsafe based on DRAC1. Moreover, almost all unsafe events based on both DRACs are still unsafe based on TTC. So TTC and DRAC explain the events’ safety, very similarly. This implies that less TTC in freeway requires more decel-eration rate to avoid a rear-end collision. On the other hand in almost all cases where a vehicle following a slower moving vehicle needs harsh braking to avoid the collision, the time to collision is also less than the critical threshold.
Analyses indicate that there are many high-risk events according to headway which are not considered as risky based on TTC. This means that there have been many occasions in which headways are less than the threshold, but their time to collision is still suffi-cient to avoid a collision. Such cases mainly include those where the speed of the following vehicle is less than or equal to the speed of the leading vehicle.
In contrast almost all occasions when the event is not safe according to TTC, it may be regarded as a con-flict based on headway. This implies that in almost all cases, less time to collision corresponds to less time headways. A similar condition can be observed in com-paring TTC and PSD; most risky events based on TTC, are still conflicts detected by PSD.
It is worth noting that the findings imply that indica-tors showing considerably high frequencies of conflicts (SDI and headway) may be weakly correlated with real collisions, mainly because there may exist additional options for the road users, such as Braking of the fol-lowing vehicle to avoid collision with the leading ve-hicle, to avoid a collision. Thus, it can be argued that it is more difficult to predict the final outcome (crash) based on more conservative indicators.
Findings obtained from the frequency analysis of conflicts associated with different indicators, are also supported by rear-end collision risk analysis. Results indicate that the measured risk values associated with SDI are considerably higher in almost all consecutive 15-min time intervals compared to other indicators. Moreover, normalized values of risk associated with DRAC1, DRAC2 and TTC are not statistically different at a 95% confidence interval. This verifies that these indicators explain the rear-end collision risk in a very similar pattern.
Categorizing the normalized risks calculated in 15-min intervals into ordinal clusters (to address the situation from a safety perspective) supports the same patterns of findings. Compared to other indicators, considerably longer time intervals are shown to be in the most critical situation, if SDI is used to measure the rear-end collision risk. DRAC and TTC also show very similar risk clusters during the conduct of the analysis.
7. CONCLUSION
Different safety performance indicators are usu-ally applied in traffic conflict analyses. In this study the aim was to empirically investigate how different the safety performance indicators identify the conflicts in a traffic stream on a freeway section, under the uninterrupted flow. Safety performance indicators in-vestigated in this study were limited to time headway, time to collision, proportion of stopping distance, de-celeration rate to avoid collision and stopping distance index.
Analysis of empirical data indicated that SDI can be considered as the single most inclusive and conserva-tive indicator compared to others; not only all conflicts associated with all other indicators are unsafe accord-ing to SDI, but also a relatively great share of safe fol-lowing events according to other indicators are taken as conflicts according to SDI.
Risky events based on DRAC are not sensitive to the distribution function of available deceleration rate on the following vehicles. DRAC and TTC are very simi-lar indicators; almost all risky events based on TTC are also risky based on DRAC (and vice versa).
Comparison between H and TTC showed that in almost all risky events associated with TTC, headway is less than the critical threshold. However, there are considerable conflicts associated with headway which are still safe according to TTC. Comparison of PSD and TTC also provided the same results as H and TTC; al-most all risky events according to TTC are also risky associated with PSD.
Different safety performance indicators can be employed as controls in launching novel intelligent transportation systems aiming to convey the real-time collision risk levels to drivers (for instance via variable message signs). The present findings sug-gest that at a specific time, different risk levels may be expected to be provided as information to drivers, if different indicators are employed as controls. How-ever, the risk levels that are being communicated by the system to the drivers are likely to have small effects on driving behaviour unless the risk mes-sage corresponds to the risk drivers perceive in the driving environment. Investigating the degree of cor-respondence between the indicated risk by each performance indicator and the drivers’ subjective judg-ment regarding the existing rear-end collision risk at any occasion should be subject to analysis in future studies.
ACKNOWLEDGEMENT
The authors would like to thank Farshid Fariborzi and Mahmoud Dibaj at Andisheh Negaran KIA Co. for installing the sensors and obtaining the required data for conducting this research.

A. R. Mamdoohi et al.: Comparative Analysis of Safety Performance Indicators Based on Inductive Loop Detector Data
148 Promet – Traffic&Transportation, Vol. 26, 2014, No. 2, 139-149
REFERENCES
[1] Hauer E. Observational Before-After Studies in Road Safety. Emerald Group Publishing Limited; 1997. Avail-able from: http://www.amazon.com/dp/0080430538
[2] Lord D, Mannering F. The statistical analysis of crash-frequency data: A review and assessment of methodo-logical alternatives. Transportation Research Part A: Policy and Practice. June 2010;44(5):291–305. Avail-able from: http://www.sciencedirect.com/science/ar-ticle/pii/S0965856410000376
[3] Guido G, Saccomanno F, Vitale A, Astarita V, Festa D. Comparing Safety Performance Measures Obtained from Video Capture Data. Journal of Transportation En-
gineering. July 2011;137(7):481-491. Available from: http://ascelibrary.org/doi/abs/10.1061/%28ASCE%29TE.1943-5436.0000230
[4] Perkins SR, Harris JI. Criteria for Traffic Conflict Char-acteristics Signalized Intersections. Research Labo-ratories, General Motors Corporation; 1967. Available from: http://books.google.com/books?id=7-YxHAAA-CAAJ
[5] Amundsen FH, Hyden C. Proceedings of The First Workshop on Traffic Conflicts. Oslo, TTI, Oslo, Norway and LTH Lund, Sweden; 1977.
[6] Cunto FJC, Saccomanno FF. Microlevel Traffic Simula-tion Method for Assessing Crash Potential at Intersec-tions. 2007 [cited 2012 Jun 5]. Available from: http://trid.trb.org/view.aspx?id=802073
[7] Hauer E, Garder P. Research into the validity of the traffic conflicts technique. Accident Analysis & Pre-vention. Dec 1986;18(6):471–81. Available from: http://www.sciencedirect.com/science/article/pii/0001457586900205
[8] Davis GA, Hourdos J, Xiong H, Chatterjee I. Outline for a causal model of traffic conflicts and crashes. Acci-dent Analysis & Prevention. Nov 2011;43(6):1907–1919. Available from: http://www.sciencedirect.com/science/article/pii/S0001457511001205
[9] Laureshyn A. Application of automated video analysis to road user behaviour [PhD Thesis]. Sweden: Lund University; 2010.
[10] Gettman D, Head L. Surrogate Safety Measures From Traffic Simulation Models, Final Report. Federal Highway Administration (FHWA). Report No.: FHWA-RD-03-050; 2003. Available from: http://www.fhwa.dot.gov/publications/research/safety/03050/03050.pdf
[11] Cunto F. Assessing Safety Performance of Transporta-tion Systems using Microscopic Simulation [PhD The-sis]. Waterloo, Ontario: University of Waterloo; 2008.
[12] Pirdavani A, Brijs T, Bellemans T, Wets G. Evalua-tion of traffic safety at un-signalized intersections us-ing microsimulation: a utilization of proximal safety indicators. Advances in Transportation Studies. Nov 2010;22:43-50. Available from: http://trid.trb.org/view.aspx?id=1090852
[13] Laureshyn A, Svensson Å, Hydén C. Evaluation of traf-fic safety, based on micro-level behavioural data: Theo-retical framework and first implementation. Accident Analysis & Prevention. Nov 2010;42(6):1637–1646. Available from: http://www.sciencedirect.com/sci-ence/article/pii/S0001457510001041
[14] Minderhoud MM, Bovy PHL. Extended time-to-collision measures for road traffic safety assessment. Accident Analysis & Prevention. Jan 2001;33(1):89–97. Avail-able from: http://www.sciencedirect.com/science/ar-ticle/pii/S0001457500000191
[15] Vogel K. A comparison of headway and time to colli-sion as safety indicators. Accident Analysis & Pre-vention. May 2003;35(3):427–433. Available from: http://www.sciencedirect.com/science/article/pii/S0001457502000222
[16] Oh Ch, Oh J, Min J. Real-Time Detection of Hazardous Traffic Events on Freeways. Transportation Research Record: Journal of the Transportation Research Board. Dec 2010;2129:35–44. Available from: http://trb.
1
)استاديار دانشكده مهندسي عمران و محيط *اميررضا ممدوحي زيست، دانشگاه تربيت مدرس، تهران، ايران(
محسن فلاح زواره )دانشجوي دكتري، دانشكده مهندسي عمران و محيط زيست، دانشگاه تربيت مدرس، تهران، ايران(
كريستر هايدن )استاد بازنشسته، دانشگاه لوند سوئد( شگاه گديز ازمير تركيه(تروند نوردفيرن )استاديار دان
خلاصه
هاي هاي عملكردي ايمني بر مبناي داده تحليل تطبيقي شاخص
شناسگر حلقه القايي
هاي عملكردي مختلفي تشخيص تاكنون تداخلات جريان ترافيك بر اساس شاخصهاي مختلف در هاي بين شاخص اند. اين مطالعه تلاش دارد تا تفاوت داده شده
به عقب و تعيين خطر برخورد در يك جريان غيرمنقطع را تشخيص تداخلات جلو ساعته جريان ترافيك 42مورد بررسي قرار دهد. براي اين منظور اطلاعات خرد
وسيله نقليه( با استفاده از شناسگرهاي حلقه القايي نصب شده در 5566)شامل هاي عملكردي مختلف آوري گرديد. شاخص شهري جمع مقطعي از آزادراه بين
، نرخ (PSD)(، نسبت فاصله ديد توقف TTC(، زمان تا برخورد )H)سرفاصله زماني )براي (SDI)و شاخص فاصله توقف (DRAC)شتاب كاهشي براي اجتناب از برخورد
كار رفت.رخدادهاي صورت دوحالتي )ايمن/ناايمن( به گيري هر رخداد تعقيب به اندازههاي ناايمن مربوط به هر شاخص تشخيص و رخدادهاي ناايمن مشترك از نظر شاخص
هاي زماني خطرهاي برخورد جلو به عقب متفاوت شناسايي گرديدند. همچنين توزيعاي مقايسه شد. در دقيقه 56هاي زماني در بازه هاي بررسي شده از نظر انواع شاخص
بندي گرديد. اي ريسك در سه رده )كم، متوسط و زياد( دسته دقيقه 56نهايت مقادير SDIكه هاي آماري نشان دادند كه در حالي كاوي و روش هاي داده تكنيكتعداد كمي از TTCو DRACكارترين شاخص عملكردي ايمني است، محافظهكنند. تعداد معتنابهي از رخدادهاي ناايمن بر ي مشابه را ناايمن توصيف ميرخدادها
TTCو PSDايمن هستند. مقايسه TTCاساس سرفاصله وجود دارند كه هنوز از نظر نيز ناايمن PSDبر اساس TTCدهد كه تقريباً تمامي تداخلات مربوط به نيز نشان مي
هستند.
كلمات كليديايمني، سرفاصله، زمان تا برخورد، فاصله توقف، تداخل، هاي عملكردي شاخص
شناسگر حلقه القايي
Promet – Traffic&Transportation, Vol. 26, 2014, No. 2, 139-149 149
A. R. Mamdoohi et al.: Comparative Analysis of Safety Performance Indicators Based on Inductive Loop Detector Data
metapress.com/content/38081208638g3574/?genre=article&id=doi%3a10.3141%2f2129-05
[17] Heijer T, Wiersma E, Polak PH. Proposed safety criteria for traffic control on motorways. Safety Sci-ence. Jun 1997;26(1–2):141–154. Available from: http://www.sciencedirect.com/science/article/pii/S0925753597000350
[18] Transportation Research Board of the National Acade-mies. Highway Capacity Manual 2010. Washington DC, USA; 2010. Available from: http://books.trbbookstore.org/hcm10.aspx
[19] Mulder M, Abbink DA, Van Paassen MM, Mulder M. Design of a Haptic Gas Pedal for Active Car-Following Support. IEEE Transactions on Intelligent Transporta-tion System. Mar 2011;12(1):268 –279. Available from: http://ieeexplore.ieee.org/xpl/login.jsp?tp=&arnumber=5648353&url=http%3A%2F%2Fieeexplore.ieee.org%2Fstamp%2Fstamp.jsp%3Ftp%3D%26arnumber%3D5648353
[20] Hayward J. Near misses as a measure of safety at ur-ban intersections [Ph.D. thesis]. University Park, PA: Dept. of Civil Engineering, The Pennsylvania State Uni-versity; 1971.
[21] Svensson Å. A method for analysing the traffic process in a safety perspective [PhD Thesis]. Lund, Sweden: University of Lund; 1998.
[22] Sultan B, McDonald M. Assessing the safety ben-efit of automatic collision avoidance systems (During Emergency Braking Situations). Enhanced Safety of Vehicles. Nagoya, Japan; 2003. Available from: http://eprints.soton.ac.uk/75672/
[23] Horst R. Time-to-collision as a cue for decision-making in braking. VISION IN VEHICLES-III. 1991. Available from: http://trid.trb.org/view.aspx?id=347440
[24] Allen BL, Shin BT, Cooper PJ. Analysis of traffic con-flicts and collisions. Transportation Research Re-cord: Journal of the Transportation Research Board. 1978;(667):67–74. Available from: http://trid.trb.org/view.aspx?id=85806
[25] Cooper DF, Ferguson N. Traffic studies at T-junctions, a conflict simulation record. Traffic Engineering and Con-trol. July 1976;17(7):306-309. Available from: http://trid.trb.org/view.aspx?id=66554
[26] Archer J. Methods for the assessment and prediction of traffic safety at urban Intersections and their Ap-plication in Micro-simulation Modelling [PhD Thesis]. Stockholm, Sweden: Division of Transport and Logis-tics, Royal Institute of Technology, Kungliga Tekniska Högskolan; 2005.
[27] American Association of State Highway and Transpor-tation Officials (AASHTO). AASHTO Green Book, Policy on Geometric Design of Highways and Streets 2004. 5th ed. American Association of State Highway & Trans-portation; 2004. Available from: http://www.amazon.com/dp/1560512636
[28] Cunto FJC, Saccomanno FF. Microlevel Traffic Simula-tion Method for Assessing Crash Potential at Intersec-tions. 2007 [cited 2012 July 8]. Available from: http://trid.trb.org/view.aspx?id=802073
[29] Cunto F, Saccomanno FF. Calibration and valida-tion of simulated vehicle safety performance at sig-nalized intersections. Accident Analysis & Preven-tion. May 2008;40(3):1171–1179. Available from: http://www.sciencedirect.com/science/article/pii/S0001457508000055
[30] Oh Ch, Park S, Ritchie SG. A method for identifying rear-end collision risks using inductive loop detectors. Accident Analysis & Prevention. Mar 2006;38(2):295–301; Available from: http://www.sciencedirect.com/science/article/pii/S0001457505001570
[31] Annual Report on National Transportation Statistics (In Farsi). Tehran, Iran: Bureau of Information Technology, IRAN Road Maintenance & Transportation Organiza-tion, IRAN Ministry of Road and Transportation; 2011.
[32] Azimi M, Zhang Y. Categorizing Freeway Flow Conditions by Using Clustering Methods. Transportation Research Record: Journal of the Transportation Research Board. Dec 2010;2173:105–114. Available from: http://trb.metapress.com/content/d4402373p6x03550
[33] SPSS Inc. The SPSS TwoStep Cluster Component: A Scalable Component Enabling More Efficient Cus-tomer Segmentation. Technical Report. Chicago, IL.; 2001. Available from: http://www.spss.ch/up-load/1122644952_The%20SPSS%20TwoStep%20Cluster%20Component.pdf

A. R. Mamdoohi et al.: Comparative Analysis of Safety Performance Indicators Based on Inductive Loop Detector Data
150 Promet – Traffic&Transportation, Vol. 26, 2014, No. 2, 139-149