Embed Size (px)
Citation preview
Comparative Analysis of Temporal Decorrelation at P and L bands over Tropical forests :
EM Simulations & Results from Tower based Experiments
L. Villard1, A. Hamadi2, P. Borderies2, C. Albinet1, T. Koleck1 and T. Le Toan1
(1) Centre d'Etudes Spatiales de la Biosphère (CESBIO) – CNRS, UPS, CNES, IRD – 18 av. Edouard Belin, 31401 Toulouse (France) http://www.cesbio.ups-tlse.fr
(2) Office National d’Etudes et Recherches Aérospatiales (ONERA), Centre de Toulouse, 2 av. Edouard Belin, 31055 Toulouse (France) http://www.onera.fr
Centre d’Etudes Spatiales de la BIOsphèreToulouse – France
Context → Forest height and biomass estimation based on Pol-InSAR heights (cf. future L or P band spaceborne missions, esp. Biomass)
Objective → assess, anticipate and correct the effects of temporal decorrelation on repeat-pass Pol-InSAR coherences over tropical forests
Method analysis of temporal decorrelation, based on :→ Experimental data resulting from ground based scatterometers
([Tropi,Afri]Scat) EM simulations, using modeling of forest scattering
specifically design to perform sensitivity analysis on :● Forest & meteorological parameters (e.g veg. water content, wind)● Radar parameters (e.g frequency, incidence angle)
Contents
Outlines
Brief reminders on temporal decorrelation
Highlights on TropiScat and AfriScat experiments Focus on diurnal cycles at P & L results measured with TropiScat→
EM modeling : to better understand the underlying physics, anticipate and predict changes of configurations (radar, observed forest)
Comparative analysis : ● Experimental & simulated diurnal variations at P-band● Extension to L band
Relating P and L-bands temporal decorrelation
Temporal decorrelation...
Origins :forest changes (vegetation/ground) between SAR passes due to : exceptional events (meteorological, deforestation/degradation…) geophysical changes (diurnal/seasonal) displacements (wind conditions)
Effects : affects the magnitude of Pol-InSAR complex coherences, mostly considered as a linear and real factor : = tmp ● sys ● geo ● vol
but depending on its origins (e.g evapotranspiration, sub-canopy winds), the interferometric phase is also impacted
Dependent on Radar frequency, given :
the dielectric constant as function of VWC & f : ε = Ƥ( VWC, f )the impacts of displacements regarding wavelength+ set of scatterers involved (cf. scattering phase centers)
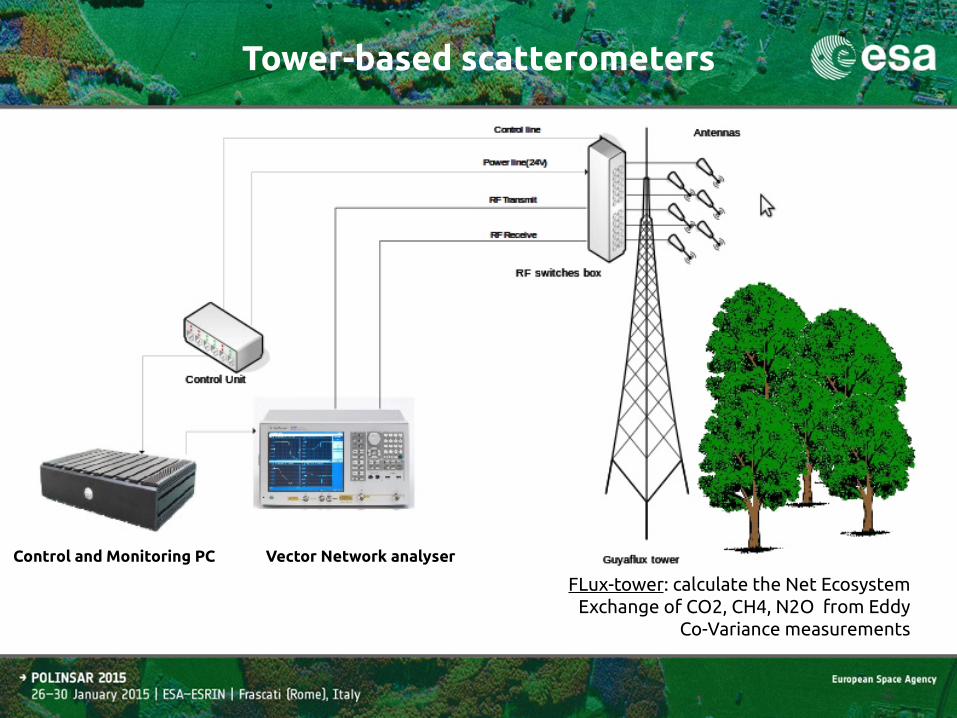
Tower-based scatterometers
FLux-tower: calculate the Net Ecosystem Exchange of CO2, CH4, N2O from Eddy
Co-Variance measurements
Vector Network analyserControl and Monitoring PC
Tower-based scatterometers
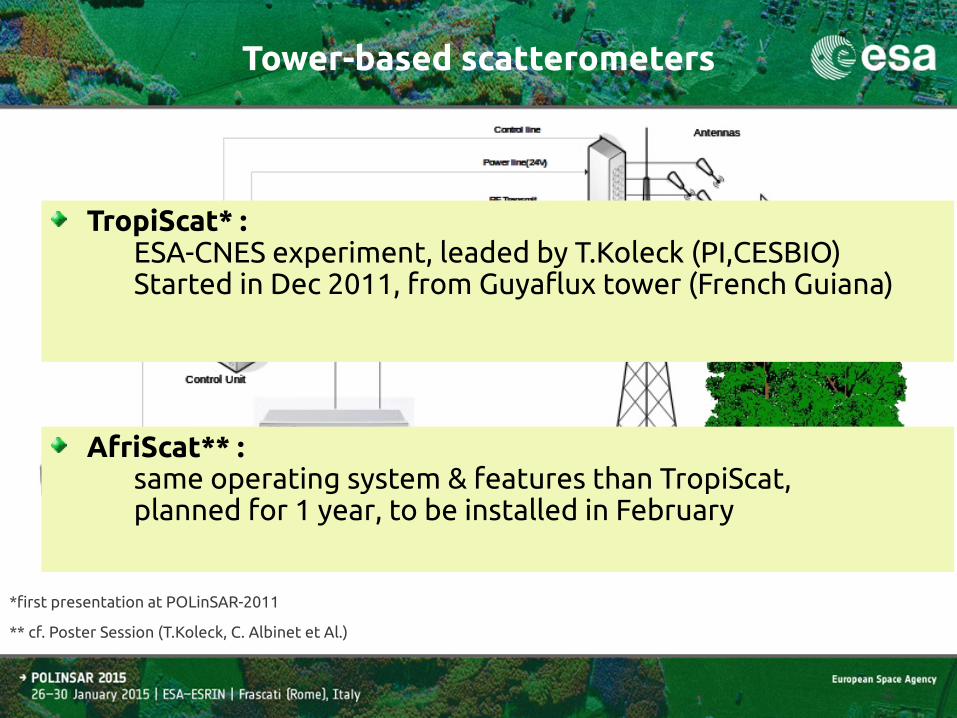
TropiScat* : ESA-CNES experiment, leaded by T.Koleck (PI,CESBIO)Started in Dec 2011, from Guyaflux tower (French Guiana)
AfriScat** : same operating system & features than TropiScat, planned for 1 year, to be installed in February
*first presentation at POLinSAR-2011
** cf. Poster Session (T.Koleck, C. Albinet et Al.)
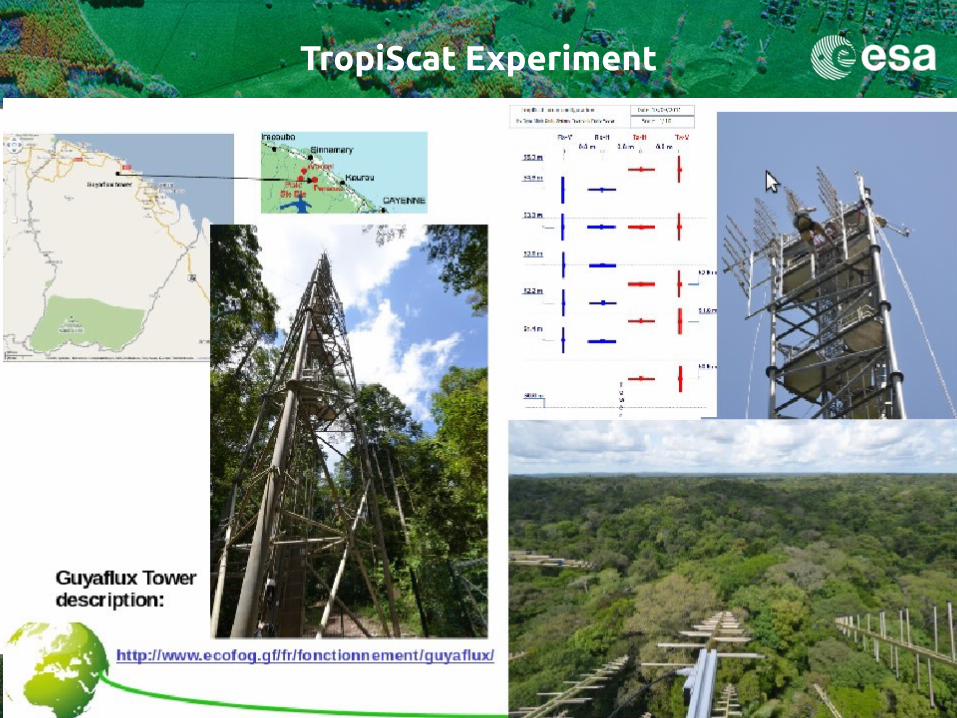
TropiScat Experiment
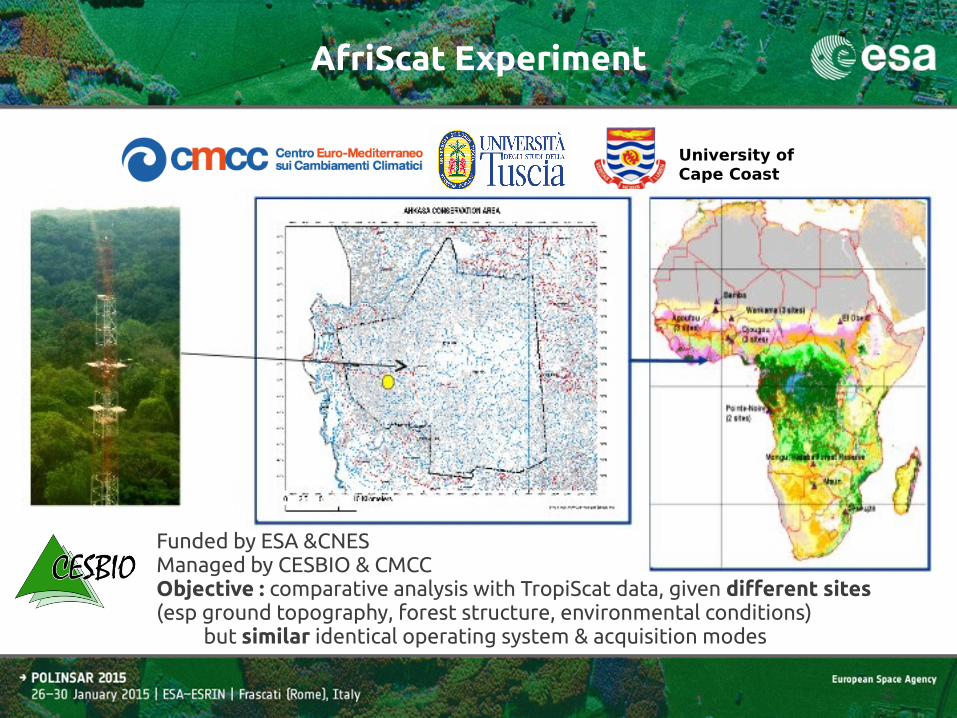
University of Cape Coast
AfriScat Experiment
Funded by ESA &CNESManaged by CESBIO & CMCCObjective : comparative analysis with TropiScat data, given different sites (esp ground topography, forest structure, environmental conditions)
but similar identical operating system & acquisition modes
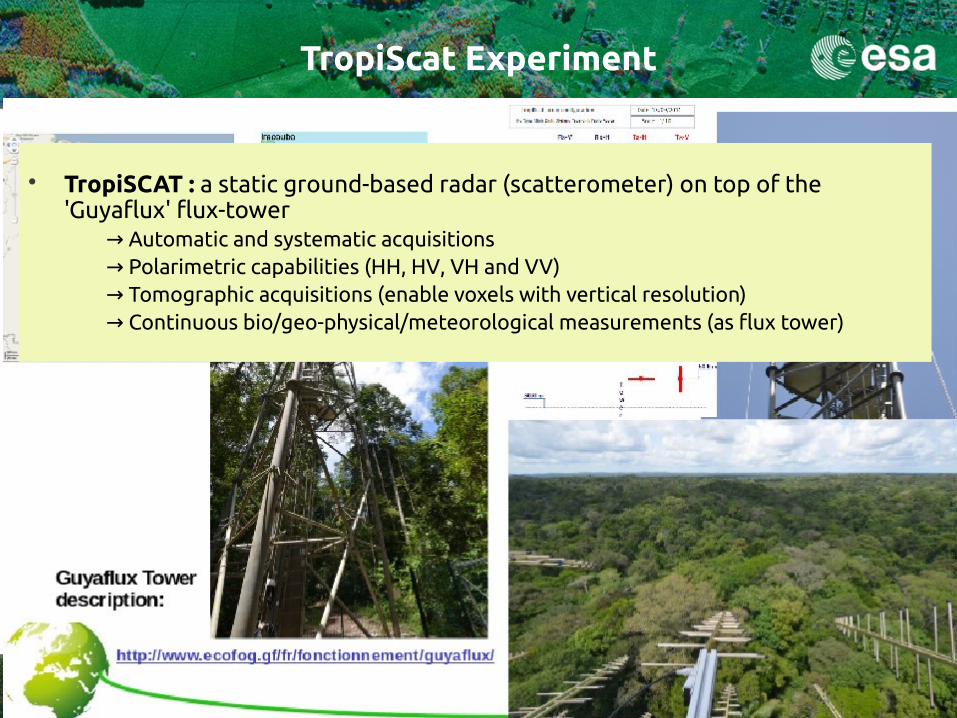
TropiScat Experiment
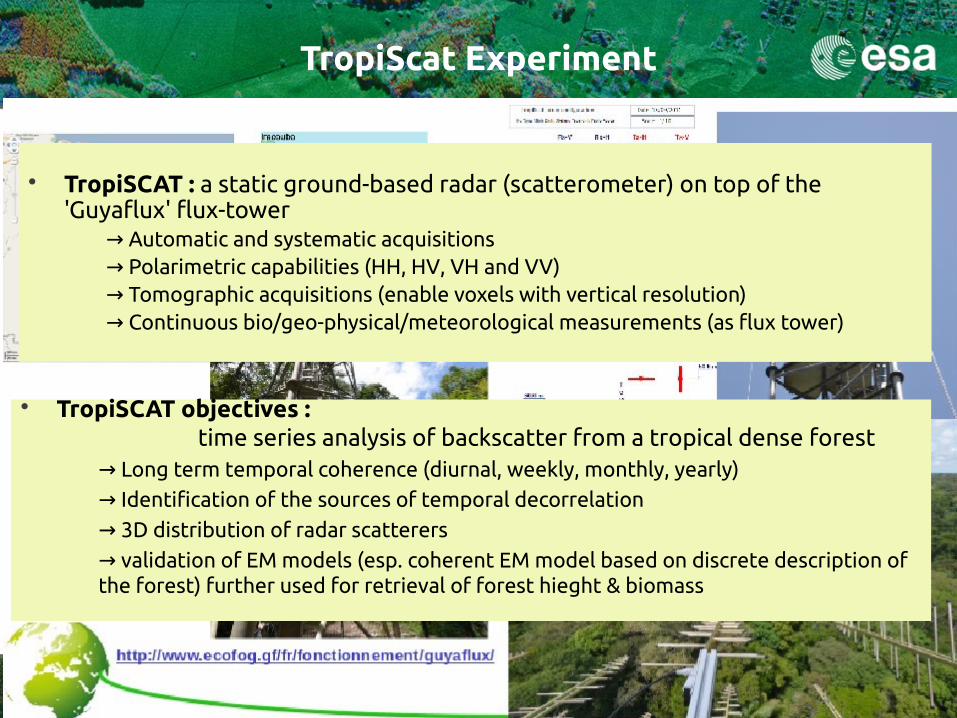
• TropiSCAT : a static ground-based radar (scatterometer) on top of the 'Guyaflux' flux-tower
→ Automatic and systematic acquisitions → Polarimetric capabilities (HH, HV, VH and VV) → Tomographic acquisitions (enable voxels with vertical resolution) → Continuous bio/geo-physical/meteorological measurements (as flux tower)
TropiScat Experiment
• TropiSCAT : a static ground-based radar (scatterometer) on top of the 'Guyaflux' flux-tower
→ Automatic and systematic acquisitions → Polarimetric capabilities (HH, HV, VH and VV) → Tomographic acquisitions (enable voxels with vertical resolution) → Continuous bio/geo-physical/meteorological measurements (as flux tower)
• TropiSCAT objectives : time series analysis of backscatter from a tropical dense forest
→ Long term temporal coherence (diurnal, weekly, monthly, yearly)
→ Identification of the sources of temporal decorrelation
→ 3D distribution of radar scatterers
→ validation of EM models (esp. coherent EM model based on discrete description of the forest) further used for retrieval of forest hieght & biomass
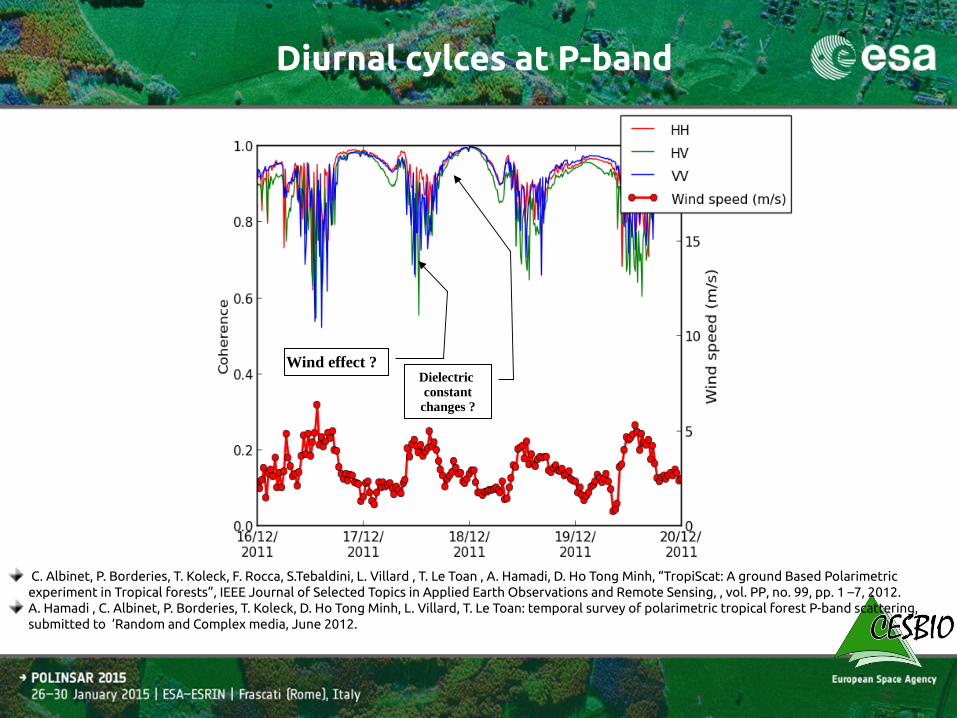
Wind effect ?Dielectric constant
changes ?
Diurnal cylces at P-band
C. Albinet, P. Borderies, T. Koleck, F. Rocca, S.Tebaldini, L. Villard , T. Le Toan , A. Hamadi, D. Ho Tong Minh, “TropiScat: A ground Based Polarimetric experiment in Tropical forests”, IEEE Journal of Selected Topics in Applied Earth Observations and Remote Sensing, , vol. PP, no. 99, pp. 1 –7, 2012. A. Hamadi , C. Albinet, P. Borderies, T. Koleck, D. Ho Tong Minh, L. Villard, T. Le Toan: temporal survey of polarimetric tropical forest P-band scattering, submitted to ‘Random and Complex media, June 2012.

Outlines
Brief reminders on temporal decorrelation
Highlights on TropiScat and AfriScat experiments Focus on diurnal cycles at P & L results measured with TropiScat→
EM modeling : to better understand the underlying physics, anticipate and predict changes of configurations (radar, observed forest)
Comparative analysis : ● Experimental & simulated diurnal variations at P-band● Extension to L band
Relating P and L-bands temporal decorrelation
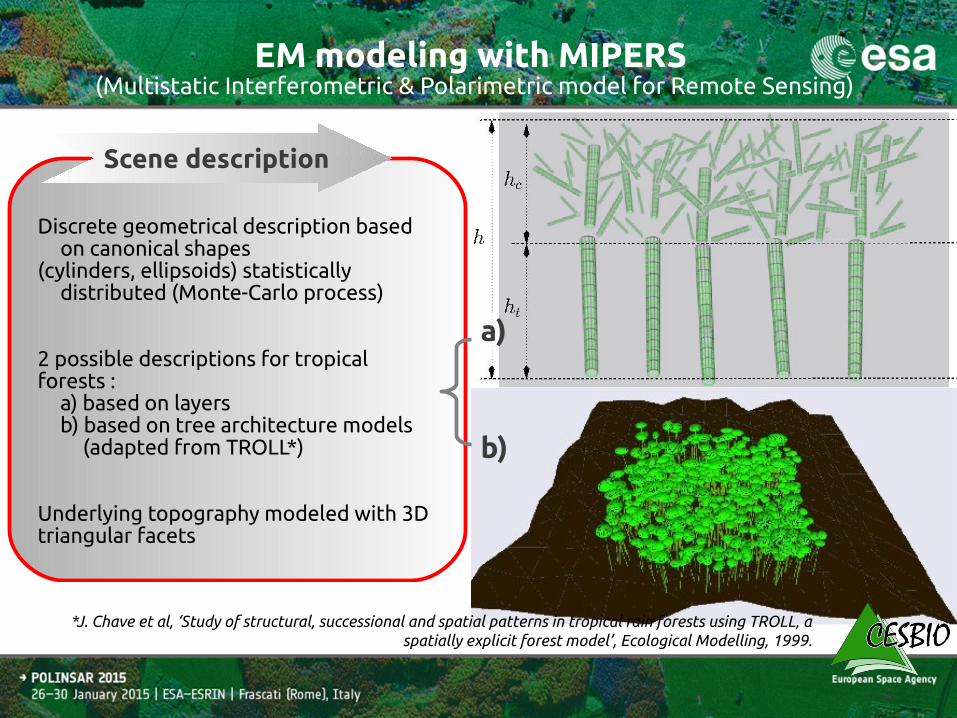
EM modeling with MIPERS (Multistatic Interferometric & Polarimetric model for Remote Sensing)
*J. Chave et al, ‘Study of structural, successional and spatial patterns in tropical rain forests using TROLL, a spatially explicit forest model’, Ecological Modelling, 1999.
Discrete geometrical description based on canonical shapes
(cylinders, ellipsoids) statistically distributed (Monte-Carlo process)
2 possible descriptions for tropical forests :
a) based on layersb) based on tree architecture models
(adapted from TROLL*)
Underlying topography modeled with 3D triangular facets
Scene description
a)
b)
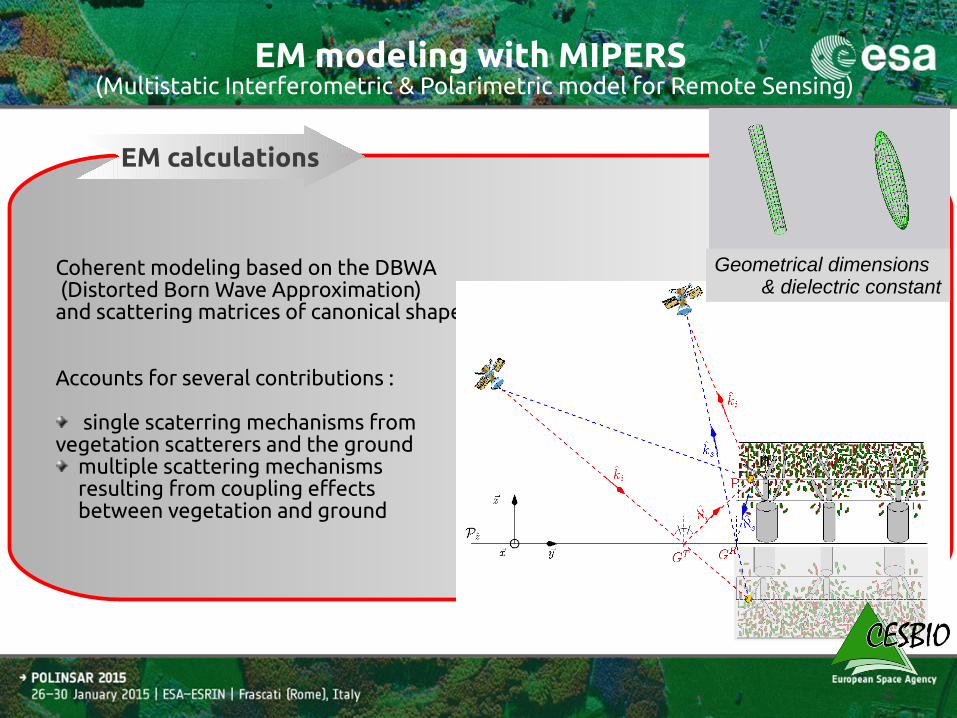
EM modeling with MIPERS (Multistatic Interferometric & Polarimetric model for Remote Sensing)
Coherent modeling based on the DBWA (Distorted Born Wave Approximation) and scattering matrices of canonical shapes
Accounts for several contributions :
single scaterring mechanisms from vegetation scatterers and the ground
multiple scattering mechanisms resulting from coupling effects between vegetation and ground
EM calculations
Geometrical dimensions & dielectric constant
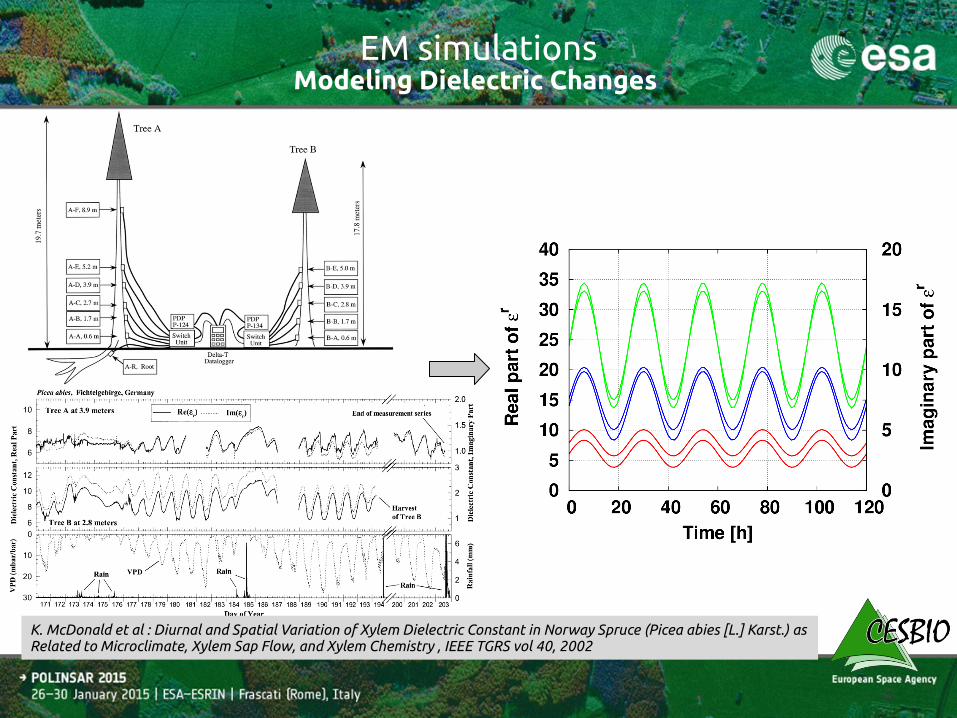
EM simulationsModeling Dielectric Changes
K. McDonald et al : Diurnal and Spatial Variation of Xylem Dielectric Constant in Norway Spruce (Picea abies [L.] Karst.) as Related to Microclimate, Xylem Sap Flow, and Xylem Chemistry , IEEE TGRS vol 40, 2002
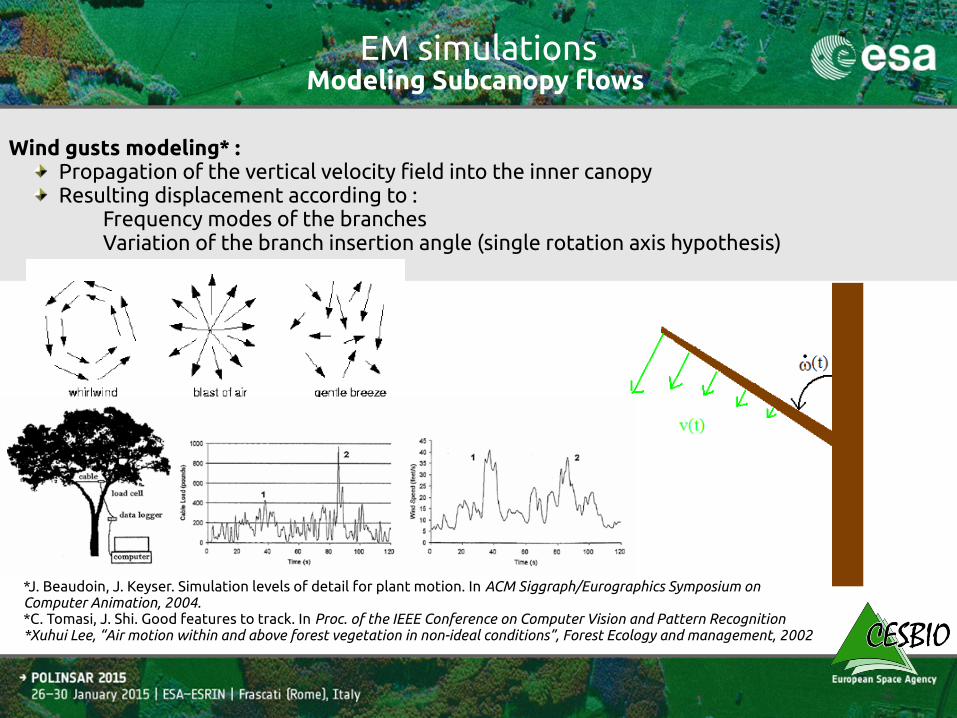
EM simulationsModeling Subcanopy flows
*J. Beaudoin, J. Keyser. Simulation levels of detail for plant motion. In ACM Siggraph/Eurographics Symposium on Computer Animation, 2004.*C. Tomasi, J. Shi. Good features to track. In Proc. of the IEEE Conference on Computer Vision and Pattern Recognition*Xuhui Lee, “Air motion within and above forest vegetation in non-ideal conditions”, Forest Ecology and management, 2002
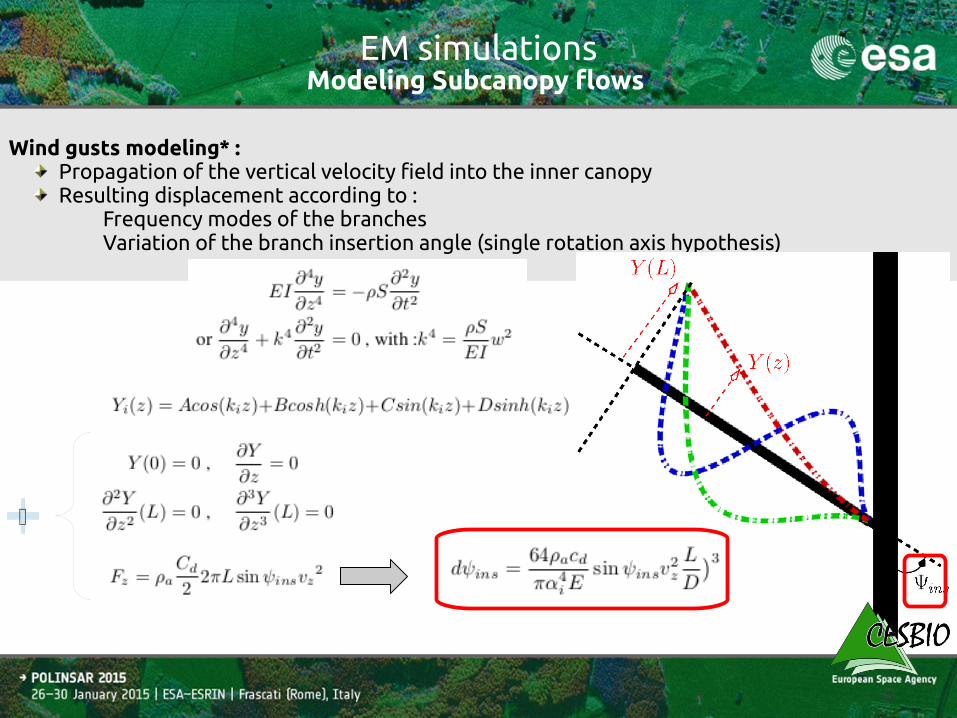
Wind gusts modeling* : Propagation of the vertical velocity field into the inner canopy Resulting displacement according to :
Frequency modes of the branchesVariation of the branch insertion angle (single rotation axis hypothesis)
EM simulationsModeling Subcanopy flows
Wind gusts modeling* : Propagation of the vertical velocity field into the inner canopy Resulting displacement according to :
Frequency modes of the branchesVariation of the branch insertion angle (single rotation axis hypothesis)

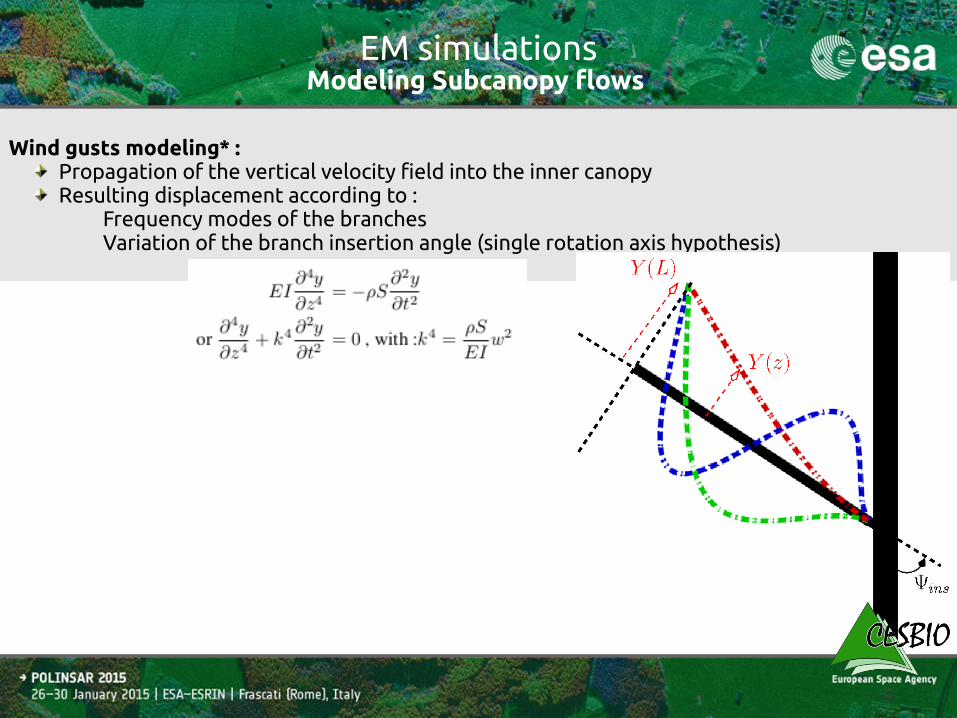
EM simulationsModeling Subcanopy flows
Wind gusts modeling* : Propagation of the vertical velocity field into the inner canopy Resulting displacement according to :
Frequency modes of the branchesVariation of the branch insertion angle (single rotation axis hypothesis)
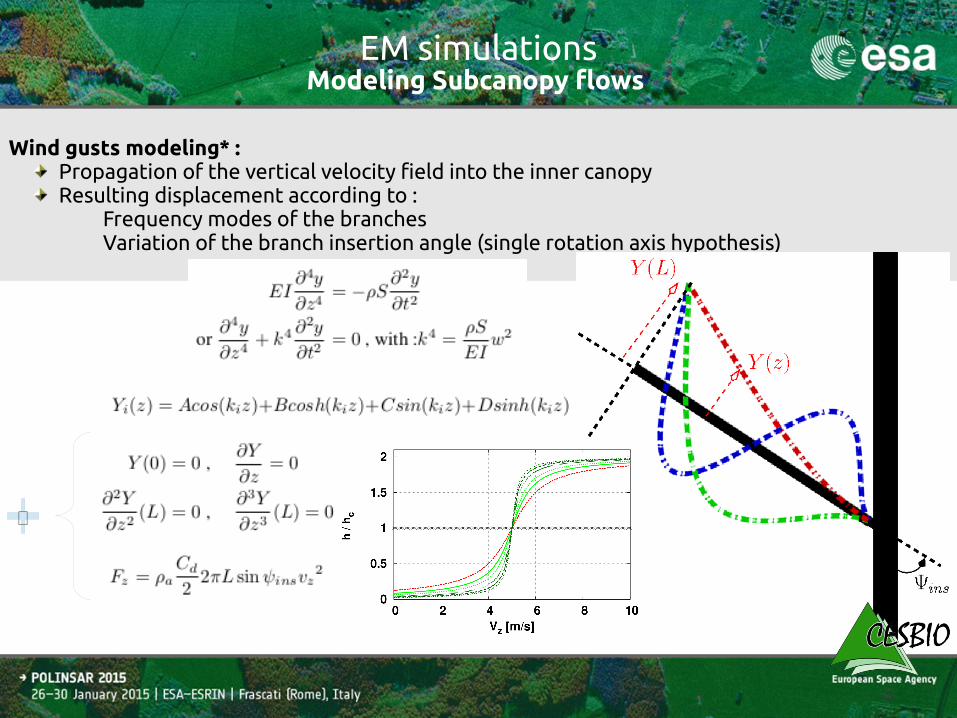
EM simulationsModeling Subcanopy flows
Wind gusts modeling* : Propagation of the vertical velocity field into the inner canopy Resulting displacement according to :
Frequency modes of the branchesVariation of the branch insertion angle (single rotation axis hypothesis)
ᄇ
EM simulationsModeling Subcanopy flows
Wind gusts modeling* : Propagation of the vertical velocity field into the inner canopy Resulting displacement according to :
Frequency modes of the branchesVariation of the branch insertion angle (single rotation axis hypothesis)
ᄇ
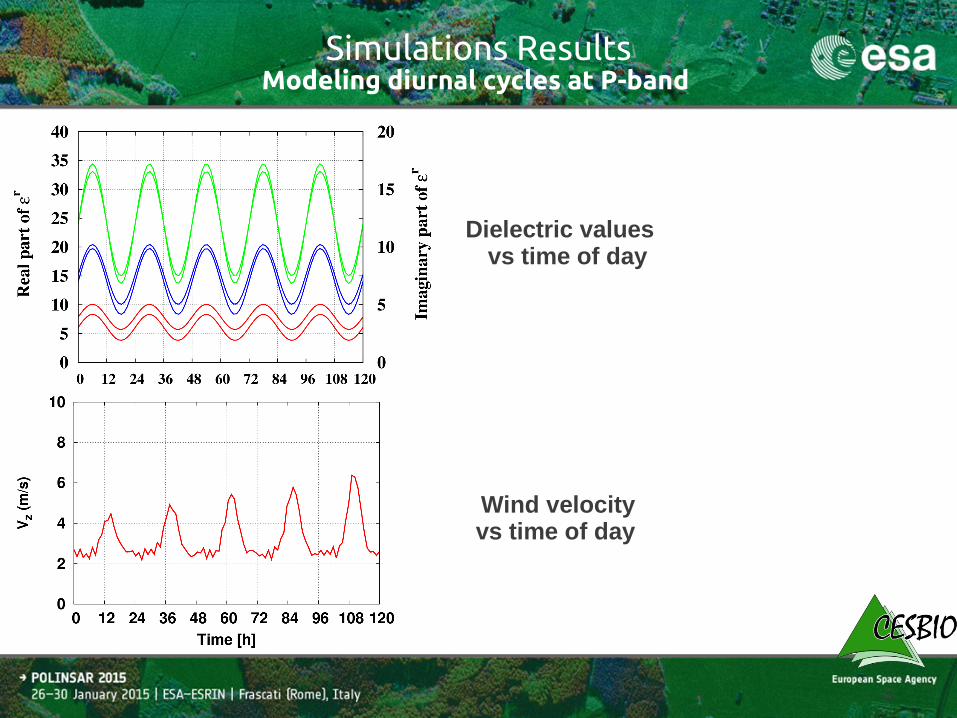
Simulations ResultsModeling diurnal cycles at P-band
Dielectric values vs time of day
Wind velocity vs time of day
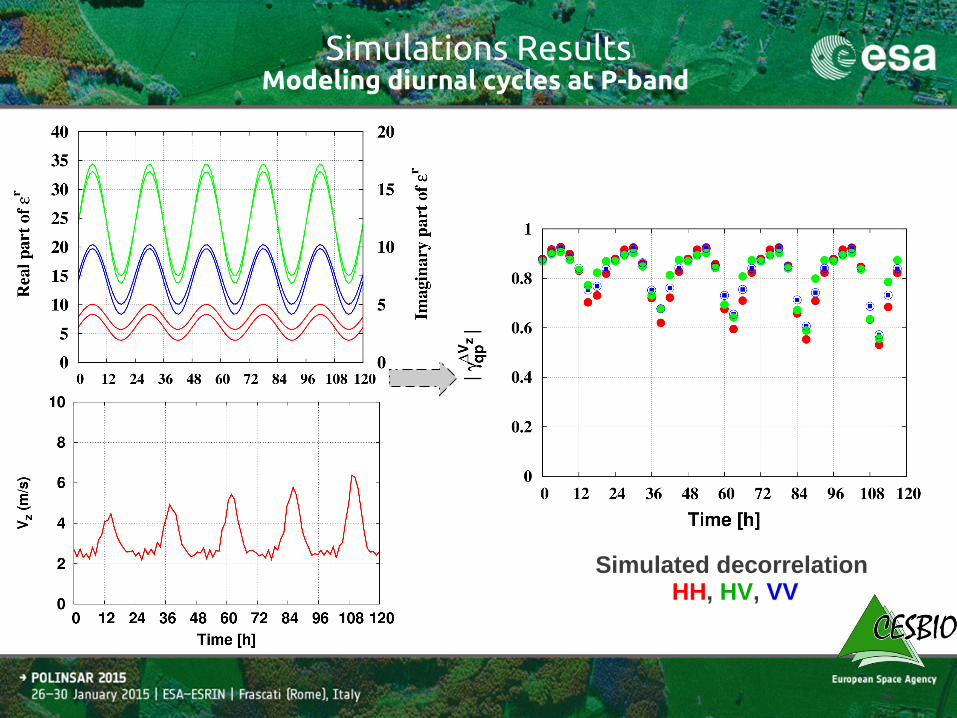
Simulations ResultsModeling diurnal cycles at P-band
Simulated decorrelation HH, HV, VV
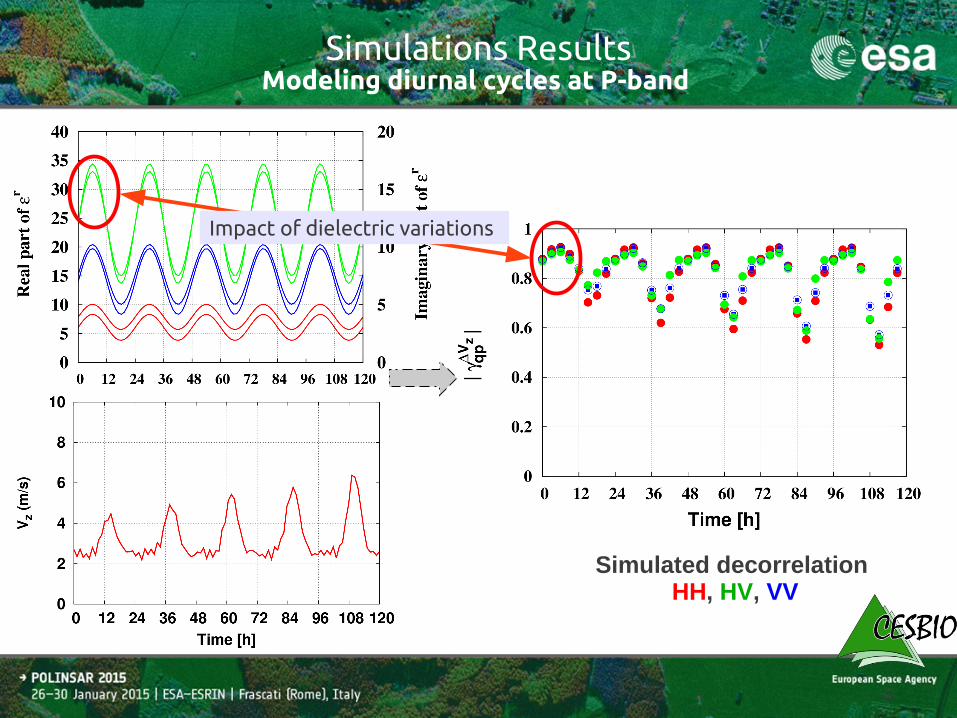
Simulations ResultsModeling diurnal cycles at P-band
Simulated decorrelation HH, HV, VV
Impact of dielectric variations
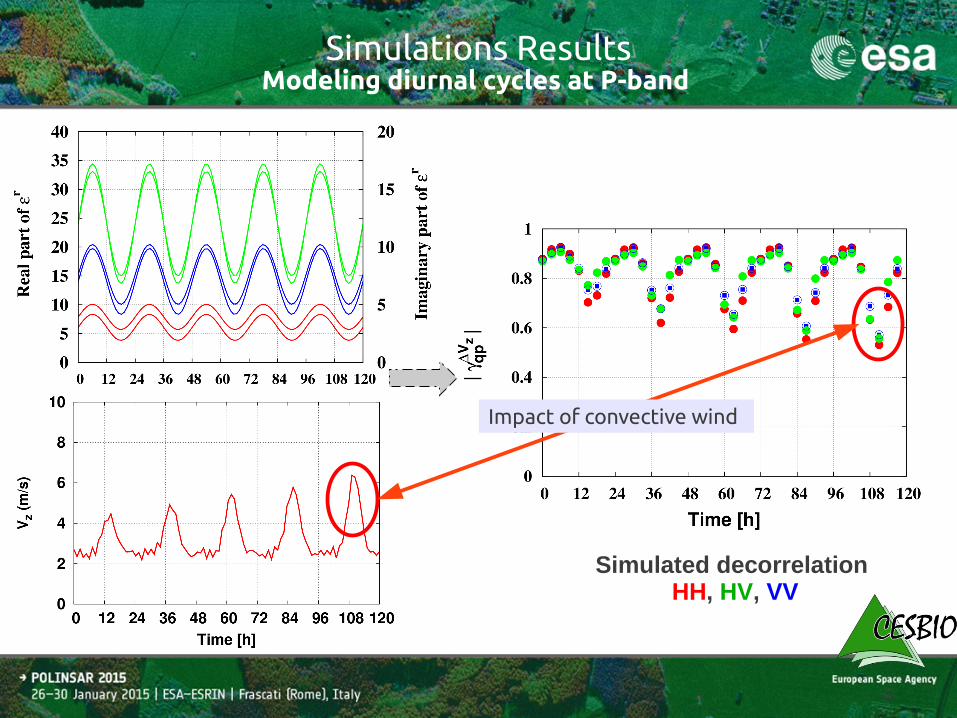
Simulations ResultsModeling diurnal cycles at P-band
Simulated decorrelation HH, HV, VV
Impact of convective wind
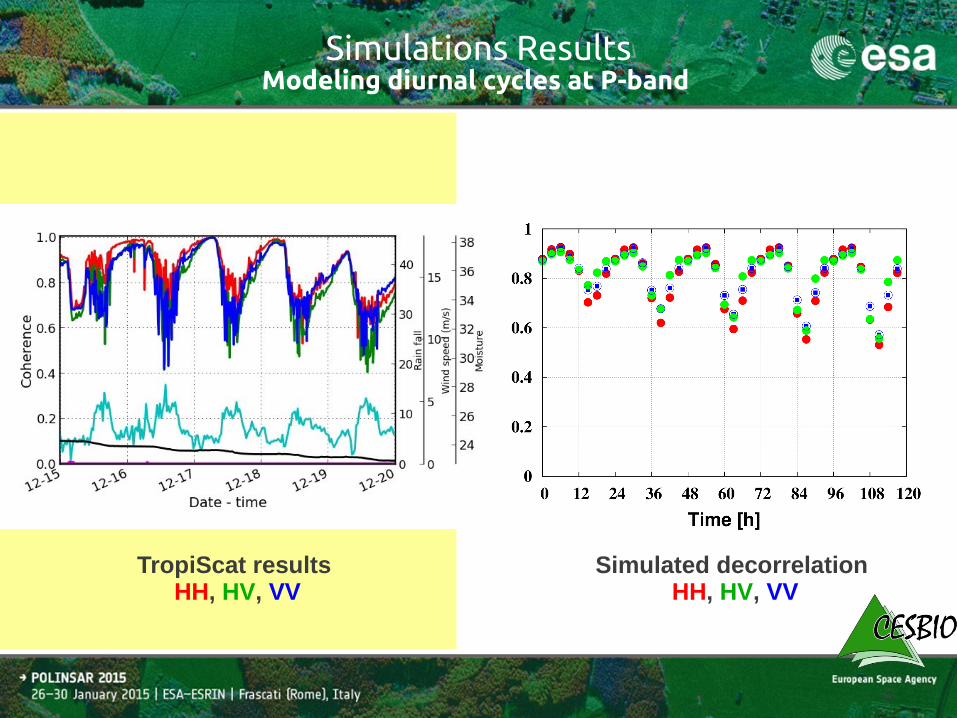
Simulations ResultsModeling diurnal cycles at P-band
Simulated decorrelation HH, HV, VV
TropiScat results HH, HV, VV
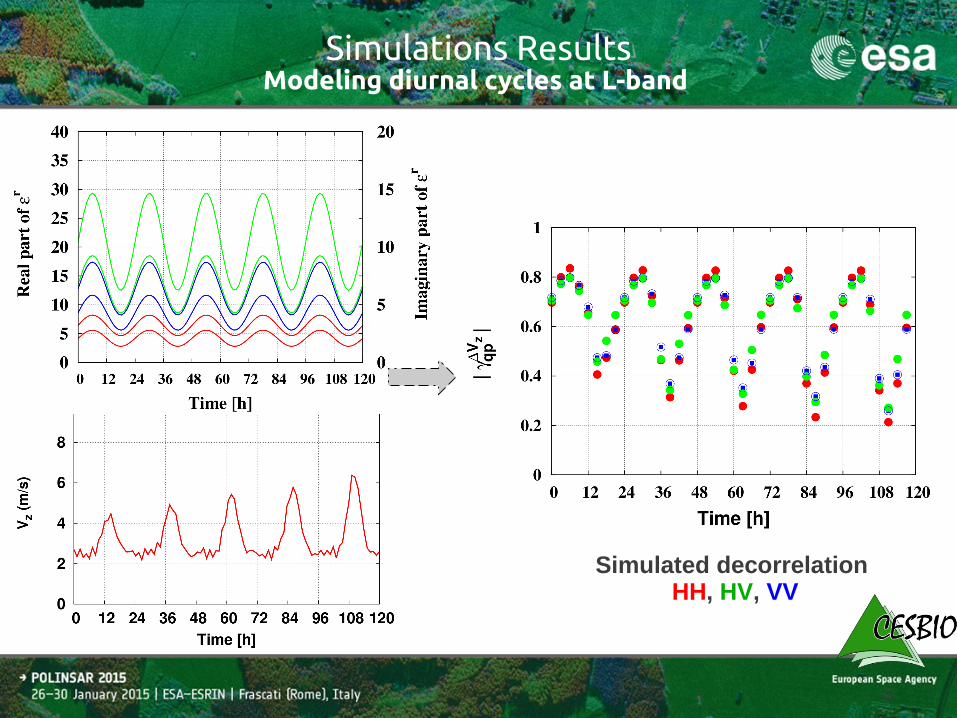
Simulations ResultsModeling diurnal cycles at L-band
Simulated decorrelation HH, HV, VV
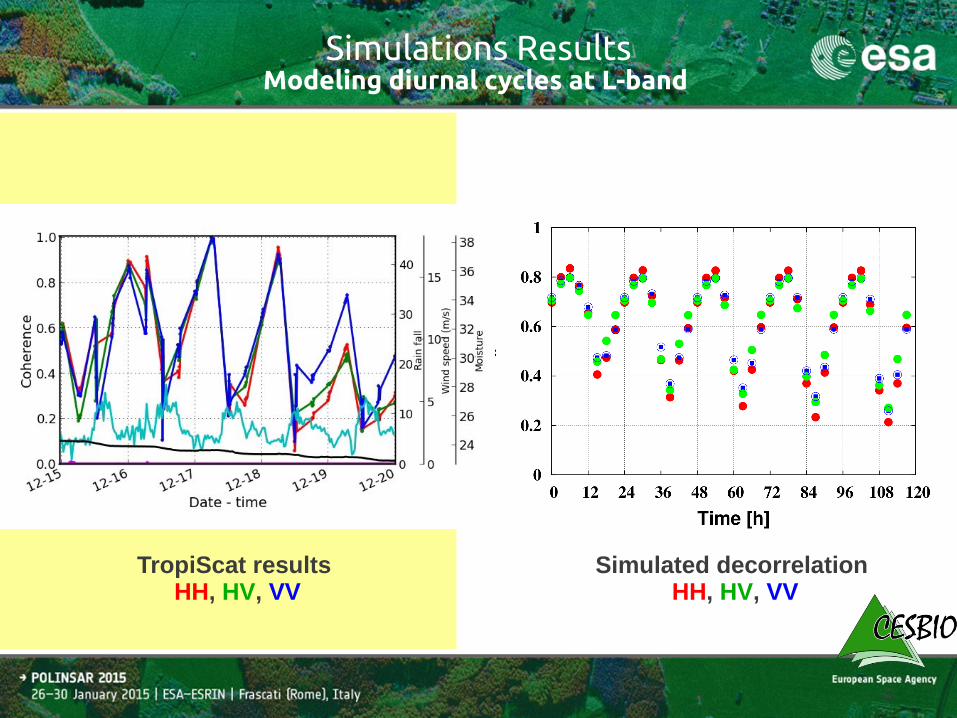
Simulations ResultsModeling diurnal cycles at L-band
Simulated decorrelation HH, HV, VV
TropiScat results HH, HV, VV
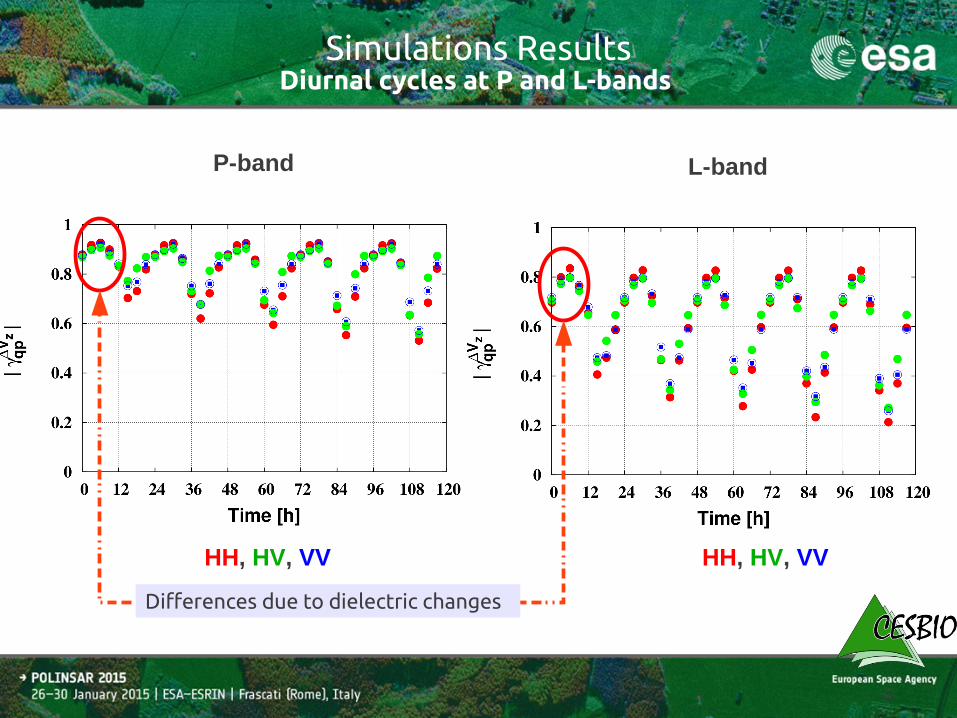
Simulations ResultsDiurnal cycles at P and L-bands
P-band L-band
HH, HV, VVHH, HV, VV
Differences due to dielectric changes
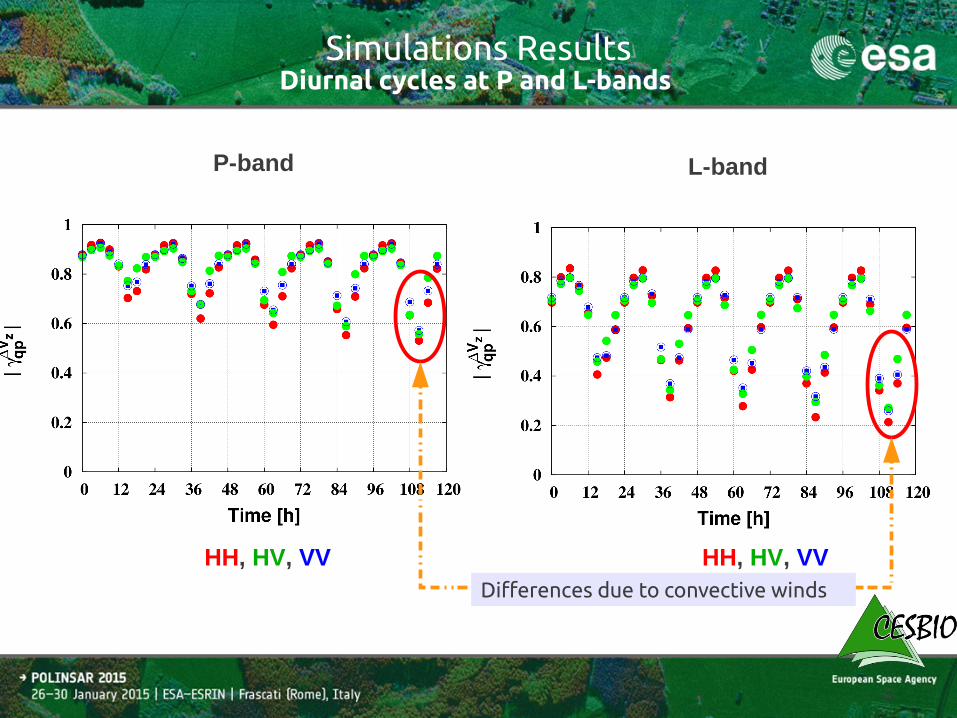
Simulations ResultsDiurnal cycles at P and L-bands
P-band L-band
HH, HV, VVHH, HV, VVDifferences due to convective winds
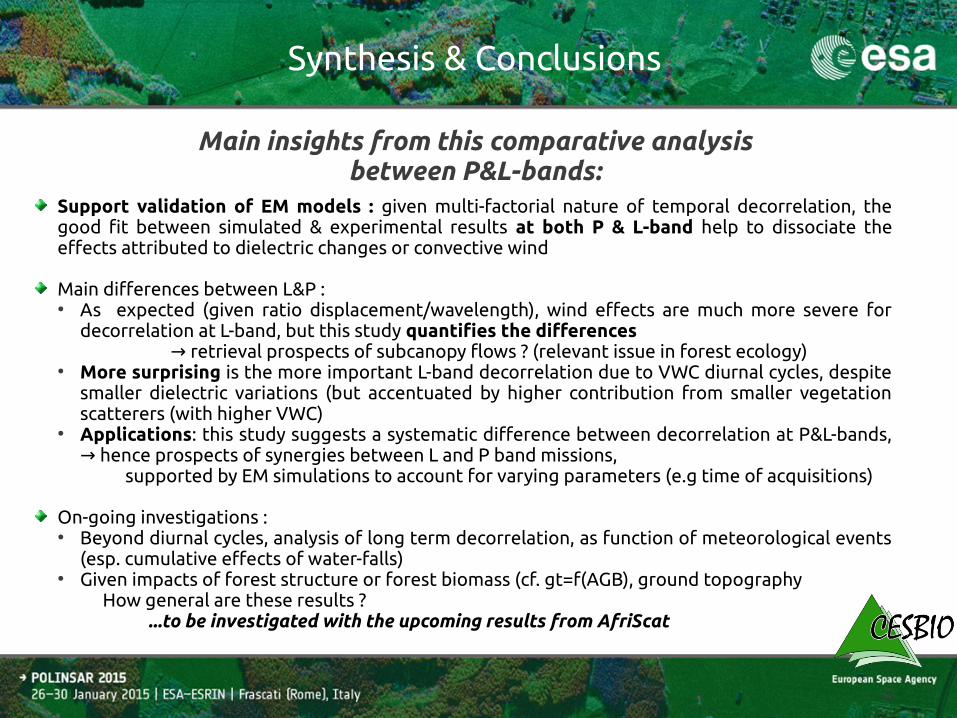
Synthesis & Conclusions
Support validation of EM models : given multi-factorial nature of temporal decorrelation, the good fit between simulated & experimental results at both P & L-band help to dissociate the effects attributed to dielectric changes or convective wind
Main differences between L&P :● As expected (given ratio displacement/wavelength), wind effects are much more severe for
decorrelation at L-band, but this study quantifies the differences → retrieval prospects of subcanopy flows ? (relevant issue in forest ecology)
● More surprising is the more important L-band decorrelation due to VWC diurnal cycles, despite smaller dielectric variations (but accentuated by higher contribution from smaller vegetation scatterers (with higher VWC)
● Applications: this study suggests a systematic difference between decorrelation at P&L-bands, hence prospects of synergies between L and P band missions, →
supported by EM simulations to account for varying parameters (e.g time of acquisitions)
On-going investigations : ● Beyond diurnal cycles, analysis of long term decorrelation, as function of meteorological events
(esp. cumulative effects of water-falls)● Given impacts of forest structure or forest biomass (cf. gt=f(AGB), ground topography
How general are these results ? ...to be investigated with the upcoming results from AfriScat
Main insights from this comparative analysis between P&L-bands: