Embed Size (px)
Citation preview
Online Publication Date: 1st Jun, 2012
Publisher: Asian Economic and Social Society
Comparison of Compressional-wave Velocity-depth Profiles from
Surface and Downhole Detectors in the Near Surface in the
Southeast Niger Delta, Nigeria
E. D. Uko (Department of Physics, Rivers State University of Science
and Technology, 500001Port Harcourt, Nigeria)
I.Tamunobereton-ari(Department of Physics, Rivers State University
of Science and Technology, 500001Port Harcourt, Nigeria)
V. B. Omubo-Pepple(Department of Physics, Rivers State University
of Science and Technology, 500001Port Harcourt, Nigeria)
Citation: E. D. Uko, I.Tamunobereton-ari, V. B. Omubo-Pepple (2012): “ Comparison of Compressional-
wave Velocity-depth Profiles from Surface and Downhole Detectors in the Near Surface in the Southeast
Niger Delta, Nigeria” International Journal of Asian Social Science, Vol.2, No.6, pp.869-880.
International Journal of Asian Social Science, 2(6), pp.869-880
869
Author (s)
E. D. Uko
Department of Physics, Rivers State University of Science and
Technology, 500001 Port
Harcourt, Nigeria. E-mail: [email protected]
I.Tamunobereton-ari
Department of Physics, Rivers
State University of Science and
Technology, 500001 Port Harcourt, Nigeria.
E-mail: [email protected]
V. B. Omubo-Pepple
Department of Physics, Rivers
State University of Science and Technology, 500001 Port
Harcourt, Nigeria.
Corresponding author:
E-mail: [email protected]
Comparison of Compressional-wave Velocity-depth
Profiles from Surface and Downhole Detectors in the Near
Surface in the Southeast Niger Delta, Nigeria
Abstract
Seismic refraction survey was conducted in the south-east
Niger Delta at 27 stations using surface-detectors, and
estimated near-surface compressional-wave velocities. At each
station, a borehole was drilled with casing down to 60-m depth,
and determined downhole compressional-wave velocities.
Compressional-wave velocities estimated by surface-detectors
were then compared with those estimated by downhole survey.
The acquisition system includes 0.2kg dynamite, 12-channel-
geophone and 11-channel-hydrophone receiver cables for
surface-detectors and downhole surveys respectively. The soil
layers in the Niger Delta has 2 distinct layers specified as
follows, namely, top weathered layer of loose sand sediments
with compressional wave velocity ranging from 213 to 763 ms-
1 with an average of 503ms
-1. Weathered-layer thickness ranges
from 2.7 to 16.50m, with an average of 8.1m. Consolidated-
layer compressional wave velocity ranges from 1580 to
1906ms-1
, with an average of 737ms-1
. A vertical velocity
gradient of 30.5s-1
was calculated for the area. There exists a 7-
18% difference between the velocities determined by the
surface-wave and downhole methods. The surface-wave
method gives spatially-averaged velocities along the line of
traverse coincident with the geophone spread. In the case of
downhole seismic method, velocities are specifically
applicable only to the borehole location. The implication is that
downhole measurements can be adversely affected by the local
borehole factors and conditions resulting from casings and
excessive collapse around the flushed-zone of the borehole.
The spatially-averaged velocities and depths estimated by
surface-detector method are more reliable for the site-specific
characterization for reflection seismology, geotechnical
engineering and groundwater.
Key words: Near surface, surface and downhole seismic, lithology, velocity-depth, Niger Delta
Nigeria.
Introduction
The near-surface is considered to be the low-
velocity shallow part of the earth’s subsurface.
Often it is that part of the subsurface in which
seismic coherent noise propagates. The
velocity-depth information of the near surface
can be applied in static corrections and for
shallow drilling programme for reflection work
(Uko et al, 1992, Eze et al., 2003). The base of
the low-velocity-layer (LVL) is thought to be
the water table (Okwueze, 1991),
and so the results of this project are useful in
water exploration, geotechnical, environmental
investigations, and for foundation laying for
bridges, dams, and high-rise buildings
(Karastathis and Papamarino, 1997).
Miller et al (1998) used refraction and
reflection data to investigate radioactive waste
site. Lanz et al (1998) also used refraction
tomography method to discover or image a
Comparison of Compressional-Wave .....
870
buried waste disposal site in Switzerland. The
LVL can also be used to obtain overburden
velocities, which are used to determine the
quality of the different lithologies. Refraction
seismic data can be used to map lateral velocity
variation as published by Palmer (1981).
Geophysicists use these weathered layer
parameters in the design of receiver-source
arrays for field filtering purposes. The
unconsolidated layer slows down and absorbs
seismic energy, and therefore increases the
travel time of the waves through it (Dobrin and
Savit, 1988). If this delay is not corrected for,
it can lead to errors in depth determinations.
Since the characteristics of the near surface are
of high relevance, it becomes necessary for
accurate determination of its characteristics.
The aim of this research is to compare the
results obtained from surface and downhole
detector arrays commonly used to determine
LVL characteristics.
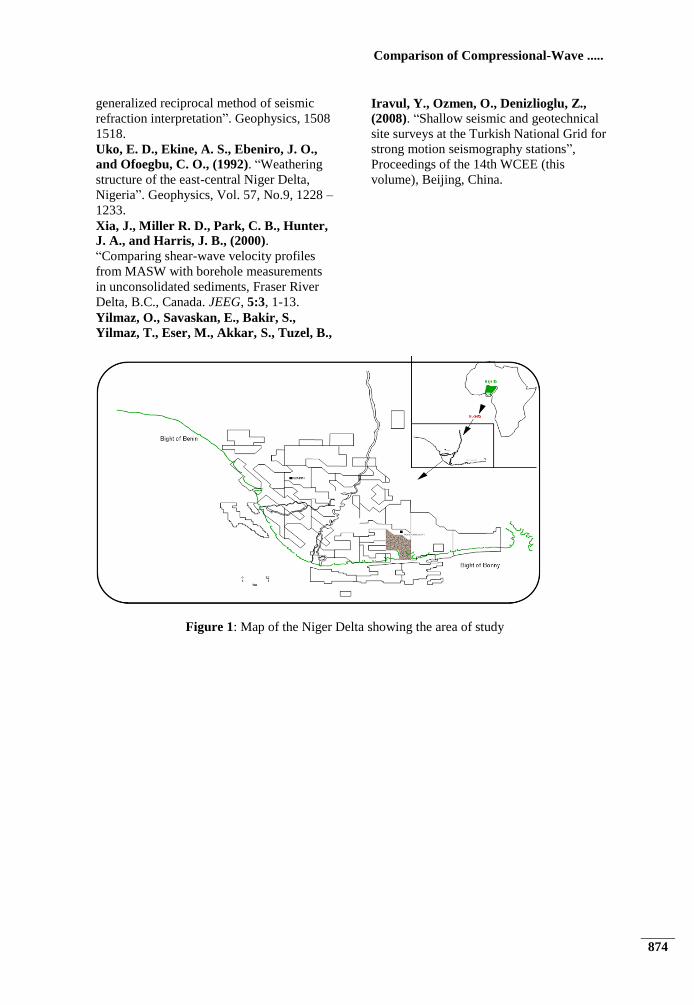
The Geology of the Niger Delta, Nigeria
This research was carried out in southeast Niger
Delta, Nigeria. The Niger Delta is situated at
the West African margin of the Gulf of Guinea,
which occupies an area located between
longitudes 4o – 9
o E, and latitudes 4
o – 6
o N
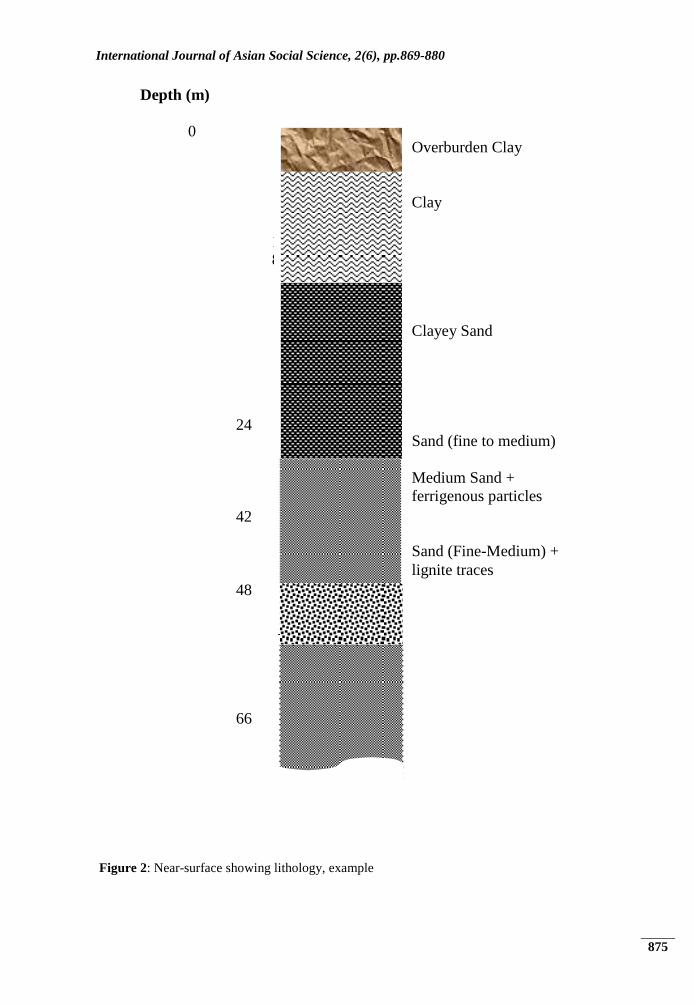
(Fig. 1). The lithostratigraphic section of the
near-surface in the area of survey is
demonstrated in Fig. 2. The topsoil is made up
predominantly of sand, clay, and clayey sand,
while the subsoil is geologically older and
physically denser and consolidated with depth.
The sand sequence varied in sizes from fine
through medium to coarse. The sand is an
admixture of the various sizes but demarcation
is based on the size as defined by Wentworth
scale of classification. The sequences
conformed to the typical deltaic depositional
environment.
Methodology and Data Acquisition
In this research, both surface and downhole
detectors were investigated at twenty seven
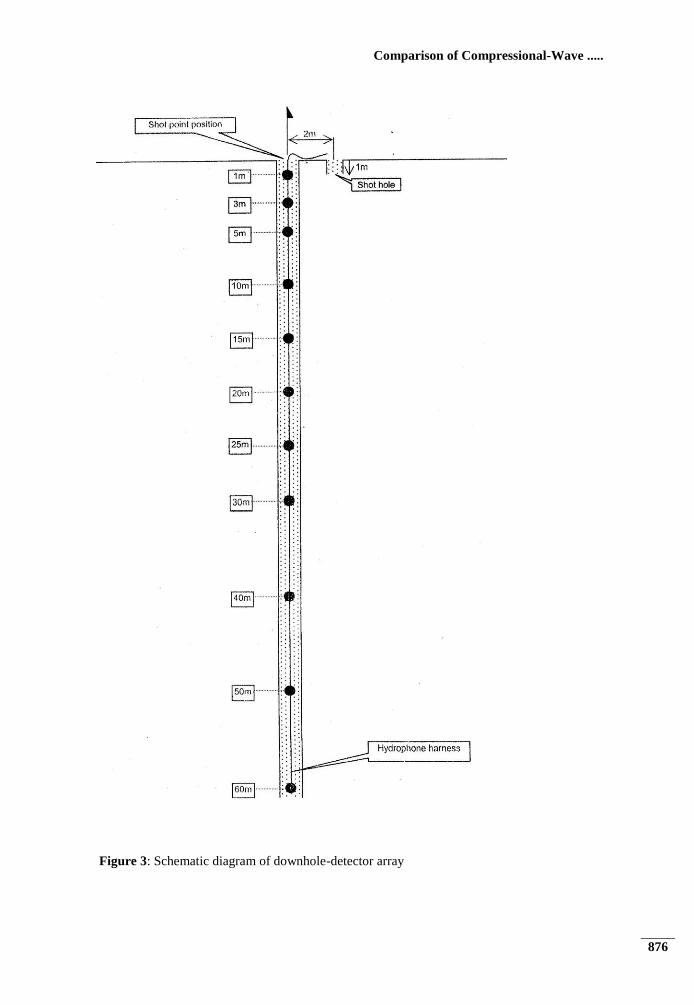
(27) sites randomly selected. In the downhole
detector array method, hydrophone spread
consisting of 11 hydrophones at specified
interval was lowered into a hole drilled to 66m
deep (Fig. 3). Plastic casings were installed in
the hole to prevent the hole from collapsing and
caving in. Before lowering the hydrophones
string, a heavy metal was attached to the end of
the hydrophone spread to stabilize it from
floating in the borehole water. The
hydrophones were spaced from the surface at
1m, 3m, 5m, 10m, 15m, 20m, 25m, 30m, 40m,
50m, and 60m (Fig. 3).
The hydrophones were linked with an electrical
cable to the recording instrument. Energy
source was 0.2kg dynamite charge buried 1m
deep beneath the earth surface from an offset
distance of 2m from the downhole position.
The charge was electrically controlled and
recorded by the McSeis-160MX recording
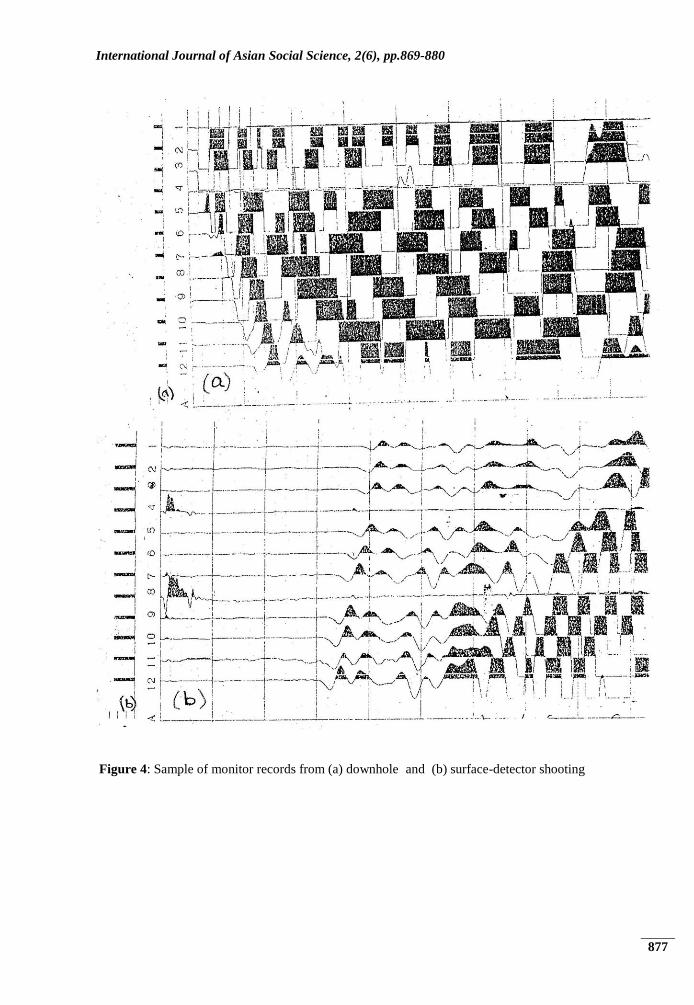
instrument. The observed traveltimes resulted
in first breaks as shown in a sample of the
monitor record (Fig. 4a). The picked
traveltimes were corrected to account for the
2m offset distance from the seismic source to
the borehole head. This correction
approximates as though the data were recorded
with the seismic source placed exactly at the
borehole head. The velocities were determined
from the corrected traveltimes.
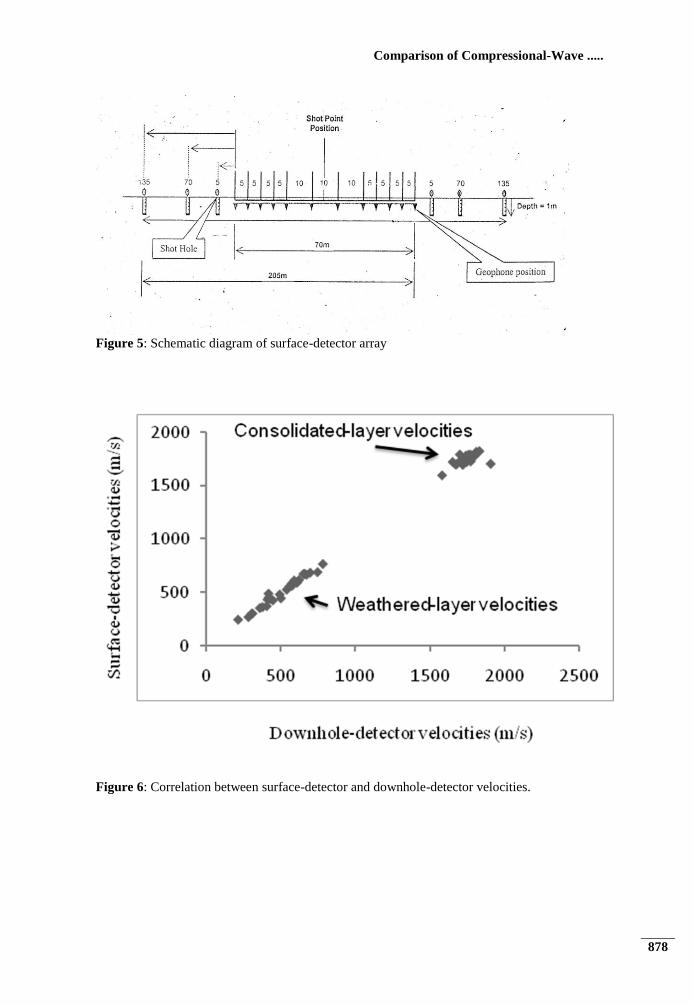
The field set-up of the survey for surface
detectors is as shown in Fig. 5. A spread of 12
geophones was planted on the earth’s surface.
The geophone distances were 5m, 5m, 5m, 5m,
5m, 10m, 10m, 10m, 5m, 5m, 5m, 5m, 5m.
Three separate shots, from offsets of 5m, 70m
and 135m, made up of 0.2kg dynamite charge
were fired. These 3 shots at the same receiver
location served as checks for accuracy. The
average results for both direct and reverse shots
represent the velocity structure of the location.
Fig. 4b shows a typical surface detector
refraction monitor record. The monitor records
were first edited for dead and noisy traces. The
arrival times were picked from the traces of the
monitor records and used to compute the
velocities.
Results and Discussion
The summary of the results are presented in
Tables 1 and 2, and Figs. 6-9. For downhole
detectors method, the velocity (Vo)dd for the
weathered layer varies between 213 ms-1
and
696 ms-1
with an average of 505 ms-1
. For the
International Journal of Asian Social Science, 2(6), pp.869-880
871
second layer, the consolidated layer velocity
(V1)dd varies between 1580 ms-1
and 1906 ms-1
with an average of 1738 ms-1
.
For surface-detectors method, the velocity for
the weathered layer velocity (Vo)sd varies
between 242 ms-1
and 763 ms-1
with an
average of 500 ms-1
. The consolidated layer
velocity (V1)sd varies between 1580 ms-1
and
1906 ms-1
with an average of 1736 ms-1
. Figs. 6
– 9 illustrate the relationship between surface
seismic and borehole seismic velocities. The
statistical correlation coefficient is 0.98 for
surface seismic weathered layer velocity Vo and
0.84 for borehole seismic consolidated layer
velocity V1. The mean absolute difference
between surface and borehole seismic
weathered velocity is 4.6, and that of
consolidated velocity is 1.6. Also the ratio of
average weathered velocity from surface
seismic to that from downhole seismic, while
the ratio of average consolidated velocity from
surface seismic to that from downhole seismic
have the same value of 0.99. These results
clearly demonstrate that there is very close
linear correlation between the two methods as
demonstrated in Fig. 6.
The downhole seismic velocities compare
closely with that of surface-detectors, Fig.6.
From the results, the difference between the
downhole seismic and surface seismic
velocities does not show systematic behaviour.
Velocities from one method may be more or
less than those obtained from the other method.
Xia et al. (2000) and Yilmaz et al. (2008) also
made the same conclusion.
The near-surface oil in the area of study has 2
distinct layers specified as follows: (a) Top
weathered layer of loose sand sediments with
compressional wave velocity ranging from 213
to 763 ms-1
, and (b) Subsoil coherent layer with
geologically older and physically consolidated
layer with compressional wave velocity in the
range 1580 – 1906ms-1
. Velocity was observed
to generally increase with depth, from surface
to the refractor and into the consolidated layer
continuum, at each location. Assuming a
homogeneous, isotropic horizontal layer model,
a vertical velocity gradient of 30.5s-1
was
calculated for the area.Weathered thickness
varies substantially in the area of study, ranges
between 2.7 and 16.50m with an average of
8.1m. This indicates the necessity to correct for
this layer when conducting reflection seismic
survey in the area. There was a good agreement
when these depths were compared against the 2
surface and downhole seismic methods. In
some locations, the difference was between
±4m, which is considered not disastrous to
resolution.
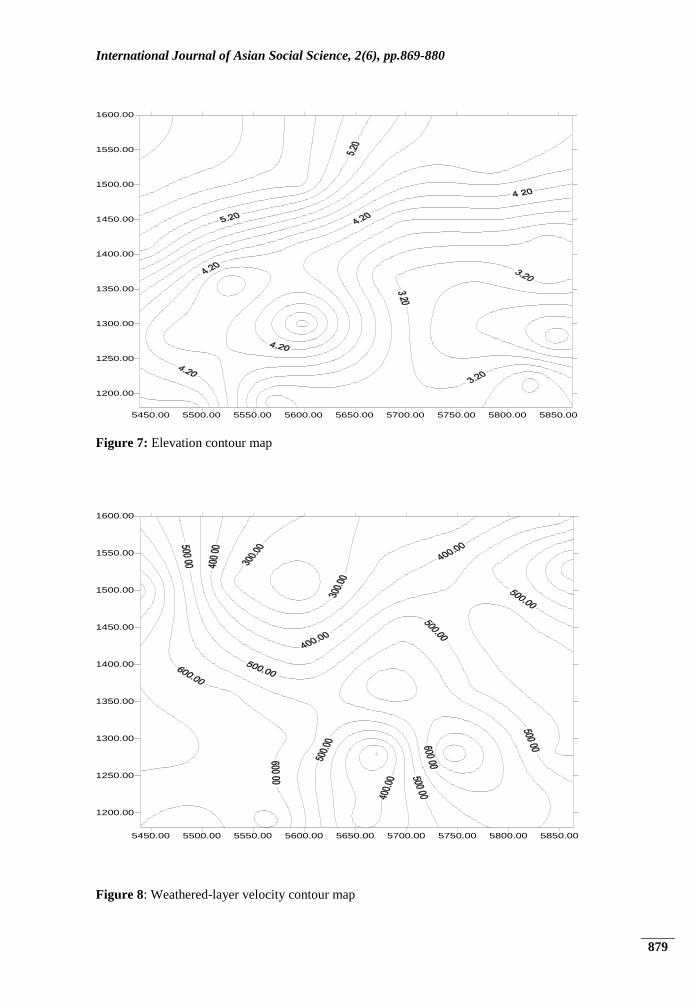
An isopach contour map, Fig. 7, was compared
with the elevation contour map for possible
trending between the two. The area of study is
on the flood plain where elevation and
weathered thickness are fairly uniform,
averaging 4.6m and 8.1m respectively. The
weathered velocity and consolidated velocity
contour maps (Figs. 8 and 9) do not show any
trending with elevation for the same reason of
uniform elevation of the study area.
There exists a 7-18% difference between the
velocities determined by the surface-wave and
downhole methods. The surface-wave method
gives spatially-averaged velocities along the
line of traverse coincident with the geophone
spread. In the case of downhole seismic
method, velocities are specifically applicable
only to the borehole location. The implication
is that downhole measurements can be
adversely affected by the local borehole factors
and conditions resulting from PVC casings and
excessive collapse around the flushed-zone of
the borehole. The spatially-averaged velocities
and depths estimated by surface-detector
method are more reliable for the site-specific
characterization for reflection seismology,
geotechnical engineering and groundwater.
Conclusion
Based on the results, the following conclusions
are made for the south-east Niger Delta:
Two (2) distinct layers make the near-surface
made up of mainly loose sand sediments.
Weathered thickness varies substantially in the
area of study, ranges between 2.7 and 16.50m
with an average of 8.1m.
Weathered-layer compressional wave velocity
ranges from 213 to 763 ms-1
, with an average of
503ms-1
. Consolidated-layer compressional
wave velocity ranges from 1580 to 1906ms-1
,
Comparison of Compressional-Wave .....
872
with an average of 737ms-1
. A vertical velocity
gradient of 30.5s-1
was calculated for the area.
Though both surface and downhole seismic
methods are linearly correlated, but the surface-
wave method gives spatially-averaged
velocities along the line of traverse coincident
with the geophone spread. Whereas in the case
of downhole seismic method, velocities are
specifically applicable only to the borehole,
which can be adversely affected by borehole
casings and excessive collapse around the
flushed-zone of the borehole. The spatially-
averaged velocities and depths estimated by
surface-detector method are more reliable for
the site-specific characterization for reflection
seismology, geotechnical engineering and
groundwater.
Acknowledgement
We thank Shell Petroleum Development
Company Nigeria Limited for providing us
with the data.
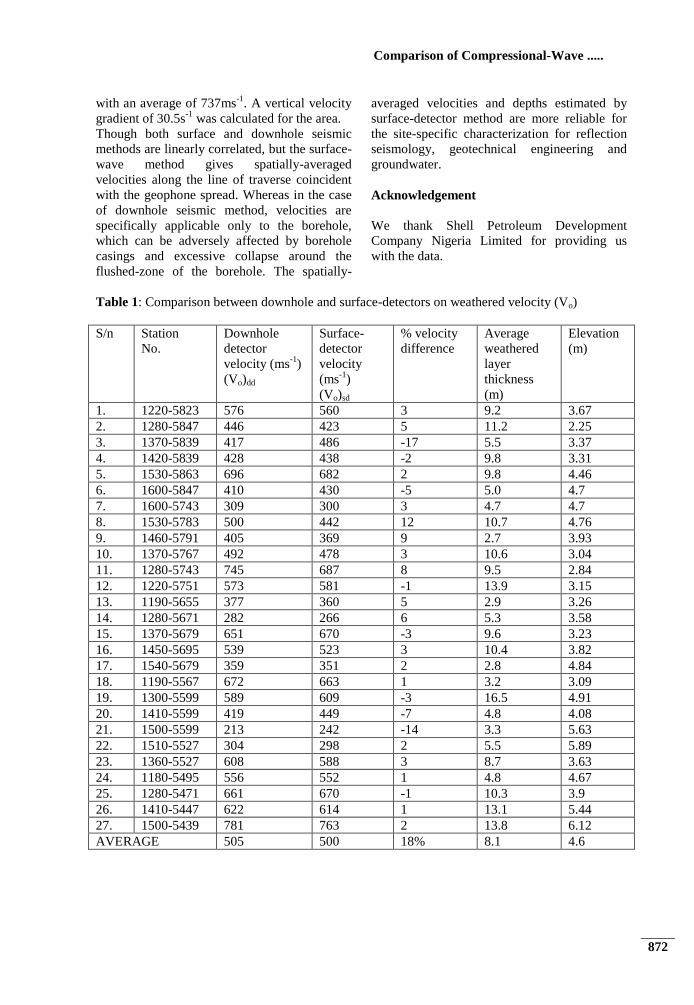
Table 1: Comparison between downhole and surface-detectors on weathered velocity (Vo)
S/n Station
No.
Downhole
detector
velocity (ms-1
)
(Vo)dd
Surface-
detector
velocity
(ms-1
)
(Vo)sd
% velocity
difference
Average
weathered
layer
thickness
(m)
Elevation
(m)
1. 1220-5823 576 560 3 9.2 3.67
2. 1280-5847 446 423 5 11.2 2.25
3. 1370-5839 417 486 -17 5.5 3.37
4. 1420-5839 428 438 -2 9.8 3.31
5. 1530-5863 696 682 2 9.8 4.46
6. 1600-5847 410 430 -5 5.0 4.7
7. 1600-5743 309 300 3 4.7 4.7
8. 1530-5783 500 442 12 10.7 4.76
9. 1460-5791 405 369 9 2.7 3.93
10. 1370-5767 492 478 3 10.6 3.04
11. 1280-5743 745 687 8 9.5 2.84
12. 1220-5751 573 581 -1 13.9 3.15
13. 1190-5655 377 360 5 2.9 3.26
14. 1280-5671 282 266 6 5.3 3.58
15. 1370-5679 651 670 -3 9.6 3.23
16. 1450-5695 539 523 3 10.4 3.82
17. 1540-5679 359 351 2 2.8 4.84
18. 1190-5567 672 663 1 3.2 3.09
19. 1300-5599 589 609 -3 16.5 4.91
20. 1410-5599 419 449 -7 4.8 4.08
21. 1500-5599 213 242 -14 3.3 5.63
22. 1510-5527 304 298 2 5.5 5.89
23. 1360-5527 608 588 3 8.7 3.63
24. 1180-5495 556 552 1 4.8 4.67
25. 1280-5471 661 670 -1 10.3 3.9
26. 1410-5447 622 614 1 13.1 5.44
27. 1500-5439 781 763 2 13.8 6.12
AVERAGE 505 500 18% 8.1 4.6
International Journal of Asian Social Science, 2(6), pp.869-880
873
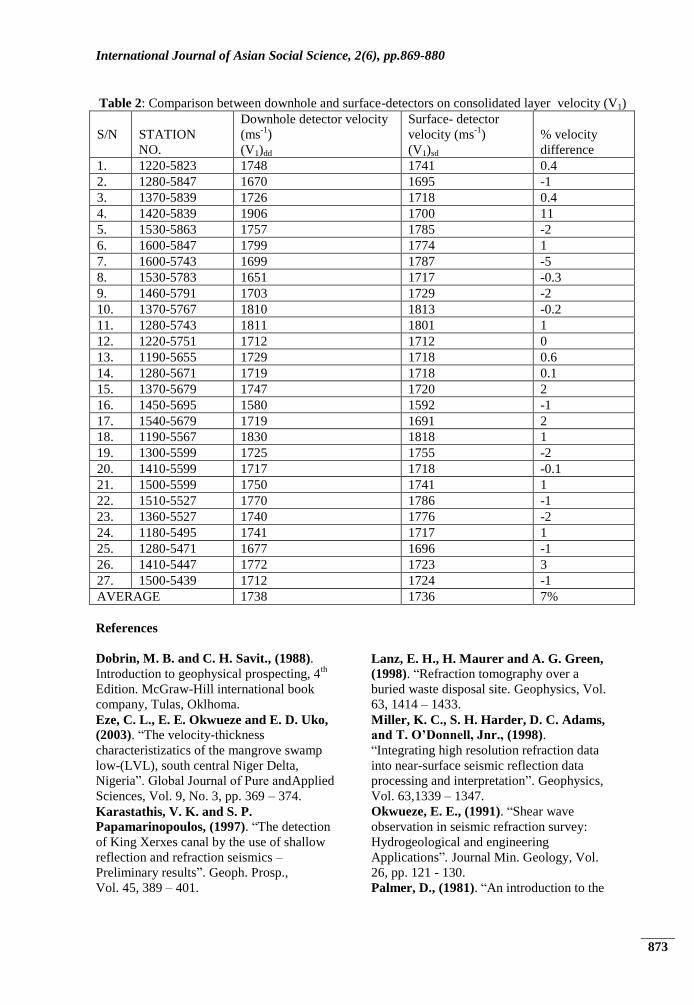
Table 2: Comparison between downhole and surface-detectors on consolidated layer velocity (V1)
S/N
STATION
NO.
Downhole detector velocity
(ms-1
)
(V1)dd
Surface- detector
velocity (ms-1
)
(V1)sd
% velocity
difference
1. 1220-5823 1748 1741 0.4
2. 1280-5847 1670 1695 -1
3. 1370-5839 1726 1718 0.4
4. 1420-5839 1906 1700 11
5. 1530-5863 1757 1785 -2
6. 1600-5847 1799 1774 1
7. 1600-5743 1699 1787 -5
8. 1530-5783 1651 1717 -0.3
9. 1460-5791 1703 1729 -2
10. 1370-5767 1810 1813 -0.2
11. 1280-5743 1811 1801 1
12. 1220-5751 1712 1712 0
13. 1190-5655 1729 1718 0.6
14. 1280-5671 1719 1718 0.1
15. 1370-5679 1747 1720 2
16. 1450-5695 1580 1592 -1
17. 1540-5679 1719 1691 2
18. 1190-5567 1830 1818 1
19. 1300-5599 1725 1755 -2
20. 1410-5599 1717 1718 -0.1
21. 1500-5599 1750 1741 1
22. 1510-5527 1770 1786 -1
23. 1360-5527 1740 1776 -2
24. 1180-5495 1741 1717 1
25. 1280-5471 1677 1696 -1
26. 1410-5447 1772 1723 3
27. 1500-5439 1712 1724 -1
AVERAGE 1738 1736 7%
References
Dobrin, M. B. and C. H. Savit., (1988).
Introduction to geophysical prospecting, 4th
Edition. McGraw-Hill international book
company, Tulas, Oklhoma.
Eze, C. L., E. E. Okwueze and E. D. Uko,
(2003). “The velocity-thickness
characteristizatics of the mangrove swamp
low-(LVL), south central Niger Delta,
Nigeria”. Global Journal of Pure andApplied
Sciences, Vol. 9, No. 3, pp. 369 – 374.
Karastathis, V. K. and S. P.
Papamarinopoulos, (1997). “The detection
of King Xerxes canal by the use of shallow
reflection and refraction seismics –
Preliminary results”. Geoph. Prosp.,
Vol. 45, 389 – 401.
Lanz, E. H., H. Maurer and A. G. Green,
(1998). “Refraction tomography over a
buried waste disposal site. Geophysics, Vol.
63, 1414 – 1433.
Miller, K. C., S. H. Harder, D. C. Adams,
and T. O’Donnell, Jnr., (1998).
“Integrating high resolution refraction data
into near-surface seismic reflection data
processing and interpretation”. Geophysics,
Vol. 63,1339 – 1347.
Okwueze, E. E., (1991). “Shear wave
observation in seismic refraction survey:
Hydrogeological and engineering
Applications”. Journal Min. Geology, Vol.
26, pp. 121 - 130.
Palmer, D., (1981). “An introduction to the
Comparison of Compressional-Wave .....
874
generalized reciprocal method of seismic
refraction interpretation”. Geophysics, 1508
1518.
Uko, E. D., Ekine, A. S., Ebeniro, J. O.,
and Ofoegbu, C. O., (1992). “Weathering
structure of the east-central Niger Delta,
Nigeria”. Geophysics, Vol. 57, No.9, 1228 –
1233.
Xia, J., Miller R. D., Park, C. B., Hunter,
J. A., and Harris, J. B., (2000).
“Comparing shear-wave velocity profiles
from MASW with borehole measurements
in unconsolidated sediments, Fraser River
Delta, B.C., Canada. JEEG, 5:3, 1-13.
Yilmaz, O., Savaskan, E., Bakir, S.,
Yilmaz, T., Eser, M., Akkar, S., Tuzel, B.,
Iravul, Y., Ozmen, O., Denizlioglu, Z.,
(2008). “Shallow seismic and geotechnical
site surveys at the Turkish National Grid for
strong motion seismography stations”,
Proceedings of the 14th WCEE (this
volume), Beijing, China.
Figure 1: Map of the Niger Delta showing the area of study
International Journal of Asian Social Science, 2(6), pp.869-880
875
Figure 2: Near-surface showing lithology, example
Depth (m)
0
3
1
8
24
42
48
66
Overburden Clay
Clay
Clayey Sand
Sand (fine to medium)
Medium Sand +
ferrigenous particles
Sand (Fine-Medium) +
lignite traces
Comparison of Compressional-Wave .....
876
Figure 3: Schematic diagram of downhole-detector array
International Journal of Asian Social Science, 2(6), pp.869-880
877
Figure 4: Sample of monitor records from (a) downhole and (b) surface-detector shooting
Comparison of Compressional-Wave .....
878
Figure 5: Schematic diagram of surface-detector array
Figure 6: Correlation between surface-detector and downhole-detector velocities.
International Journal of Asian Social Science, 2(6), pp.869-880
879
5450.00 5500.00 5550.00 5600.00 5650.00 5700.00 5750.00 5800.00 5850.00
1200.00
1250.00
1300.00
1350.00
1400.00
1450.00
1500.00
1550.00
1600.00
Figure 7: Elevation contour map
5450.00 5500.00 5550.00 5600.00 5650.00 5700.00 5750.00 5800.00 5850.00
1200.00
1250.00
1300.00
1350.00
1400.00
1450.00
1500.00
1550.00
1600.00
Figure 8: Weathered-layer velocity contour map

Comparison of Compressional-Wave .....
880
5450.00 5500.00 5550.00 5600.00 5650.00 5700.00 5750.00 5800.00 5850.00
1200.00
1250.00
1300.00
1350.00
1400.00
1450.00
1500.00
1550.00
1600.00
Figure 9: Consolidated-layer velocity contour map