Embed Size (px)
Citation preview
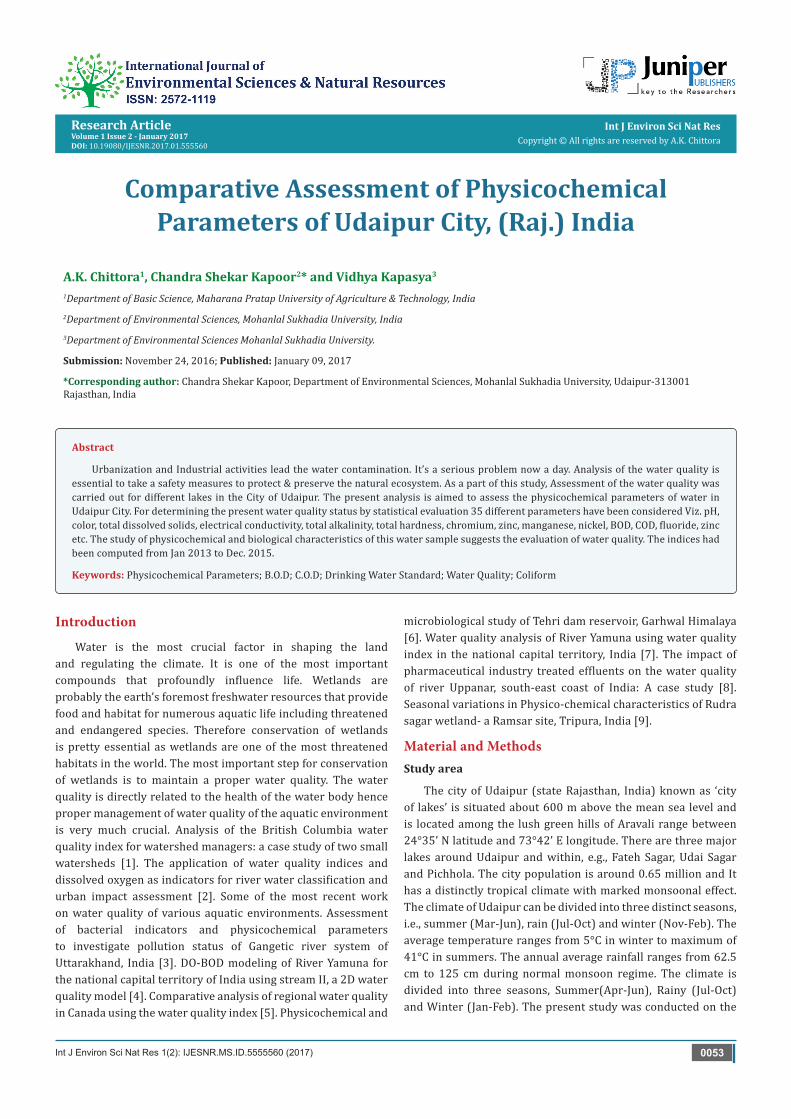
Research ArticleVolume 1 Issue 2 - January 2017DOI: 10.19080/IJESNR.2017.01.555560
Int J Environ Sci Nat ResCopyright © All rights are reserved by A.K. Chittora
Comparative Assessment of Physicochemical Parameters of Udaipur City, (Raj.) India
A.K. Chittora1, Chandra Shekar Kapoor2* and Vidhya Kapasya3
1Department of Basic Science, Maharana Pratap University of Agriculture & Technology, India2Department of Environmental Sciences, Mohanlal Sukhadia University, India3Department of Environmental Sciences Mohanlal Sukhadia University.
Submission: November 24, 2016; Published: January 09, 2017
*Corresponding author: Chandra Shekar Kapoor, Department of Environmental Sciences, Mohanlal Sukhadia University, Udaipur-313001 Rajasthan, India
Abstract
Urbanization and Industrial activities lead the water contamination. It’s a serious problem now a day. Analysis of the water quality is essential to take a safety measures to protect & preserve the natural ecosystem. As a part of this study, Assessment of the water quality was carried out for different lakes in the City of Udaipur. The present analysis is aimed to assess the physicochemical parameters of water in Udaipur City. For determining the present water quality status by statistical evaluation 35 different parameters have been considered Viz. pH, color, total dissolved solids, electrical conductivity, total alkalinity, total hardness, chromium, zinc, manganese, nickel, BOD, COD, fluoride, zinc etc. The study of physicochemical and biological characteristics of this water sample suggests the evaluation of water quality. The indices had been computed from Jan 2013 to Dec. 2015.
Keywords: Physicochemical Parameters; B.O.D; C.O.D; Drinking Water Standard; Water Quality; Coliform
Introduction
Water is the most crucial factor in shaping the land and regulating the climate. It is one of the most important compounds that profoundly influence life. Wetlands are probably the earth’s foremost freshwater resources that provide food and habitat for numerous aquatic life including threatened and endangered species. Therefore conservation of wetlands is pretty essential as wetlands are one of the most threatened habitats in the world. The most important step for conservation of wetlands is to maintain a proper water quality. The water quality is directly related to the health of the water body hence proper management of water quality of the aquatic environment is very much crucial. Analysis of the British Columbia water quality index for watershed managers: a case study of two small watersheds [1]. The application of water quality indices and dissolved oxygen as indicators for river water classification and urban impact assessment [2]. Some of the most recent work on water quality of various aquatic environments. Assessment of bacterial indicators and physicochemical parameters to investigate pollution status of Gangetic river system of Uttarakhand, India [3]. DO-BOD modeling of River Yamuna for the national capital territory of India using stream II, a 2D water quality model [4]. Comparative analysis of regional water quality in Canada using the water quality index [5]. Physicochemical and
microbiological study of Tehri dam reservoir, Garhwal Himalaya [6]. Water quality analysis of River Yamuna using water quality index in the national capital territory, India [7]. The impact of pharmaceutical industry treated effluents on the water quality of river Uppanar, south-east coast of India: A case study [8]. Seasonal variations in Physico-chemical characteristics of Rudra sagar wetland- a Ramsar site, Tripura, India [9].
Material and Methods Study area
The city of Udaipur (state Rajasthan, India) known as ‘city of lakes’ is situated about 600 m above the mean sea level and is located among the lush green hills of Aravali range between 24°35’ N latitude and 73°42’ E longitude. There are three major lakes around Udaipur and within, e.g., Fateh Sagar, Udai Sagar and Pichhola. The city population is around 0.65 million and It has a distinctly tropical climate with marked monsoonal effect. The climate of Udaipur can be divided into three distinct seasons, i.e., summer (Mar-Jun), rain (Jul-Oct) and winter (Nov-Feb). The average temperature ranges from 5°C in winter to maximum of 41°C in summers. The annual average rainfall ranges from 62.5 cm to 125 cm during normal monsoon regime. The climate is divided into three seasons, Summer(Apr-Jun), Rainy (Jul-Oct) and Winter (Jan-Feb). The present study was conducted on the
Int J Environ Sci Nat Res 1(2): IJESNR.MS.ID.5555560 (2017) 0053
How to cite this article: A.K. Chittora, Chandra S K, Vidhya K. Comparative Assessment of Physicochemical Parameters of Udaipur City, (Raj.) India. Int J Environ Sci Nat Res. 2017;1(2): 555560. DOI: 10.19080/IJESNR.2017.01.555560054
International Journal of Environmental Sciences & Natural Resources
Physico-chemical parameters of the Fateh Sagar, Udai Sagar and Pichhola lakes.
MethodologyThe physicochemical parameter, water temperature was
measured in situ by using hand mercury thermometer, pH was estimated by Digital pH –meter (Elico-120).Turbidity was measured by Water Analyzer, EM-61, Electrical conductivity was measured by conductivity meter. (Tanco EE-014 Series Digital Conductivity Meter), TDS was measured with the help of Digital TDS meter. Other parameters, i.e. Total Alkalinity, Dissolved
Oxygen, Biological Oxygen Demand(BOD) and Chemical Oxygen Demand (COD), Chloride, Sulphate, Sodium, Calcium, Magnesium, Total Hardness, Phenolphthalein Alkalinity, Phosphate, Nitrite, Fluoride, Ammonical Nitrogen, Boron Dissolved, Potassium, Cyanide, Cadmium, Lead, Chromium, Zinc,
Iron, Copper, Nickel,Total Kjeldahl Nitrogen. The analysis of Total Suspended solids, Total Dissolved Solids, Fixed Dissolved Solids, Fecal Coliform and Total Coliform of water performed as per the standard methods [10-12] in the laboratory.
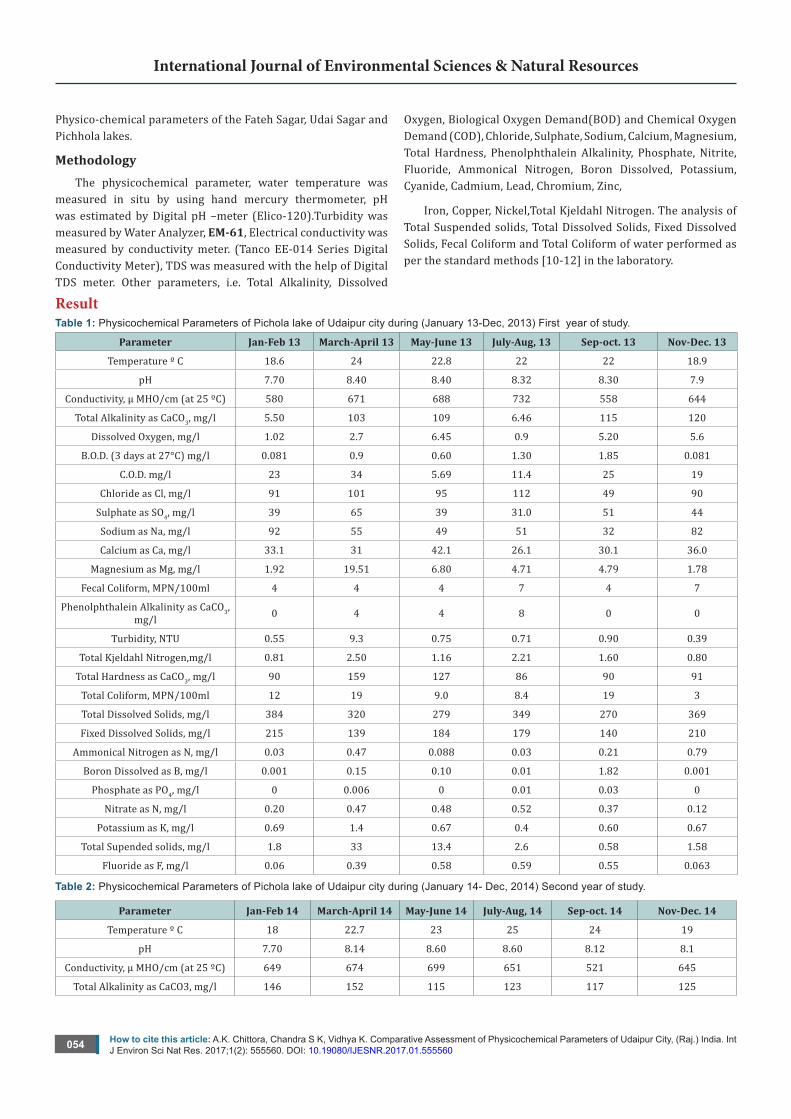
ResultTable 1: Physicochemical Parameters of Pichola lake of Udaipur city during (January 13-Dec, 2013) First year of study.
Parameter Jan-Feb 13 March-April 13 May-June 13 July-Aug, 13 Sep-oct. 13 Nov-Dec. 13
Temperature º C 18.6 24 22.8 22 22 18.9
pH 7.70 8.40 8.40 8.32 8.30 7.9
Conductivity, µ MHO/cm (at 25 ºC) 580 671 688 732 558 644
Total Alkalinity as CaCO3, mg/l 5.50 103 109 6.46 115 120
Dissolved Oxygen, mg/l 1.02 2.7 6.45 0.9 5.20 5.6
B.O.D. (3 days at 27°C) mg/l 0.081 0.9 0.60 1.30 1.85 0.081
C.O.D. mg/l 23 34 5.69 11.4 25 19
Chloride as Cl, mg/l 91 101 95 112 49 90
Sulphate as SO4, mg/l 39 65 39 31.0 51 44
Sodium as Na, mg/l 92 55 49 51 32 82
Calcium as Ca, mg/l 33.1 31 42.1 26.1 30.1 36.0
Magnesium as Mg, mg/l 1.92 19.51 6.80 4.71 4.79 1.78
Fecal Coliform, MPN/100ml 4 4 4 7 4 7
Phenolphthalein Alkalinity as CaCO3, mg/l 0 4 4 8 0 0
Turbidity, NTU 0.55 9.3 0.75 0.71 0.90 0.39
Total Kjeldahl Nitrogen,mg/l 0.81 2.50 1.16 2.21 1.60 0.80
Total Hardness as CaCO3, mg/l 90 159 127 86 90 91
Total Coliform, MPN/100ml 12 19 9.0 8.4 19 3
Total Dissolved Solids, mg/l 384 320 279 349 270 369
Fixed Dissolved Solids, mg/l 215 139 184 179 140 210
Ammonical Nitrogen as N, mg/l 0.03 0.47 0.088 0.03 0.21 0.79
Boron Dissolved as B, mg/l 0.001 0.15 0.10 0.01 1.82 0.001
Phosphate as PO4, mg/l 0 0.006 0 0.01 0.03 0
Nitrate as N, mg/l 0.20 0.47 0.48 0.52 0.37 0.12
Potassium as K, mg/l 0.69 1.4 0.67 0.4 0.60 0.67
Total Supended solids, mg/l 1.8 33 13.4 2.6 0.58 1.58
Fluoride as F, mg/l 0.06 0.39 0.58 0.59 0.55 0.063
Table 2: Physicochemical Parameters of Pichola lake of Udaipur city during (January 14- Dec, 2014) Second year of study.
Parameter Jan-Feb 14 March-April 14 May-June 14 July-Aug, 14 Sep-oct. 14 Nov-Dec. 14
Temperature º C 18 22.7 23 25 24 19
pH 7.70 8.14 8.60 8.60 8.12 8.1
Conductivity, µ MHO/cm (at 25 ºC) 649 674 699 651 521 645
Total Alkalinity as CaCO3, mg/l 146 152 115 123 117 125
How to cite this article: A.K. Chittora, Chandra S K, Vidhya K. Comparative Assessment of Physicochemical Parameters of Udaipur City, (Raj.) India. Int J Environ Sci Nat Res. 2017;1(2): 555560. DOI: 10.19080/IJESNR.2017.01.555560055
International Journal of Environmental Sciences & Natural Resources
Dissolved Oxygen, mg/l 5.6 5.1 6.40 6.0 6.2 5.9
B.O.D. (3 days at 27°C) mg/l 0.083 0.7 0.65 1.32 0.046 0.088
C.O.D. mg/l 24 17.4 5.70 12.4 25.2 21
Chloride as Cl, mg/l 95 74 101 114 51 91
Sulphate as SO4, mg/l 40 50 41 31.1 53 45
Sodium as Na, mg/l 94 55 51 54 34 84
Calcium as Ca, mg/l 33.4 49.5 43.1 27.1 30.4 36.1
Magnesium as Mg, mg/l 1.94 15.4 6.82 4.80 4.80 1.80
Fecal Coliform, MPN/100ml 14 4 4 4 4 7
Phenolphthalein Alkalinity as CaCO3, mg/l NIL NIL 4 8 NIL NIL
Turbidity, NTU 0.5 0.8 0.7 0.7 0.91 0.40
Total Kjeldahl Nitrogen, mg/l 0.83 5.02 1.20 2.24 1.67 0.81
Total Hardness as CaCO3, mg/l 91 186 130 89 95 93
Total Coliform, MPN/100ml 3 13 9.2 8.7 13 3
Total Dissolved Solids, mg/l 389 358 281 350 273 370
Fixed Dissolved Solids, mg/l 219 219 186 180 143 211
Ammonical Nitrogen as N, mg/l 0.87 150 0.09 0.087 1.87 0.81
Boron Dissolved as B, mg/l 0.001 0.01 0.11 0.01 0.03 0.001
Phosphate as PO4, mg/l NIL 0 0 0.01 NIL NIL
Nitrate as N, mg/l 0.13 0.07 0.49 0.02 0.37 0.14
Potassium as K, mg/l 0.7 0.6 0.69 0.5 0.65 0.69
Total Supended solids, mg/l 1.9 2 13.5 2.9 12 1.6
Fluoride as F, mg/l 0.07 0.27 0.58 0.99 0.57 0.065
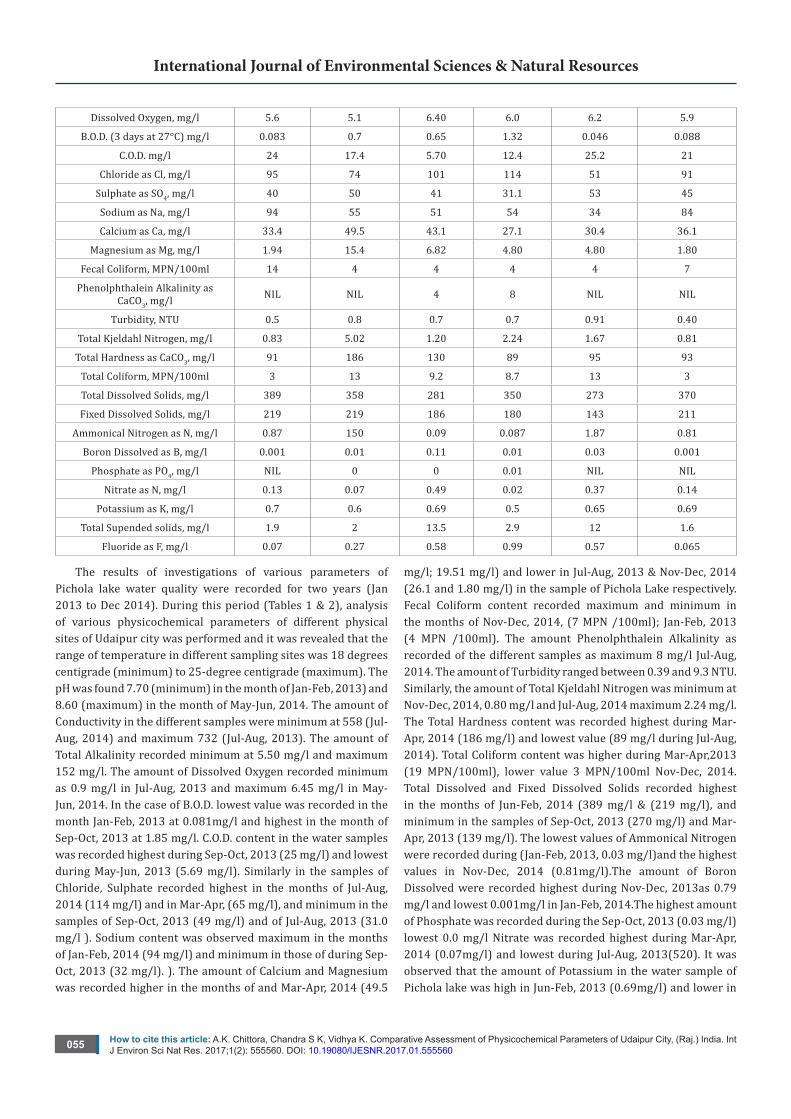
The results of investigations of various parameters of Pichola lake water quality were recorded for two years (Jan 2013 to Dec 2014). During this period (Tables 1 & 2), analysis of various physicochemical parameters of different physical sites of Udaipur city was performed and it was revealed that the range of temperature in different sampling sites was 18 degrees centigrade (minimum) to 25-degree centigrade (maximum). The pH was found 7.70 (minimum) in the month of Jan-Feb, 2013) and 8.60 (maximum) in the month of May-Jun, 2014. The amount of Conductivity in the different samples were minimum at 558 (Jul-Aug, 2014) and maximum 732 (Jul-Aug, 2013). The amount of Total Alkalinity recorded minimum at 5.50 mg/l and maximum 152 mg/l. The amount of Dissolved Oxygen recorded minimum as 0.9 mg/l in Jul-Aug, 2013 and maximum 6.45 mg/l in May-Jun, 2014. In the case of B.O.D. lowest value was recorded in the month Jan-Feb, 2013 at 0.081mg/l and highest in the month of Sep-Oct, 2013 at 1.85 mg/l. C.O.D. content in the water samples was recorded highest during Sep-Oct, 2013 (25 mg/l) and lowest during May-Jun, 2013 (5.69 mg/l). Similarly in the samples of Chloride, Sulphate recorded highest in the months of Jul-Aug, 2014 (114 mg/l) and in Mar-Apr, (65 mg/l), and minimum in the samples of Sep-Oct, 2013 (49 mg/l) and of Jul-Aug, 2013 (31.0 mg/l ). Sodium content was observed maximum in the months of Jan-Feb, 2014 (94 mg/l) and minimum in those of during Sep-Oct, 2013 (32 mg/l). ). The amount of Calcium and Magnesium was recorded higher in the months of and Mar-Apr, 2014 (49.5
mg/l; 19.51 mg/l) and lower in Jul-Aug, 2013 & Nov-Dec, 2014 (26.1 and 1.80 mg/l) in the sample of Pichola Lake respectively. Fecal Coliform content recorded maximum and minimum in the months of Nov-Dec, 2014, (7 MPN /100ml); Jan-Feb, 2013 (4 MPN /100ml). The amount Phenolphthalein Alkalinity as recorded of the different samples as maximum 8 mg/l Jul-Aug, 2014. The amount of Turbidity ranged between 0.39 and 9.3 NTU. Similarly, the amount of Total Kjeldahl Nitrogen was minimum at Nov-Dec, 2014, 0.80 mg/l and Jul-Aug, 2014 maximum 2.24 mg/l. The Total Hardness content was recorded highest during Mar-Apr, 2014 (186 mg/l) and lowest value (89 mg/l during Jul-Aug, 2014). Total Coliform content was higher during Mar-Apr,2013 (19 MPN/100ml), lower value 3 MPN/100ml Nov-Dec, 2014.Total Dissolved and Fixed Dissolved Solids recorded highest in the months of Jun-Feb, 2014 (389 mg/l & (219 mg/l), and minimum in the samples of Sep-Oct, 2013 (270 mg/l) and Mar-Apr, 2013 (139 mg/l). The lowest values of Ammonical Nitrogen were recorded during (Jan-Feb, 2013, 0.03 mg/l)and the highest values in Nov-Dec, 2014 (0.81mg/l).The amount of Boron Dissolved were recorded highest during Nov-Dec, 2013as 0.79 mg/l and lowest 0.001mg/l in Jan-Feb, 2014.The highest amount of Phosphate was recorded during the Sep-Oct, 2013 (0.03 mg/l) lowest 0.0 mg/l Nitrate was recorded highest during Mar-Apr, 2014 (0.07mg/l) and lowest during Jul-Aug, 2013(520). It was observed that the amount of Potassium in the water sample of Pichola lake was high in Jun-Feb, 2013 (0.69mg/l) and lower in
How to cite this article: A.K. Chittora, Chandra S K, Vidhya K. Comparative Assessment of Physicochemical Parameters of Udaipur City, (Raj.) India. Int J Environ Sci Nat Res. 2017;1(2): 555560. DOI: 10.19080/IJESNR.2017.01.555560056
International Journal of Environmental Sciences & Natural Resources
Jul-Aug, 2013 (0.4 mg/l).Total Suspended solids were found high during Mar-Apr, 2013 in the sample water of lakes (33 mg/l) and minimum value in Jan-Feb,2013 (1.8 mg/l). Highest Fluoride content was recorded in (0.99 mg/l during Jul-Aug, 2014) and
lowest in the sample of industrial area (0.06 mg/l during Jan-Feb, 2013). Pichola Lake and Fateh Sagar area were computed (Tables 3-8).
Table 3: Physicochemical Parameters of Fateh Sagar of Udaipur city during (January 13- Dec, 2013) first year of study.
Parameter Jan-Feb 13 March-April 13 May-June 13 July-Aug, 13 Sep-oct. 13 Nov-Dec. 13
Temperature º C 21 24.6 23.8 21 23 20.5
pH 8.7 8.2 8.30 7.84 7.90 8.1
Conductivity, µ MHO/cm (at 25 ºC) 545 645 551 1281 542 588
Total Alkalinity as CaCO3, mg/l 142 115 127 135 145 146
Dissolved Oxygen, mg/l 6.5 4.6 6.37 6.74 4.16 5.51
B.O.D. (3 days at 27°C) mg/l 3.40 1.8 1.2 0.71 0.37 1.34
C.O.D. mg/l 61.9 44.6 7.2 3.28 18 63
Chloride as Cl, mg/l 64 122 71 12.1 68 64
Sulphate as SO4, mg/l 29 33.3 26 68 34 30
Sodium as Na, mg/l 78 55 39 28 51 80
Calcium as Ca, mg/l 33 15 49.7 44 33 35.8
Magnesium as Mg, mg/l 2.75 23.40 13.1 29 12 2.7
Fecal Coliform, MPN/100ml 3 4 4 4 3 4
Phenolphthalein Alkalinity as CaCO3, mg/l 0 27 4 4 0 0
Turbidity, NTU 0.48 4 0.27 1 0.4 0.57
Total Kjeldahl Nitrogen, mg/l 0.56 1.93 1.08 1.07 1.60 0.65
Total Hardness as CaCO3,mg/l 101 134 178 99 130 101
Total Coliform, MPN/100ml 6.8 7 21 7 4 12.7
Total Dissolved Solids, mg/l 311 270 226 275 311 315
Fixed Dissolved Solids , mg/l 157 84 167 138 179 153
Ammonical Nitrogen as N, mg/l 0.07 0.15 0.115 0.07 0.34 0.26
Boron Dissolved as B, mg/l 0.14 0.14 0.04 0.001 0 0.23
Phosphate as PO4, mg/l 0 0 0 0.001 0 0
Nitrate as N, mg/l 0.82 0.62 0.33 0.80 0.31 0.07
Potassium as K, mg/l 0.4 0.54 0.64 0.68 0.4 0.6
Total Suspended solids, mg/l 6.8 13 11 3.5 15 6.9
Fluoride as F, mg/l 0.53 0.60 0.57 0.65 0.51 0.04
How to cite this article: A.K. Chittora, Chandra S K, Vidhya K. Comparative Assessment of Physicochemical Parameters of Udaipur City, (Raj.) India. Int J Environ Sci Nat Res. 2017;1(2): 555560. DOI: 10.19080/IJESNR.2017.01.555560057
International Journal of Environmental Sciences & Natural Resources
Table 4: Physicochemical Parameters of Fateh Sagar of Udaipur city during (January 14- Dec, 2014) Second year of study.
Parameter Jan-Feb 14 March-April 14 May-June 14 July-Aug, 14 Sep-oct. 14 Nov-Dec. 14
Temperature º C 20 20 24.1 24 23 21
pH 8.01 8.30 8.40 8.60 8.10 8.3
Conductivity, µ MHO/cm (at 25 ºC) 590 610 560 520 580 592
Total Alkalinity as CaCO3, mg/l 145 150 130 138 150 148
Dissolved Oxygen, mg/l 5.50 6.1 6.40 6.1 6.19 5.55
B.O.D. (3 days at 27°C) mg/l 1.38 1.90 1.5 3.30 1.80 1.39
C.O.D. mg/l 62.2 12.4 7.6 12.3 18.1 63.1
Chloride as Cl, mg/l 65 77 76 71 70 66
Sulphate as SO4, mg/l 30 30 28 30 37 31
Sodium as Na, mg/l 80 50 40 49 54 81
Calcium as Ca, mg/l 34 57.1 50.1 29.1 33.1 33
Magnesium as Mg, mg/l 2.80 6.80 13.2 7.70 12.2 2.9
Fecal Coliform, MPN/100ml 4 3 4 7 4 4
Phenolphthalein Alkalinity as CaCO3, mg/l 0 0 4 4 0 0
Turbidity, NTU 0.51 2.4 0.29 1.1 0.5 0.59
Total Kjeldahl Nitrogen, mg/l 0.59 1.11 1.10 1.10 1.66 0.68
Total Hardness as CaCO3, mg/l 101 165 180 101 132 103
Total Coliform, MPN/100ml 11 12 22 13 9 13
Total Dissolved Solids, mg/l 315 315 228 283 315 318
Fixed Dissolved Solids, mg/l 161 200 170 140 182 155
Ammonical Nitrogen as N, mg/l 0.20 140 0.118 0.03 0.01 0.28
Boron Dissolved as B, mg/l 0.16 0.02 0.05 0.001 NIL 0.25
Phosphate as PO4, mg/l NIL 0 NIL 0.001 NIL NIL
Nitrate as N, mg/l 0.06 0.60 0.36 0.078 0.3 0.07
Potassium as K, mg/l 0.5 2.7 0.71 0.7 0.5 0.6
Total Supended solids, mg/l 7 50 12 4 17 7.1
Fluoride as F, mg/l 0.03 0.30 0.60 0.70 0.54 0.04
How to cite this article: A.K. Chittora, Chandra S K, Vidhya K. Comparative Assessment of Physicochemical Parameters of Udaipur City, (Raj.) India. Int J Environ Sci Nat Res. 2017;1(2): 555560. DOI: 10.19080/IJESNR.2017.01.555560058
International Journal of Environmental Sciences & Natural Resources
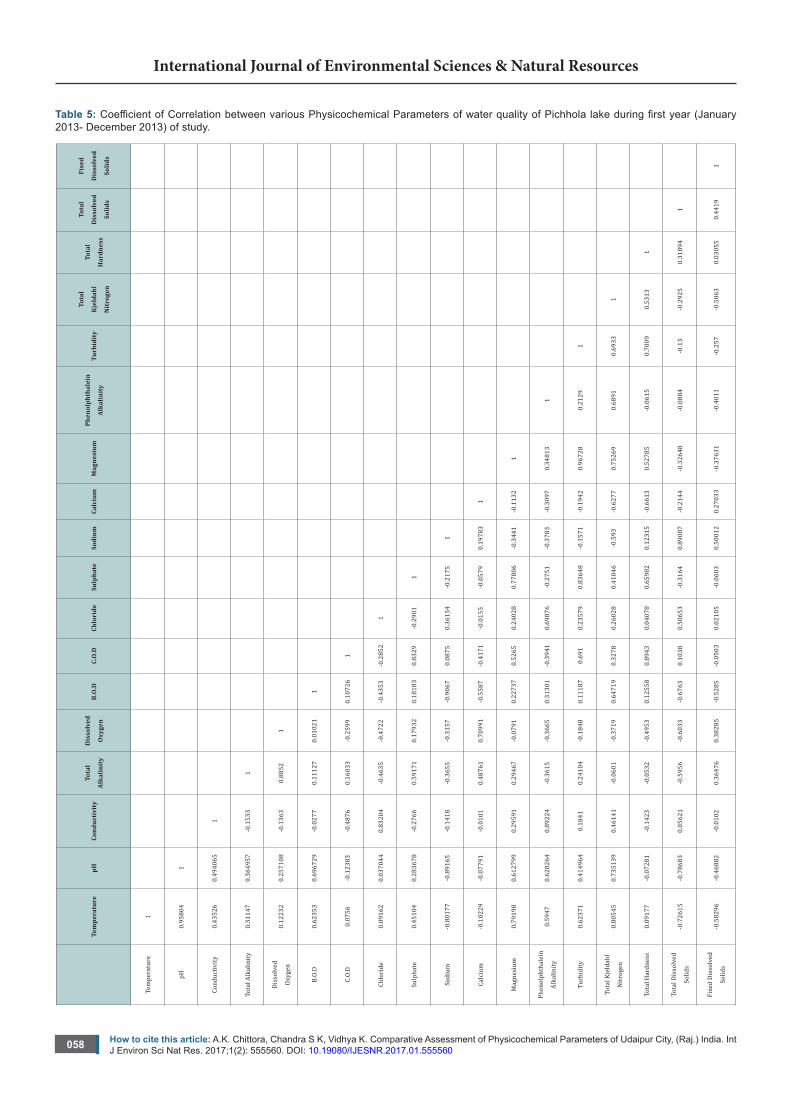
Table 5: Coefficient of Correlation between various Physicochemical Parameters of water quality of Pichhola lake during first year (January 2013- December 2013) of study.
Tem
pera
ture
pH
Cond
ucti
vity
Tota
l
Alka
linit
y
Dis
solv
ed
Oxy
gen
B.O
.DC.
O.D
Chlo
ride
Sulp
hate
Sodi
umCa
lciu
m
Mag
nesi
umPh
enol
phth
alei
n
Alka
linit
yTu
rbid
ity
Tota
l
Kje
ldah
l
Nit
roge
n
Tota
l
Har
dnes
s
Tota
l
Dis
solv
ed
Solid
s
Fixe
d
Dis
solv
ed
Solid
s
Tem
pera
ture
1
pH0.
9580
41
Cond
uctiv
ity0.
4352
60.
4940
651
Tota
l Alk
alin
ity0.
3114
70.
3649
57-0
.153
31
Dis
solv
ed
Oxyg
en0.
1223
20.
2571
08-0
.136
30.
8852
1
B.O.
D0.
6235
30.
6967
29-0
.027
70.
1112
70.
0102
11
C.O.
D0.
0756
-0.1
2383
-0.4
876
0.16
033
-0.2
599
0.10
726
1
Chlo
ride
0.09
162
0.03
7044
0.83
204
-0.4
635
-0.4
722
-0.4
353
-0.2
852
1
Sulp
hate
0.45
104
0.28
3678
-0.2
766
0.59
171
0.17
932
0.18
183
0.83
29-0
.290
11
Sodi
um-0
.801
77-0
.891
65-0
.141
8-0
.365
5-0
.315
7-0
.906
70.
0875
0.36
154
-0.2
175
1
Calc
ium
-0
.102
29-0
.077
91-0
.010
10.
4876
10.
7099
1-0
.558
7-0
.417
1-0
.015
5-0
.057
90.
1978
31
Mag
nesi
um0.
7919
80.
6127
990.
2959
10.
2946
7-0
.079
10.
2273
70.
5265
0.24
028
0.77
806
-0.3
441
-0.1
132
1
Phen
olph
thal
ein
Alka
linity
0.59
470.
6282
640.
8922
4-0
.361
5-0
.366
50.
3130
1-0
.394
10.
6987
6-0
.275
1-0
.378
3-0
.309
70.
3481
31
Turb
idity
0.62
371
0.41
4964
0.18
410.
2410
4-0
.184
80.
1118
70.
691
0.23
579
0.83
648
-0.1
571
-0.1
942
0.96
728
0.21
291
Tota
l Kje
ldah
l
Nitr
ogen
0.80
545
0.73
5139
0.46
141
-0.0
601
-0.3
719
0.64
719
0.32
780.
2602
80.
4104
6-0
.593
-0.6
277
0.75
269
0.68
910.
6933
1
Tota
l Har
dnes
s0.
0917
7-0
.072
81-0
.142
3-0
.053
2-0
.495
30.
1255
80.
8943
0.04
078
0.65
982
0.12
315
-0.6
613
0.52
785
-0.0
615
0.70
090.
5313
1
Tota
l Dis
solv
ed
Solid
s-0
.726
15-0
.786
830.
0562
1-0
.595
6-0
.603
3-0
.676
30.
1038
0.50
653
-0.3
164
0.89
087
-0.2
144
-0.3
2648
-0.0
884
-0.1
3-0
.292
50.
3189
41
Fixe
d D
isso
lved
Solid
s -0
.582
96-0
.468
82-0
.010
20.
3647
60.
3828
5-0
.528
5-0
.050
30.
0210
5-0
.060
30.
5001
20.
2703
3-0
.376
31-0
.401
1-0
.257
-0.5
063
0.03
055
0.44
191
How to cite this article: A.K. Chittora, Chandra S K, Vidhya K. Comparative Assessment of Physicochemical Parameters of Udaipur City, (Raj.) India. Int J Environ Sci Nat Res. 2017;1(2): 555560. DOI: 10.19080/IJESNR.2017.01.555560059
International Journal of Environmental Sciences & Natural Resources
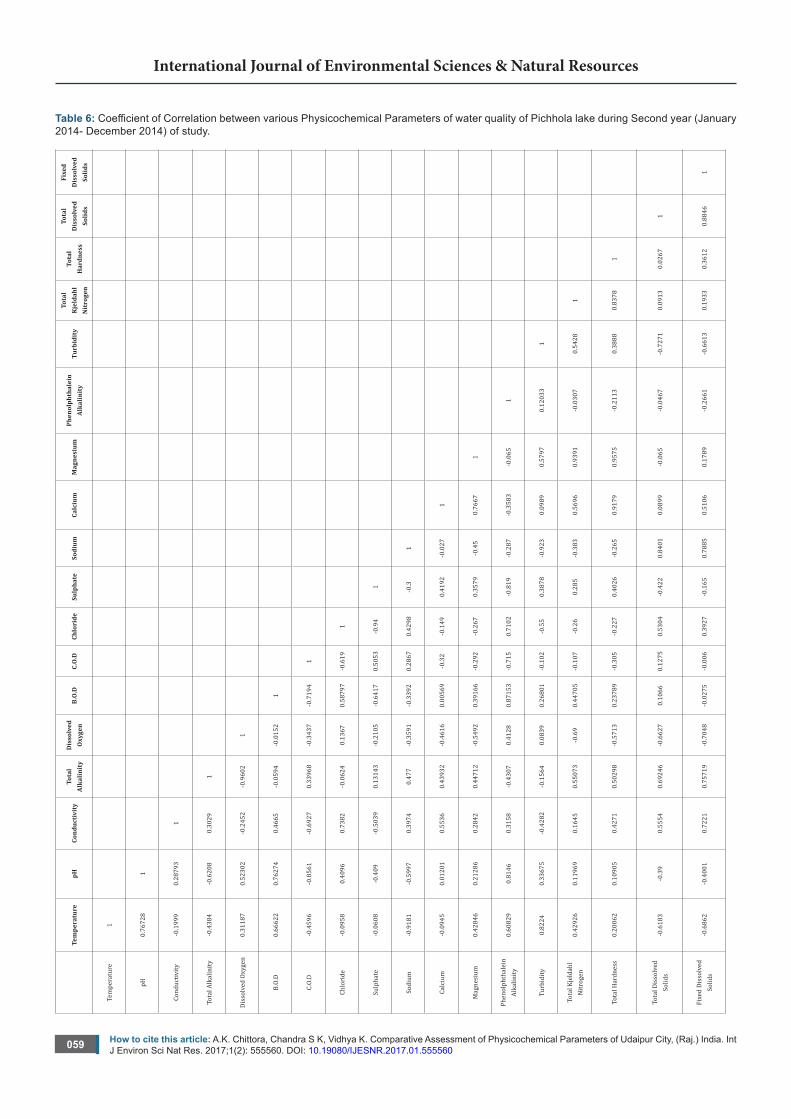
Table 6: Coefficient of Correlation between various Physicochemical Parameters of water quality of Pichhola lake during Second year (January 2014- December 2014) of study.
Tem
pera
ture
pH
Cond
ucti
vity
Tota
l Al
kalin
ity
Dis
solv
ed
Oxy
gen
B.O
.DC.
O.D
Chlo
ride
Sulp
hate
Sodi
umCa
lciu
m
Mag
nesi
umPh
enol
phth
alei
n Al
kalin
ity
Turb
idit
yTo
tal
Kje
ldah
l N
itro
gen
Tota
l H
ardn
ess
Tota
l D
isso
lved
So
lids
Fixe
d D
isso
lved
So
lids
Tem
pera
ture
1
pH0.
7672
81
Cond
uctiv
ity-0
.199
90.
2879
31
Tota
l Alk
alin
ity-0
.438
4-0
.620
80.
3029
1
Dis
solv
ed O
xyge
n0.
3118
70.
5230
2-0
.245
2-0
.960
21
B.O.
D0.
6662
20.
7627
40.
4665
-0.0
594
-0.0
152
1
C.O.
D-0
.459
6-0
.856
1-0
.692
70.
3396
8-0
.343
7-0
.719
41
Chlo
ride
-0.0
958
0.40
960.
7382
-0.0
624
0.13
670.
5879
7-0
.619
1
Sulp
hate
-0.0
608
-0.4
09-0
.503
90.
1314
3-0
.210
5-0
.641
70.
5053
-0.9
41
Sodi
um-0
.918
1-0
.599
70.
3974
0.47
7-0
.359
1-0
.339
20.
2867
0.42
98-0
.31
Calc
ium
-0
.094
50.
0120
10.
5536
0.43
932
-0.4
616
0.00
569
-0.3
2-0
.149
0.41
92-0
.027
1
Mag
nesi
um0.
4284
60.
2128
60.
2842
0.44
712
-0.5
492
0.39
166
-0.2
92-0
.267
0.35
79-0
.45
0.76
671
Phen
olph
thal
ein
Alka
linity
0.60
829
0.81
460.
3158
-0.4
307
0.41
280.
8715
3-0
.715
0.71
02-0
.819
-0.2
87-0
.358
3-0
.065
1
Turb
idity
0.82
240.
3367
5-0
.428
2-0
.156
40.
0839
0.26
801
-0.1
02-0
.55
0.38
78-0
.923
0.09
890.
5797
0.12
033
1
Tota
l Kje
ldah
l N
itrog
en0.
4292
60.
1196
90.
1645
0.55
073
-0.6
90.
4470
5-0
.107
-0.2
60.
285
-0.3
830.
5696
0.93
91-0
.030
70.
5428
1
Tota
l Har
dnes
s0.
2006
20.
1090
50.
4271
0.50
298
-0.5
713
0.23
789
-0.3
05-0
.227
0.40
26-0
.265
0.91
790.
9575
-0.2
113
0.38
880.
8378
1
Tota
l Dis
solv
ed
Solid
s-0
.618
3-0
.39
0.55
540.
6924
6-0
.662
70.
1066
0.12
750.
5304
-0.4
220.
8401
0.08
99-0
.065
-0.0
467
-0.7
271
0.09
130.
0267
1
Fixe
d D
isso
lved
So
lids
-0.6
862
-0.4
001
0.72
210.
7571
9-0
.704
8-0
.027
5-0
.006
0.39
27-0
.165
0.78
850.
5106
0.17
89-0
.266
1-0
.661
30.
1933
0.36
120.
8846
1
How to cite this article: A.K. Chittora, Chandra S K, Vidhya K. Comparative Assessment of Physicochemical Parameters of Udaipur City, (Raj.) India. Int J Environ Sci Nat Res. 2017;1(2): 555560. DOI: 10.19080/IJESNR.2017.01.555560060
International Journal of Environmental Sciences & Natural Resources
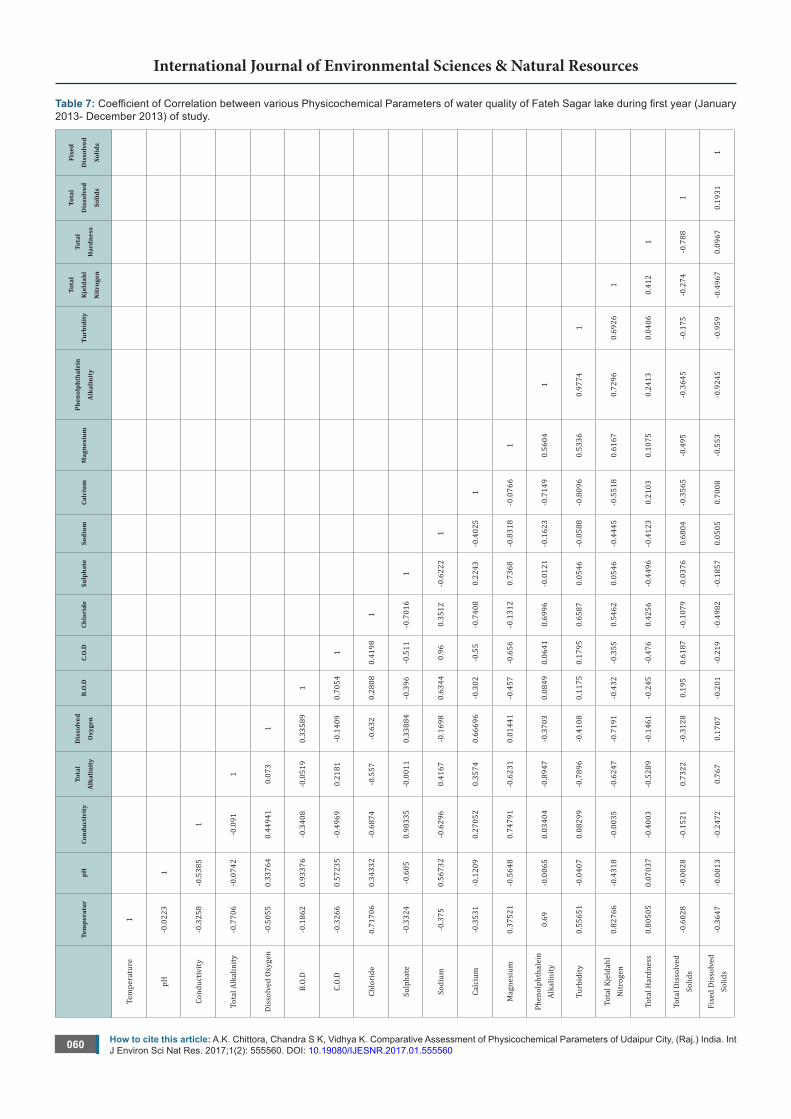
Table 7: Coefficient of Correlation between various Physicochemical Parameters of water quality of Fateh Sagar lake during first year (January 2013- December 2013) of study.
Tem
pera
tur
pHCo
nduc
tivi
tyTo
tal
Alka
linit
y
Dis
solv
ed
Oxy
gen
B.O
.D
C.O
.DCh
lori
deSu
lpha
teSo
dium
Calc
ium
Mag
nesi
umPh
enol
phth
alei
n
Alka
linit
yTu
rbid
ity
Tota
l
Kje
ldah
l
Nit
roge
n
Tota
l
Har
dnes
s
Tota
l
Dis
solv
ed
Solid
s
Fixe
d
Dis
solv
ed
Solid
s
Tem
pera
ture
1
pH-0
.022
31
Cond
uctiv
ity-0
.325
8-0
.538
51
Tota
l Alk
alin
ity-0
.770
6-0
.074
2-0
.091
1
Dis
solv
ed O
xyge
n-0
.505
50.
3376
40.
4494
10.
073
1
B.O.
D-0
.186
20.
9337
6-0
.340
8-0
.051
90.
3358
91
C.O.
D-0
.326
60.
5723
5-0
.496
90.
2181
-0.1
409
0.70
541
Chlo
ride
0.71
706
0.34
332
-0.6
874
-0.5
57-0
.632
0.28
080.
4198
1
Sulp
hate
-0.3
324
-0.6
050.
9833
5-0
.001
10.
3388
4-0
.396
-0.5
11-0
.701
61
Sodi
um-0
.375
0.56
732
-0.6
296
0.41
67-0
.169
80.
6344
0.96
0.35
12-0
.622
21
Calc
ium
-0
.353
1-0
.120
90.
2705
20.
3574
0.66
696
-0.3
02-0
.55
-0.7
408
0.22
43-0
.402
51
Mag
nesi
um0.
3752
1-0
.564
80.
7479
1-0
.623
10.
0144
1-0
.457
-0.6
56-0
.131
20.
7368
-0.8
318
-0.0
766
1
Phen
olph
thal
ein
Alka
linity
0.69
-0.0
065
0.03
404
-0.8
947
-0.3
703
0.08
490.
0641
0.69
96-0
.012
1-0
.162
3-0
.714
90.
5604
1
Turb
idity
0.55
651
-0.0
407
0.08
299
-0.7
896
-0.4
108
0.11
750.
1795
0.65
870.
0546
-0.0
588
-0.8
096
0.53
360.
9774
1
Tota
l Kje
ldah
l N
itrog
en0.
8276
6-0
.431
8-0
.003
5-0
.624
7-0
.719
1-0
.432
-0.3
550.
5462
0.05
46-0
.444
5-0
.551
80.
6167
0.72
960.
6926
1
Tota
l Har
dnes
s0.
8050
50.
0703
7-0
.400
3-0
.528
9-0
.146
1-0
.245
-0.4
760.
4256
-0.4
496
-0.4
123
0.21
030.
1075
0.24
130.
0406
0.41
21
Tota
l Dis
solv
ed
Solid
s-0
.602
8-0
.002
8-0
.152
10.
7322
-0.3
128
0.19
50.
6187
-0.1
079
-0.0
376
0.68
04-0
.356
5-0
.495
-0.3
645
-0.1
75-0
.274
-0.7
881
Fixe
d D
isso
lved
So
lids
-0.3
647
-0.0
013
-0.2
472
0.76
70.
1707
-0.2
01-0
.219
-0.4
982
-0.1
857
0.05
050.
7008
-0.5
53-0
.924
5-0
.959
-0.4
967
0.09
670.
1931
1
How to cite this article: A.K. Chittora, Chandra S K, Vidhya K. Comparative Assessment of Physicochemical Parameters of Udaipur City, (Raj.) India. Int J Environ Sci Nat Res. 2017;1(2): 555560. DOI: 10.19080/IJESNR.2017.01.555560061
International Journal of Environmental Sciences & Natural Resources
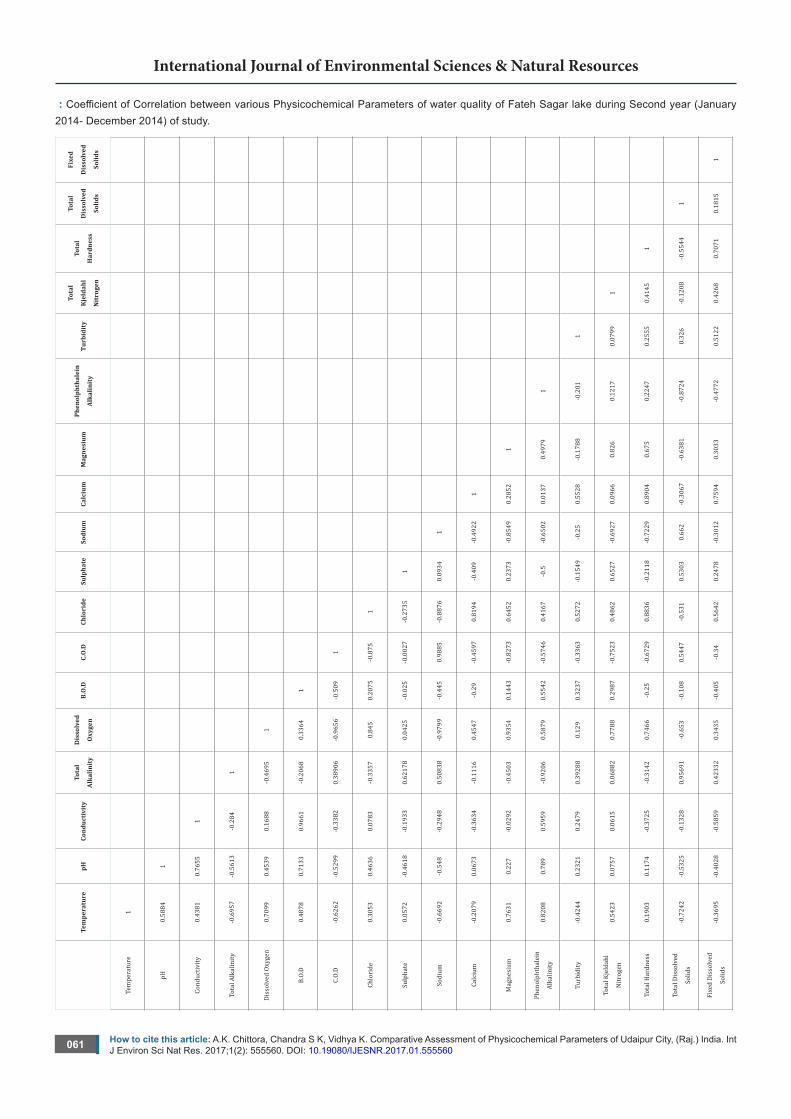
: Coefficient of Correlation between various Physicochemical Parameters of water quality of Fateh Sagar lake during Second year (January 2014- December 2014) of study.
Tem
pera
ture
pHCo
nduc
tivi
tyTo
tal
Alka
linit
y
Dis
solv
ed
Oxy
gen
B.O
.DC.
O.D
Chlo
ride
Sulp
hate
Sodi
umCa
lciu
m
Mag
nesi
umPh
enol
phth
alei
n
Alka
linit
yTu
rbid
ity
Tota
l
Kje
ldah
l
Nit
roge
n
Tota
l
Har
dnes
s
Tota
l
Dis
solv
ed
Solid
s
Fixe
d
Dis
solv
ed
Solid
s
Tem
pera
ture
1
pH0.
5884
1
Cond
uctiv
ity0.
4381
0.76
551
Tota
l Alk
alin
ity-0
.695
7-0
.561
3-0
.284
1
Dis
solv
ed O
xyge
n0.
7099
0.45
390.
1688
-0.4
695
1
B.O.
D0.
4878
0.71
330.
9661
-0.2
068
0.33
641
C.O.
D-0
.626
2-0
.529
9-0
.338
20.
3890
6-0
.965
6-0
.509
1
Chlo
ride
0.30
530.
4636
0.07
83-0
.335
70.
845
0.20
75-0
.875
1
Sulp
hate
0.05
72-0
.461
8-0
.193
30.
6217
80.
0425
-0.0
25-0
.002
7-0
.273
51
Sodi
um-0
.669
2-0
.548
-0.2
948
0.50
838
-0.9
799
-0.4
450.
9885
-0.8
876
0.09
341
Calc
ium
-0
.207
90.
0673
-0.3
634
-0.1
116
0.45
47-0
.29
-0.4
597
0.81
94-0
.409
-0.4
922
1
Mag
nesi
um0.
7631
0.22
7-0
.029
2-0
.450
30.
9354
0.14
43-0
.827
30.
6452
0.23
73-0
.854
90.
2852
1
Phen
olph
thal
ein
Alka
linity
0.82
080.
789
0.59
59-0
.920
60.
5879
0.55
42-0
.574
60.
4167
-0.5
-0.6
502
0.01
370.
4979
1
Turb
idity
-0.4
244
0.23
210.
2479
0.39
288
0.12
90.
3237
-0.3
363
0.52
72-0
.154
9-0
.25
0.55
28-0
.178
8-0
.201
1
Tota
l Kje
ldah
l
Nitr
ogen
0.54
230.
0757
0.06
150.
0688
20.
7788
0.29
87-0
.752
30.
4862
0.65
27-0
.692
70.
0966
0.82
60.
1217
0.07
991
Tota
l Har
dnes
s0.
1903
0.11
74-0
.372
5-0
.314
20.
7466
-0.2
5-0
.672
90.
8836
-0.2
118
-0.7
229
0.89
040.
675
0.22
470.
2555
0.41
451
Tota
l Dis
solv
ed
Solid
s-0
.724
2-0
.532
5-0
.132
80.
9569
1-0
.653
-0.1
080.
5447
-0.5
310.
5303
0.66
2-0
.306
7-0
.638
1-0
.872
40.
326
-0.1
208
-0.5
544
1
Fixe
d D
isso
lved
Solid
s -0
.369
5-0
.402
8-0
.585
90.
4233
20.
3435
-0.4
05-0
.34
0.56
420.
2478
-0.3
012
0.75
940.
3033
-0.4
772
0.51
220.
4268
0.70
710.
1815
1
How to cite this article: A.K. Chittora, Chandra S K, Vidhya K. Comparative Assessment of Physicochemical Parameters of Udaipur City, (Raj.) India. Int J Environ Sci Nat Res. 2017;1(2): 555560. DOI: 10.19080/IJESNR.2017.01.555560062
International Journal of Environmental Sciences & Natural Resources
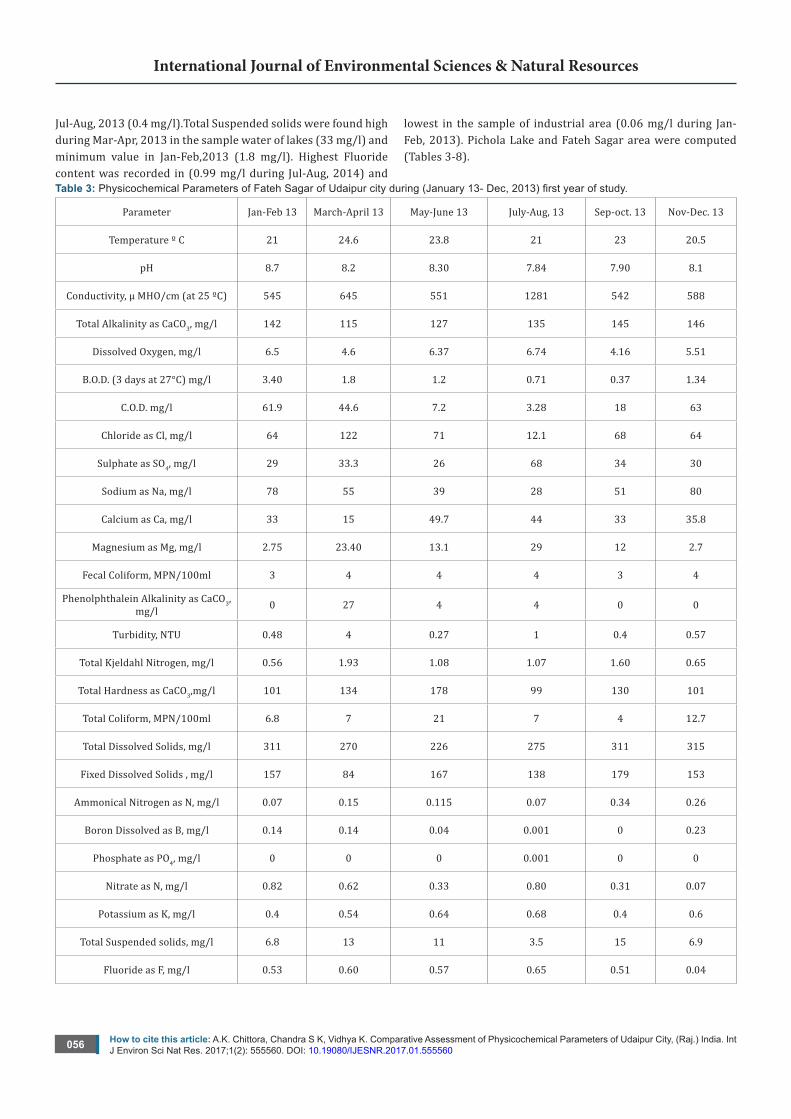
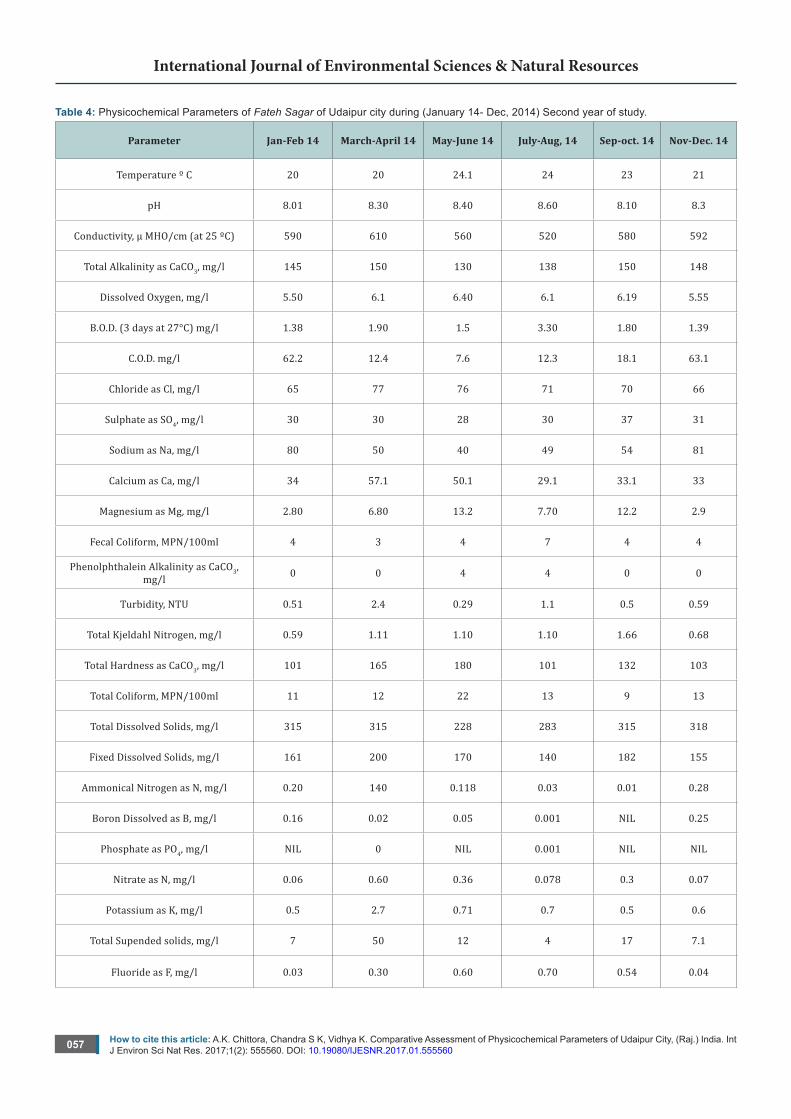
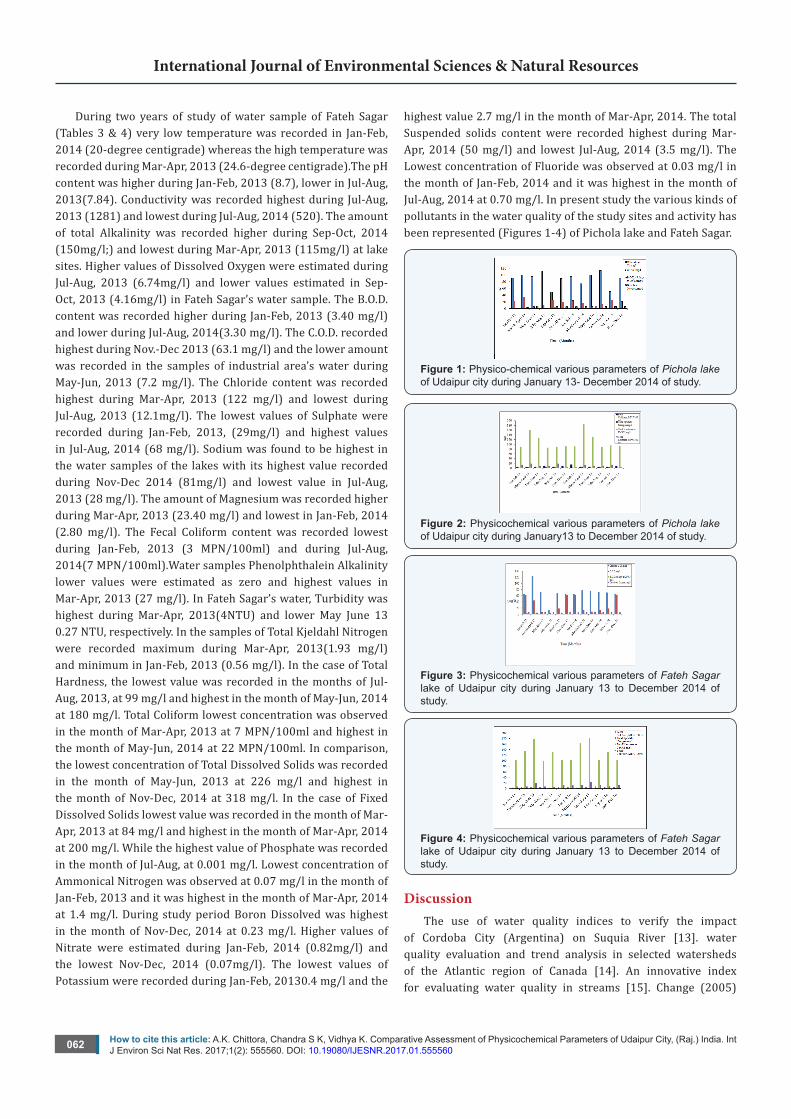
During two years of study of water sample of Fateh Sagar (Tables 3 & 4) very low temperature was recorded in Jan-Feb, 2014 (20-degree centigrade) whereas the high temperature was recorded during Mar-Apr, 2013 (24.6-degree centigrade).The pH content was higher during Jan-Feb, 2013 (8.7), lower in Jul-Aug, 2013(7.84). Conductivity was recorded highest during Jul-Aug, 2013 (1281) and lowest during Jul-Aug, 2014 (520). The amount of total Alkalinity was recorded higher during Sep-Oct, 2014 (150mg/l;) and lowest during Mar-Apr, 2013 (115mg/l) at lake sites. Higher values of Dissolved Oxygen were estimated during Jul-Aug, 2013 (6.74mg/l) and lower values estimated in Sep-Oct, 2013 (4.16mg/l) in Fateh Sagar’s water sample. The B.O.D. content was recorded higher during Jan-Feb, 2013 (3.40 mg/l) and lower during Jul-Aug, 2014(3.30 mg/l). The C.O.D. recorded highest during Nov.-Dec 2013 (63.1 mg/l) and the lower amount was recorded in the samples of industrial area’s water during May-Jun, 2013 (7.2 mg/l). The Chloride content was recorded highest during Mar-Apr, 2013 (122 mg/l) and lowest during Jul-Aug, 2013 (12.1mg/l). The lowest values of Sulphate were recorded during Jan-Feb, 2013, (29mg/l) and highest values in Jul-Aug, 2014 (68 mg/l). Sodium was found to be highest in the water samples of the lakes with its highest value recorded during Nov-Dec 2014 (81mg/l) and lowest value in Jul-Aug, 2013 (28 mg/l). The amount of Magnesium was recorded higher during Mar-Apr, 2013 (23.40 mg/l) and lowest in Jan-Feb, 2014 (2.80 mg/l). The Fecal Coliform content was recorded lowest during Jan-Feb, 2013 (3 MPN/100ml) and during Jul-Aug, 2014(7 MPN/100ml).Water samples Phenolphthalein Alkalinity lower values were estimated as zero and highest values in Mar-Apr, 2013 (27 mg/l). In Fateh Sagar’s water, Turbidity was highest during Mar-Apr, 2013(4NTU) and lower May June 13 0.27 NTU, respectively. In the samples of Total Kjeldahl Nitrogen were recorded maximum during Mar-Apr, 2013(1.93 mg/l) and minimum in Jan-Feb, 2013 (0.56 mg/l). In the case of Total Hardness, the lowest value was recorded in the months of Jul-Aug, 2013, at 99 mg/l and highest in the month of May-Jun, 2014 at 180 mg/l. Total Coliform lowest concentration was observed in the month of Mar-Apr, 2013 at 7 MPN/100ml and highest in the month of May-Jun, 2014 at 22 MPN/100ml. In comparison, the lowest concentration of Total Dissolved Solids was recorded in the month of May-Jun, 2013 at 226 mg/l and highest in the month of Nov-Dec, 2014 at 318 mg/l. In the case of Fixed Dissolved Solids lowest value was recorded in the month of Mar-Apr, 2013 at 84 mg/l and highest in the month of Mar-Apr, 2014 at 200 mg/l. While the highest value of Phosphate was recorded in the month of Jul-Aug, at 0.001 mg/l. Lowest concentration of Ammonical Nitrogen was observed at 0.07 mg/l in the month of Jan-Feb, 2013 and it was highest in the month of Mar-Apr, 2014 at 1.4 mg/l. During study period Boron Dissolved was highest in the month of Nov-Dec, 2014 at 0.23 mg/l. Higher values of Nitrate were estimated during Jan-Feb, 2014 (0.82mg/l) and the lowest Nov-Dec, 2014 (0.07mg/l). The lowest values of Potassium were recorded during Jan-Feb, 20130.4 mg/l and the
highest value 2.7 mg/l in the month of Mar-Apr, 2014. The total Suspended solids content were recorded highest during Mar-Apr, 2014 (50 mg/l) and lowest Jul-Aug, 2014 (3.5 mg/l). The Lowest concentration of Fluoride was observed at 0.03 mg/l in the month of Jan-Feb, 2014 and it was highest in the month of Jul-Aug, 2014 at 0.70 mg/l. In present study the various kinds of pollutants in the water quality of the study sites and activity has been represented (Figures 1-4) of Pichola lake and Fateh Sagar.
Figure 1: Physico-chemical various parameters of Pichola lake of Udaipur city during January 13- December 2014 of study.
Figure 2: Physicochemical various parameters of Pichola lake of Udaipur city during January13 to December 2014 of study.
Figure 3: Physicochemical various parameters of Fateh Sagar lake of Udaipur city during January 13 to December 2014 of study.
Figure 4: Physicochemical various parameters of Fateh Sagar lake of Udaipur city during January 13 to December 2014 of study.
DiscussionThe use of water quality indices to verify the impact
of Cordoba City (Argentina) on Suquia River [13]. water quality evaluation and trend analysis in selected watersheds of the Atlantic region of Canada [14]. An innovative index for evaluating water quality in streams [15]. Change (2005)
How to cite this article: A.K. Chittora, Chandra S K, Vidhya K. Comparative Assessment of Physicochemical Parameters of Udaipur City, (Raj.) India. Int J Environ Sci Nat Res. 2017;1(2): 555560. DOI: 10.19080/IJESNR.2017.01.555560063
International Journal of Environmental Sciences & Natural Resources
reported spatial and temporal variations of water quality in the river and its tributaries in Seoul, South Korea, 1993–2002 [16]. The development of chemical index as a measure of in-stream water quality in response to land-use and land-cover changes [17]. That application of CCME Water Quality Index to monitor water quality: a case of the Mackenzie River Basin Canada [18]. Long-term water quality monitoring of the Sejnane reservoir in northeast Tunisia [19]. Assessed that application of two water quality indices as monitoring and management tools of rivers Case study: the Imera Meridiopnale river Italy [20]. Contributed application of physicochemical data for water-quality assessment of watercourses in the Gdansk municipality (South Baltic coast) [21]. Analysis of Ground Water Quality Parameters: A Review due to human and industrial activities, the ground water is contaminated [22]. This is the serious a problem at present. Thus the analysis of the water quality is very important to preserve and protect the natural eco system. The study of Physico-chemical and biological characteristics of this ground water sample suggests that the evaluation of water quality parameters as well as water quality management practices should be carried out periodically to protect the water resources.
ConclusionThe appraisal of lakes water in Udaipur’s lakes with respect
to bacteriological and physicochemical pollution is of immense significance for improving the living standard and quality of life in this region. Therefore, monitoring of microbial contamination and pathogenic bacteria genera on a periodic basis is important and useful to arrive at measures that can act as indicators of water quality and pollution.
References1. Zandbergen PA, KJ Hall (1998) Analysis of the British Columbia Water
Quality Index for Watershed Managers: A Case Study of Two Small Watersheds. Water Qual Res J Can 33(4): 519-549.
2. Kannel PR, Lee S, Lee YS, Kanel SR, Khan SP et al. (2007) Application of Water Quality Indices and Dissolved Oxygen as Indicators for River Water Classification and Urban Impact Assessment. Environmental Monitoring and Assessment 132(1-3): 93-110.
3. Sood A, Singh KD, Pandey P, Sharma S (2008) Assessment of bacterial indicators and physicochemical parameters to investigate pollution status of Gangetic river system of Uttarakhand (India). Ecological Indicators 8: 709-717.
4. Sharma D, Singh RK (2009) DO-BOD modeling of River Yamuna for national capital territory, India using stream II, a 2D water quality model. Environmental Monitoring and Assessment 159(1-4): 231-240.
5. De Rosemond S, Duro DC, Dube M (2009) Comparative analysis of regional water quality in Canada using the water quality index. Environmental Monitoring and Assessment 156(1-4): 223-240.
6. Ashok k Agarwal, Govind S Rajwar (2010) Physico-Chemical and Microbiological Study of Tehri Dam Reservoir, Garhwal Himalaya, India. Journal of American Science 6(6).
7. Sharma D, Arun Kansal (2013) Water quality analysis of River Yamuna using water quality index in the national capital territory, India (2000-2009). Appl Water Sci 1: 147-157.
8. Usha Damodhar , M Vikram Reddy (2013) Impact of pharmaceutical industry treated effluents on the water quality of river Uppanar, South east coast of India: A case study. Appl Water Sci 3: 501-514.
9. Shib Abir (2014) Seasonal Variations in Physico-Chemical Characteristics of Rudrasagar Wetland -A Ramsar Site, Tripura, North East, India. Research Journal of Chemical Sciences 4(1): 31-40.
10. American Public Health Association (1995) Standard methods for the examination of water and wastewater. (19th edn), APHA Washington DC, USA.
11. APHA (1998) Standard Methods for the Examination of Water and Wastewater (19th edn), American Water Works Association Washington DC, USA.
12. APHA, AWWA, WEF (1998) Standards for Examination of Water and Wastewater, (20th edn), Washington DC, USA.
13. Pesce SF, Wunderlin DA (2000) Use of water quality indices to verify the impact of Cordoba City (Argentina) on Suquia River. Water Res 34: 2915-2926.
14. Khan F, Husain T, Lumb A (2003) Water quality evaluation and trend analysis in selected watersheds of the Atlantic region of Canada. Environmental Monitoring and Assessment 88(1-3): 221-242.
15. Said A, Stevens DK, Sehlke G (2004) An innovative index for evaluating water quality in streams. Environmental Management 34(3): 406-414.
16. Chang H (2005) Spatial and temporal variations of water quality in the river and its tributaries, Seoul, South Korea, 1993-2002 Water Air and Soil Pollution 161: 267-284.
17. Tsegaye T, Sheppard D, Islam KR, Johnson A, Tadess W et al. (2006) Development of chemical index as a measure of in-stream water quality in response to land-use and land-cover changes. Water Air Soil Pollution 174(1): 161-179.
18. Lumb A, Halliwell D, Sharma T (2006) Application of CCME Water Quality Index to monitor water quality: a case of the Mackenzie River Basin Canada. Environmental Monitoring and Assessment 113(1-3): 411-429.
19. Besma Zouabi Aloui, Gueddari M (2009) Long-term water quality monitoring of the Sejnane reservoir in northeast Tunisia. Bull Eng Geol Environ 68(3): 307-316.
20. Giuseppe B, Guidice RL (2010) Application of two water quality indices as monitoring and management tools of rivers. Case study: the Imera Meridiopnale River Italy. 45(4): 856-867.
21. Cieszynska M, Wesolowski M, Bartoszewicz M, Michalska M, Nowacki J et al. (2012) Application of physicochemical data for water-quality assessment of watercourses in the Gdansk municipality (South Baltic coast). Environmental Monitoring and Assessment 184(4): 2017-2029.
22. Devendra Dohare, Shriram Deshpande, Atul Kotiya (2014) Analysis of Ground Water Quality Parameters: A Review. Research Journal of Engineering Sciences 3(5): 26-31.
How to cite this article: A.K. Chittora, Chandra S K, Vidhya K. Comparative Assessment of Physicochemical Parameters of Udaipur City, (Raj.) India. Int J Environ Sci Nat Res. 2017;1(2): 555560. DOI: 10.19080/IJESNR.2017.01.555560064
International Journal of Environmental Sciences & Natural Resources
Your next submission with Juniper Publishers will reach you the below assets
• Quality Editorial service• Swift Peer Review• Reprints availability• E-prints Service• Manuscript Podcast for convenient understanding• Global attainment for your research• Manuscript accessibility in different formats
( Pdf, E-pub, Full Text, Audio) • Unceasing customer service
Track the below URL for one-step submission https://juniperpublishers.com/online-submission.php