Embed Size (px)
Citation preview
Comparative Effects of Fructose and Glucose onLipogenic Gene Expression and Intermediary Metabolismin HepG2 Liver CellsKristin M. Hirahatake1., John K. Meissen2,3., Oliver Fiehn2,3, Sean H. Adams1,4*
1 Departments of Nutrition, University of California Davis, Davis, California, United States of America, 2 Molecular and Cellular Biology, University of California Davis,
California, United States of America, 3 Genome Center, University of California Davis, Davis, California, United States of America, 4 Obesity and Metabolism Research Unit,
USDA-Agricultural Research Service Western Human Nutrition Research Center, Davis, California, United States of America
Abstract
Consumption of large amounts of fructose or sucrose increases lipogenesis and circulating triglycerides in humans.Although the underlying molecular mechanisms responsible for this effect are not completely understood, it is possible thatas reported for rodents, high fructose exposure increases expression of the lipogenic enzymes fatty acid synthase (FAS) andacetyl-CoA carboxylase (ACC-1) in human liver. Since activation of the hexosamine biosynthesis pathway (HBP) is associatedwith increases in the expression of FAS and ACC-1, it raises the possibility that HBP-related metabolites would contribute toany increase in hepatic expression of these enzymes following fructose exposure. Thus, we compared lipogenic geneexpression in human-derived HepG2 cells after incubation in culture medium containing glucose alone or glucose plus5 mM fructose, using the HBP precursor 10 mM glucosamine (GlcN) as a positive control. Cellular metabolite profiling wasconducted to analyze differences between glucose and fructose metabolism. Despite evidence for the active uptake andmetabolism of fructose by HepG2 cells, expression of FAS or ACC-1 did not increase in these cells compared with thoseincubated with glucose alone. Levels of UDP-N-acetylglucosamine (UDP-GlcNAc), the end-product of the HBP, did not differsignificantly between the glucose and fructose conditions. Exposure to 10 mM GlcN for 10 minutes to 24 hours resulted in8-fold elevated levels of intracellular UDP-GlcNAc (P,0.001), as well as a 74–126% increase in FAS (P,0.05) and 49–95%increase in ACC-1 (P,0.01) expression above controls. It is concluded that in HepG2 liver cells cultured under standardconditions, sustained exposure to fructose does not result in an activation of the HBP or increased lipogenic geneexpression. Should this scenario manifest in human liver in vivo, it would suggest that high fructose consumption promotestriglyceride synthesis primarily through its action to provide lipid precursor carbon and not by activating lipogenic geneexpression.
Citation: Hirahatake KM, Meissen JK, Fiehn O, Adams SH (2011) Comparative Effects of Fructose and Glucose on Lipogenic Gene Expression and IntermediaryMetabolism in HepG2 Liver Cells. PLoS ONE 6(11): e26583. doi:10.1371/journal.pone.0026583
Editor: Frederick G. Hamel, Omaha Veterans Affairs Medical Center, United States of America
Received August 18, 2011; Accepted September 29, 2011; Published November 11, 2011
This is an open-access article, free of all copyright, and may be freely reproduced, distributed, transmitted, modified, built upon, or otherwise used by anyone forany lawful purpose. The work is made available under the Creative Commons CC0 public domain dedication.
Funding: This work was funded in part by the following: intramural United States Department of Agriculture (USDA)-Agricultural Research Service Projects 5306-51530-016-00D and 5306-51530-019-00 and a pilot grant from the Diabetes Action and Research Education Fund (to SHA). USDA is an equal opportunity providerand employer. The funders had no role in study design, data collection and analysis, decision to publish, or preparation of the manuscript.
Competing Interests: The authors have declared that no competing interests exist.
* E-mail: [email protected]
. These authors contributed equally to this work.
Introduction
Understanding the etiology and consequences of obesity in the
context of the current nutritional environment could lead to
prevention and intervention methods that will greatly improve
metabolic health outcomes. The deleterious consequences of
disorders prevalent in obesity including dyslipidemia, consisting of
hypercholesterolemia (high LDL), low HDL, and hypertriglycer-
idemia, have made obesity a major national public health concern.
The increasing trend of overweight, obesity and related metabolic
disease is thought to be the result of dietary changes (e.g.,
increased calorie intakes coupled to nutrient-poor, calorie-rich
foods) that have not been countered by adequate physical activity.
While not proof of causation, the historic obesity prevalence trend
parallels the increase in dietary sugar and high fructose corn syrup
(HFCS) consumption by the U.S. population, leading some to
propose that fructose intake has played a role in driving positive
energy balance and overweight [1]. Furthermore, compared with
glucose, high fructose intake is associated with an enhanced rate of
de novo lipogenesis (DNL) and increased circulating lipids in
humans [2,3], with the caveat that most experiments have been
conducted at very high levels of dietary sugar intake. In human
subjects fed high fructose diets over 10 weeks, hepatic DNL was
increased significantly compared to glucose [4]. Furthermore, the
prevalence and severity of non-alcoholic steatohepatitis appears to
be higher in persons consuming high fructose diets [5,6,7]. The
liver is the primary site of DNL [8] and is responsible for the
utilization of most of the dietary fructose arriving via the portal
vein, on the order of .70% [9,10,11]. However, the exact
molecular mechanisms that underlie increased hepatic lipid
production following consumption of high fructose diets are not
clear.
Current evidence indicates that the lipogenic nature of fructose
is largely due to the availability of hepatic triose-phosphates and
PLoS ONE | www.plosone.org 1 November 2011 | Volume 6 | Issue 11 | e26583
pyruvate following fructose consumption that serve as precursors
for fatty acid synthesis, as reviewed by Havel [12]. Phosphoryla-
tion of fructose to fructose-1-phosphate (F-1-P) by the enzyme
fructokinase (KHK) promotes direct flow of fructose carbon into
the glycolytic pathway, bypassing a key regulatory enzyme of
glycolysis, phosphofructokinase (PFK). For this reason, a higher
proportion of the carbon from ingested fructose, as compared with
glucose, is metabolized into triglycerides [12]. Another possible
explanation for the increase in DNL seen in response to high
fructose consumption is increased expression and activation of
components of the lipogenic enzymatic pathway in the liver. It is
well documented that feeding of high sucrose or high fructose diets
(or drinking high levels of these sugars) to mice and rats increases
the mRNA levels and enzymatic activities of the key lipogenic
enzymes fatty acid synthase (FAS) and acetyl-CoA carboxylase
(ACC-1, or ACCa) in the liver [13,14,15,16,17,18]. Several
investigators have found that fructose feeding in rodents results in
increased FAS activity and hepatic triglyceride content when
compared with isocaloric diets of glucose, sucrose, or starch
[14,19,20]. High fructose feeding to rodents has also been shown
to raise the hepatic mRNA levels of transcription factors, including
sterol regulatory element binding protein-1 (SREBP-1) and
carbohydrate response element binding protein (ChREBP),
involved in the regulation of genes encoding glycolytic and
lipogenic enzymes [18,21,22]. However, it is unknown whether
such gene-level changes occur in human liver in response to
increased consumption or tissue exposure to fructose, and the
specific metabolic signals that trigger lipogenic gene expression in
response to fructose or sucrose remain to be identified.
The metabolic and lipogenic enzyme expression outcomes
observed with high fructose feeding in rodents are strikingly similar
to those resulting from activation of the hexosamine biosynthesis
pathway (HBP), a minor branch from glycolysis whose initial
substrate is fructose-6-phosphate (F-6-P). For instance, it has been
demonstrated that chronic flux through the HBP in transgenic
mice overexpressing glutamine:fructose-6-phosphate amidotrans-
ferase (GFAT, the rate-limiting enzyme of the HBP) leads to
insulin resistance and hyperlipidemia [23,24]. In isolated adipo-
cytes from GFAT transgenic mice, glucosamine (GlcN) that
directly enters the HBP at the level of GlcN-6-P up-regulated
mRNA levels for FAS and ACC-1 in a dose-dependent manner
and to a greater extent than glucose [25]. The overexpression of
GFAT in human HepG2 liver cells resulted in 19-fold and 7-fold
increases in FAS and SREBP-1 transcript levels, respectively, and
these effects were abolished by treatment with a GFAT inhibitor
[26]. The HBP has been characterized as a mediator of nutrient
sensing and metabolic regulation, and the major end product of
the HBP, UDP-N-acetylglucosamine (UDP-GlcNAc), can react
with serine or threonine residues of nuclear and cytosolic proteins.
Increasing the UDP-GlcNAc pool results in enhanced O-linked
glycosylation of transcription factors, such as Sp-1, involved in the
regulation of gene expression by nutrients [27,28]. Thus, increased
flux through the HBP, as expected following a glucose-rich meal or
under hyperglycemic conditions, would in theory promote
lipogenic gene expression to accommodate energy storage as
lipid. It remains to be established whether activation of the HBP is
a physiologic regulator of lipogenic genes in human liver.
In the current experiments, we investigated the hypothesis that
high fructose exposure would increase hexosamine generation in
human hepatocytes, and that this increase would be associated
with increased lipogenic gene expression. The rationale for this
hypothesis is as follows. In the liver, the first step of glucose
metabolism involves its phosphorylation to glucose-6-phosphate
(G-6-P) by hexokinases (HKs), after which the G-6-P is further
metabolized to either G-1-P (precursor for glycogen synthesis) by
phosphoglucomutase or to F-6-P by phosphoglucose isomerase.
The F-6-P enters glycolysis, the pentose phosphate pathway, or the
HBP as a hexosamine precursor via conversion to GlcN-6-P by
GFAT. In theory, fructose could also trigger formation of F-6-P by
hexokinases traditionally associated with glucose metabolism. For
instance, it was shown that HK2 and HK4 are capable of
phosphorylating fructose directly to F-6-P: Katzen et al.
determined the Km for glucose and fructose of rat HK2 to be
1.461024 M and 3.061023 M, respectively [29], and Malaisse et
al. reported that 25% of hepatic fructose in rats is phosphorylated
to F-6-P by HK4 [30]. Studies have also shown that glucose
confers kinetic cooperativity to human liver and b-cell hexokinase
toward fructose phosphorylation to F-6-P [31,32]. Finally, it is
possible that active fructose metabolism to triose-phosphates could
increase the intracellular G-6-P pool, and hence promote F-6-P
generation and HBP flux through attenuation of glucose
catabolism and not as a direct F-6-P precursor. To test the
hypothesis that fructose activates lipogenic enzyme expression
associated with an increase in HBP metabolites, a human HepG2
liver cell model was used to determine detailed temporal patterns
of FAS and ACC-1 expression coupled to intracellular metabolite
profiling following fructose treatment compared with the effects
measured in cells incubated in glucose alone.
Materials and Methods
MaterialsMEM and MEM non-essential amino acids were purchased
from Cellgro (Manassas, VA), fetal bovine serum (FBS, Lot #60816) was purchased from Atlas Biologicals (Fort Collins, CO),
and cell culture plates were purchased from BD Falcon (Franklin
Lakes, NJ). A human total RNA tissue panel was obtained from
Clontech (Mountain View, CA; Cat #636643). Antibodies were
purchased from Cell Signaling Technology, Inc. (Danvers, MA).
Cell CultureHepG2 cells (a human hepatocarcinoma cell line; ATCC HB-
8065) were cultured in MEM (Minimum Essential Medium Eagle)
containing 10% (v:v) FBS, 100 U/mL penicillin and 100 mg/mL
(Invitrogen, Carlsbad, CA), 16 MEM non-essential amino acids,
and 5.5 mM glucose. Cells were maintained at 37uC in a 5%
CO2/air environment. Cells were grown to between four and six
passages in 10 cm tissue culture dishes with 14 mL MEM, and
transferred to MULTIWELLTM 6 well culture dishes for
incubation in 3 mL of the treatment medium. Upon reaching
80% confluency, the cell culture medium was changed to 5.5 mM
glucose MEM plus 5 mM fructose, or 5.5 mM glucose MEM plus
10 mM GlcN. The control plates received fresh 5.5 mM glucose
MEM. These conditions allowed for exposure of liver cells to a
physiological concentration of glucose, similar to what would be
anticipated in vivo where the liver is never exposed to fructose
alone.
Gene Expression AnalysismRNA was prepared from cells grown for 24, 48 or 72 hours in
the respective treatments. This experiment was repeated three
times with n = 2/treatment per experiment, to give a total of n = 6
per treatment group. Total RNA was extracted using a RiboPureHKit (Ambion, Austin, TX) per manufacturer’s protocol. RNA
abundance and integrity were checked using a NanoDropH ND-
1000 Spectrophotometer (NanoDrop Technologies, Wilmington,
DE) and an Agilent 2100 bioanalyzer (Agilent, Foster City, CA)
per manufacturer’s instructions. One microgram of total RNA was
Fructose and Liver Hexosamines
PLoS ONE | www.plosone.org 2 November 2011 | Volume 6 | Issue 11 | e26583

reverse transcribed into cDNA using the SuperScriptH III reverse
transcriptase (Invitrogen) followed by RNase –H treatment as per
manufacturer’s instructions. The quantitative real-time PCR
assays utilized gene-specific TaqManH primers and FAM-MGB
labeled probes (Assays-on-DemandH, Applied Biosystems, Foster
City, CA) and were analyzed in triplicate for each sample using an
ABI 7900HT instrument. Reactions were carried out in a 384-well
format containing the following in each well: cDNA corresponding
to 20 ng of original total RNA, 16 specific primer probe mix and
16 Master Mix (ABI Taqman Gene Expression Master Mix);
cDNA was air dried in each well prior to adding qPCR reagents to
facilitate an 8 mL/well assay. Cycle conditions were 50u C for
2 minutes, 95uC for 10 minutes, then 40 cycles of 95uC for 15 s/
60uC for 1 minute. Amplification cycle threshold number (Ct) of
housekeeping mRNA (HPRT1) for each sample was determined
using commercial HPRT1 primers and probes (ABI,
Hs99999909_m1 ) to correct for template loading differences
across all target genes (DCt = target gene Ct2reference gene Ct),
and expression values were determined relative to treatment
control transcript levels using a mathematical formula previously
described [33]. Amplicon sizes were checked by high resolution
3% MetaPHORH agarose gel (Cambrex Bio Science Inc.,
Rockland, ME). Primer/probe ABI identifiers for gene expression
studies were FASN (Hs01005622_m1), ACACA (Hs01046047_m1),
KHK (Hs00240827_m1), SREBP1 (Hs01088691_m1), ChREBP
(Hs00263027_m1), GCK (Hs01564555_m1), HK2 (Hs00606086_
m1), SLC2A2 (Hs01096904_m1), and SLC2A5 (Hs00161720).
Western Blot AnalysisFollowing exposure to 5.5 mM glucose-containing MEM alone
(controls) or 5.5 mM glucose MEM plus 5 mM fructose or 10 mM
glucosamine for 48 hours, HepG2 cells (n = 6/treatment) were
washed once with HBSS, lysed with M-PER (mammalian protein
extraction reagent) with 16 HALT protease and phosphatase
inhibitors (Thermo Fisher SC), and sonicated for 10 s. Lysates
were centrifuged at 20,000 g at 4uC for 10 min. Protein
concentrations were quantitated using the bicinchoninic protein
assay (Pierce). For FAS and ACC-1, 30 mg of total protein was
separated on a 3–8% Tris-Acetate gel using Tris-Acetate SDS
running buffer (Invitrogen). The proteins were transferred to a
polyvinylidene diflouride membrane and immunoblotted with
rabbit anti-FAS or anti-ACC-1 antibody (1:1000) in PBST for
1 hour at room temperature. Specific signal was detected with a
horseradish peroxidase-conjugated secondary antibody (1:5000
goat anti-rabbit HRP) using Immun-StarTM WesternCTM Kit
(BioRad Laboratories, Hercules, CA). Blots were imaged using a
ChemiDocTM XRS+ Imaging System (BioRad). b-actin was used
as a loading control.
Fructose and Glucose Utilization AnalysesChanges in the fructose and glucose concentrations in aliquots
from the culture media containing 5.5 mM glucose alone or with
5 mM fructose after HepG2 incubation for 24 hour periods were
determined using modification of a commercial glucose/fructose
analytical kit (Megazyme, catalog item K-FRUGL; Xygen
Diagnostics Inc., Burgessville, Ontario, Canada) as previously
described [10].
Lactate ProductionLactate production was measured by quantifying the amount of
lactate in the conditioned media using a modification of the assay
methodology for the SYNCHRONH System (Beckman Coulter
Inc., Brea, CA). The assay employs the conversion of lactate to
pyruvate and hydrogen peroxide (H2O2) by lactate dehydrogenase,
followed by peroxidase-facilitated reaction of H2O2 with dichlor-
obenzenesulfonic acid (DCBSA) and 4-aminoantipyrine to form a
chromophore that is measured spectrophotometrically at 512 nm.
The reaction conditions were: 10 mL sample added to 200 mL of
assay reagent (100 mM Tris (pH 7.4), 700 U/L lactate oxidase,
1000 U/L peroxidase, 2 mM DCBSA, 1.16 mM 4-aminoantipyr-
ine) and incubated in the dark for 10 minutes before analysis.
Metabolite Profile AnalysisFor pilot work to establish conditions for cellular metabolite
analysis over time, HepG2 cells (56105 cells/well) were cultured in
MULTIWELLTM 12 well culture dishes containing 2 mL/well of
5.5 mM glucose MEM, MEM+5 mM fructose, or MEM+10 mM
GlcN. Media was replenished at 24 hr and at 48 hr, after which
cell extractions were carried out after 10 min, 60 min, 6 hr, or
24 hr. For extraction, culture plates were immediately placed on
ice and each well was rinsed twice with 1 mL ice-cold PBS and
then 4 mL ice cold 3:1 methanol/H2O solvent was added
(assuming the ratio 1 mL solvent/2 mg tissue based on pilot
studies measuring cell pellet weight/well). Cells, along with the
extraction reagent, were scraped into 5 mL collection tubes kept
on ice and the samples were stored at 280uC before analysis.
Cellular metabolite concentrations were determined using
either GC-TOF (fructose, G-6-P, F-1-P, and F-6-P) or LC-MS
(GlcN-6-P and UDP-GlcNAc). For the GC-TOF and LC-MS
analyses, samples were thawed on ice and vortexed for 20 s,
sonicated continuously for 5 min (VWR 50HT Ultrasonic bath),
and separated into 500 mL aliquots. Each aliquot was centrifuged
for 5 min @ 14,000 g, and the supernatant was collected and
lyophilized to dryness. Samples were kept on ice whenever
possible, removed only for sonication, centrifugation, and
lyophilization steps. The GC-TOF protocol and procedure then
followed a method previously described [34]. For the LC-MS
analysis lyophilized material was re-dissolved in 100 mL initial LC
gradient solvent and analyzed within 24 hr. Chromatography was
performed on an Agilent 1200 Series HPLC system (Agilent
Technologies, Santa Clara, CA). Samples were housed in an
autosampler maintained at 4uC, and 5 mL of material was injected
on a Luna 3 mm NH2 2.06150 mm column (Phenomenex,
Torrence, CA). Column temperature was kept at 40uC. Mobile
phase consisted of H2O with 10 mM ammonium acetate and
10 mM ammonium hydroxide (A) and 9:1 acetonitrile/H2O with
10 mM ammonium acetate and 10 mM ammonium hydroxide
(B). The gradient method was: 0–2 min at 50% B, 2–5 min of a
linear gradient to 0% B, and 5–20 min at 0% B. The column was
re-equilibrated for 15 min following each sample separation, and
flow rate was constant at 0.4 mL/min. LC eluents were analyzed
with an Agilent 6530 accurate-mass Q-TOF mass spectrometer
equipped with an Agilent Jet Stream ESI source in negative ion
mode. MS data was collected with a 0.25 sec scan rate in both
profile and centroid modes, and mass calibration was maintained
by constant infusion of reference ions at 112.9856 and 980.0164
m/z. MS/MS data generation was targeted for GlcN-6-P. The
parent ion m/z was isolated between 7.5–12.5 min with a 1.3 m/z
isolation width and a constant collision energy of 15 eV.
These experiments confirmed that, under the cell culture
conditions used for gene expression work, detection of targeted
metabolites could be readily achieved and changes in analyte
concentrations could be observed over time (see Results and
Figures S1, S2, and S3). Experiments to test for metabolite profiles
in glucose vs. fructose-treated HepG2 cells mimicked the pilot
work but also included a treatment with 10.5 mM glucose to
match the total sugar concentration of the MEM+5 mM fructose
treatment.
Fructose and Liver Hexosamines
PLoS ONE | www.plosone.org 3 November 2011 | Volume 6 | Issue 11 | e26583

StatisticsData were analyzed using Prism software version 5.02
(GraphPad, San Diego, CA). Values in the text are means 6
S.E.M. One-way ANOVA followed by Dunnett’s multiple
comparison test was used for multiple comparison studies within
a treatment timepoint. Two-way ANOVA was used for metabolite
analyses; comparing time, treatment, and time6treatment inter-
actions. A P value of 0.05 was considered significant. Bartlett’s test
for variance homogeneity was used to determine that variance was
equal within each experiment. Each experiment was repeated a
minimum of 3 times, and the sample sizes per treatment are
indicated in the text, figure legends and tables.
Results
Characterization of carbohydrate metabolism capacity inHepG2 cells
To establish that HepG2 cells are a valid model for studying
fructose metabolism, we first confirmed the expression of relevant
transporters and enzymes required for liver carbohydrate
catabolism. The abundances of glucose transporter 2 (GLUT 2,
primary liver glucose and fructose transporter), GLUT 5 (fructose
transporter), HK2, HK4 (glucokinase, GCK), and fructokinase
(KHK) mRNAs in cells grown in standard 5.5 mM glucose MEM
were compared with that of a commercially-available human
tissue panel (Table 1). Quantitative real-time PCR results showed
expression of all key components in HepG2 cells except HK4. In
human liver, HK4 was detectable, yet not before 30 PCR cycles.
To ascertain if our treatments impacted the expression of these
genes in HepG2 cells, further experiments were conducted to
examine the mRNA levels of these targets following incubation in
the three types media after 24, 48 and 72 hours (Table 2).
Incubation of the cells in 5.5 mM glucose MEM plus 5 mM
fructose did not significantly affect the level of gene expression of
these components at any time point compared with control cells
grown in 5.5 mM glucose MEM, with the exception of 24 hr
when GLUT2 expression was lower in the fructose-treated group.
In cells treated with MEM plus 10 mM GlcN, GLUT5 transcript
levels were increased at 48 and 72 hr and HK2 expression was
increased at the 24 hr timepoint.
The HepG2 cells actively metabolized fructose, as 24 hr
conditioned media from cells exposed to 5.5 mM glucose
MEM+5 mM fructose revealed substantial decreases in media
fructose concentrations over time (see Fig. S1), which equates to
significant net fructose uptake in the cells. Uptake of fructose from
the media was 3.860.5, 6.861.3, and 7.060.9 mmol/24 hr at the
24, 48, and 72 hr treatment timepoints, respectively. Net uptake of
glucose by cells grown in media containing fructose was similar to
controls, with 10.861.1, 11.660.6, and 13.660.3 mmol glucose/
24 hr at the 24, 48, and 72 hr treatment timepoints; for
comparison, control cells grown in 5.5 mM glucose MEM utilized
9.560.7, 12.060.2, and 14.1 mmol glucose/24 hr at each of the
respective timepoints, and these values were not significantly
different compared to fructose-treated cells. Cells grown in control
5.5 mM glucose MEM produced 5.060.8, 4.760.4, and
6.460.9 mmol lactate/24 hr at 24, 48, and 72 hours of treatment,
values that were not significantly different compared to cells grown
in glucose plus fructose: 5.960.2, 5.260.8, and 7.161.3 mmol
lactate/24 hr and 24, 48, and 72 hours, respectively.
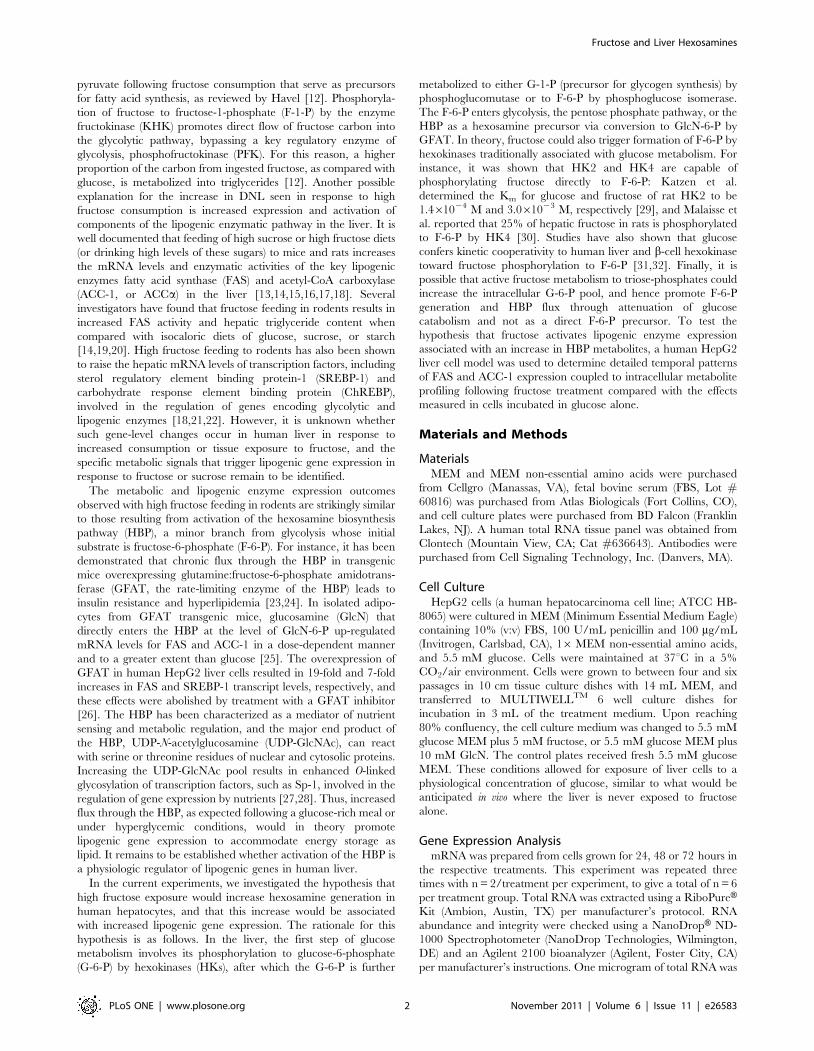
Effects of fructose on lipogenic gene expressionQuantitative RT-PCR results demonstrated a significant
increase in the abundance of key lipogenic enzyme mRNA levels
in HepG2 cells cultured in 10 mM GlcN-enriched medium for 24,
48, and 72 hours compared with those grown in control or
fructose-enriched medium (Fig. 1A and 1B). Transcript levels of
FAS were increased up to 125.7623.6% compared to the glucose-
only control group and ACC-1 mRNA abundance increased up to
95.0625.2% relative to controls. A follow-up study using earlier 1
and 6 hr endpoints (n = 4/group) did not reveal any change in
FAS or ACC-1 gene expression among the conditions. Contrary to
our hypothesis, the addition of 5 mM fructose to the culture
medium produced no induction of FAS or ACC-1 mRNA above
controls. The mRNA levels of the transcription factors SREBP-1
and ChREBP did not differ significantly across the three groups
(data not shown). Additionally, we examined whether the protein
levels of FAS and ACC-1 corresponded with the gene expression
results seen after 48 hr of treatment. Cells treated with GlcN
exhibited a significant increase in FAS protein, however there was
Table 1. mRNA expression profile of transporters andenzymes important for simple carbohydrate catabolism inHepG2 cells and human tissues using real-time PCR.
Gene
GLUT 2 GLUT 5 HK 2 GCK KHK
Tissue% of human liver mRNAabundance
Liver 100 100 100 100 100
HepG2 67 132 14262 ND 175
Dorsal Root Ganglion #1 1759 201 #1 10
Spleen ND 387 272 #1 #1
Stomach #1 360 484 2 4
Bone Marrow ND 6824 1287 ND #1
Heart #1 938 497 #1 2
Kidney 29 14374 85 #11 396
Lung ND 209 984 ND 4
Placenta ND 776 994 ND #1
Skeletal Muscle ND 11259 2661 #1 2
Spinal Cord #1 10960 1188 9 9
Testis #1 64189 10151 5 17
Uterus ND 331 141 #1 4
Colon ND 2069 6975 #1 14
Pancreas #1 22.1 28 14 2
Small Intestine 21 26820 110 #1 97
Fetal Liver 33 191 182 ND 21
Fetal Brain #1 1467 478 4 17
Adrenal Gland #1 493 199 2 4
Brain #1 1494 311 9 16
Cerebellum ND 75 1077 ND 5
Prostate #1 6702 807 #1 2
Salivary Gland ND 112 225 #1 2
Thymus #1 661 477 2 #1
Thyroid #1 197 837 20 2
Trachea #1 209 592 ND 2
GLUT 2 (SLC2A2), solute carrier family 2 member 2; GLUT 5 (SLC2A5), solutecarrier family 2 member 5;HK2, hexokinase 2; GCK, glucokinase (hexokinase 4); KHK, ketohexokinase(fructokinase).ND = Not detected.doi:10.1371/journal.pone.0026583.t001
Fructose and Liver Hexosamines
PLoS ONE | www.plosone.org 4 November 2011 | Volume 6 | Issue 11 | e26583
no effect of fructose or glucose treatments (Fig. 2A). Differences in
ACC-1 protein across treatments were not observed (Fig. 2B).
GC/MS and LC/MS metabolite profiles of HepG2 cellsTo determine if fructose consumption by HepG2 cells resulted
in an increase in cellular HBP metabolites, metabolite-profiling
studies were conducted in cells grown 5.5 mM glucose alone or
5.5 mM glucose plus 5 mM fructose. Cells cultured in the
hexosamine precursor GlcN (5.5 mM glucose MEM+10 mM
GlcN) were used as a positive control for HBP metabolites. Pilot
studies (see Materials and Methods; n = 2/treatment) confirmed
that under the cell culture conditions and extraction protocol
employed, HBP metabolites including UDP-N-acetylglucosamine
(UDP-GlcNAc) and GlcN-6-P as well as several carbohydrate
metabolites of interest (e.g., fructose, F-6-P, F-1-P and G-6-P)
could be readily detected. Preliminary data from this analysis
showed high levels of UDP-GlcNAc, the major end product of the
HBP, in the GlcN treated cells (see Fig. S2). Interestingly, GlcN-6-
P levels were trace to non-detectable under all conditions,
suggestive of rapid flux of precursor metabolites toward UDP-
GlcNAc. As expected, high amounts of cellular fructose were
detected in the cells exposed to fructose-enriched medium,
whereas only trace amounts were seen in the other groups. For
instance, in fructose treated cells, the level of fructose (average
quantifier peak ion height) 10 min after fresh medium was 19,743
and increased to 26,406 after 1 hr. The fructose concentration
decreased over the next two timepoints (Fig. S3A). Cellular F-6-P
was also readily detectable at all timepoints and under all
treatment conditions (Fig. S3B). F-1-P was not measured in this
preliminary analysis. These findings established the time frame
and conditions that would be used for the broader study, and
provided initial preliminary evidence for a lack of effect of fructose
on HepG2 HBP metabolites.
Having established the conditions for the larger experiment, we
chose to harvest cells after 10 min exposure to 10 mM GlcN to again
validate that HepG2 cells demonstrate HBP activity and that these
downstream metabolites could be detected. Consistent with the
results of the pilot data, incubation of HepG2 cells in 10 mM GlnN-
enriched medium resulted in the robust accumulation of cellular
UDP-GlcNAc (Fig. 3). The abundance of UDP-GlcNAc in cells
exposed to GlcN was 7 to 10 times greater than cells grown in the
other three conditions. There was no significant difference in the
amount of this metabolite in cells grown in 10.5 mM glucose and
5.5 mM glucose plus 5 mM fructose at any time point. At 24 h, there
was significantly less UDP-GlcNAc detected in the 5.5 mM glucose
condition, although this is expected due to the lower concentration of
total sugar in the media over time as glucose was consumed.
This set of experiments provided further confirmation of the
active uptake and metabolism of fructose from the media by
HepG2 cells. Cellular fructose levels reached a peak 10 min to
1 hr following the addition of new fructose-enriched media
(Fig. 4A). Evidence of fructose metabolism is clear from the
elevated amounts of F-1-P found in the cells incubated in fructose-
containing medium, compared with the glucose groups (Fig. 4B).
Several interesting trends were also seen in primary metabolites
of glucose metabolism. In HepG2 cells grown in both 5.5 mM and
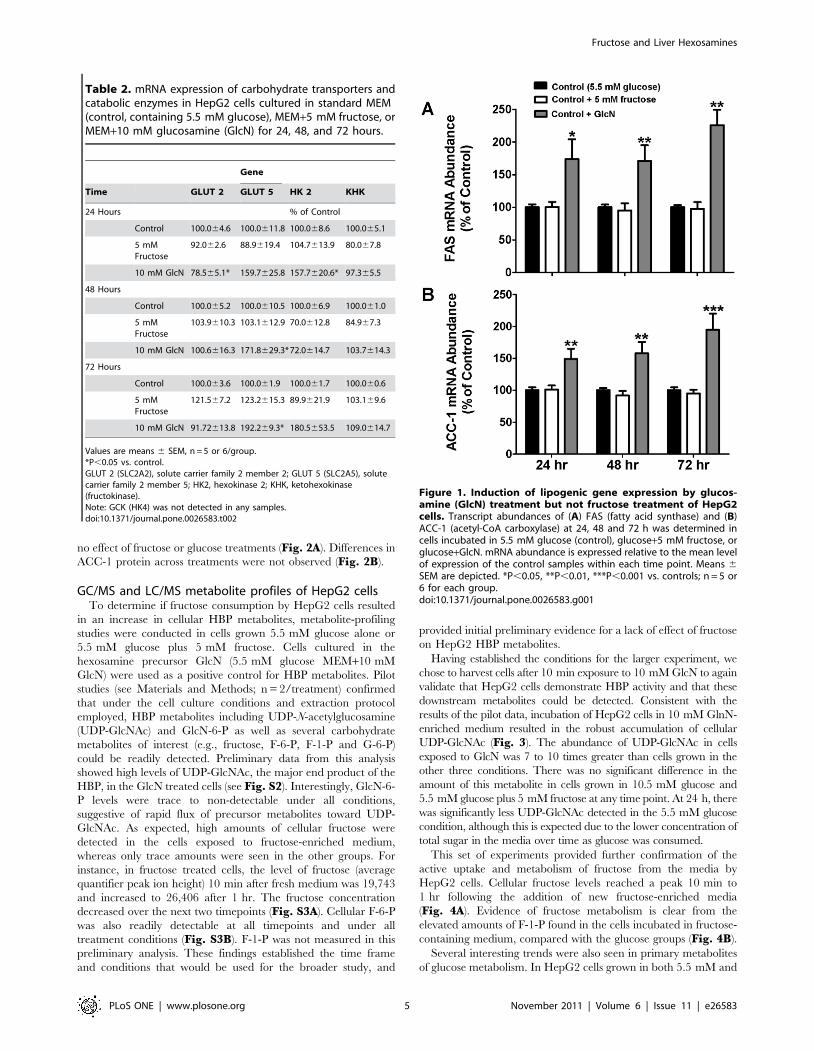
Table 2. mRNA expression of carbohydrate transporters andcatabolic enzymes in HepG2 cells cultured in standard MEM(control, containing 5.5 mM glucose), MEM+5 mM fructose, orMEM+10 mM glucosamine (GlcN) for 24, 48, and 72 hours.
Gene
Time GLUT 2 GLUT 5 HK 2 KHK
24 Hours % of Control
Control 100.064.6 100.0611.8 100.068.6 100.065.1
5 mMFructose
92.062.6 88.9619.4 104.7613.9 80.067.8
10 mM GlcN 78.565.1* 159.7625.8 157.7620.6* 97.365.5
48 Hours
Control 100.065.2 100.0610.5 100.066.9 100.061.0
5 mMFructose
103.9610.3 103.1612.9 70.0612.8 84.967.3
10 mM GlcN 100.6616.3 171.8629.3* 72.0614.7 103.7614.3
72 Hours
Control 100.063.6 100.061.9 100.061.7 100.060.6
5 mMFructose
121.567.2 123.2615.3 89.9621.9 103.169.6
10 mM GlcN 91.72613.8 192.269.3* 180.5653.5 109.0614.7
Values are means 6 SEM, n = 5 or 6/group.*P,0.05 vs. control.GLUT 2 (SLC2A2), solute carrier family 2 member 2; GLUT 5 (SLC2A5), solutecarrier family 2 member 5; HK2, hexokinase 2; KHK, ketohexokinase(fructokinase).Note: GCK (HK4) was not detected in any samples.doi:10.1371/journal.pone.0026583.t002
Figure 1. Induction of lipogenic gene expression by glucos-amine (GlcN) treatment but not fructose treatment of HepG2cells. Transcript abundances of (A) FAS (fatty acid synthase) and (B)ACC-1 (acetyl-CoA carboxylase) at 24, 48 and 72 h was determined incells incubated in 5.5 mM glucose (control), glucose+5 mM fructose, orglucose+GlcN. mRNA abundance is expressed relative to the mean levelof expression of the control samples within each time point. Means 6SEM are depicted. *P,0.05, **P,0.01, ***P,0.001 vs. controls; n = 5 or6 for each group.doi:10.1371/journal.pone.0026583.g001
Fructose and Liver Hexosamines
PLoS ONE | www.plosone.org 5 November 2011 | Volume 6 | Issue 11 | e26583

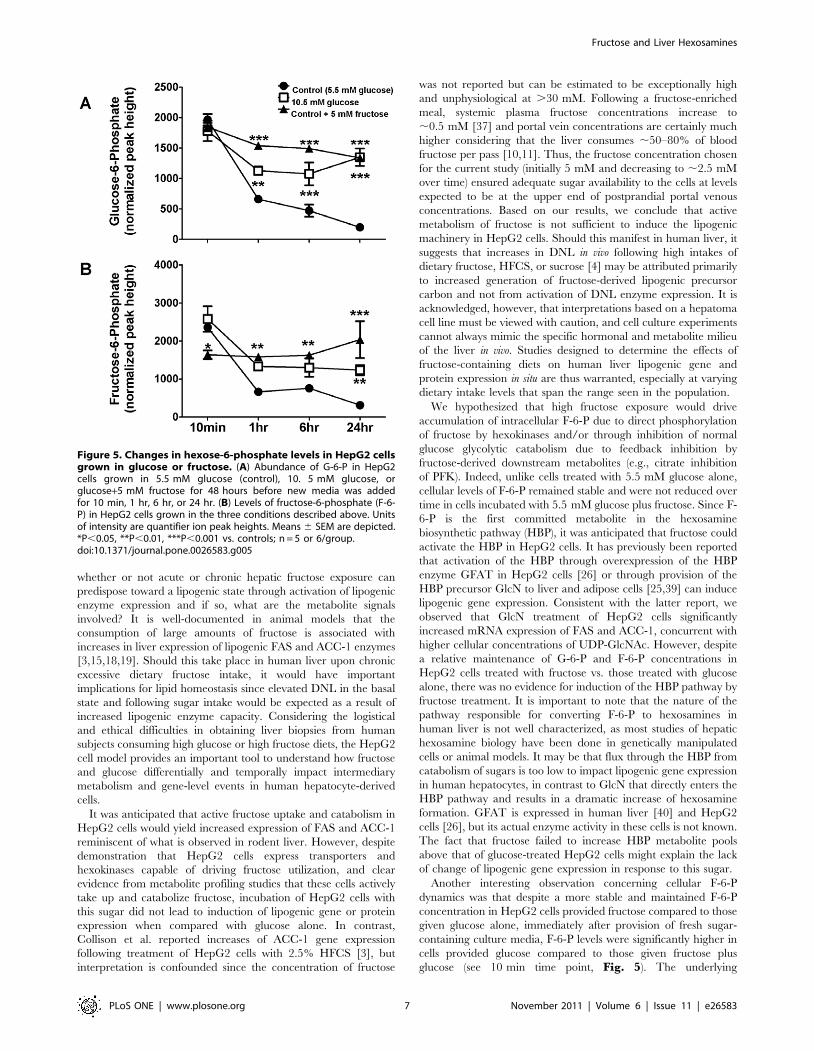
10.5 mM glucose, the abundance of G-6-P was highest 10 min
after fresh media was added and decreased progressively over time
(Fig. 5A). Cellular levels of G-6-P in fructose-treated cells also
follow a downward trend over the course of 24 hr. However,
despite media glucose uptake equivalent to cells grown in standard
5.5 mM glucose MEM (see above), cellular G-6-P levels in the
fructose group remained significantly elevated over those of cells
grown in standard MEM throughout the time course. Similar
findings were seen in the cellular concentrations of F-6-P, a
metabolite classically thought to be produced primarily by the
isomerization of G-6-P via phosphoglucose isomerase. HepG2
cells grown in either concentration of glucose alone exhibited a
decrease in the cellular abundance of F-6-P over time (Fig. 5B),
consistent with the diminishing precursor pool (G-6-P). This trend
was more pronounced in the 5.5 mM glucose condition. In
contrast, levels of F-6-P in cells grown in MEM plus 5.5 mM
fructose remained constant over time.
Discussion
The increase of lipogenesis and circulating triglycerides
following high intake of fructose or sucrose in humans is well
established [4,35,36,37], but the underlying molecular mecha-
nisms driving this effect are not completely understood. The
canonical model of hepatic fructose metabolism is that fructose is
readily metabolized in the liver to F-1-P via the action of KHK
(fructokinase) and this leads to entry of lipogenic carbon into the
glycolytic cycle below the key glycolysis regulatory point PFK
[11,38]. Our current metabolite profiling studies are consistent
with this since the concentration of F-1-P was rapidly and
significantly increased in HepG2 cells grown in a fructose-enriched
media. Questions that have remained unanswered, however, are
Figure 2. Elevation of FAS but not ACC-1 protein levels by GlcN treatment in HepG2 cells. Protein levels of key lipogenic enzymes (A) FASand (B) ACC-1 in HepG2 cells incubated for 48 hours in media containing 5.5 mM glucose, glucose+5 mM fructose, or glucose+10 mM GlcN.Significant increase in FAS protein levels of HepG2 cells exposed to 10 mM GlcN relative to control was seen. There was no statistical differencebetween the protein levels of ACC-1 in any of the treatment groups. *P,0.05 vs. controls. Means 6 SEM are depicted; n = 6 for each group.doi:10.1371/journal.pone.0026583.g002
Figure 3. Cellular concentrations of UDP-GlcNAc in HepG2 cellsfollowing exposure to glucose and fructose or glucose alone.LC-QTOF results for cellular levels of UDP-GlcNAc in HepG2 cells at10 min, 1 hr, 6 hr, or 24 hr time points following the addition of culturemedium. The 10 mM GlcN condition, serving as a positive control,showed significant induction of the hexosamine biosynthesis pathway(HBP). Unit of intensity is quantifier ion peak height. Means 6 SEM aredepicted. ***P,0.001 vs. controls; n = 3–6/group.doi:10.1371/journal.pone.0026583.g003
Figure 4. Concentrations of fructose metabolites in HepG2cells incubated in the presence of glucose and fructose orglucose alone. (A) Cellular levels of fructose in HepG2 cells grown in5.5 mM glucose (control), 10.5 mM glucose, or 5.5 mM glucose+5 mMfructose for 48 hours before new media was added for 10 min, 1 hr,6 hr, or 24 hr. (B) Levels of fructose-1-phosphate (F-1-P) in HepG2 cellsgrown in the three conditions described above. Units of intensity arequantifier ion peak heights. Means 6 SEM are depicted. ***P,0.001 vs.controls; n = 5 or 6/group.doi:10.1371/journal.pone.0026583.g004
Fructose and Liver Hexosamines
PLoS ONE | www.plosone.org 6 November 2011 | Volume 6 | Issue 11 | e26583
whether or not acute or chronic hepatic fructose exposure can
predispose toward a lipogenic state through activation of lipogenic
enzyme expression and if so, what are the metabolite signals
involved? It is well-documented in animal models that the
consumption of large amounts of fructose is associated with
increases in liver expression of lipogenic FAS and ACC-1 enzymes
[3,15,18,19]. Should this take place in human liver upon chronic
excessive dietary fructose intake, it would have important
implications for lipid homeostasis since elevated DNL in the basal
state and following sugar intake would be expected as a result of
increased lipogenic enzyme capacity. Considering the logistical
and ethical difficulties in obtaining liver biopsies from human
subjects consuming high glucose or high fructose diets, the HepG2
cell model provides an important tool to understand how fructose
and glucose differentially and temporally impact intermediary
metabolism and gene-level events in human hepatocyte-derived
cells.
It was anticipated that active fructose uptake and catabolism in
HepG2 cells would yield increased expression of FAS and ACC-1
reminiscent of what is observed in rodent liver. However, despite
demonstration that HepG2 cells express transporters and
hexokinases capable of driving fructose utilization, and clear
evidence from metabolite profiling studies that these cells actively
take up and catabolize fructose, incubation of HepG2 cells with
this sugar did not lead to induction of lipogenic gene or protein
expression when compared with glucose alone. In contrast,
Collison et al. reported increases of ACC-1 gene expression
following treatment of HepG2 cells with 2.5% HFCS [3], but
interpretation is confounded since the concentration of fructose
was not reported but can be estimated to be exceptionally high
and unphysiological at .30 mM. Following a fructose-enriched
meal, systemic plasma fructose concentrations increase to
,0.5 mM [37] and portal vein concentrations are certainly much
higher considering that the liver consumes ,50–80% of blood
fructose per pass [10,11]. Thus, the fructose concentration chosen
for the current study (initially 5 mM and decreasing to ,2.5 mM
over time) ensured adequate sugar availability to the cells at levels
expected to be at the upper end of postprandial portal venous
concentrations. Based on our results, we conclude that active
metabolism of fructose is not sufficient to induce the lipogenic
machinery in HepG2 cells. Should this manifest in human liver, it
suggests that increases in DNL in vivo following high intakes of
dietary fructose, HFCS, or sucrose [4] may be attributed primarily
to increased generation of fructose-derived lipogenic precursor
carbon and not from activation of DNL enzyme expression. It is
acknowledged, however, that interpretations based on a hepatoma
cell line must be viewed with caution, and cell culture experiments
cannot always mimic the specific hormonal and metabolite milieu
of the liver in vivo. Studies designed to determine the effects of
fructose-containing diets on human liver lipogenic gene and
protein expression in situ are thus warranted, especially at varying
dietary intake levels that span the range seen in the population.
We hypothesized that high fructose exposure would drive
accumulation of intracellular F-6-P due to direct phosphorylation
of fructose by hexokinases and/or through inhibition of normal
glucose glycolytic catabolism due to feedback inhibition by
fructose-derived downstream metabolites (e.g., citrate inhibition
of PFK). Indeed, unlike cells treated with 5.5 mM glucose alone,
cellular levels of F-6-P remained stable and were not reduced over
time in cells incubated with 5.5 mM glucose plus fructose. Since F-
6-P is the first committed metabolite in the hexosamine
biosynthetic pathway (HBP), it was anticipated that fructose could
activate the HBP in HepG2 cells. It has previously been reported
that activation of the HBP through overexpression of the HBP
enzyme GFAT in HepG2 cells [26] or through provision of the
HBP precursor GlcN to liver and adipose cells [25,39] can induce
lipogenic gene expression. Consistent with the latter report, we
observed that GlcN treatment of HepG2 cells significantly
increased mRNA expression of FAS and ACC-1, concurrent with
higher cellular concentrations of UDP-GlcNAc. However, despite
a relative maintenance of G-6-P and F-6-P concentrations in
HepG2 cells treated with fructose vs. those treated with glucose
alone, there was no evidence for induction of the HBP pathway by
fructose treatment. It is important to note that the nature of the
pathway responsible for converting F-6-P to hexosamines in
human liver is not well characterized, as most studies of hepatic
hexosamine biology have been done in genetically manipulated
cells or animal models. It may be that flux through the HBP from
catabolism of sugars is too low to impact lipogenic gene expression
in human hepatocytes, in contrast to GlcN that directly enters the
HBP pathway and results in a dramatic increase of hexosamine
formation. GFAT is expressed in human liver [40] and HepG2
cells [26], but its actual enzyme activity in these cells is not known.
The fact that fructose failed to increase HBP metabolite pools
above that of glucose-treated HepG2 cells might explain the lack
of change of lipogenic gene expression in response to this sugar.
Another interesting observation concerning cellular F-6-P
dynamics was that despite a more stable and maintained F-6-P
concentration in HepG2 cells provided fructose compared to those
given glucose alone, immediately after provision of fresh sugar-
containing culture media, F-6-P levels were significantly higher in
cells provided glucose compared to those given fructose plus
glucose (see 10 min time point, Fig. 5). The underlying
Figure 5. Changes in hexose-6-phosphate levels in HepG2 cellsgrown in glucose or fructose. (A) Abundance of G-6-P in HepG2cells grown in 5.5 mM glucose (control), 10. 5 mM glucose, orglucose+5 mM fructose for 48 hours before new media was addedfor 10 min, 1 hr, 6 hr, or 24 hr. (B) Levels of fructose-6-phosphate (F-6-P) in HepG2 cells grown in the three conditions described above. Unitsof intensity are quantifier ion peak heights. Means 6 SEM are depicted.*P,0.05, **P,0.01, ***P,0.001 vs. controls; n = 5 or 6/group.doi:10.1371/journal.pone.0026583.g005
Fructose and Liver Hexosamines
PLoS ONE | www.plosone.org 7 November 2011 | Volume 6 | Issue 11 | e26583
explanation for this remains elusive. Perhaps in cells provided
glucose only, exposure to glucose after a relative depletion phase
rapidly expands the glucose-derived G-6-P pool and thus drives
isomerization to F-6-P through phosphoglucose isomerase.
Possibly, in cells consuming fructose alongside glucose, very
acutely there could be a lower initial rate of extracellular glucose
flux to intracellular F-6-P compared to cells consuming glucose
alone, and this may be coupled to a relatively limited production of
F-6-P from direct phosphorylation of fructose.
Metabolite profiling revealed evidence that fructose metabolism
attenuates glycolytic flux of glucose in HepG2 cells. In cells treated
with 5.5 mM glucose alone, there was a drop in cellular G-6-P
levels over time, likely explained by the ,70% reduction of media
glucose substrate over 24 h in culture. We suspect that this reflects
a decrease in the media concentration of glucose below the Km of
GLUT 2, the primary glucose transporter in the liver. In contrast,
cells grown in 10.5 mM glucose sustained a higher concentration
of cellular G-6-P over time, probably due to higher media glucose
levels throughout the incubation period. In cells grown in 5.5 mM
glucose plus fructose, the maintenance of cellular G-6-P
concentration resembled that of cells incubated in 10.5 mM
glucose. Since glucose uptake was the same comparing cells grown
in 5.5 mM glucose with those grown in 5.5 mM glucose plus
fructose, this may reflect a blockade in glycolysis and subsequent
maintenance of the cellular G-6-P pool in cells provided fructose.
These observations are consistent with the concept that triose-
phosphates generated from fructose metabolism increase the
quantity of fructose carbon that enters the glycolytic pathway
distal to PFK. These intermediates are ultimately metabolized to
citrate, which can limit glucose metabolism through feedback
inhibition of PFK [12].
In conclusion, the current findings indicate that like human liver
in vivo, HepG2 cells actively utilize fructose, and temporal
metabolite profiling highlights that fructose exposure rapidly
increases cellular fructose, F-1-P, and G-6-P pools and maintains
the cellular F-6-P level. Despite active metabolism of fructose,
there was no evidence for activation of hexosamine biosynthesis or
induction of lipogenic gene expression. The data from HepG2
cells are consistent with the hypothesis that increased DNL and
blood VLDL triglyceride levels typically observed following acute
and chronic high fructose intake in vivo primarily result from robust
hepatic generation of lipogenic precursor metabolites, and not
from specific induction of the lipogenic enzyme machinery in
human liver. If true, the latter may result from a low capacity for
hexosamine production from F-6-P in human hepatocytes. Our
findings indicate a need for further studies to elucidate the
relationship between fructose consumption, hepatic DNL, and
hexosamine production in human liver in situ.
Supporting Information
Figure S1 Decrease in fructose concentration in HepG2fructose-enriched culture medium following 24 hr incu-bation periods. The change in fructose concentration in
5.5 mM MEM supplemented with 5 mM fructose after HepG2
incubation for 24, 48, and 72 hr. Media was replenished every
24 hr. Means 6 SEM are depicted; n = 6 or 12/group.
(TIF)
Figure S2 Elevated cellular concentrations of UDP-GlcNAc in HepG2 cells exposed to GlcN, but not glucoseor fructose. Preliminary GC-TOF results quantifying UDP-
GlcNAc levels in cells grown in 5.5 mM glucose, glucose+5 mM
fructose, or glucose+10 mM GlcN for 1 hr following 48 hr
incubation in treatment media. Unit of intensity is quantifier ion
peak height. Means 6 SEM are depicted; n = 2/group.
(TIF)
Figure S3 High levels of intracellular fructose andtemporal changes in fructose-6-phosphate (F-6-P) inHepG2 cells grown in fructose-enriched medium com-pared with glucose and GlcN. Pilot study GC-TOF data
showing (A) elevated cellular fructose levels and (B) relatively
higher maintenance of F-6-P concentration in cells grown in
5.5 mM glucose+5 mM fructose for 10 min to 24 hr following
48 hr incubation in treatment medium. Units of intensity are
quantifier ion peak heights. Means 6 SEM are depicted; n = 2/
treatment per time point.
(TIF)
Author Contributions
Conceived and designed the experiments: KMH JKM OF SHA.
Performed the experiments: KMH JKM. Analyzed the data: KMH JKM
OF SHA. Contributed reagents/materials/analysis tools: KMH JKM OF
SHA. Wrote the paper: KMH SHA.
References
1. Bray GA, Nielsen SJ, Popkin BM (2004) Consumption of high-fructose corn syrup in
beverages may play a role in the epidemic of obesity. Am J Clin Nutr 79: 537–543.
2. Basciano H, Federico L, Adeli K (2005) Fructose, insulin resistance, and
metabolic dyslipidemia. Nutr Metab (Lond) 2: 5.
3. Collison KS, Saleh SM, Bakheet RH, Al-Rabiah RK, Inglis AL, et al. (2009)
Diabetes of the liver: the link between nonalcoholic fatty liver disease and
HFCS-55. Obesity (Silver Spring) 17: 2003–2013.
4. Stanhope KL, Schwarz JM, Keim NL, Griffen SC, Bremer AA, et al. (2009)
Consuming fructose-sweetened, not glucose-sweetened, beverages increases
visceral adiposity and lipids and decreases insulin sensitivity in overweight/
obese humans. J Clin Invest 119: 1322–1334.
5. Abdelmalek MF, Suzuki A, Guy C, Unalp-Arida A, Colvin R, et al. (2010)
Increased fructose consumption is associated with fibrosis severity in patients
with nonalcoholic fatty liver disease. Hepatology 51: 1961–1971.
6. Thuy S, Ladurner R, Volynets V, Wagner S, Strahl S, et al. (2008) Nonalcoholic
fatty liver disease in humans is associated with increased plasma endotoxin and
plasminogen activator inhibitor 1 concentrations and with fructose intake. J Nutr
138: 1452–1455.
7. Ouyang X, Cirillo P, Sautin Y, McCall S, Bruchette JL, et al. (2008) Fructose
consumption as a risk factor for non-alcoholic fatty liver disease. J Hepatol 48:
993–999.
8. Hellerstein MK, Schwarz JM, Neese RA (1996) Regulation of hepatic de novo
lipogenesis in humans. Annu Rev Nutr 16: 523–557.
9. Mendeloff AI, Weichselbaum TE (1953) Role of the human liver in the
assimilation of intravenously administered fructose. Metabolism 2: 450–458.
10. Adams SH, Stanhope KL, Grant RW, Cummings BP, Havel PJ (2008)
Metabolic and endocrine profiles in response to systemic infusion of fructose and
glucose in rhesus macaques. Endocrinology 149: 3002–3008.
11. Mayes PA (1993) Intermediary metabolism of fructose. Am J Clin Nutr 58:
754S–765S.
12. Havel PJ (2005) Dietary fructose: implications for dysregulation of energy
homeostasis and lipid/carbohydrate metabolism. Nutr Rev 63: 133–157.
13. Girard J, Perdereau D, Foufelle F, Prip-Buus C, Ferre P (1994) Regulation of
lipogenic enzyme gene expression by nutrients and hormones. FASEB J 8:
36–42.
14. Bruckdorfer KR, Khan IH, Yudkin J (1972) Fatty acid synthetase activity in the
liver and adipose tissue of rats fed with various carbohydrates. Biochem J 129:
439–446.
15. Shafrir E, Benchimol A, Orevi M (1975) Hyperlipidemia and hepatic
hyperlipogenesis in spiny mice (Acomys cahirinus) on carbohydrate diets:
relationship to peripheral underresponsiveness and low insulin release. Isr J Med
Sci 11: 738–752.
16. Winder WW, Booth FW, Fitts RH, Holloszy JO (1975) Effect of exercise on
response of liver lipogenic enzymes to a high fructose diet. Proc Soc Exp Biol
Med 148: 1150–1154.
17. Spence JT, Pitot HC (1982) Induction of lipogenic enzymes in primary cultures
of rat hepatocytes. Relationship between lipogenesis and carbohydrate
metabolism. Eur J Biochem 128: 15–20.
18. Koo HY, Wallig MA, Chung BH, Nara TY, Cho BH, et al. (2008) Dietary
fructose induces a wide range of genes with distinct shift in carbohydrate and
Fructose and Liver Hexosamines
PLoS ONE | www.plosone.org 8 November 2011 | Volume 6 | Issue 11 | e26583
lipid metabolism in fed and fasted rat liver. Biochim Biophys Acta 1782:
341–348.
19. Herzberg GR, Rogerson M (1982) Interaction of the level of dietary fat and type
of carbohydrate in the regulation of hepatic lipogenesis in the mouse.
Can J Physiol Pharmacol 60: 912–919.
20. Kazumi T, Odaka H, Hozumi T, Ishida Y, Amano N, et al. (1997) Effects of
dietary fructose or glucose on triglyceride production and lipogenic enzyme
activities in the liver of Wistar fatty rats, an animal model of NIDDM. Endocr J
44: 239–245.
21. Nagai Y, Nishio Y, Nakamura T, Maegawa H, Kikkawa R, et al. (2002)
Amelioration of high fructose-induced metabolic derangements by activation of
PPARalpha. Am J Physiol Endocrinol Metab 282: E1180–1190.
22. Nagata R, Nishio Y, Sekine O, Nagai Y, Maeno Y, et al. (2004) Single
nucleotide polymorphism (2468 Gly to A) at the promoter region of SREBP-1c
associates with genetic defect of fructose-induced hepatic lipogenesis [corrected].
J Biol Chem 279: 29031–29042.
23. Marshall S, Bacote V, Traxinger RR (1991) Discovery of a metabolic pathway
mediating glucose-induced desensitization of the glucose transport system. Role
of hexosamine biosynthesis in the induction of insulin resistance. J Biol Chem
266: 4706–4712.
24. Veerababu G, Tang J, Hoffman RT, Daniels MC, Hebert LF, Jr., et al. (2000)
Overexpression of glutamine: fructose-6-phosphate amidotransferase in the liver
of transgenic mice results in enhanced glycogen storage, hyperlipidemia, obesity,
and impaired glucose tolerance. Diabetes 49: 2070–2078.
25. Rumberger JM, Wu T, Hering MA, Marshall S (2003) Role of hexosamine
biosynthesis in glucose-mediated up-regulation of lipogenic enzyme mRNA
levels: effects of glucose, glutamine, and glucosamine on glycerophosphate
dehydrogenase, fatty acid synthase, and acetyl-CoA carboxylase mRNA levels.
J Biol Chem 278: 28547–28552.
26. Sage AT, Walter LA, Shi Y, Khan MI, Kaneto H, et al. (2010) Hexosamine
biosynthesis pathway flux promotes endoplasmic reticulum stress, lipid
accumulation, and inflammatory gene expression in hepatic cells. Am J Physiol
Endocrinol Metab 298: E499–511.
27. Comer FI, Hart GW (1999) O-GlcNAc and the control of gene expression.
Biochim Biophys Acta 1473: 161–171.
28. Moreno-Aliaga MJ, Swarbrick MM, Lorente-Cebrian S, Stanhope KL,
Havel PJ, et al. (2007) Sp1-mediated transcription is involved in the induction
of leptin by insulin-stimulated glucose metabolism. J Mol Endocrinol 38:
537–546.29. Katzen HM, Schimke RT (1965) Multiple forms of hexokinase in the rat: tissue
distribution, age dependency, and properties. Proc Natl Acad Sci U S A 54:
1218–1225.30. Malaisse WJ, Ladriere L, Verbruggen I, Willem R (2002) Effects of D-glucose
upon D-fructose metabolism in rat hepatocytes: A 13C NMR study. Mol CellBiochem 241: 103–106.
31. Scruel O, Sener A, Malaisse WJ (1997) Glucose-induced positive cooperativity of
fructose phosphorylation by human B-cell glucokinase. Mol Cell Biochem 175:263–269.
32. Jijakli H, Courtois P, Zhang HX, Sener A, Malaisse WJ (2003) Anomericspecificity of the stimulatory effect of D-glucose on D-fructose phosphorylation
by human liver glucokinase. J Biol Chem 278: 4531–4535.33. Oort PJ, Warden CH, Baumann TK, Knotts TA, Adams SH (2007)
Characterization of Tusc5, an adipocyte gene co-expressed in peripheral
neurons. Mol Cell Endocrinol 276: 24–35.34. Fiehn O, Garvey WT, Newman JW, Lok KH, Hoppel CL, et al. (2010) Plasma
metabolomic profiles reflective of glucose homeostasis in non-diabetic and type 2diabetic obese African-American women. PLoS One 5: e15234.
35. Faeh D, Minehira K, Schwarz JM, Periasamy R, Park S, et al. (2005) Effect of
fructose overfeeding and fish oil administration on hepatic de novo lipogenesisand insulin sensitivity in healthy men. Diabetes 54: 1907–1913.
36. Le KA, Faeh D, Stettler R, Debard C, Loizon E, et al. (2008) Effects of four-week high-fructose diet on gene expression in skeletal muscle of healthy men.
Diabetes Metab 34: 82–85.37. Teff KL, Grudziak J, Townsend RR, Dunn TN, Grant RW, et al. (2009)
Endocrine and metabolic effects of consuming fructose- and glucose-sweetened
beverages with meals in obese men and women: influence of insulin resistance onplasma triglyceride responses. J Clin Endocrinol Metab 94: 1562–1569.
38. Hers HG (1952) [Liver fructokinase]. Biochim Biophys Acta 8: 416–423.39. McClain DA, Hazel M, Parker G, Cooksey RC (2005) Adipocytes with
increased hexosamine flux exhibit insulin resistance, increased glucose uptake,
and increased synthesis and storage of lipid. Am J Physiol Endocrinol Metab288: E973–979.
40. DeHaven JE, Robinson KA, Nelson BA, Buse MG (2001) A novel variant ofglutamine: fructose-6-phosphate amidotransferase-1 (GFAT1) mRNA is selec-
tively expressed in striated muscle. Diabetes 50: 2419–2424.
Fructose and Liver Hexosamines
PLoS ONE | www.plosone.org 9 November 2011 | Volume 6 | Issue 11 | e26583