Embed Size (px)
Citation preview
Comparative Indicators ofEducation in the United States and Other G-8 Countries: 2011October 2011
NCES 2012-007 U.S. DEPARTMENT OF EDUCAT ION

Comparative Indicators of Education in the United States and Other G-8 Countries: 2011
OCTOBER 2011
David C. Miller Laura K. Warren Education Statistics Services InstituteAmerican Institutes for Research
Eugene OwenProject OfficerNational Center for Education Statistics
NCES 2012-007
U.S. DEPARTMENT OF EDUCATION
U.S. Department of Education Arne Duncan Secretary
Institute of Education Sciences John Q. Easton Director
National Center for Education Statistics Jack Buckley Commissioner
The National Center for Education Statistics (NCES) is the primary federal entity for collecting, analyzing, and reporting data related to education in the United States and other nations. It fulfills a congressional mandate to collect, collate, analyze, and report full and complete statistics on the condition of education in the United States; conduct and publish reports and specialized analyses of the meaning and significance of such statistics; assist state and local education agencies in improving their statistical systems; and review and report on education activities in foreign countries.
NCES activities are designed to address high-priority education data needs; provide consistent, reliable, complete, and accurate indicators of education status and trends; and report timely, useful, and high-quality data to the U.S. Department of Education, the Congress, the states, other education policymakers, practitioners, data users, and the general public. Unless specifically noted, all information contained herein is in the public domain.
We strive to make our products available in a variety of formats and in language that is appropriate to a variety of audiences. You, as our customer, are the best judge of our success in communicating information effectively. If you have any comments or suggestions about this or any other NCES product or report, we would like to hear from you. Please direct your comments to
NCES, IES, U.S. Department of Education 1990 K Street NW Washington, DC 20006-5651
October 2011
The NCES Home Page address is http://nces.ed.gov. The NCES Publications and Products address is http://nces.ed.gov/pubsearch.
This report was prepared for the National Center for Education Statistics under Contract No. ED-05-CO-0044 with the Education Statistics Services Institute, American Institutes for Research. Mention of trade names, commercial products, or organizations does not imply endorsement by the U.S. Government.
Suggested Citation
Miller, D.C., and Warren, L.K. (2011). Comparative Indicators of Education in the United States and Other G-8 Countries: 2011 (NCES 2012-007). U.S. Department of Education, National Center for Education Statistics. Washington, DC: U.S. Government Printing Office.
For ordering information on this report, write toED Pubs, U.S. Department of Education P.O. Box 22207 Alexandria, VA 22304
or call toll free 1-877-4ED-PUBS or order online at http://www.edpubs.gov.
Content Contact Eugene Owen Phone: 202-502-7422 [email protected]
SUMMARY iii
SUMMARYIntroductionThis is the 2011 edition of a biennial series of compendia describing key education outcomes and contexts of education in the Group of Eight (G-8) countries—Canada, France, Germany, Italy, Japan, the Russian Federation, the United Kingdom, and the United States. The report is organized into five topical areas: population and school enrollment, academic performance, contexts for learning, expenditures for education, and educational attainment and income. Results are drawn from the Organization for Economic Cooperation and Development’s (OECD) ongoing Indicators of Education Systems (INES) program, as well as the Program for International Student Assessment (PISA), which is also coordinated by the OECD. The main findings are summarized below.
Population and School Enrollment
School-age population
In 2010, the United States had 106.2 million 5- to 29-year-olds (roughly the population most likely to be enrolled in education), the largest number among G-8 countries. The 5-to-29-year-old age group in the United States also made up the highest percentage of the total national population (34 percent) among G-8 countries. In the other G-8 countries, the corresponding percentages ranged from 24 percent in Italy to 32 percent in the Russian Federation. The United States was the only G-8 country to experience a net percentage gain (6 percent) in the population of 5- to 29-year-olds between 2000 and 2010 (indicator 1).
Enrollment in formal education
In all G-8 countries reporting data except the United States (data not available for Canada and the Russian Federation), more than 80 percent of 3- to 4-year-old children were enrolled in preprimary or primary education programs in 2008, the most recent year for which data are available; 47 percent of U.S. 3- to 4-year-olds were enrolled in 2008.1 In all reporting G-8 countries except the United States, the percentage of 3- to 4-year-old children enrolled in preprimary or primary education programs either increased from 1999 to 2008 or remained at about 100 percent. The largest increase occurred in Germany, where the percentage of 3- to 4-year-olds enrolled in preprimary or primary education programs went from 66 percent in 1999 to about 100 percent in 2008. In the United
Kingdom, the enrollment rate increased from 77 to 95 percent and in Japan the enrollment rate increased from 76 to 86 percent. In the United States, the enrollment rate of 3- to 4-year-olds was 47 percent in both 1999 and 2008 (indicators 2 and 3).
The age at which compulsory education ends varies across G-8 countries, as do enrollment rates for young adults. Compulsory education ends at age 18 in Germany; 17 in the United States; 16 in France, Italy, and the United Kingdom; and 15 in Japan.2 Enrollment rates for young adults ages 18–22 increased from 1999 to 2008 in Italy (from 40 to 50 percent), Canada (from 43 to 52 percent), the United States (from 43 to 50 percent), and Germany (from 58 to 60 percent), but decreased in the United Kingdom (from 44 to 37 percent) and France (from 57 to 53 percent) (indicators 2 and 3).
Foreign students in higher education
In 2008, G-8 countries hosted 59 percent of all foreign students in higher education.3 The United States received the largest percentage of these foreign students (19 percent), followed by the United Kingdom (10 percent). The other G-8 countries each took in between 2 and 7 percent of all foreign students enrolled in higher education (indicator 4).
Academic PerformanceSince the publication of the last report in this series in 2009, the only large-scale international assessment of academic performance has been PISA 2009, which assessed 15-year-old students in reading, mathematics, and science literacy. The most recent results from the other major international assessments—the Progress in International Reading Literacy Study (PIRLS), which assesses reading among fourth-graders, and the Trends in International Mathematics and Science Study (TIMSS), which assesses mathematics and science among fourth- and eighth-graders—are available in the 2009 report in this series, Comparative Indicators of Education in the United States and Other G-8 Countries: 2009 (Miller et al. 2009).
Average performance
On the PISA 2009 assessment, the U.S. average score (500) on the reading literacy scale was lower than the average scores in Canada (524) and Japan (520), not measurably different from those in Germany (497), France (496), and the United Kingdom (494), and higher than in Italy (486) and the Russian Federation
1 Internationally, education levels are defined according to the 1997 International Standard Classification of Education (ISCED97). Preprimary education refers to ISCED97 level 0. This is defined as the initial stage of organized instruction, designed primarily to introduce very young children to a school-type environment. Education programs at ISCED97 level 0 can either be center or school based. Preschool and kindergarten programs in the United States fall into level 0. Primary education refers to ISCED97 level 1. This level of education usually lasts 4 to 6 years, and typically begins between ages 5 and 7. At ISCED97 level 1, students begin to study basic subjects, such as reading, writing, and mathematics. In the United States, elementary school (grades 1 through 6) is classified as level 1. For more information on the ISCED97 levels, see appendix A.2 In some countries, the ending age of compulsory education is an average. For example, in the United States this age varies across states, ranging from 16 to 18; the modal age in the United States is 18 (Snyder and Dillow 2011, table 174).3 As used in this report, “higher education” refers to ISCED97 levels 5A (academic higher education below the doctoral level), 5B (vocational higher education), and 6 (doctoral level of academic higher education) (except where specific data exclusions are noted).
iv SUMMARY
(459) (indicator 5). From 2000 (the first time PISA reading was assessed) to 2009, the only measurable change in students’ average performance in reading literacy was in Germany, where the average score was 13 points higher in 2009 than in 2000 (indicator 8).4
In mathematics literacy, the U.S. average score (487) was lower than the average scores in Japan (529), Canada (527), Germany (513), and France (497); not measurably different from those in the United Kingdom (492) and Italy (483); and higher than in the Russian Federation (468) (indicator 5). From 2003 (the first time the current PISA mathematics assessment was administered) to 2009, measurable changes in students’ average scores in mathematics literacy occurred in France (where the average score was 14 points lower in 2009 than in 2003), Germany (where the average score was 10 points higher in 2009 than in 2003), and Italy (where the average score was 17 points higher in 2009 than in 2003) (indicator 8).5
In science literacy, the U.S. average score (502) was lower than the average scores in Japan (539), Canada (529), Germany (520), and the United Kingdom (514); not measurably different from the average score in France (498); and higher than those in Italy (489) and the Russian Federation (478) (indicator 5). From 2006 (the first administration of the current PISA science assessment) to 2009, the only measurable changes in students’ average scores in science literacy were in Italy and the United States, which had higher average scores in 2009 than in 2006 (13 points higher for both countries) (indicator 8).
Percentage of higher performing students
On the PISA 2009 reading literacy scale, 10 percent of U.S. 15-year-old students scored above PISA proficiency level 4. This was a lower percentage than in Japan and Canada (both 13 percent); not measurably different than the percentages in France (10 percent) and the United Kingdom (8 percent); and a higher percentage than in Germany (8 percent), Italy (6 percent), and the Russian Federation (3 percent). In mathematics literacy, 10 percent of U.S. students scored above level 4. This was a lower percentage than in Japan (21 percent), Canada (18 percent), Germany (18 percent), and France (14 percent); not measurably different than the percentages in the United Kingdom (10 percent) and Italy (9 percent); and higher than the percentage in the Russian Federation (5 percent). In science literacy, 9 percent of U.S. students scored above level 4. This was a lower percentage than in Japan (17 percent), Germany (13 percent), and Canada (12 percent); not measurably different than the percentages in the United Kingdom (11 percent) and France (8 percent); and a higher percentage than in Italy (6 percent) and the Russian Federation (4 percent) (indicator 6).
Percentage of lower performing students
On the PISA 2009 reading literacy scale, 18 percent of U.S. 15-year-old students scored below PISA proficiency level 2. This was a higher percentage than in Canada (10 percent) and Japan (14 percent); not measurably different than the percentages in the United Kingdom (18 percent), Germany (18 percent), and France (20 percent); and a lower percentage than in Italy (21 percent) and the Russian Federation (27 percent). In
mathematics literacy, 23 percent of U.S. students scored below level 2. This was a higher percentage than in Canada (11 percent), Japan (12 percent), Germany (19 percent), and the United Kingdom (20 percent); not measurably different than the percentages in France (23 percent) and Italy (25 percent); and a lower percentage than in the Russian Federation (29 percent). In science literacy, 18 percent of U.S. students scored below level 2. This was a higher percentage than in Canada (10 percent), Japan (11 percent), Germany (15 percent), and the United Kingdom (15 percent); not measurably different than the percentage in France (19 percent); and a lower percentage than in Italy (21 percent) and the Russian Federation (22 percent) (indicator 7).
Performance by sex
On average, 15-year-old females had higher scores than their male peers on the PISA reading literacy scale in every G-8 country in 2009. The U.S. male-female difference in average score points was smaller than that in every other G-8 country, except Japan and the United Kingdom, where there was no measurable difference compared to the U.S. male-female difference. In mathematics literacy, males had higher scores than their female peers, on average, in both 2003 and 2009 in Canada, France, Germany, Italy, and the United States, as well as in the Russian Federation in 2003 and the United Kingdom in 2009; there were no measurable differences by sex in Japan in either years or the Russian Federation in 2009. In the United States, males had higher scores than females by 6 points in 2003 and by 20 points in 2009. In science literacy, the performance pattern of 15-year-old males and females was not consistent across the G-8 countries. The only measurable differences were in 2009 in the United States (14-point advantage for males, on average) and Canada (5-point advantage for males, on average), and in 2006 and 2009 in the United Kingdom (10- and 9-point advantage for males, respectively, on average) (indicator 9).
Performance by immigrant status
In PISA 2009, the student background questionnaire asked 15-year-olds to report whether they were native (born in the country of assessment, or with at least one parent born in the country of assessment), had a second generation immigrant background (born in the country of assessment, but with parents born in another country), or had a first generation immigrant background (born in another country and with parents born in another country). In reading literacy in 2009, students with an immigrant background scored lower, on average, than their native peers in all G-8 countries except Canada (no measurable difference) and Japan (too few immigrants sampled by PISA to report a comparison), with score differences ranging from 22 points (United States) to 72 points (Italy). In Germany, the difference in reading performance between students with an immigrant background and their native peers was smaller in 2009 than in 2000 (by 28 score points), while in Italy the gap in performance was larger in 2009 than in 2000 (by 33 score points); in the other reporting countries there was no measurable change in the immigrant-native performance difference from 2000 to 2009 (indicator 10).
4 Data not available for the United Kingdom in 2000.5 Data not available for the United Kingdom in 2003.
SUMMARY v
Context for LearningData on contexts for learning are drawn from an INES survey of class sizes and student/teacher ratios in 2008 and from PISA 2009 surveys of students’ reading habits and principals’ reports of their schools’ uses of assessments. Information on other learning contexts drawn from the most recent Progress in International Reading Literacy Study (PIRLS 2006) and most recent Trends in International Mathematics and Science Study (TIMSS 2007) are available in the 2009 G-8 report, Comparative Indicators of Education in the United States and Other G-8 Countries: 2009 (Miller et al. 2009). Using data as reported by school teachers, indicators in the 2009 G-8 report address the amount of time devoted to reading instruction, strategies used to assist students who have fallen behind in reading, change in teacher preparation and experience, teachers’ working time, and teacher professional development in mathematics and science. This 2009 edition also presents the reports of school principals on the uses of summative achievement data and the frequency of student behavior problems.
Class size and ratio of students to teaching staff
In 2008, the average class size in primary education ranged from 16 students (the Russian Federation) to 28 students (Japan). The U.S. student/teacher ratio at the primary level in 2008 (14 students per teacher) was lower than the ratio in all other G-8 countries, except Italy (11 students per teacher). At the secondary level, student/teacher ratios ranged from 9 students per teacher in the Russian Federation to 15 students per teacher in the United States and Germany (indicator 11).
Students’ time spent reading for enjoyment
In both 2000 and 2009, the percentage of 15-year-old males (75 and 71 percent, respectively) and females (86 and 87 percent, respectively) in the Russian Federation who reported reading for enjoyment was higher than that of their male and female counterparts in all other G-8 countries with data reported (data not reported for the United Kingdom in 2000). In almost all G-8 countries reporting data in 2000 and 2009, a greater percentage of 15-year-old females than males reported reading for enjoyment. The male-female differences ranged from 11 percentage points in the Russian Federation in 2000 to 27 percentage points in Germany in 2009, except in Japan, where there was no measurable difference in 2000 and a difference of 5 percentage points in 2009. In the United States, the male-female difference in reading enjoyment was 18 percentage points in 2000 (50 percent of males vs. 68 percent of females) and 22 percentage points in 2009 (47 percent of males vs. 69 percent of females) (indicator 12).
School principals’ uses for assessments
In PISA, school principals were asked if the assessment results of 15-year-old students are used at their schools to: inform parents about their child’s progress, make decisions about students’ retention or promotion, group students for instructional purposes, compare school’s performance to district- or national-level performance, monitor the school’s progress from year to year, and make judgments about teachers’ effectiveness. In 2000 and 2009, the United States had a higher percentage of 15-year-olds whose principals reported that assessment results are used to monitor their school’s progress from year to year (93 and 98 percent, respectively) than most G-8 countries reporting data and, with one exception (no measurable difference with the United Kingdom in 2009), the highest percentage of students whose principals reported that assessment results are used to compare their school’s performance to district- or national-level performance (92 and 95 percent, respectively)6 (indicator 13).
Expenditures for Education
Public school teachers’ starting salaries
In 2008, public school teachers at the beginning of their careers earned less than the average Gross Domestic Product (GDP) per capita in every G-8 country except Germany (Canada and the Russian Federation did not report data).7 Germany reported the highest average starting salary of public school teachers at both the primary ($43,500) and upper secondary levels ($51,700) among the reporting G-8 countries, followed by the United States ($36,000 and $36,400, respectively)8 (indicator 14).
Expenditures for education
In 2007, the total expenditures per student and the portion of these expenditures devoted to core education services were higher in the United States than in all other G-8 countries with data reported at the combined primary and secondary education levels and the higher education level (data on core education services not reported for Japan and the Russian Federation).9 The total expenditures per student in the United States were about $10,800 at the combined primary and secondary education levels and about $27,000 at the higher education level10 (indicators 15 and 16).
In both 1995 and 2007, all G-8 countries spent a larger percentage of GDP at the combined primary and secondary education levels than at the higher education level, where the student enrollment is lower. In all G-8 countries except the United Kingdom and the United States (the Russian Federation did not report in 1995), the percentage of GDP spent on education at the combined primary
6 Data not reported for the United Kingdom in 2000 and not available for France in 2009.7 Results for the United Kingdom are reported for England and Scotland separately; no results are available for the United Kingdom as a whole.8 Upper secondary education refers to ISCED97 level 3. At this level of education, student coursework is generally subject specific and often taught by specialized teachers. Students often enter upper secondary education at the age of 15 or 16 and attend anywhere from 2 to 5 years. ISCED97 level 3 can prepare students for university, further schooling, or the labor force. Senior high school (grades 10 through 12) is considered level 3 in the United States. For more information on the ISCED97 levels, see appendix A.9 Expenditures on core education services pertain to spending on instructional services, including faculty/staff salaries, professional development, and books and other school materials.10 Except where otherwise noted in the indicator figures, the combined primary and secondary education levels include primary education (ISCED97 level 1), lower secondary education (ISCED97 level 2), upper secondary education (ISCED97 level 3), and postsecondary nontertiary programs (ISCED97 level 4). For more information on the ISCED97 levels, see appendix A.
vi SUMMARY
and secondary education levels was higher in 1995 than in 2007. However, in all G-8 countries with data reported except Germany and France, the percentage of GDP spent on higher education was higher in 2007 than in 1995 (indicator 16).
Educational Attainment and IncomeIn 2008, upper secondary graduation rates were lowest in Canada (76 percent) and the United States (77 percent) among G-8 countries with data (data not reported for France and the Russian Federation) and highest in Germany (97 percent) and Japan (95 percent). In all G-8 countries reporting data except Japan, graduation rates in academic higher education below the doctoral level were higher for females than for males11 (indicator 17).
Canada had the largest percentage of 25- to 64-year-olds who had completed higher education (49 percent) among the G-8 countries reporting data in 2008 (data not reported for the Russian Federation), followed by Japan (43 percent) and the United States (41 percent); Italy had the smallest percentage (14 percent). Among 25- to 34-year-olds, a greater percentage of females than males had completed higher education in every reporting G-8 country. The largest difference by sex was reported in Canada (16 percentage points), followed by the United States, Italy, and France (all 9 percentage points) (indicator 18).
The United States awarded the lowest percentages of first university degrees in science, mathematics, and engineering-related fields among all the G-8 countries.12 Fifteen percent of first university degrees in the United States were awarded in science, mathematics, and engineering-related fields. In the other G-8 countries, the percentages ranged from 22 percent in Canada and Italy to 29 percent in Germany (indicator 19).
In 2008, the United Kingdom had higher employment rates than all other reporting G-8 countries (data not reported for the Russian Federation) at three main levels of educational attainment. In all reporting G-8 countries, higher employment rates were associated with higher levels of educational attainment. The differences between the employment rates for 25- to 64-year-olds who had completed academic higher education and those whose highest level of educational attainment was at the lower secondary education level or below ranged from 23 percentage points in the United Kingdom to 31 percentage points in Germany.13 In the United States, the gap was 28 percentage points. In all reporting G-8 countries, males had higher employment rates than did females with a comparable amount of education (indicator 20). Among U.S. 25- to 64-year-olds whose highest level of attainment was upper secondary education, 38 percent earned more than the country’s median income in 2008, lower than in all other reporting G-8 countries (data not reported for the Russian Federation) (indicator 21).
11 As used in this report, “academic higher education below the doctoral level” refers to ISCED97 level 5A, which includes programs that are intended to provide sufficient qualifications to gain entry into advanced research programs and professions with high skill requirements. In the United States, bachelor’s, master’s, and first professional degree programs are classified as ISCED 97 level 5A. For more information on the ISCED97 levels, see appendix A. 12 Programs that prepare students for advanced research and highly qualified professions are called first university degree programs and are classified under ISCED97 level 5A. First university degree programs vary in duration in different countries in different programs of study. In the United States, the first university degree corresponds to a bachelor’s degree; it excludes associate’s degrees. For more information on the ISCED97 levels, see appendix A.13 Lower secondary education refers to ISCED97 level 2. At this level of education, students continue to learn the basic subjects taught in level 1, but this level is typically more subject specific than level 1 and may be taught by specialized teachers. ISCED97 level 2 usually lasts between 2 and 6 years, and begins around the age of 11. Middle school and junior high (grades 7 through 9) in the United States are classified as level 2. As used in this report, “academic higher education” refers to ISCED97 levels 5A (academic higher education below the doctoral level) and 6 (doctoral level of academic higher education) (except where specific data exclusions are noted). For more information on the ISCED97 levels, see appendix A.
ACKNOWLEDGMENTS vii
ACKNOWLEDGMENTS
Much of the work for this report was performed by staff at the Education Statistics Services Institute (ESSI), which is funded by the National Center for Education Statistics (NCES) and composed of staff from the American Institutes for Research (AIR) and a number of partner organizations. It is based on a similar publication produced by the French Ministry of Education.
The following international colleagues reviewed the descriptions of the education systems in appendix A and offered useful comments for updating them: Galina Kovalyova of the Russian Academy of Education (Moscow, Russian Federation), Bruno Losito of Roma Tre University (Rome, Italy), Yasushi Ogura of the National Institute for Educational Policy Research (Tokyo, Japan), Claire Sargent of the National Foundation for Educational Research (Slough, United Kingdom), and Karin Zimmer of the German Institute for International Educational Research (Frankfurt, Germany).

CONTENTS ix
CONTENTS
Summary .......................................................................................................................................................................................iii
Acknowledgments ..................................................................................................................................................................... vii
List of Tables ................................................................................................................................................................................. xi
List of Figures ...............................................................................................................................................................................xiii
Introduction ..................................................................................................................................................................................3
What’s New in 2011? ............................................................................................................................................................3
Education Levels Used for the Indicators ...........................................................................................................................3
Mapping G-8 Countries’ Education Systems to the ISCED97 .........................................................................................4
Organization of the Report .................................................................................................................................................4
Data Sources ........................................................................................................................................................................5
Availability of Country Data ...............................................................................................................................................5
Data Quality and Response Rates .....................................................................................................................................5
Statistical Testing ..................................................................................................................................................................5
Other International Indicator Publications ........................................................................................................................6
Indicators
Part I: Population and School Enrollment .................................................................................................................................7
1: School-Age Population .............................................................................................................................................8
2: Enrollment in Formal Education ..............................................................................................................................10
3: Change in Enrollment in Formal Education ..........................................................................................................12
4: Foreign Students in Higher Education ....................................................................................................................14
Part II: Academic Performance ...............................................................................................................................................17
5: Reading, Mathematics, and Science Performance of 15-Year-Olds ................................................................18
6: High-Performing 15-Year-Olds in Reading, Mathematics, and Science ..........................................................20
7: Low-Performing 15-Year-Olds in Reading, Mathematics, and Science ............................................................22
8: Change in Reading, Mathematics, and Science Literacy of 15-Year-Olds ......................................................24
9: Change in 15-Year-Olds’ Reading, Mathematics, and Science Literacy by Sex .............................................26
10: Reading Achievement by Immigrant Status ........................................................................................................28
Part III: Context for Learning .....................................................................................................................................................31
11: Class Size and Ratio of Students to Teaching Staff ..............................................................................................32
12: Change in Students’ Time Spent Reading for Enjoyment ...................................................................................34
13: Change in School Principals’ Uses for Assessments .............................................................................................36
Page
x CONTENTS
Part IV: Expenditures for Education ..........................................................................................................................................39
14: Public School Teachers’ Starting Salaries ..............................................................................................................40
15: Annual Expenditures for Education .......................................................................................................................42
16: Change in Annual Expenditures for Education ....................................................................................................44
Part V: Educational Attainment and Income .........................................................................................................................47
17: Graduation Rates by Sex ........................................................................................................................................48
18: Educational Attainment in the Adult Population .................................................................................................50
19: First University Degrees by Field of Study ...............................................................................................................52
20: Employment Rates ...................................................................................................................................................54
21: Distribution of Population by Education and Income .........................................................................................56
References ..................................................................................................................................................................................59
Appendix A: The Education Systems of the G-8 Countries ...................................................................................................61
Reader’s Guide: Education System Charts......................................................................................................................63
The Education System in Canada ....................................................................................................................................65
The Education System in France .......................................................................................................................................67
The Education System in Germany ...................................................................................................................................69
The Education System in Italy ............................................................................................................................................72
The Education System in Japan ........................................................................................................................................74
The Education System in the Russian Federation ............................................................................................................76
The Education System in the United Kingdom ................................................................................................................78
The Education System in England, Northern Ireland, and Wales .......................................................................78
The Education System in Scotland .........................................................................................................................80
The Education System in the United States ......................................................................................................................82
Page
CONTENTS xi
LIST OF TABLES
1-1. Population ages 5 to 29, 5 to 19, and 20 to 29, by country: 2000 and 2010 ...........................................................9
1-2. Percentage of population ages 5 to 29, 5 to 19, and 20 to 29, by country: 2000 and 2010 ................................9
2-1. Percentage of population ages 3 to 29 enrolled in formal education, by age group and country: 2008 ......11
3-1. Percentage of population ages 3 to 29 enrolled in formal education, by age group and country: 1999 and 2008 ..............................................................................................................................................................13
12-1. Difference in the percentage of 15-year-old students who reported reading for enjoyment, by sex and country: 2000 and 2009 ...............................................................................................................................................35
14-1. Public school teachers’ average starting salaries in U.S. dollars expressed as a ratio of gross domestic product (GDP) per capita in U.S. dollars, by education level and country: 2008 ...............................................41
19-1. Number of first university degree recipients, by field of study and country: 2008 ...............................................53
21-1. Percentage of the population ages 25 to 64, by highest level of education, income, and country: 2008 .....57
Table Page

CONTENTS xiii
LIST OF FIGURES
1-1. Percentage change in population ages 5 to 29, 5 to 19, and 20 to 29, by country: 2000 to 2010 .....................9
2-1. Range of ages at which more than 90 percent of the population is enrolled in formal education, and ending age of compulsory education, by country: 2008 .......................................................................................11
4-1. Percentage distribution of foreign students enrolled in higher education programs, by host country: 2008 ..15
4-2. Percentage of a country’s students enrolled in higher education who are foreign students, by higher education program and country: 2008 ....................................................................................................................15
5-1. Average scale scores of 15-year-old students in reading, mathematics, and science literacy, by country: 2009 ...............................................................................................................................................................................19
5-2. Average subscale scores of 15-year-old students in reading literacy, by country: 2009 ....................................19
6-1. Percentage of 15-year-old students scoring above PISA proficiency level 4, by subject area and country: 2009 ...............................................................................................................................................................................21
6-2. Lowest scores of the top 10 percent of 15-year-old students in PISA, by subject area and country: 2009 ......21
7-1. Percentage of 15-year-old students scoring below PISA proficiency level 2, by subject area and country: 2009 ...............................................................................................................................................................................23
7-2. Highest scores of the bottom 10 percent of 15-year-old students in PISA, by subject area and country: 2009 ...............................................................................................................................................................................23
8-1 Change in average scale scores of 15-year-old students in reading literacy, mathematics literacy, and science literacy, by country: 2000, 2003, 2006, and 2009 .......................................................................................25
9-1. Difference in average scale scores between 15-year-old males and females in reading literacy, mathematics literacy, and science literacy, by country: 2000, 2003, 2006, and 2009 ........................................27
10-1. Percentage of 15-year-old students with immigrant background, by country: 2000 and 2009 ........................29
10-2. Average scale scores of 15-year-old students with immigrant background and native students in reading literacy, by country: 2000 and 2009 ..........................................................................................................................29
11-1. Average class size in primary education, by country: 2008 ....................................................................................33
11-2. Ratio of students to teaching staff in education institutions, by level of education and country: 2008 ...........33
12-1. Percentage of 15-year-old students who reported reading for enjoyment, by sex and country: 2000 and 2009 ..............................................................................................................................................................35
13-1. Percentage of 15-year-old students whose principals reported that they used assessment results for various purposes, by country: 2000 and 2009 .........................................................................................................37
14-1. Public school teachers’ average starting salaries in U.S. dollars, by education level and country: 2008 ........41
15-1. Annual public and private education expenditures per student, by education level and country: 2007 ......43
15-2. Annual public and private education expenditures as a percentage of gross domestic product (GDP), by education level and country: 2007 ......................................................................................................................43
16-1. Annual public and private education expenditures per student on core services and total services (in thousands of U.S. dollars), by education level and country: 2007 ...................................................................45
16-2. Annual public and private education expenditures as a percentage of gross domestic product (GDP), by education level and country: 1995 and 2007 .....................................................................................................45
17-1. Graduation rates in upper secondary education, by sex and country: 2008 .....................................................49
17-2. Graduation rates in academic higher education below the doctoral level, by sex and country: 2008 .........49
Figure Page
xiv CONTENTS
18-1. Percentage distribution of the population ages 25 to 64, by highest level of education completed and country: 2008 ................................................................................................................................................................51
18-2. Percentage of the population ages 25 to 34 who had completed higher education, by sex and country: 2008 ................................................................................................................................................................51
19-1. Percentage distribution of first university degrees awarded, by field of study and country: 2008 ....................53
20-1. Employment rates of adults ages 25 to 64, by highest level of education and country: 2008 ..........................55
20-2. Employment rates of adults ages 25 to 64, by sex, highest level of education, and country: 2008 ..................55
21-1. Percentage of the population ages 25 to 64 who earned more than the median income, by highest level of education and country: 2008 .......................................................................................................................57
A-1. Levels of education in Canada, by age and year of schooling: 2010 .................................................................65
A-2. Levels of education in France, by age and year of schooling: 2010 ....................................................................67
A-3. Levels of education in Germany, by age and year of schooling: 2010 ...............................................................69
A-4. Levels of education in Italy, by age and year of schooling: 2010 .........................................................................72
A-5. Levels of education in Japan, by age and year of schooling: 2010 .....................................................................74
A-6. Levels of education in the Russian Federation, by age and year of schooling: 2010 .........................................76
A-7. Levels of education in England, Northern Ireland, and Wales, by age and year of schooling: 2010 ...............78
A-8. Levels of education in Scotland, by age and year of schooling: 2010 ................................................................80
A-9. Levels of education in the United States, by age and year of schooling: 2010 ..................................................82
Figure Page

Introduction

INTRODUCTION 3
INTRODUCTIONWith the long-term growth in the trade of goods and services in the global economy, policymakers have turned to international comparisons to assess how well education systems are performing in other countries. These comparisons shed light on a host of issues, including access to education, equity of resources, and outcomes such as educational attainment and performance on standardized tests. They provide the opportunity to compare different aspects of countries’ education systems, consider these systems’ performance, and suggest potential strategies to improve student achievement and system outputs.
Since the 1960s, the United States has participated actively in international projects that are designed to provide key information about the performance of the U.S. education system relative to education systems in other countries. These projects include the Indicators of Education Systems (INES) program and Program for International Student Assessment (PISA), both sponsored by the Organization for Economic Cooperation and Development (OECD), and the Progress in International Reading Literacy Study (PIRLS) and Trends in International Mathematics and Science Study (TIMSS), both sponsored by the International Association for the Evaluation of Educational Achievement. This report, Comparative Indicators of Education in the United States and Other G-8 Countries: 2011, draws on the most current information available at the time the report was being produced (in the fall of 2010) to present a set of education indicators that describes how the U.S. education system compares with education systems in other economically developed countries. Updated information from these various projects will be incorporated in subsequent reports.
Although the international education projects cited above involve many countries worldwide, the comparisons in this report focus on the Group of Eight (G-8) countries: Canada, France, Germany, Italy, Japan, the Russian Federation, the United Kingdom, and the United States. While together the G-8 countries make up about 13 percent of the world population, they represent about 53 percent of the gross world product (GWP) as measured by gross domestic product (GDP) (Central Intelligence Agency 2011). Moreover, all of the G-8 countries are among the 15 top-ranked countries in terms of merchandise exports [on a free on board (FOB) basis] and in terms of the value of all final goods and services produced within a country in a given year valued at prices prevailing in the United States [i.e., GDP at purchasing power parity (PPP) exchange rates]. The G-8 countries were selected as a comparison group because of the similarities in their economic development and because the other G-8 countries are among the major economic partners of the United States. The leaders of these countries meet regularly to discuss economic and other policy issues. Although the G-20 represents a broader range of major economies, this larger number of countries is more diverse economically (including both industrialized and emerging market economies) and in their
education systems, thus making international comparative indicators more difficult to develop and interpret. Also, for the indicators presented in this report, there is generally more data available for the G-8 countries than for the G-20.
In this report, “education system” is used as a construct in presenting national statistics on education in the G-8 countries. It is important to note, however, that there is considerable variation among countries in how unified these systems are, including variation in the level of local autonomy. For example, while Japan and France have education systems that are highly centralized, the United States and Canada have education systems that are largely decentralized.
What’s New in 2011?This report is the fifth in a series of reports published by the National Center for Education Statistics (NCES) that describes how the education system in the United States compares with education systems in the other G-8 countries. Many of the indicators draw on 2008 data from the OECD’s INES program, in which countries collaborate to develop comparable education data on topics of mutual interest. In addition, while previous reports in this series have presented data from PIRLS, TIMSS, and earlier rounds of PISA, the indicators in this report related to international assessment draw only from PISA, with a focus on data from the most recent administration in 2009 that was released in December 2010. Neither of the other major international assessments—PIRLS or TIMSS—has released data since the last G-8 report was published in 2009. For the most recent comparisons among G-8 countries in reading performance at the fourth-grade level or mathematics and science at grades 4 or 8, as well as information on learning contexts unique to those studies, please see Comparative Indicators of Education in the United States and Other G-8 Countries: 2009 (Miller et al. 2009).
Education Levels Used for the IndicatorsMany of the indicators in this report refer to at least one of the following education levels: preprimary education, primary education, secondary education, and higher education. A brief overview of the education levels is presented here to provide the reader with a frame of reference while reading the indicators (see appendix A for more detailed descriptions). To ensure comparability in the indicators across countries, each country restructured its national education data to correspond with the definitions of education levels that were developed in the 1997 revision of the International Standard Classification of Education (ISCED97) (United Nations Educational, Scientific and Cultural Organization [UNESCO] 1997). The following descriptions highlight the key features of (1) education programs from preprimary through secondary education and (2) higher education programs.
4 INTRODUCTION
Preprimary education includes programs of education for children at least 3 years of age that involve organized, center-based instructional activities; in most countries, preprimary education is not compulsory. Primary education includes programs that are designed to give students a sound basic education in reading, writing, and mathematics, along with an elementary understanding of other subjects, such as history, geography, science, art, and music. In the international classification, primary education usually begins at the start of compulsory education (around age 6) and lasts for 6 years. Secondary education encompasses two stages: lower secondary education and upper secondary education. Lower secondary education includes programs that are designed to complete basic education; the standard duration in the international classification is 3 years. Upper secondary education is designed to provide students with more in-depth knowledge of academic or vocational subjects and to prepare them for higher level academic or vocational studies or entry into the labor market. The standard duration of upper secondary education in the international classification is 3 years.
Higher education includes tertiary programs1 that fall into three main categories: • Academic higher education below the doctoral level. These
largely theory-based programs are intended to provide sufficient qualifications to gain entry into advanced research programs and professions with high skill requirements. To be classified as such, a degree program must last at least 3 years and is typically preceded by at least 13 years of formal schooling. In the United States, bachelor’s, master’s, and first professional degree programs are classified at this level.
• Vocational higher education. These programs provide a higher level of career and technical education beyond secondary school and are designed to prepare students for the labor market. In the international classification, these programs last 2 to 4 years. In the United States, associate’s degree programs are classified at this level.
• Doctoral level of academic higher education. These programs usually require the completion of a research thesis or dissertation.
The international classification also includes an education level that straddles the boundary between upper secondary and higher education: postsecondary nontertiary education. These programs of study—which are primarily vocational in nature—are generally taken after the completion of upper secondary education. They are often not significantly more advanced than upper secondary programs, but they serve to extend the skills of participants who have already completed upper secondary education. In the United States, these programs are often in the form of occupationally specific vocational certificate programs, such as 1-year certification programs offered at technical institutes or community colleges.2
Mapping G-8 Countries’ Education Systems to the ISCED97 Matching the education levels of individual countries to the ISCED97 classification can be challenging, because the particulars of individual countries seldom fit ISCED97 perfectly. Using ISCED97 classifications as a starting point, NCES worked with education professionals in other G-8 countries to create a general overview of each country’s education system. As an aid to the reader, schematics of how the ISCED97 applies to each of the G-8 countries are provided in appendix A, accompanied by text describing each system in greater detail.
Organization of the Report The report begins with a summary section that highlights key findings; it then presents 21 indicators that compare different aspects of the education system in the United States to education systems in other G-8 countries. The indicators are organized into the following sections: • population and school enrollment;• academic performance;• context for learning;• expenditures for education; and• educational attainment and income.
The first section, population and school enrollment, presents indicators that suggest the potential demand for education in countries as measured by the size and growth of their school-age population and current and past levels of enrollment in formal education. The section concludes with an indicator that examines the extent to which foreign students are enrolled in higher education across the G-8 countries.
The next section, academic performance, has indicators pertaining to 15-year-olds’ achievement in reading, mathematics, and science. There is an emphasis on reading given that this subject area was the focus of PISA 2009, and several indicators present data from two time points using PISA data. The indicators in this section present findings on student performance in reading, mathematics, and science; change in performance; change in performance by sex; and performance by immigrant status. There are also two indicators that look separately at low performing and high performing students.
The third section highlights a range of issues pertaining to the context for learning across the G-8 countries. This section presents data on class size and ratio of students to teaching staff and two indicators using data from PISA 2000 and 2009: the reports of 15-year-old students on their time spent reading for enjoyment and the reports of school principals about the various purposes for which assessments of 15-year-old students are used at their schools.
1 In the international classification, more advanced postsecondary education (such as attending a 4-year college or university) is referred to as “tertiary education.” In the current report, the term “higher education” is used because this term is more familiar to American readers.2 In data showing annual education expenditures (indicators 15 and 16), postsecondary nontertiary education data are included under primary and secondary education for most G-8 countries, though postsecondary nontertiary education data are included under secondary education and/or higher education for one or more countries as specified in the figures. In data showing the percentage distribution of the population by highest level of education completed (indicator 18), employment rates (indicator 20), and the distribution of the population by education and income (indicator 21), postsecondary nontertiary education data are included under upper secondary education for all G-8 countries reporting data.

INTRODUCTION 5
The fourth section provides a comparative look at expenditures for education, including breakdowns by expenditures as a percentage of a country’s gross domestic product (GDP) and the portion of total education expenditures devoted to core services.3 This section also presents information on change in education expenditures and public school teacher salaries in primary and secondary education.
The final section, educational attainment and income, focuses on graduation rates, educational attainment, employment rates, and earnings (including breakdowns by sex and field of study for some of these areas).
Each indicator is presented in a two-page format. The first page presents key findings that highlight how the United States compares with its G-8 peers (with data available) on the issue examined in the indicator. The key findings are followed by a section that defines the terms used in the indicator and describes key features of the methodology used to produce it. The second page presents graphical depictions of the data that support the key findings. These tables and/or figures also include the specific data source for the indicator and more detailed notes on interpreting the data.
Data Sources There are two main sources of data for this report:• INES data. Data from the INES project come from tables in
Education at a Glance: OECD Indicators 2010 or from OECD’s online Education Database. These data are derived from annual data collections carried out by OECD, with member countries’ data coming from a variety of national data sources, including administrative data collections, school surveys, household surveys, and national financial reports. Most of the indicator data for the United States come from the Current Population Survey (CPS) of the U.S. Census Bureau, the NCES Common Core of Data (CCD), the NCES Integrated Postsecondary Education Data System (IPEDS), and the NCES Schools and Staffing Survey (SASS).
• PISA data. PISA is conducted under the auspices of OECD by participating countries and is an assessment of 15-year-old students, with a major focus in 2009 on reading literacy.
Data for indicator 1, on school-age population, are from the International Data Base (IDB) of the U.S. Census Bureau.
Except for indicator 14 (which explicitly states that the data pertain to public school teachers only) or where otherwise noted for a specific country’s data, the indicators in this report include data from both public and private schools.
Availability of Country Data It should be noted that many of the indicators in this report do not contain data for the complete set of G-8 countries. That is, specific countries are sometimes not included or country data may only
be partially included in an indicator. In indicators using INES data, this is the result of source data not being reported; the “reporting” G-8 countries in these indicators vary somewhat, and these are shown in each indicator. In PISA, data for the United Kingdom are not reported in 2000 and 2003 due to low response rates. In other instances, PISA data may not be reported for a country due to the data not being collected or reporting standards not being met. These instances are noted in each indicator where relevant.
The United Kingdom includes England, Northern Ireland, Scotland, and Wales. In one indicator (indicator 14), data for England and Scotland are shown separately and in place of data for the entire United Kingdom.
Every effort was made to use the most up-to-date data available across the G-8 countries (usually from 2008 or 2009), though sometimes the latest data available from a country are from an earlier year. To make this clear to the reader, these occurrences are noted in relevant tables and figures.
Data Quality and Response Rates PISA has established technical standards of data quality including participation and response rate standards that countries must meet in order to be included in the comparative results. Response rate standards were set using composites of response rates at the school and teacher levels, and response rates were calculated with and without the inclusion of substitute schools that were selected to replace schools refusing to participate.4 These standards are described in detail in the technical reports (OECD forthcoming).
Consistent with NCES statistical standards, item response rates less than 85 percent are footnoted in the tables and figures of this report, as well as instances where reporting standards are not met because of too few observations to provide reliable estimates.
Statistical Testing Thirteen of the indicators presented in this report (indicators 1–4, 11, 14–21) are derived either from administrative records that are based on universe collections or from national sample surveys for which standard errors were not available. Consequently, for these indicators, no tests of statistical significance were conducted to establish whether observed differences from the U.S. average were statistically significant. However, for the eight other indicators derived from PISA data (indicators 5-10, 12, and 13), standard t tests were calculated for comparisons of estimates within or between countries (e.g., to test whether a U.S. estimate is statistically different from other G-8 countries’ estimates). Differences were reported if they were found to be statistically significant at the .05 level, using two-tailed tests of significance for comparisons of independent samples.
3 Expenditures on core education services pertain to spending on instructional services, including faculty/staff salaries, professional development, and books and other school materials.4 International requirements state that each country must make every effort to obtain cooperation from the sampled schools, but the requirements also recognize that this is not always possible. Thus, it is allowable to use substitute schools as a means to avoid sample size loss associated with school nonresponse. To do this, each sampled school was assigned two substitute schools in the sampling frame. Substitutes for nonparticipating sampled schools were identified by assigning as substitute schools the schools that immediately preceded and followed the sampled school on the frame. The sampling frame was sorted by the stratification variables and by a measure of size to ensure that any sampled school’s substitute had similar characteristics.
6 INTRODUCTION
Other International Indicator Publications Prior to this report, NCES produced four earlier reports—in 2009, 2006, 2004, and 2002—describing how the education system in the United States compares with education systems in the other G-8 countries. The 2009 report can be found at http://nces.ed.gov/pubsearch/pubsinfo.asp?pubid=2009039. The 2006 report can be found at http://nces.ed.gov/pubsearch/pubsinfo.asp?pubid=2007006. The 2004 report can be found at http://nces.ed.gov/pubsearch/pubsinfo.asp?pubid=2005021. The 2002 report can be found at http://nces.ed.gov/pubsearch/pubsinfo.asp?pubid=2003026. General information about the International Activities Program at NCES, including work on international comparisons in education, can be found at http://nces.ed.gov/surveys/international.
INDICATORS PART IINDICATORS PART IPopulation and School Enrollment
8 INDICATORS PART I: POPULATION AND SCHOOL ENROLLMENT
SCHOOL-AGE POPULATION
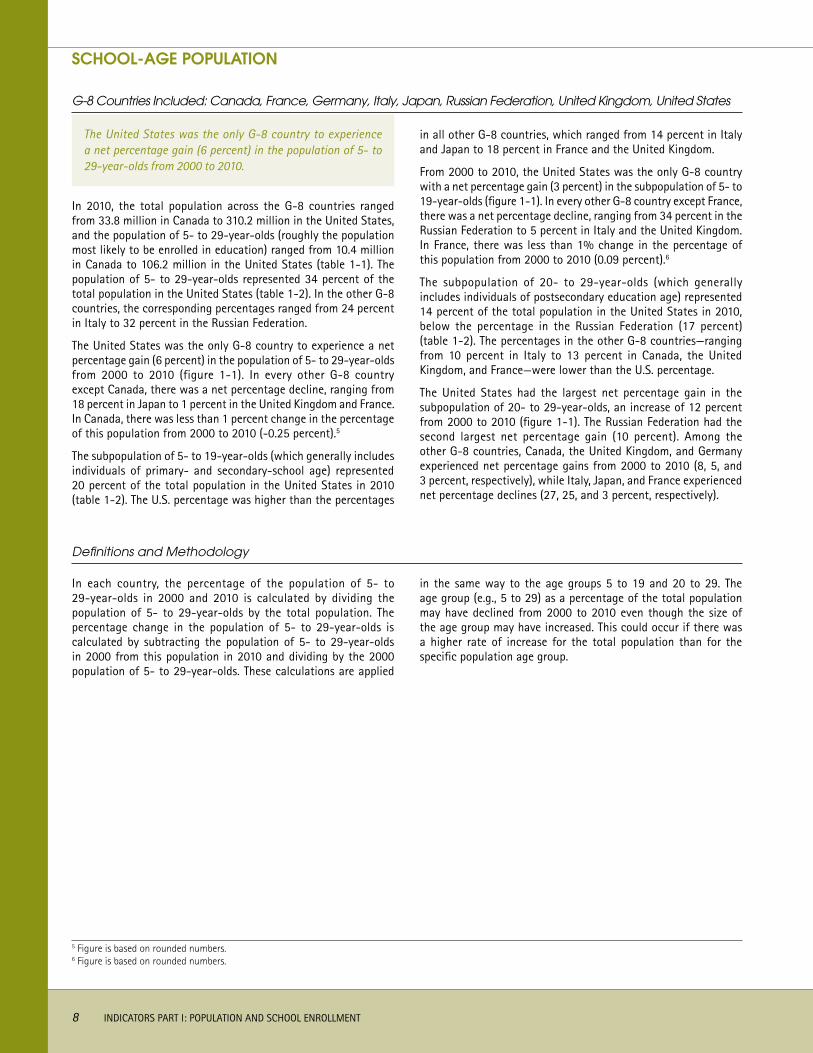
The United States was the only G-8 country to experience a net percentage gain (6 percent) in the population of 5- to 29-year-olds from 2000 to 2010.
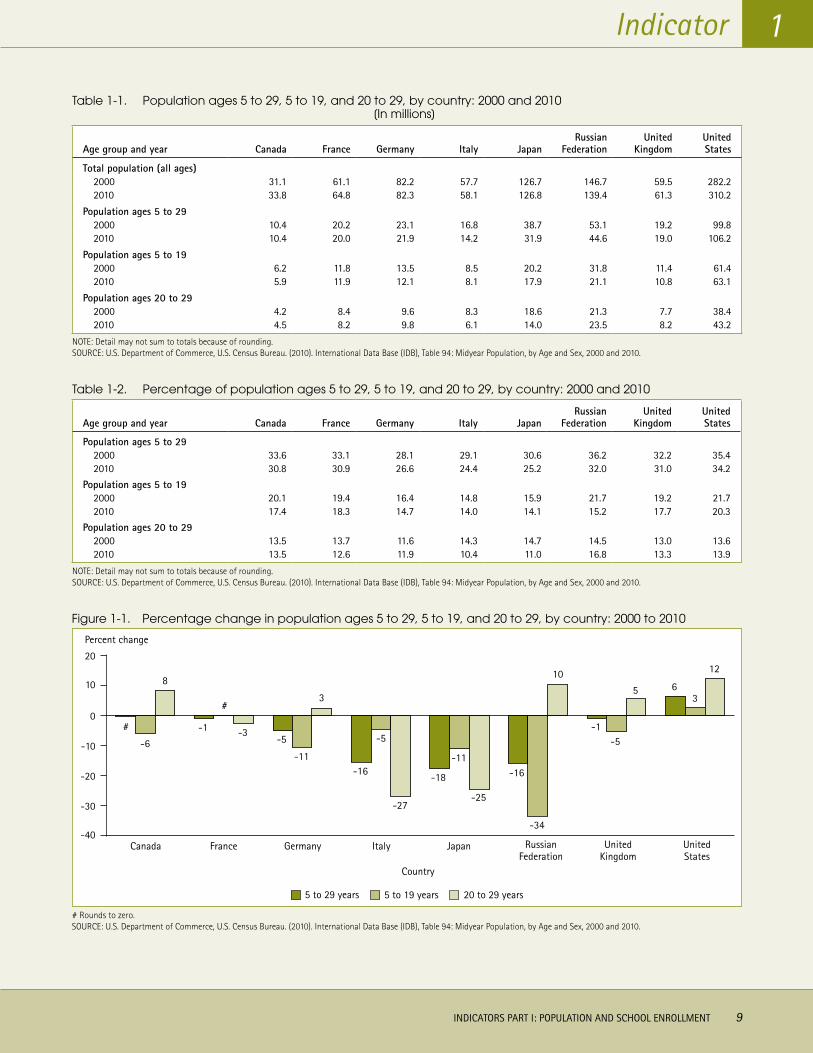
In 2010, the total population across the G-8 countries ranged from 33.8 million in Canada to 310.2 million in the United States, and the population of 5- to 29-year-olds (roughly the population most likely to be enrolled in education) ranged from 10.4 million in Canada to 106.2 million in the United States (table 1-1). The population of 5- to 29-year-olds represented 34 percent of the total population in the United States (table 1-2). In the other G-8 countries, the corresponding percentages ranged from 24 percent in Italy to 32 percent in the Russian Federation.
The United States was the only G-8 country to experience a net percentage gain (6 percent) in the population of 5- to 29-year-olds from 2000 to 2010 (figure 1-1). In every other G-8 country except Canada, there was a net percentage decline, ranging from 18 percent in Japan to 1 percent in the United Kingdom and France. In Canada, there was less than 1 percent change in the percentage of this population from 2000 to 2010 (-0.25 percent).5
The subpopulation of 5- to 19-year-olds (which generally includes individuals of primary- and secondary-school age) represented 20 percent of the total population in the United States in 2010 (table 1-2). The U.S. percentage was higher than the percentages
G-8 Countries Included: Canada, France, Germany, Italy, Japan, Russian Federation, United Kingdom, United States
in all other G-8 countries, which ranged from 14 percent in Italy and Japan to 18 percent in France and the United Kingdom.
From 2000 to 2010, the United States was the only G-8 country with a net percentage gain (3 percent) in the subpopulation of 5- to 19-year-olds (figure 1-1). In every other G-8 country except France, there was a net percentage decline, ranging from 34 percent in the Russian Federation to 5 percent in Italy and the United Kingdom. In France, there was less than 1% change in the percentage of this population from 2000 to 2010 (0.09 percent).6
The subpopulation of 20- to 29-year-olds (which generally includes individuals of postsecondary education age) represented 14 percent of the total population in the United States in 2010, below the percentage in the Russian Federation (17 percent) (table 1-2). The percentages in the other G-8 countries—ranging from 10 percent in Italy to 13 percent in Canada, the United Kingdom, and France—were lower than the U.S. percentage.
The United States had the largest net percentage gain in the subpopulation of 20- to 29-year-olds, an increase of 12 percent from 2000 to 2010 (figure 1-1). The Russian Federation had the second largest net percentage gain (10 percent). Among the other G-8 countries, Canada, the United Kingdom, and Germany experienced net percentage gains from 2000 to 2010 (8, 5, and 3 percent, respectively), while Italy, Japan, and France experienced net percentage declines (27, 25, and 3 percent, respectively).
Definitions and Methodology
In each country, the percentage of the population of 5- to 29-year-olds in 2000 and 2010 is calculated by dividing the population of 5- to 29-year-olds by the total population. The percentage change in the population of 5- to 29-year-olds is calculated by subtracting the population of 5- to 29-year-olds in 2000 from this population in 2010 and dividing by the 2000 population of 5- to 29-year-olds. These calculations are applied
in the same way to the age groups 5 to 19 and 20 to 29. The age group (e.g., 5 to 29) as a percentage of the total population may have declined from 2000 to 2010 even though the size of the age group may have increased. This could occur if there was a higher rate of increase for the total population than for the specific population age group.
5 Figure is based on rounded numbers.6 Figure is based on rounded numbers.
Indicator
INDICATORS PART I: POPULATION AND SCHOOL ENROLLMENT 9
1
Table 1-1. Population ages 5 to 29, 5 to 19, and 20 to 29, by country: 2000 and 2010[In millions]
Age group and year Canada France Germany Italy JapanRussian
FederationUnited
KingdomUnited States
Total population (all ages)2000 31.1 61.1 82.2 57.7 126.7 146.7 59.5 282.22010 33.8 64.8 82.3 58.1 126.8 139.4 61.3 310.2
Population ages 5 to 292000 10.4 20.2 23.1 16.8 38.7 53.1 19.2 99.82010 10.4 20.0 21.9 14.2 31.9 44.6 19.0 106.2
Population ages 5 to 192000 6.2 11.8 13.5 8.5 20.2 31.8 11.4 61.42010 5.9 11.9 12.1 8.1 17.9 21.1 10.8 63.1
Population ages 20 to 292000 4.2 8.4 9.6 8.3 18.6 21.3 7.7 38.42010 4.5 8.2 9.8 6.1 14.0 23.5 8.2 43.2
NOTE: Detail may not sum to totals because of rounding. SOURCE: U.S. Department of Commerce, U.S. Census Bureau. (2010). International Data Base (IDB), Table 94: Midyear Population, by Age and Sex, 2000 and 2010.
Table 1-2. Percentage of population ages 5 to 29, 5 to 19, and 20 to 29, by country: 2000 and 2010
Age group and year Canada France Germany Italy JapanRussian
FederationUnited
KingdomUnited States
Population ages 5 to 292000 33.6 33.1 28.1 29.1 30.6 36.2 32.2 35.42010 30.8 30.9 26.6 24.4 25.2 32.0 31.0 34.2
Population ages 5 to 192000 20.1 19.4 16.4 14.8 15.9 21.7 19.2 21.72010 17.4 18.3 14.7 14.0 14.1 15.2 17.7 20.3
Population ages 20 to 292000 13.5 13.7 11.6 14.3 14.7 14.5 13.0 13.62010 13.5 12.6 11.9 10.4 11.0 16.8 13.3 13.9
NOTE: Detail may not sum to totals because of rounding. SOURCE: U.S. Department of Commerce, U.S. Census Bureau. (2010). International Data Base (IDB), Table 94: Midyear Population, by Age and Sex, 2000 and 2010.
Figure 1-1. Percentage change in population ages 5 to 29, 5 to 19, and 20 to 29, by country: 2000 to 2010
#
-6
8
-1
#
-3-5
-11
3
-16
-5
-27
-18
-11
-25
-16
-34
10
-1-5
5 63
12
-40
-30
-20
-10
0
10
20
Percent change
Canada France
Country
Germany Italy Japan RussianFederation
UnitedKingdom
UnitedStates
20 to 29 years5 to 19 years5 to 29 years
# Rounds to zero. SOURCE: U.S. Department of Commerce, U.S. Census Bureau. (2010). International Data Base (IDB), Table 94: Midyear Population, by Age and Sex, 2000 and 2010.
10 INDICATORS PART I: POPULATION AND SCHOOL ENROLLMENT
ENROLLMENT IN FORMAL EDUCATION
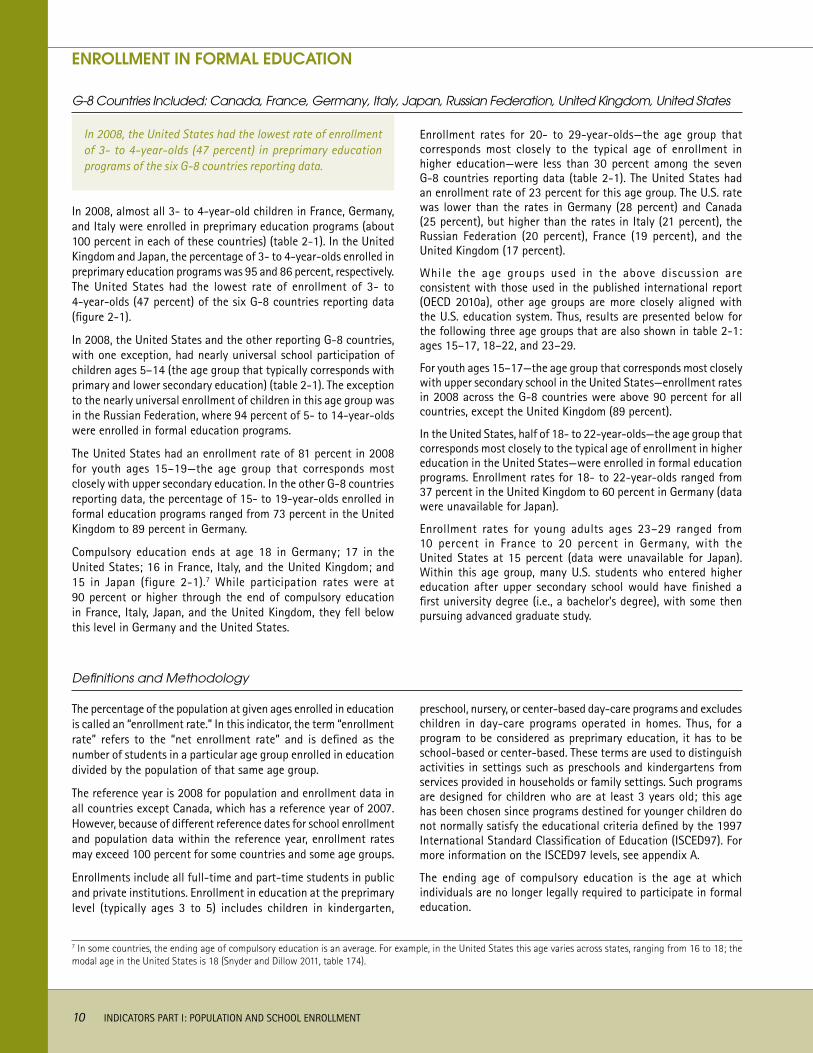
In 2008, the United States had the lowest rate of enrollment of 3- to 4-year-olds (47 percent) in preprimary education programs of the six G-8 countries reporting data.
G-8 Countries Included: Canada, France, Germany, Italy, Japan, Russian Federation, United Kingdom, United States
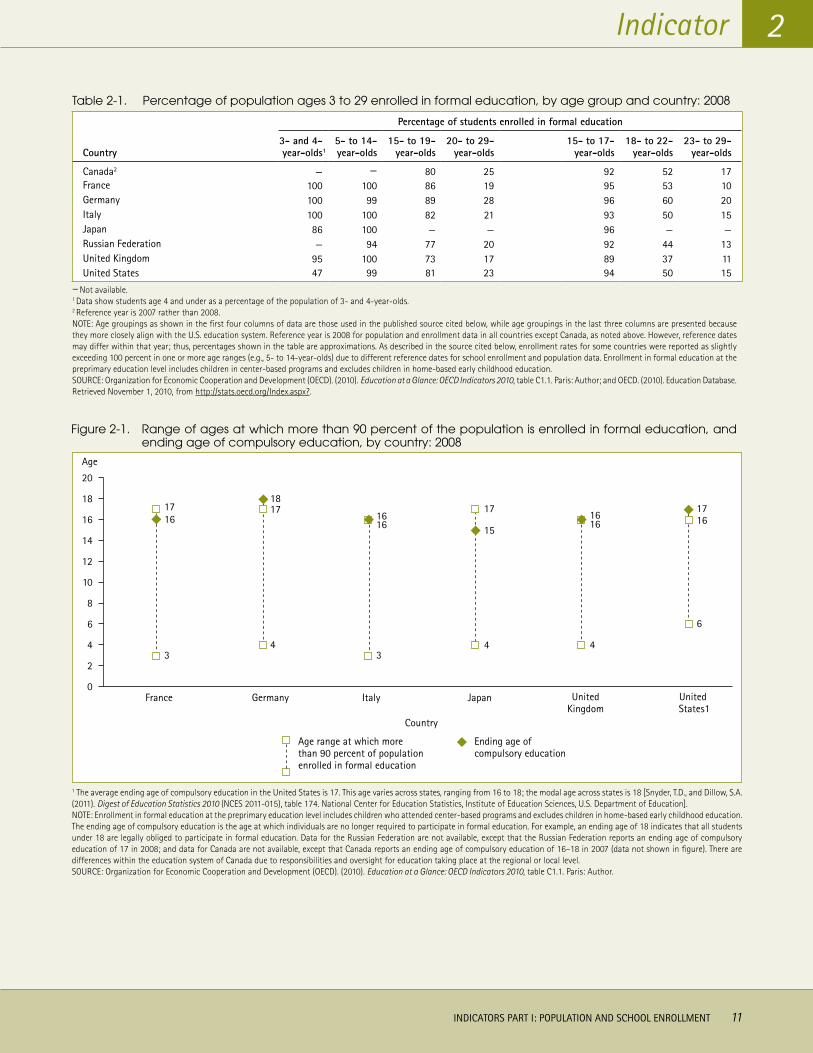
In 2008, almost all 3- to 4-year-old children in France, Germany, and Italy were enrolled in preprimary education programs (about 100 percent in each of these countries) (table 2-1). In the United Kingdom and Japan, the percentage of 3- to 4-year-olds enrolled in preprimary education programs was 95 and 86 percent, respectively. The United States had the lowest rate of enrollment of 3- to 4-year-olds (47 percent) of the six G-8 countries reporting data (figure 2-1).
In 2008, the United States and the other reporting G-8 countries, with one exception, had nearly universal school participation of children ages 5–14 (the age group that typically corresponds with primary and lower secondary education) (table 2-1). The exception to the nearly universal enrollment of children in this age group was in the Russian Federation, where 94 percent of 5- to 14-year-olds were enrolled in formal education programs.
The United States had an enrollment rate of 81 percent in 2008 for youth ages 15–19—the age group that corresponds most closely with upper secondary education. In the other G-8 countries reporting data, the percentage of 15- to 19-year-olds enrolled in formal education programs ranged from 73 percent in the United Kingdom to 89 percent in Germany.
Compulsory education ends at age 18 in Germany; 17 in the United States; 16 in France, Italy, and the United Kingdom; and 15 in Japan (figure 2-1).7 While participation rates were at 90 percent or higher through the end of compulsory education in France, Italy, Japan, and the United Kingdom, they fell below this level in Germany and the United States.
Enrollment rates for 20- to 29-year-olds—the age group that corresponds most closely to the typical age of enrollment in higher education—were less than 30 percent among the seven G-8 countries reporting data (table 2-1). The United States had an enrollment rate of 23 percent for this age group. The U.S. rate was lower than the rates in Germany (28 percent) and Canada (25 percent), but higher than the rates in Italy (21 percent), the Russian Federation (20 percent), France (19 percent), and the United Kingdom (17 percent).
While the age groups used in the above discussion are consistent with those used in the published international report (OECD 2010a), other age groups are more closely aligned with the U.S. education system. Thus, results are presented below for the following three age groups that are also shown in table 2-1: ages 15–17, 18–22, and 23–29.
For youth ages 15–17—the age group that corresponds most closely with upper secondary school in the United States—enrollment rates in 2008 across the G-8 countries were above 90 percent for all countries, except the United Kingdom (89 percent).
In the United States, half of 18- to 22-year-olds—the age group that corresponds most closely to the typical age of enrollment in higher education in the United States—were enrolled in formal education programs. Enrollment rates for 18- to 22-year-olds ranged from 37 percent in the United Kingdom to 60 percent in Germany (data were unavailable for Japan).
Enrollment rates for young adults ages 23–29 ranged from 10 percent in France to 20 percent in Germany, with the United States at 15 percent (data were unavailable for Japan). Within this age group, many U.S. students who entered higher education after upper secondary school would have finished a first university degree (i.e., a bachelor’s degree), with some then pursuing advanced graduate study.
Definitions and Methodology
The percentage of the population at given ages enrolled in education is called an “enrollment rate.” In this indicator, the term “enrollment rate” refers to the “net enrollment rate” and is defined as the number of students in a particular age group enrolled in education divided by the population of that same age group.
The reference year is 2008 for population and enrollment data in all countries except Canada, which has a reference year of 2007. However, because of different reference dates for school enrollment and population data within the reference year, enrollment rates may exceed 100 percent for some countries and some age groups.
Enrollments include all full-time and part-time students in public and private institutions. Enrollment in education at the preprimary level (typically ages 3 to 5) includes children in kindergarten,
preschool, nursery, or center-based day-care programs and excludes children in day-care programs operated in homes. Thus, for a program to be considered as preprimary education, it has to be school-based or center-based. These terms are used to distinguish activities in settings such as preschools and kindergartens from services provided in households or family settings. Such programs are designed for children who are at least 3 years old; this age has been chosen since programs destined for younger children do not normally satisfy the educational criteria defined by the 1997 International Standard Classification of Education (ISCED97). For more information on the ISCED97 levels, see appendix A.
The ending age of compulsory education is the age at which individuals are no longer legally required to participate in formal education.
7 In some countries, the ending age of compulsory education is an average. For example, in the United States this age varies across states, ranging from 16 to 18; the modal age in the United States is 18 (Snyder and Dillow 2011, table 174).
Indicator
INDICATORS PART I: POPULATION AND SCHOOL ENROLLMENT 11
2
Table 2-1. Percentage of population ages 3 to 29 enrolled in formal education, by age group and country: 2008
Country
Percentage of students enrolled in formal education
3- and 4- year-olds1
5- to 14- year-olds
15- to 19- year-olds
20- to 29- year-olds
15- to 17- year-olds
18- to 22- year-olds
23- to 29- year-olds
Canada2 — — 80 25 92 52 17France 100 100 86 19 95 53 10Germany 100 99 89 28 96 60 20Italy 100 100 82 21 93 50 15Japan 86 100 — — 96 — —Russian Federation — 94 77 20 92 44 13United Kingdom 95 100 73 17 89 37 11United States 47 99 81 23 94 50 15
— Not available.1 Data show students age 4 and under as a percentage of the population of 3- and 4-year-olds.2 Reference year is 2007 rather than 2008.NOTE: Age groupings as shown in the first four columns of data are those used in the published source cited below, while age groupings in the last three columns are presented because they more closely align with the U.S. education system. Reference year is 2008 for population and enrollment data in all countries except Canada, as noted above. However, reference dates may differ within that year; thus, percentages shown in the table are approximations. As described in the source cited below, enrollment rates for some countries were reported as slightly exceeding 100 percent in one or more age ranges (e.g., 5- to 14-year-olds) due to different reference dates for school enrollment and population data. Enrollment in formal education at the preprimary education level includes children in center-based programs and excludes children in home-based early childhood education.SOURCE: Organization for Economic Cooperation and Development (OECD). (2010). Education at a Glance: OECD Indicators 2010, table C1.1. Paris: Author; and OECD. (2010). Education Database. Retrieved November 1, 2010, from http://stats.oecd.org/Index.aspx?.
Figure 2-1. Range of ages at which more than 90 percent of the population is enrolled in formal education, and ending age of compulsory education, by country: 2008
B
B
B
B
B B
B
B
B
B
BB
B
B
B B
B
0
2
4
6
8
10
12
14
16
18
20
Age
Country
Age range at which more than 90 percent of population enrolled in formal education
Ending age of compulsory education
BB
BB
France Germany Italy Japan UnitedKingdom
United States1
1716
3
1817
4
1616
3
1616
4
1716
6
17
15
4
1 The average ending age of compulsory education in the United States is 17. This age varies across states, ranging from 16 to 18; the modal age across states is 18 [Snyder, T.D., and Dillow, S.A. (2011). Digest of Education Statistics 2010 (NCES 2011-015), table 174. National Center for Education Statistics, Institute of Education Sciences, U.S. Department of Education].NOTE: Enrollment in formal education at the preprimary education level includes children who attended center-based programs and excludes children in home-based early childhood education. The ending age of compulsory education is the age at which individuals are no longer required to participate in formal education. For example, an ending age of 18 indicates that all students under 18 are legally obliged to participate in formal education. Data for the Russian Federation are not available, except that the Russian Federation reports an ending age of compulsory education of 17 in 2008; and data for Canada are not available, except that Canada reports an ending age of compulsory education of 16–18 in 2007 (data not shown in figure). There are differences within the education system of Canada due to responsibilities and oversight for education taking place at the regional or local level.SOURCE: Organization for Economic Cooperation and Development (OECD). (2010). Education at a Glance: OECD Indicators 2010, table C1.1. Paris: Author.
12 INDICATORS PART I: POPULATION AND SCHOOL ENROLLMENT
Enrollment rates for young adults ages 18–22 increased from 1999 to 2008 in Italy (from 40 to 50 percent), Canada (from 43 to 52 percent), the United States (from 43 to 50 percent), and Germany (from 58 to 60 percent), but decreased in the United Kingdom (from 44 to 37 percent) and France (from 57 to 53 percent).
G-8 Countries Included: Canada, France, Germany, Italy, Japan, Russian Federation, United Kingdom, United States
CHANGE IN ENROLLMENT IN FORMAL EDUCATION
In all G-8 countries reporting data except the United States, the percentage of 3- to 4-year-old children enrolled in preprimary or primary education programs either increased from 1999 to 2008 or remained at about 100 percent (table 3-1). The largest increase occurred in Germany, where the percentage of 3- to 4-year-olds enrolled in preprimary or primary education programs went from 66 percent in 1999 to about 100 percent in 2008. The enrollment rate of 3- to 4-year-olds increased from 77 to 95 percent in the United Kingdom and from 76 to 86 percent in Japan. In the United States, the enrollment rate of 3- to 4-year-olds was 47 percent in both 1999 and 2008.
In 1999 and 2008, most G-8 countries had nearly universal school participation (i.e., enrollment of at least 99 percent) of children ages 5–14—the age range that typically corresponds with primary and lower secondary education. An exception was the Russian Federation, where the enrollment rate of 5- to 14-year-olds was 79 percent in 1999 and 94 percent in 2008.
For youth ages 15–19—the age range that corresponds most closely with upper secondary education—enrollment in formal education programs showed little if any change from 1999 to 2008 in France (87 and 86 percent, respectively), Germany (88 and 89 percent, respectively), and the United Kingdom (73 percent in both years). The biggest change in the enrollment rate of 15- to 19-year-olds from 1999 to 2008 was in the Russian Federation, with an increase from 32 to 77 percent, followed by increases in Italy (from 71 to 82 percent), Canada (from 75 to 80 percent), and the United States (from 78 to 81 percent).
For 20- to 29-year olds—the age that corresponds most closely to the typical age of enrollment in higher education—changes in enrollment varied across G-8 countries from 1999 to 2008. The
enrollment rate increased from 20 to 25 percent in Canada, 23 to 28 percent in Germany, 17 to 21 percent in Italy, and 20 to 23 percent in the United States during that time period. In France, the enrollment rate of 20- to 29-year-olds stayed about the same (19 percent in both years), while in the United Kingdom it decreased from 24 to 17 percent.
While the age groups used in the above discussion are consistent with those used in the published international report (OECD 2010a), other age groups are more closely aligned with the U.S. education system. Thus, results are presented below for the following three age groups that are also shown in table 3-1: ages 15–17, 18–22, and 23–29.
For youth ages 15–17—the age range that corresponds most closely with upper secondary school in the United States—two G-8 countries showed increases in enrollment from 1999 to 2008: the Russian Federation (from 52 to 92 percent) and Italy (from 80 to 93 percent). In Canada, France, Germany, Japan, and the United States, between 92 and 96 percent of 15- to 17-year-olds were enrolled in formal education programs in 1999 and 2008, as were close to 90 percent of 15- to 17-year-olds in the United Kingdom.
Enrollment rates for young adults ages 18–22—the age range that corresponds most closely to the typical age of enrollment in higher education in the United States—increased from 1999 to 2008 in four of the six G-8 countries reporting data. Italy had the largest increase (from 40 to 50 percent), followed by Canada (from 43 to 52 percent), the United States (from 43 to 50 percent), and Germany (from 58 to 60 percent). The enrollment rate of 18- to 22-year-olds decreased from 1999 to 2008 in the United Kingdom (from 44 to 37 percent) and France (from 57 to 53 percent).
Enrollment rates for young adults ages 23–29 ranged from 11 percent in France to 21 percent in the United Kingdom in 1999 and from 10 percent in France to 20 percent in Germany in 2008. In four of the six G-8 countries reporting data (Italy, France, the United States, and Canada), enrollment rates for 23- to 29-year-olds varied by no more than 2 percentage points from 1999 to 2008. In Germany, the enrollment rate increased from 17 to 20 percent from 1999 to 2008, while in the United Kingdom, it decreased from 21 to 11 percent.
Definitions and Methodology
The percentage of the population at given ages enrolled in education is called an “enrollment rate.” In this indicator, the term “enrollment rate” refers to the “net enrollment rate” and is defined as the number of students in a particular age group enrolled in education divided by the population of that same age group.
The reference year is 1999 or 2008 for population and enrollment data in all countries except Canada, which has a reference year of 2007 rather than 2008. However, because of different reference dates for school enrollment and population data within the reference year, enrollment rates may exceed 100 percent for some countries and some age groups.
Enrollments include all full-time and part-time students in public and private institutions. Enrollment in education at the preprimary level (typically ages 3 to 5) includes children in kindergarten, preschool, nursery, or center-based day-care programs and excludes children in day-care programs operated in homes. Thus, for a program to be considered as preprimary education, it has to be school-based or center-based. These terms are used to distinguish activities in settings such as preschools and kindergartens from services provided in households or family settings. Such programs are designed for children who are at least 3 years old; this age has been chosen since programs destined for younger children do not normally satisfy the educational criteria defined by the 1997 International Standard Classification of Education (ISCED97). For more information on the ISCED97 levels, see appendix A.
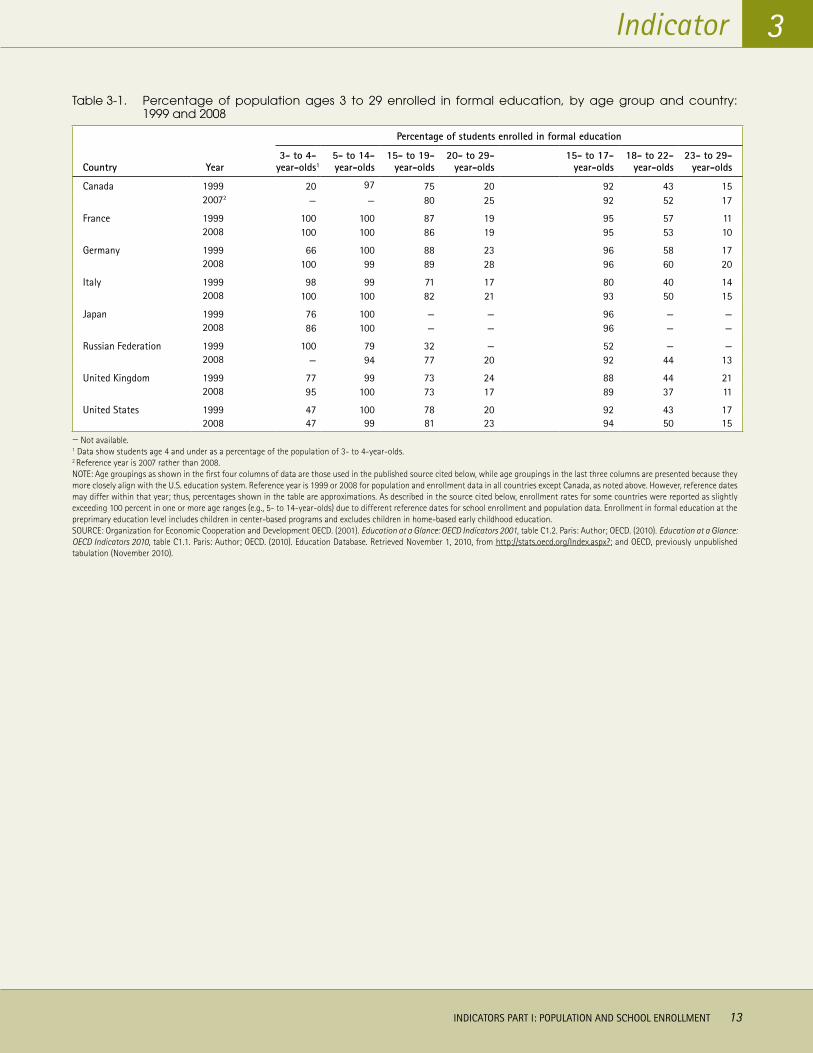
Indicator
INDICATORS PART I: POPULATION AND SCHOOL ENROLLMENT 13
3
Table 3-1. Percentage of population ages 3 to 29 enrolled in formal education, by age group and country: 1999 and 2008
Country Year
Percentage of students enrolled in formal education
3- to 4- year-olds1
5- to 14- year-olds
15- to 19- year-olds
20- to 29- year-olds
15- to 17- year-olds
18- to 22- year-olds
23- to 29- year-olds
Canada 1999 20 97 75 20 92 43 1520072 — — 80 25 92 52 17
France 1999 100 100 87 19 95 57 112008 100 100 86 19 95 53 10
Germany 1999 66 100 88 23 96 58 172008 100 99 89 28 96 60 20
Italy 1999 98 99 71 17 80 40 142008 100 100 82 21 93 50 15
Japan 1999 76 100 — — 96 — —2008 86 100 — — 96 — —
Russian Federation 1999 100 79 32 — 52 — —2008 — 94 77 20 92 44 13
United Kingdom 1999 77 99 73 24 88 44 212008 95 100 73 17 89 37 11
United States 1999 47 100 78 20 92 43 172008 47 99 81 23 94 50 15
— Not available.1 Data show students age 4 and under as a percentage of the population of 3- to 4-year-olds.2 Reference year is 2007 rather than 2008.NOTE: Age groupings as shown in the first four columns of data are those used in the published source cited below, while age groupings in the last three columns are presented because they more closely align with the U.S. education system. Reference year is 1999 or 2008 for population and enrollment data in all countries except Canada, as noted above. However, reference dates may differ within that year; thus, percentages shown in the table are approximations. As described in the source cited below, enrollment rates for some countries were reported as slightly exceeding 100 percent in one or more age ranges (e.g., 5- to 14-year-olds) due to different reference dates for school enrollment and population data. Enrollment in formal education at the preprimary education level includes children in center-based programs and excludes children in home-based early childhood education. SOURCE: Organization for Economic Cooperation and Development OECD. (2001). Education at a Glance: OECD Indicators 2001, table C1.2. Paris: Author; OECD. (2010). Education at a Glance: OECD Indicators 2010, table C1.1. Paris: Author; OECD. (2010). Education Database. Retrieved November 1, 2010, from http://stats.oecd.org/Index.aspx?; and OECD, previously unpublished tabulation (November 2010).
14 INDICATORS PART I: POPULATION AND SCHOOL ENROLLMENT
FOREIGN STUDENTS IN HIGHER EDUCATION
Among the G-8 countries, the United States had the most foreign students (in absolute numbers) enrolled in higher education in 2008, but foreign students made up a larger percentage of enrollment in higher education in the United Kingdom, Canada, France, and Germany.
G-8 Countries Included: Canada, France, Germany, Italy, Japan, Russian Federation, United Kingdom, United States
Over the past 35 years, the number of foreign students (i.e., students enrolled outside their country of citizenship) in higher education has more than quadrupled: from 0.6 million worldwide in 1975 to 3.3 million in 2008 (OECD 2010a). In 2008, G-8 countries (as countries of destination) hosted 59 percent of all foreign students in higher education (figure 4-1). Among G-8 countries, the United States received the largest percentage of foreign students (19 percent), followed by the United Kingdom (10 percent). The other G-8 countries each took in between 2 and 7 percent of all foreign students enrolled in higher education.
In terms of the percentage of a country’s students enrolled in higher education who are foreign students, foreign students made up a larger percentage of enrollments in higher education in the United Kingdom (20 percent), Canada (13 percent), France (11 percent), and Germany (11 percent) than in the United States8 (3 percent) (figure 4-2). In the Russian Federation, foreign students made up 1 percent of the total enrollment in higher education, lower than in all other G-8 countries.
Across the G-8 countries, foreign students made up a larger percent-age of enrollments in academic higher education at the doctoral level than at the pre-doctoral level. At the pre-doctoral level of academic higher education, foreign students made up the largest percentage of enrollment in the United Kingdom, at 21 percent. At the doctoral level of academic higher education, foreign students made up more than 25 percent of the enrollment in four out of the six G-8 countries reporting data: the United Kingdom (48 percent), France (40 percent), Canada (39 percent), and the United States (28 percent).
Definitions and Methodology
Foreign students are defined as noncitizens enrolled in education programs in a host country, and thus some permanent residents are included. International students are defined as students who enrolled in institutions in other countries, and thus do not include
permanent residents. As shown in the figures, education levels are defined according to the 1997 International Standard Classification of Education (ISCED97). For more information on the ISCED97 levels, see appendix A.
8 Unlike the other G-8 countries, the United States did not specifically report the percentage of higher education enrollment consisting of foreign students. It instead reported the percentage of higher education enrollment consisting of international students. International students are defined as students who have crossed borders expressly with the intention to study, and thus do not include permanent residents. This measure, then, is a somewhat underestimated proxy for the number of foreign students.
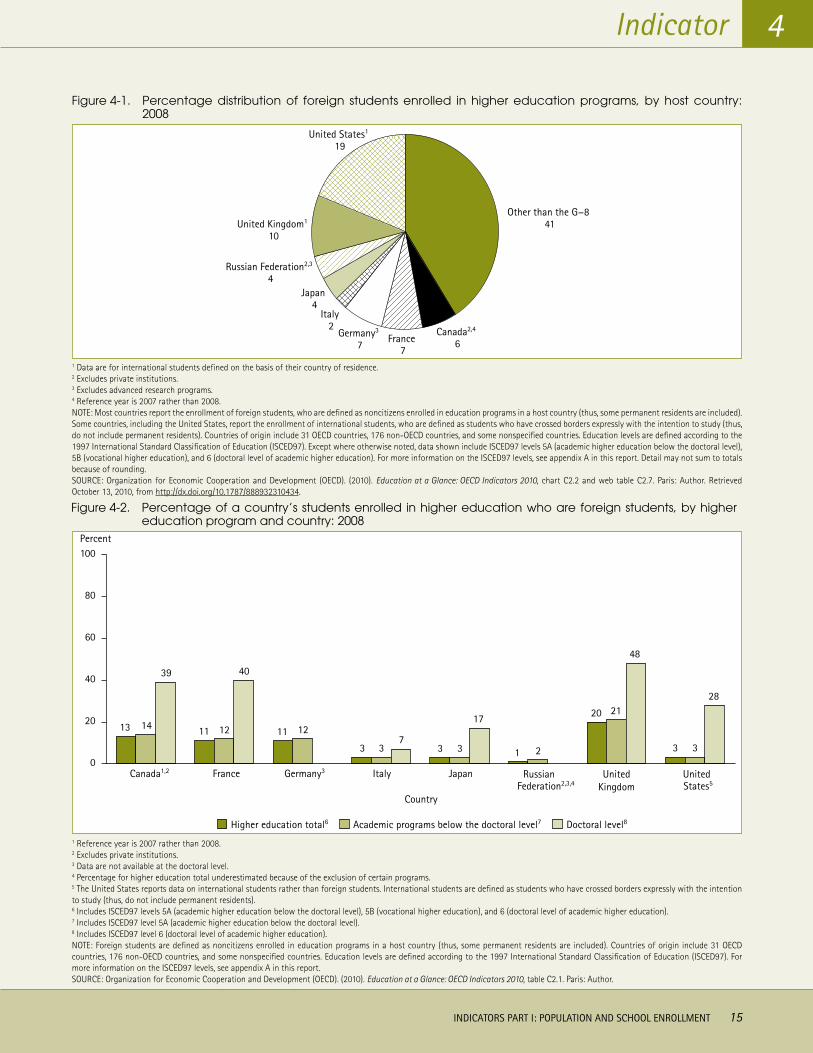
Indicator
INDICATORS PART I: POPULATION AND SCHOOL ENROLLMENT 15
4
Figure 4-1. Percentage distribution of foreign students enrolled in higher education programs, by host country: 2008
Other than the G−8 41
Canada2,4 6France
7
Germany3 7
Italy 2
Japan 4
Russian Federation2,3 4
United Kingdom1 10
United States1 19
1 Data are for international students defined on the basis of their country of residence. 2 Excludes private institutions.3 Excludes advanced research programs.4 Reference year is 2007 rather than 2008.NOTE: Most countries report the enrollment of foreign students, who are defined as noncitizens enrolled in education programs in a host country (thus, some permanent residents are included). Some countries, including the United States, report the enrollment of international students, who are defined as students who have crossed borders expressly with the intention to study (thus, do not include permanent residents). Countries of origin include 31 OECD countries, 176 non-OECD countries, and some nonspecified countries. Education levels are defined according to the 1997 International Standard Classification of Education (ISCED97). Except where otherwise noted, data shown include ISCED97 levels 5A (academic higher education below the doctoral level), 5B (vocational higher education), and 6 (doctoral level of academic higher education). For more information on the ISCED97 levels, see appendix A in this report. Detail may not sum to totals because of rounding. SOURCE: Organization for Economic Cooperation and Development (OECD). (2010). Education at a Glance: OECD Indicators 2010, chart C2.2 and web table C2.7. Paris: Author. Retrieved
Figure 4-2. Percentage of a country’s students enrolled in higher education who are foreign students, by higher education program and country: 2008
October 13, 2010, from http://dx.doi.org/10.1787/888932310434.
13 14
39
11 12
40
11 12
3 37
3 3
17
1 2
20 21
48
3 3
28
0
20
40
60
80
100Percent
Canada1,2 France Germany3 Italy Japan Russian Federation2,3,4
UnitedKingdom
United States5
Country
Doctoral level8Higher education total6 Academic programs below the doctoral level7
1 Reference year is 2007 rather than 2008.2 Excludes private institutions.3 Data are not available at the doctoral level.4 Percentage for higher education total underestimated because of the exclusion of certain programs.5 The United States reports data on international students rather than foreign students. International students are defined as students who have crossed borders expressly with the intention to study (thus, do not include permanent residents).6 Includes ISCED97 levels 5A (academic higher education below the doctoral level), 5B (vocational higher education), and 6 (doctoral level of academic higher education).7 Includes ISCED97 level 5A (academic higher education below the doctoral level).8 Includes ISCED97 level 6 (doctoral level of academic higher education).NOTE: Foreign students are defined as noncitizens enrolled in education programs in a host country (thus, some permanent residents are included). Countries of origin include 31 OECD countries, 176 non-OECD countries, and some nonspecified countries. Education levels are defined according to the 1997 International Standard Classification of Education (ISCED97). For more information on the ISCED97 levels, see appendix A in this report. SOURCE: Organization for Economic Cooperation and Development (OECD). (2010). Education at a Glance: OECD Indicators 2010, table C2.1. Paris: Author.


INDICATORS PART IIINDICATORS PART IIAcademic Performance
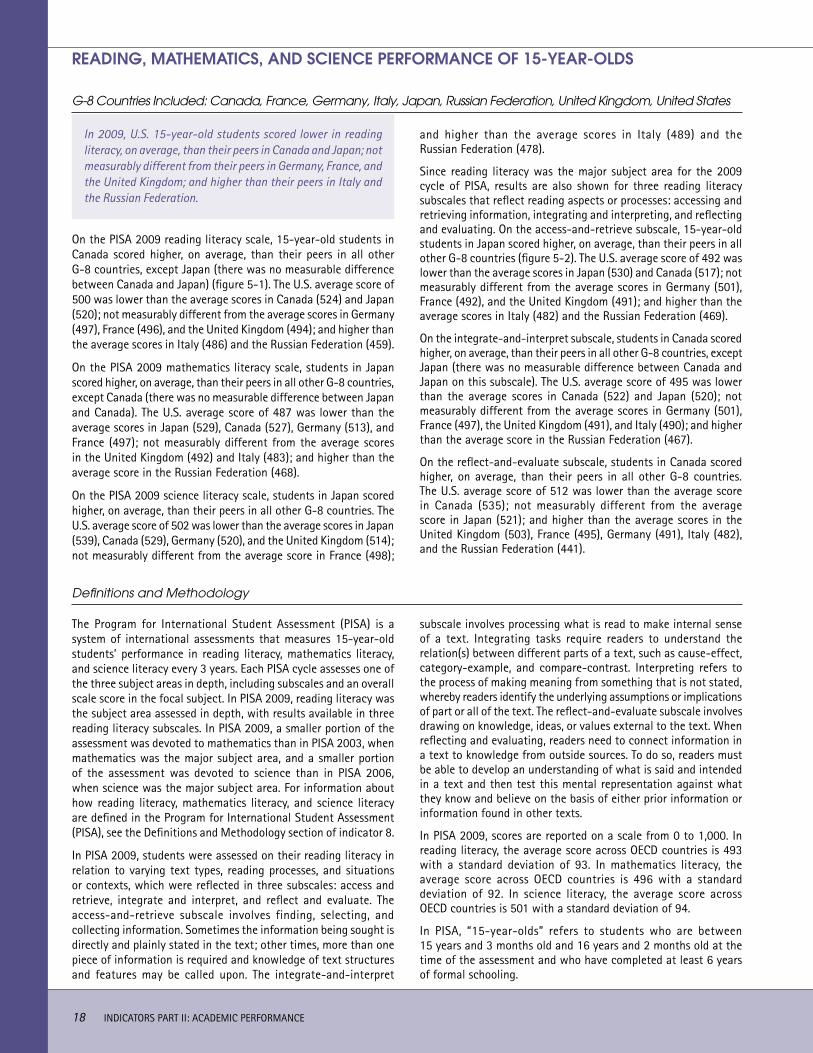
18 INDICATORS PART II: ACADEMIC PERFORMANCE
In 2009, U.S. 15-year-old students scored lower in reading literacy, on average, than their peers in Canada and Japan; not measurably different from their peers in Germany, France, and the United Kingdom; and higher than their peers in Italy and the Russian Federation.
G-8 Countries Included: Canada, France, Germany, Italy, Japan, Russian Federation, United Kingdom, United States
READING, MATHEMATICS, AND SCIENCE PERFORMANCE OF 15-YEAR-OLDS
On the PISA 2009 reading literacy scale, 15-year-old students in Canada scored higher, on average, than their peers in all other G-8 countries, except Japan (there was no measurable difference between Canada and Japan) (figure 5-1). The U.S. average score of 500 was lower than the average scores in Canada (524) and Japan (520); not measurably different from the average scores in Germany (497), France (496), and the United Kingdom (494); and higher than the average scores in Italy (486) and the Russian Federation (459).
On the PISA 2009 mathematics literacy scale, students in Japan scored higher, on average, than their peers in all other G-8 countries, except Canada (there was no measurable difference between Japan and Canada). The U.S. average score of 487 was lower than the average scores in Japan (529), Canada (527), Germany (513), and France (497); not measurably different from the average scores in the United Kingdom (492) and Italy (483); and higher than the average score in the Russian Federation (468).
On the PISA 2009 science literacy scale, students in Japan scored higher, on average, than their peers in all other G-8 countries. The U.S. average score of 502 was lower than the average scores in Japan (539), Canada (529), Germany (520), and the United Kingdom (514); not measurably different from the average score in France (498);
and higher than the average scores in Italy (489) and the Russian Federation (478).
Since reading literacy was the major subject area for the 2009 cycle of PISA, results are also shown for three reading literacy subscales that reflect reading aspects or processes: accessing and retrieving information, integrating and interpreting, and reflecting and evaluating. On the access-and-retrieve subscale, 15-year-old students in Japan scored higher, on average, than their peers in all other G-8 countries (figure 5-2). The U.S. average score of 492 was lower than the average scores in Japan (530) and Canada (517); not measurably different from the average scores in Germany (501), France (492), and the United Kingdom (491); and higher than the average scores in Italy (482) and the Russian Federation (469).
On the integrate-and-interpret subscale, students in Canada scored higher, on average, than their peers in all other G-8 countries, except Japan (there was no measurable difference between Canada and Japan on this subscale). The U.S. average score of 495 was lower than the average scores in Canada (522) and Japan (520); not measurably different from the average scores in Germany (501), France (497), the United Kingdom (491), and Italy (490); and higher than the average score in the Russian Federation (467).
On the reflect-and-evaluate subscale, students in Canada scored higher, on average, than their peers in all other G-8 countries. The U.S. average score of 512 was lower than the average score in Canada (535); not measurably different from the average score in Japan (521); and higher than the average scores in the United Kingdom (503), France (495), Germany (491), Italy (482), and the Russian Federation (441).
Definitions and Methodology
The Program for International Student Assessment (PISA) is a system of international assessments that measures 15-year-old students’ performance in reading literacy, mathematics literacy, and science literacy every 3 years. Each PISA cycle assesses one of the three subject areas in depth, including subscales and an overall scale score in the focal subject. In PISA 2009, reading literacy was the subject area assessed in depth, with results available in three reading literacy subscales. In PISA 2009, a smaller portion of the assessment was devoted to mathematics than in PISA 2003, when mathematics was the major subject area, and a smaller portion of the assessment was devoted to science than in PISA 2006, when science was the major subject area. For information about how reading literacy, mathematics literacy, and science literacy are defined in the Program for International Student Assessment (PISA), see the Definitions and Methodology section of indicator 8.
In PISA 2009, students were assessed on their reading literacy in relation to varying text types, reading processes, and situations or contexts, which were reflected in three subscales: access and retrieve, integrate and interpret, and reflect and evaluate. The access-and-retrieve subscale involves finding, selecting, and collecting information. Sometimes the information being sought is directly and plainly stated in the text; other times, more than one piece of information is required and knowledge of text structures and features may be called upon. The integrate-and-interpret
subscale involves processing what is read to make internal sense of a text. Integrating tasks require readers to understand the relation(s) between different parts of a text, such as cause-effect, category-example, and compare-contrast. Interpreting refers to the process of making meaning from something that is not stated, whereby readers identify the underlying assumptions or implications of part or all of the text. The reflect-and-evaluate subscale involves drawing on knowledge, ideas, or values external to the text. When reflecting and evaluating, readers need to connect information in a text to knowledge from outside sources. To do so, readers must be able to develop an understanding of what is said and intended in a text and then test this mental representation against what they know and believe on the basis of either prior information or information found in other texts.
In PISA 2009, scores are reported on a scale from 0 to 1,000. In reading literacy, the average score across OECD countries is 493 with a standard deviation of 93. In mathematics literacy, the average score across OECD countries is 496 with a standard deviation of 92. In science literacy, the average score across OECD countries is 501 with a standard deviation of 94.
In PISA, “15-year-olds” refers to students who are between 15 years and 3 months old and 16 years and 2 months old at the time of the assessment and who have completed at least 6 years of formal schooling.
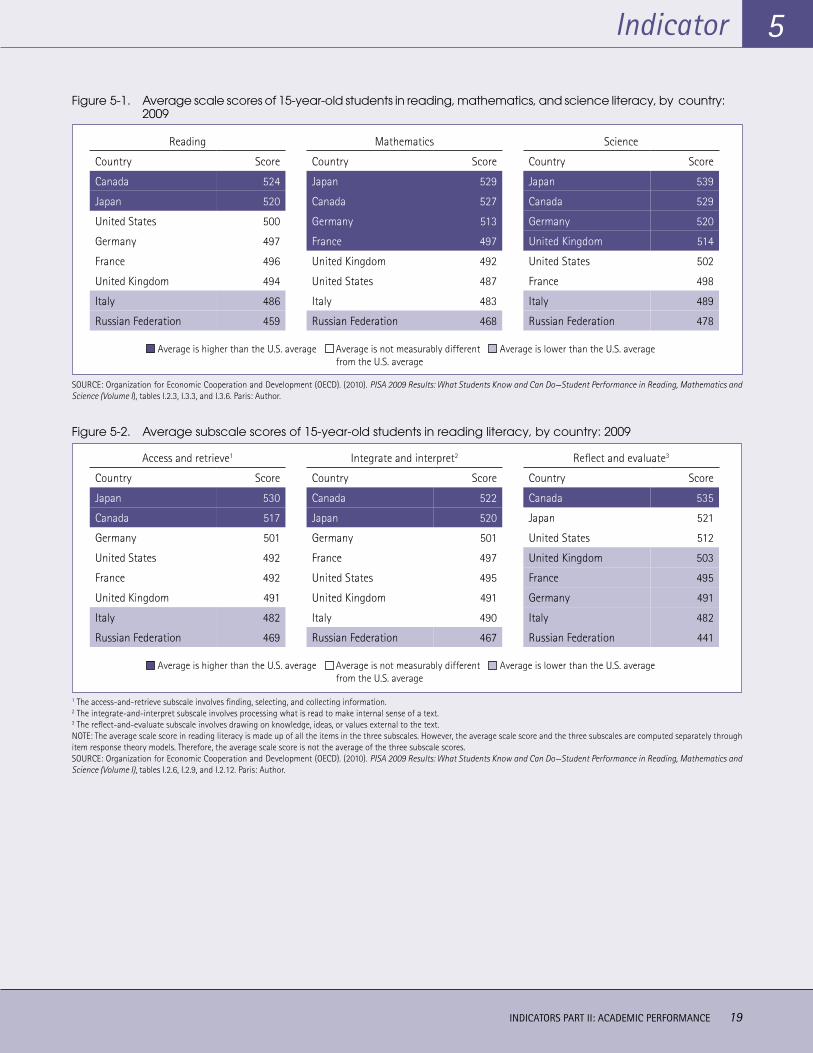
INDICATORS PART II: ACADEMIC PERFORMANCE 19
Indicator 5
Average is higher than the U.S. average Average is not measurably different Average is lower than the U.S. averagefrom the U.S. average
Average is higher than the U.S. average Average is not measurably different from the U.S. average
Average is lower than the U.S. average
Figure 5-1. Average scale scores of 15-year-old students in reading, mathematics, and science literacy, by country: 2009
Reading
Country Score
Canada 524
Japan 520
United States 500
Germany 497
France 496
United Kingdom 494
Italy 486
Russian Federation 459
Mathematics
Country Score
Japan 529
Canada 527
Germany 513
France 497
United Kingdom 492
United States 487
Italy 483
Russian Federation 468
Science
Country Score
Japan 539
Canada 529
Germany 520
United Kingdom 514
United States 502
France 498
Italy 489
Russian Federation 478
SOURCE: Organization for Economic Cooperation and Development (OECD). (2010). PISA 2009 Results: What Students Know and Can Do—Student Performance in Reading, Mathematics and Science (Volume I), tables I.2.3, I.3.3, and I.3.6. Paris: Author.
Access and retrieve1
Country Score
Japan 530
Canada 517
Germany 501
United States 492
France 492
United Kingdom 491
Italy 482
Russian Federation 469
Integrate and interpret2
Country Score
Canada 522
Japan 520
Germany 501
France 497
United States 495
United Kingdom 491
Italy 490
Russian Federation 467
Reflect and evaluate3
Country Score
Canada 535
Japan 521
United States 512
United Kingdom 503
France 495
Germany 491
Italy 482
Russian Federation 441
Figure 5-2. Average subscale scores of 15-year-old students in reading literacy, by country: 2009
1 The access-and-retrieve subscale involves finding, selecting, and collecting information.2 The integrate-and-interpret subscale involves processing what is read to make internal sense of a text.3 The reflect-and-evaluate subscale involves drawing on knowledge, ideas, or values external to the text.NOTE: The average scale score in reading literacy is made up of all the items in the three subscales. However, the average scale score and the three subscales are computed separately through item response theory models. Therefore, the average scale score is not the average of the three subscale scores.SOURCE: Organization for Economic Cooperation and Development (OECD). (2010). PISA 2009 Results: What Students Know and Can Do—Student Performance in Reading, Mathematics and Science (Volume I), tables I.2.6, I.2.9, and I.2.12. Paris: Author.
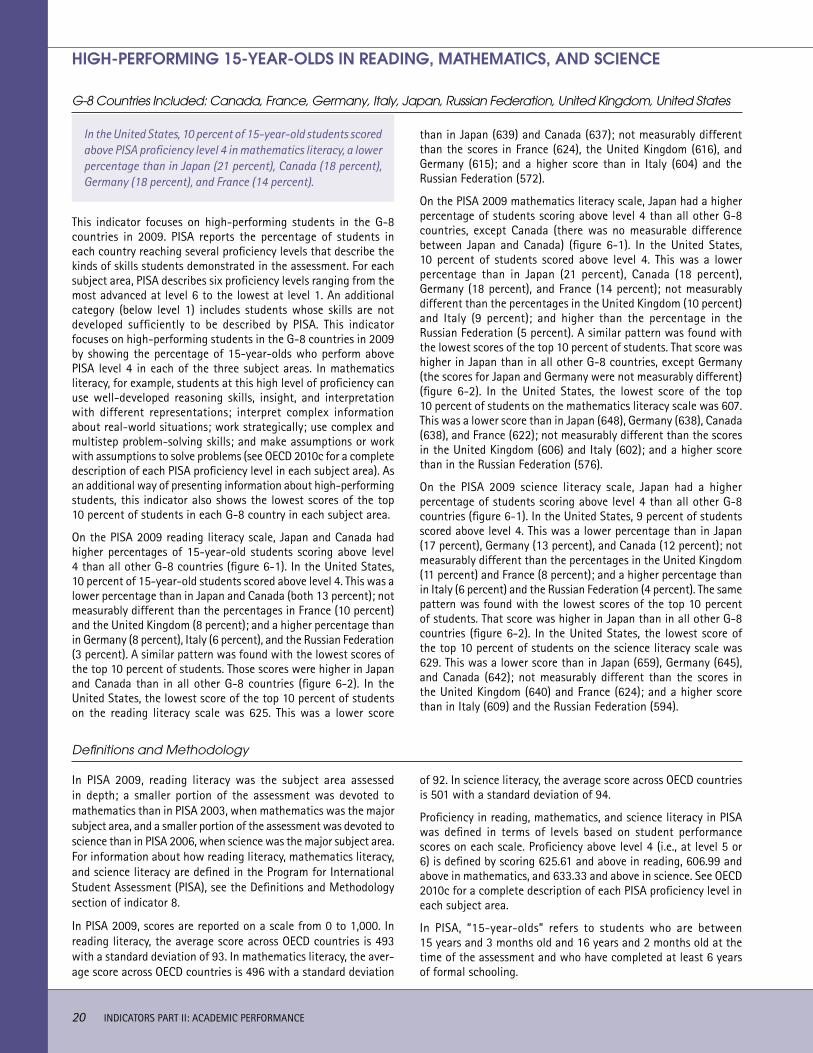
20 INDICATORS PART II: ACADEMIC PERFORMANCE
In the United States, 10 percent of 15-year-old students scored above PISA proficiency level 4 in mathematics literacy, a lower percentage than in Japan (21 percent), Canada (18 percent), Germany (18 percent), and France (14 percent).
G-8 Countries Included: Canada, France, Germany, Italy, Japan, Russian Federation, United Kingdom, United States
HIGH-PERFORMING 15-YEAR-OLDS IN READING, MATHEMATICS, AND SCIENCE
This indicator focuses on high-performing students in the G-8 countries in 2009. PISA reports the percentage of students in each country reaching several proficiency levels that describe the kinds of skills students demonstrated in the assessment. For each subject area, PISA describes six proficiency levels ranging from the most advanced at level 6 to the lowest at level 1. An additional category (below level 1) includes students whose skills are not developed sufficiently to be described by PISA. This indicator focuses on high-performing students in the G-8 countries in 2009 by showing the percentage of 15-year-olds who perform above PISA level 4 in each of the three subject areas. In mathematics literacy, for example, students at this high level of proficiency can use well-developed reasoning skills, insight, and interpretation with different representations; interpret complex information about real-world situations; work strategically; use complex and multistep problem-solving skills; and make assumptions or work with assumptions to solve problems (see OECD 2010c for a complete description of each PISA proficiency level in each subject area). As an additional way of presenting information about high-performing students, this indicator also shows the lowest scores of the top 10 percent of students in each G-8 country in each subject area.
On the PISA 2009 reading literacy scale, Japan and Canada had higher percentages of 15-year-old students scoring above level 4 than all other G-8 countries (figure 6-1). In the United States, 10 percent of 15-year-old students scored above level 4. This was a lower percentage than in Japan and Canada (both 13 percent); not measurably different than the percentages in France (10 percent) and the United Kingdom (8 percent); and a higher percentage than in Germany (8 percent), Italy (6 percent), and the Russian Federation (3 percent). A similar pattern was found with the lowest scores of the top 10 percent of students. Those scores were higher in Japan and Canada than in all other G-8 countries (figure 6-2). In the United States, the lowest score of the top 10 percent of students on the reading literacy scale was 625. This was a lower score
than in Japan (639) and Canada (637); not measurably different than the scores in France (624), the United Kingdom (616), and Germany (615); and a higher score than in Italy (604) and the Russian Federation (572).
On the PISA 2009 mathematics literacy scale, Japan had a higher percentage of students scoring above level 4 than all other G-8 countries, except Canada (there was no measurable difference between Japan and Canada) (figure 6-1). In the United States, 10 percent of students scored above level 4. This was a lower percentage than in Japan (21 percent), Canada (18 percent), Germany (18 percent), and France (14 percent); not measurably different than the percentages in the United Kingdom (10 percent) and Italy (9 percent); and higher than the percentage in the Russian Federation (5 percent). A similar pattern was found with the lowest scores of the top 10 percent of students. That score was higher in Japan than in all other G-8 countries, except Germany (the scores for Japan and Germany were not measurably different) (figure 6-2). In the United States, the lowest score of the top 10 percent of students on the mathematics literacy scale was 607. This was a lower score than in Japan (648), Germany (638), Canada (638), and France (622); not measurably different than the scores in the United Kingdom (606) and Italy (602); and a higher score than in the Russian Federation (576).
On the PISA 2009 science literacy scale, Japan had a higher percentage of students scoring above level 4 than all other G-8 countries (figure 6-1). In the United States, 9 percent of students scored above level 4. This was a lower percentage than in Japan (17 percent), Germany (13 percent), and Canada (12 percent); not measurably different than the percentages in the United Kingdom (11 percent) and France (8 percent); and a higher percentage than in Italy (6 percent) and the Russian Federation (4 percent). The same pattern was found with the lowest scores of the top 10 percent of students. That score was higher in Japan than in all other G-8 countries (figure 6-2). In the United States, the lowest score of the top 10 percent of students on the science literacy scale was 629. This was a lower score than in Japan (659), Germany (645), and Canada (642); not measurably different than the scores in the United Kingdom (640) and France (624); and a higher score than in Italy (609) and the Russian Federation (594).
Definitions and Methodology
In PISA 2009, reading literacy was the subject area assessed in depth; a smaller portion of the assessment was devoted to mathematics than in PISA 2003, when mathematics was the major subject area, and a smaller portion of the assessment was devoted to science than in PISA 2006, when science was the major subject area. For information about how reading literacy, mathematics literacy, and science literacy are defined in the Program for International Student Assessment (PISA), see the Definitions and Methodology section of indicator 8.
In PISA 2009, scores are reported on a scale from 0 to 1,000. In reading literacy, the average score across OECD countries is 493 with a standard deviation of 93. In mathematics literacy, the aver-age score across OECD countries is 496 with a standard deviation
of 92. In science literacy, the average score across OECD countries is 501 with a standard deviation of 94.
Proficiency in reading, mathematics, and science literacy in PISA was defined in terms of levels based on student performance scores on each scale. Proficiency above level 4 (i.e., at level 5 or 6) is defined by scoring 625.61 and above in reading, 606.99 and above in mathematics, and 633.33 and above in science. See OECD 2010c for a complete description of each PISA proficiency level in each subject area.
In PISA, “15-year-olds” refers to students who are between 15 years and 3 months old and 16 years and 2 months old at the time of the assessment and who have completed at least 6 years of formal schooling.
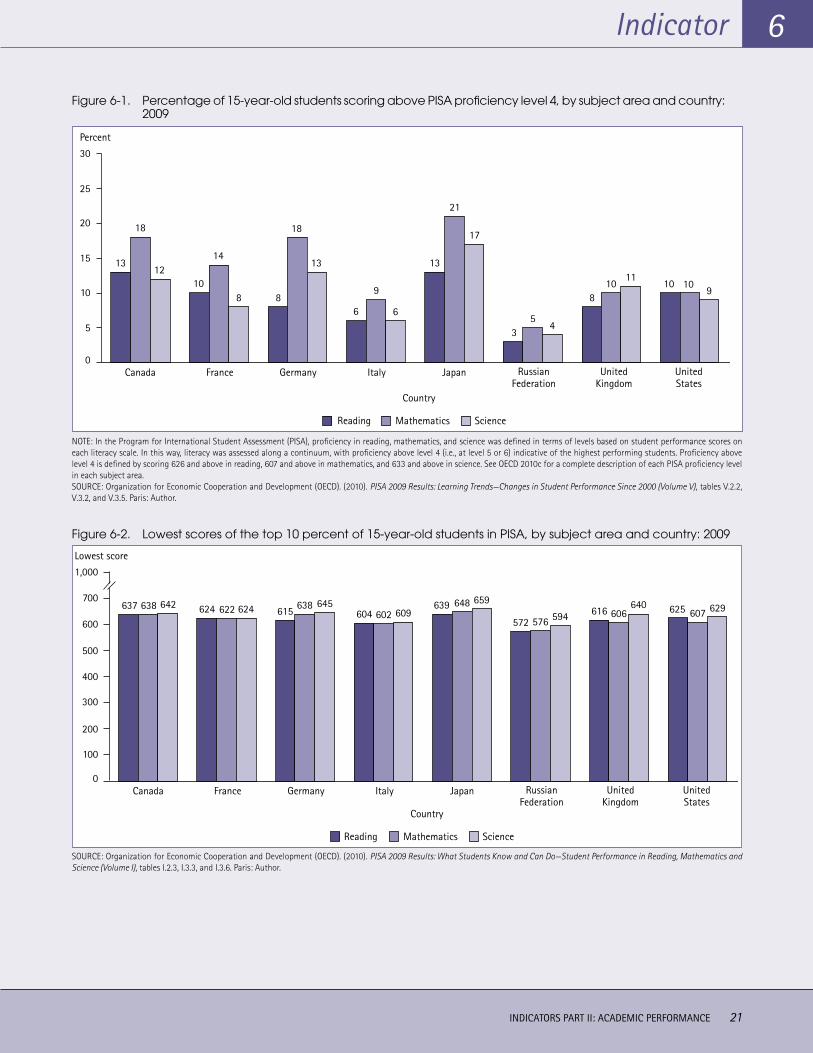
INDICATORS PART II: ACADEMIC PERFORMANCE 21
Indicator 6
Figure 6-1. Percentage of 15-year-old students scoring above PISA proficiency level 4, by subject area and country: 2009
13
18
1210
14
8 8
18
13
6
9
6
13
21
17
35
4
810
1110 10
9
0
5
15
10
20
25
30
Percent
Canada France Germany Italy Japan RussianFederation
UnitedKingdom
UnitedStates
Country
Mathematics ScienceReading
NOTE: In the Program for International Student Assessment (PISA), proficiency in reading, mathematics, and science was defined in terms of levels based on student performance scores on each literacy scale. In this way, literacy was assessed along a continuum, with proficiency above level 4 (i.e., at level 5 or 6) indicative of the highest performing students. Proficiency above level 4 is defined by scoring 626 and above in reading, 607 and above in mathematics, and 633 and above in science. See OECD 2010c for a complete description of each PISA proficiency level in each subject area.SOURCE: Organization for Economic Cooperation and Development (OECD). (2010). PISA 2009 Results: Learning Trends—Changes in Student Performance Since 2000 (Volume V), tables V.2.2, V.3.2, and V.3.5. Paris: Author.
Figure 6-2. Lowest scores of the top 10 percent of 15-year-old students in PISA, by subject area and country: 2009
637 638 642 624 622 624 615 638 645604 602 609
639 648 659
572 576 594 616 606640 625 607 629
0
100
200
400
300
500
600
700
1,000
Lowest score
Canada France Germany Italy Japan RussianFederation
UnitedKingdom
UnitedStates
Country
Mathematics ScienceReading
SOURCE: Organization for Economic Cooperation and Development (OECD). (2010). PISA 2009 Results: What Students Know and Can Do—Student Performance in Reading, Mathematics and Science (Volume I), tables I.2.3, I.3.3, and I.3.6. Paris: Author.
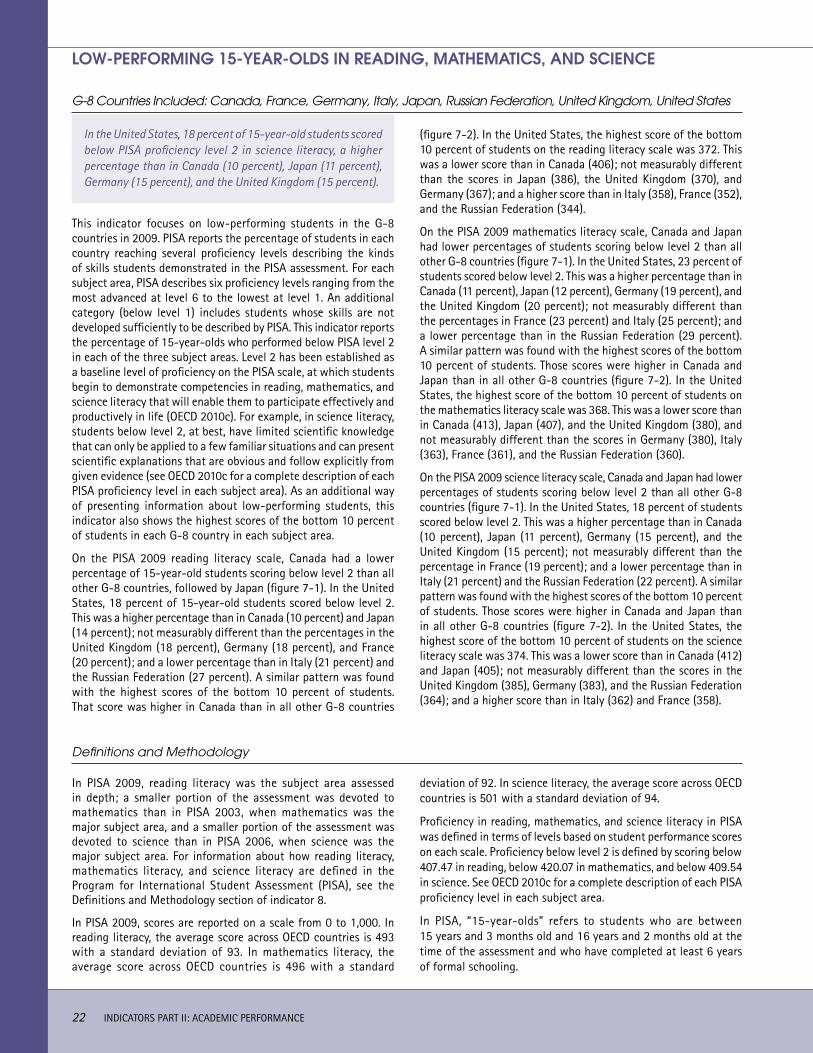
22 INDICATORS PART II: ACADEMIC PERFORMANCE
In the United States, 18 percent of 15-year-old students scored below PISA proficiency level 2 in science literacy, a higher percentage than in Canada (10 percent), Japan (11 percent), Germany (15 percent), and the United Kingdom (15 percent).
G-8 Countries Included: Canada, France, Germany, Italy, Japan, Russian Federation, United Kingdom, United States
LOW-PERFORMING 15-YEAR-OLDS IN READING, MATHEMATICS, AND SCIENCE
This indicator focuses on low-performing students in the G-8 countries in 2009. PISA reports the percentage of students in each country reaching several proficiency levels describing the kinds of skills students demonstrated in the PISA assessment. For each subject area, PISA describes six proficiency levels ranging from the most advanced at level 6 to the lowest at level 1. An additional category (below level 1) includes students whose skills are not developed sufficiently to be described by PISA. This indicator reports the percentage of 15-year-olds who performed below PISA level 2 in each of the three subject areas. Level 2 has been established as a baseline level of proficiency on the PISA scale, at which students begin to demonstrate competencies in reading, mathematics, and science literacy that will enable them to participate effectively and productively in life (OECD 2010c). For example, in science literacy, students below level 2, at best, have limited scientific knowledge that can only be applied to a few familiar situations and can present scientific explanations that are obvious and follow explicitly from given evidence (see OECD 2010c for a complete description of each PISA proficiency level in each subject area). As an additional way of presenting information about low-performing students, this indicator also shows the highest scores of the bottom 10 percent of students in each G-8 country in each subject area.
On the PISA 2009 reading literacy scale, Canada had a lower percentage of 15-year-old students scoring below level 2 than all other G-8 countries, followed by Japan (figure 7-1). In the United States, 18 percent of 15-year-old students scored below level 2. This was a higher percentage than in Canada (10 percent) and Japan (14 percent); not measurably different than the percentages in the United Kingdom (18 percent), Germany (18 percent), and France (20 percent); and a lower percentage than in Italy (21 percent) and the Russian Federation (27 percent). A similar pattern was found with the highest scores of the bottom 10 percent of students. That score was higher in Canada than in all other G-8 countries
(figure 7-2). In the United States, the highest score of the bottom 10 percent of students on the reading literacy scale was 372. This was a lower score than in Canada (406); not measurably different than the scores in Japan (386), the United Kingdom (370), and Germany (367); and a higher score than in Italy (358), France (352), and the Russian Federation (344).
On the PISA 2009 mathematics literacy scale, Canada and Japan had lower percentages of students scoring below level 2 than all other G-8 countries (figure 7-1). In the United States, 23 percent of students scored below level 2. This was a higher percentage than in Canada (11 percent), Japan (12 percent), Germany (19 percent), and the United Kingdom (20 percent); not measurably different than the percentages in France (23 percent) and Italy (25 percent); and a lower percentage than in the Russian Federation (29 percent). A similar pattern was found with the highest scores of the bottom 10 percent of students. Those scores were higher in Canada and Japan than in all other G-8 countries (figure 7-2). In the United States, the highest score of the bottom 10 percent of students on the mathematics literacy scale was 368. This was a lower score than in Canada (413), Japan (407), and the United Kingdom (380), and not measurably different than the scores in Germany (380), Italy (363), France (361), and the Russian Federation (360).
On the PISA 2009 science literacy scale, Canada and Japan had lower percentages of students scoring below level 2 than all other G-8 countries (figure 7-1). In the United States, 18 percent of students scored below level 2. This was a higher percentage than in Canada (10 percent), Japan (11 percent), Germany (15 percent), and the United Kingdom (15 percent); not measurably different than the percentage in France (19 percent); and a lower percentage than in Italy (21 percent) and the Russian Federation (22 percent). A similar pattern was found with the highest scores of the bottom 10 percent of students. Those scores were higher in Canada and Japan than in all other G-8 countries (figure 7-2). In the United States, the highest score of the bottom 10 percent of students on the science literacy scale was 374. This was a lower score than in Canada (412) and Japan (405); not measurably different than the scores in the United Kingdom (385), Germany (383), and the Russian Federation (364); and a higher score than in Italy (362) and France (358).
Definitions and Methodology
In PISA 2009, reading literacy was the subject area assessed in depth; a smaller portion of the assessment was devoted to mathematics than in PISA 2003, when mathematics was the major subject area, and a smaller portion of the assessment was devoted to science than in PISA 2006, when science was the major subject area. For information about how reading literacy, mathematics literacy, and science literacy are defined in the Program for International Student Assessment (PISA), see the Definitions and Methodology section of indicator 8.
In PISA 2009, scores are reported on a scale from 0 to 1,000. In reading literacy, the average score across OECD countries is 493 with a standard deviation of 93. In mathematics literacy, the average score across OECD countries is 496 with a standard
deviation of 92. In science literacy, the average score across OECD countries is 501 with a standard deviation of 94.
Proficiency in reading, mathematics, and science literacy in PISA was defined in terms of levels based on student performance scores on each scale. Proficiency below level 2 is defined by scoring below 407.47 in reading, below 420.07 in mathematics, and below 409.54 in science. See OECD 2010c for a complete description of each PISA proficiency level in each subject area.
In PISA, “15-year-olds” refers to students who are between 15 years and 3 months old and 16 years and 2 months old at the time of the assessment and who have completed at least 6 years of formal schooling.
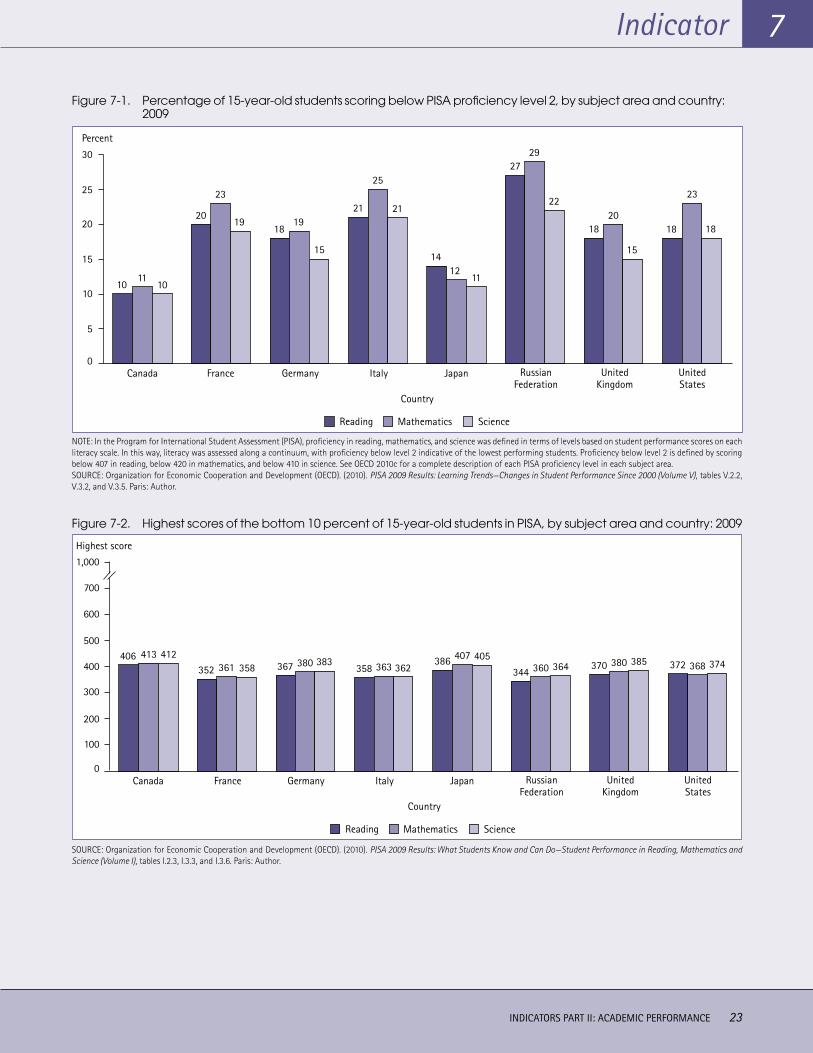
INDICATORS PART II: ACADEMIC PERFORMANCE 23
Indicator 7
Figure 7-1. Percentage of 15-year-old students scoring below PISA proficiency level 2, by subject area and country: 2009
1011
10
20
23
1918
19
15
21
25
21
1412
11
2729
22
1820
15
18
23
18
0
5
15
10
20
25
30
Percent
Canada France Germany Italy Japan RussianFederation
UnitedKingdom
UnitedStates
Country
Mathematics ScienceReading
NOTE: In the Program for International Student Assessment (PISA), proficiency in reading, mathematics, and science was defined in terms of levels based on student performance scores on each literacy scale. In this way, literacy was assessed along a continuum, with proficiency below level 2 indicative of the lowest performing students. Proficiency below level 2 is defined by scoring below 407 in reading, below 420 in mathematics, and below 410 in science. See OECD 2010c for a complete description of each PISA proficiency level in each subject area.SOURCE: Organization for Economic Cooperation and Development (OECD). (2010). PISA 2009 Results: Learning Trends—Changes in Student Performance Since 2000 (Volume V), tables V.2.2, V.3.2, and V.3.5. Paris: Author.
Figure 7-2. Highest scores of the bottom 10 percent of 15-year-old students in PISA, by subject area and country: 2009
406 413 412
352 361 358 367 380 383358 363 362
386 407 405
344 360 364 370 380 385 372 368 374
0
100
200
400
300
500
600
700
1,000
Highest score
Canada France Germany Italy Japan RussianFederation
UnitedKingdom
UnitedStates
Country
Mathematics ScienceReading
SOURCE: Organization for Economic Cooperation and Development (OECD). (2010). PISA 2009 Results: What Students Know and Can Do—Student Performance in Reading, Mathematics and Science (Volume I), tables I.2.3, I.3.3, and I.3.6. Paris: Author.
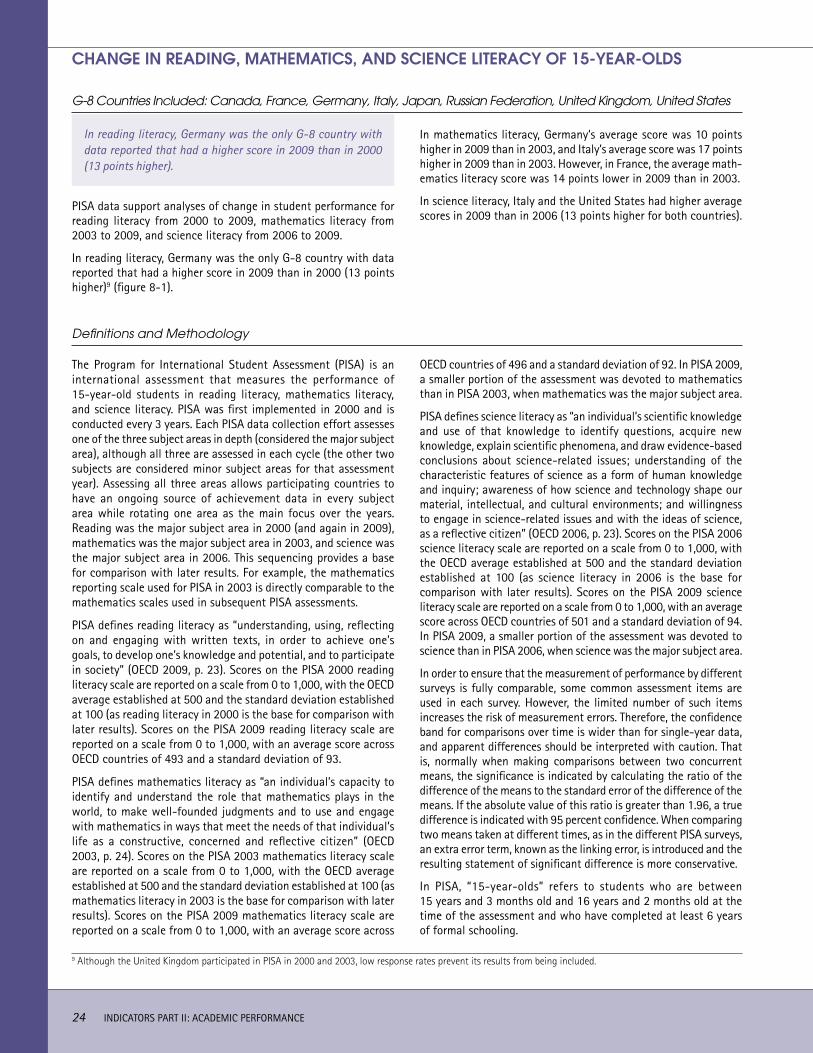
24 INDICATORS PART II: ACADEMIC PERFORMANCE
CHANGE IN READING, MATHEMATICS, AND SCIENCE LITERACY OF 15-YEAR-OLDS
G-8 Countries Included: Canada, France, Germany, Italy, Japan, Russian Federation, United Kingdom, United States
In reading literacy, Germany was the only G-8 country with data reported that had a higher score in 2009 than in 2000 (13 points higher).
PISA data support analyses of change in student performance for reading literacy from 2000 to 2009, mathematics literacy from 2003 to 2009, and science literacy from 2006 to 2009.
In reading literacy, Germany was the only G-8 country with data reported that had a higher score in 2009 than in 2000 (13 points higher)9 (figure 8-1).
In mathematics literacy, Germany’s average score was 10 points higher in 2009 than in 2003, and Italy’s average score was 17 points higher in 2009 than in 2003. However, in France, the average math-ematics literacy score was 14 points lower in 2009 than in 2003.
In science literacy, Italy and the United States had higher average scores in 2009 than in 2006 (13 points higher for both countries).
Definitions and Methodology
The Program for International Student Assessment (PISA) is an international assessment that measures the performance of 15-year-old students in reading literacy, mathematics literacy, and science literacy. PISA was first implemented in 2000 and is conducted every 3 years. Each PISA data collection effort assesses one of the three subject areas in depth (considered the major subject area), although all three are assessed in each cycle (the other two subjects are considered minor subject areas for that assessment year). Assessing all three areas allows participating countries to have an ongoing source of achievement data in every subject area while rotating one area as the main focus over the years. Reading was the major subject area in 2000 (and again in 2009), mathematics was the major subject area in 2003, and science was the major subject area in 2006. This sequencing provides a base for comparison with later results. For example, the mathematics reporting scale used for PISA in 2003 is directly comparable to the mathematics scales used in subsequent PISA assessments.
PISA defines reading literacy as “understanding, using, reflecting on and engaging with written texts, in order to achieve one’s goals, to develop one’s knowledge and potential, and to participate in society” (OECD 2009, p. 23). Scores on the PISA 2000 reading literacy scale are reported on a scale from 0 to 1,000, with the OECD average established at 500 and the standard deviation established at 100 (as reading literacy in 2000 is the base for comparison with later results). Scores on the PISA 2009 reading literacy scale are reported on a scale from 0 to 1,000, with an average score across OECD countries of 493 and a standard deviation of 93.
PISA defines mathematics literacy as “an individual’s capacity to identify and understand the role that mathematics plays in the world, to make well-founded judgments and to use and engage with mathematics in ways that meet the needs of that individual’s life as a constructive, concerned and reflective citizen” (OECD 2003, p. 24). Scores on the PISA 2003 mathematics literacy scale are reported on a scale from 0 to 1,000, with the OECD average established at 500 and the standard deviation established at 100 (as mathematics literacy in 2003 is the base for comparison with later results). Scores on the PISA 2009 mathematics literacy scale are reported on a scale from 0 to 1,000, with an average score across
OECD countries of 496 and a standard deviation of 92. In PISA 2009, a smaller portion of the assessment was devoted to mathematics than in PISA 2003, when mathematics was the major subject area.
PISA defines science literacy as “an individual’s scientific knowledge and use of that knowledge to identify questions, acquire new knowledge, explain scientific phenomena, and draw evidence-based conclusions about science-related issues; understanding of the characteristic features of science as a form of human knowledge and inquiry; awareness of how science and technology shape our material, intellectual, and cultural environments; and willingness to engage in science-related issues and with the ideas of science, as a reflective citizen” (OECD 2006, p. 23). Scores on the PISA 2006 science literacy scale are reported on a scale from 0 to 1,000, with the OECD average established at 500 and the standard deviation established at 100 (as science literacy in 2006 is the base for comparison with later results). Scores on the PISA 2009 science literacy scale are reported on a scale from 0 to 1,000, with an average score across OECD countries of 501 and a standard deviation of 94. In PISA 2009, a smaller portion of the assessment was devoted to science than in PISA 2006, when science was the major subject area.
In order to ensure that the measurement of performance by different surveys is fully comparable, some common assessment items are used in each survey. However, the limited number of such items increases the risk of measurement errors. Therefore, the confidence band for comparisons over time is wider than for single-year data, and apparent differences should be interpreted with caution. That is, normally when making comparisons between two concurrent means, the significance is indicated by calculating the ratio of the difference of the means to the standard error of the difference of the means. If the absolute value of this ratio is greater than 1.96, a true difference is indicated with 95 percent confidence. When comparing two means taken at different times, as in the different PISA surveys, an extra error term, known as the linking error, is introduced and the resulting statement of significant difference is more conservative.
In PISA, “15-year-olds” refers to students who are between 15 years and 3 months old and 16 years and 2 months old at the time of the assessment and who have completed at least 6 years of formal schooling.
9 Although the United Kingdom participated in PISA in 2000 and 2003, low response rates prevent its results from being included.
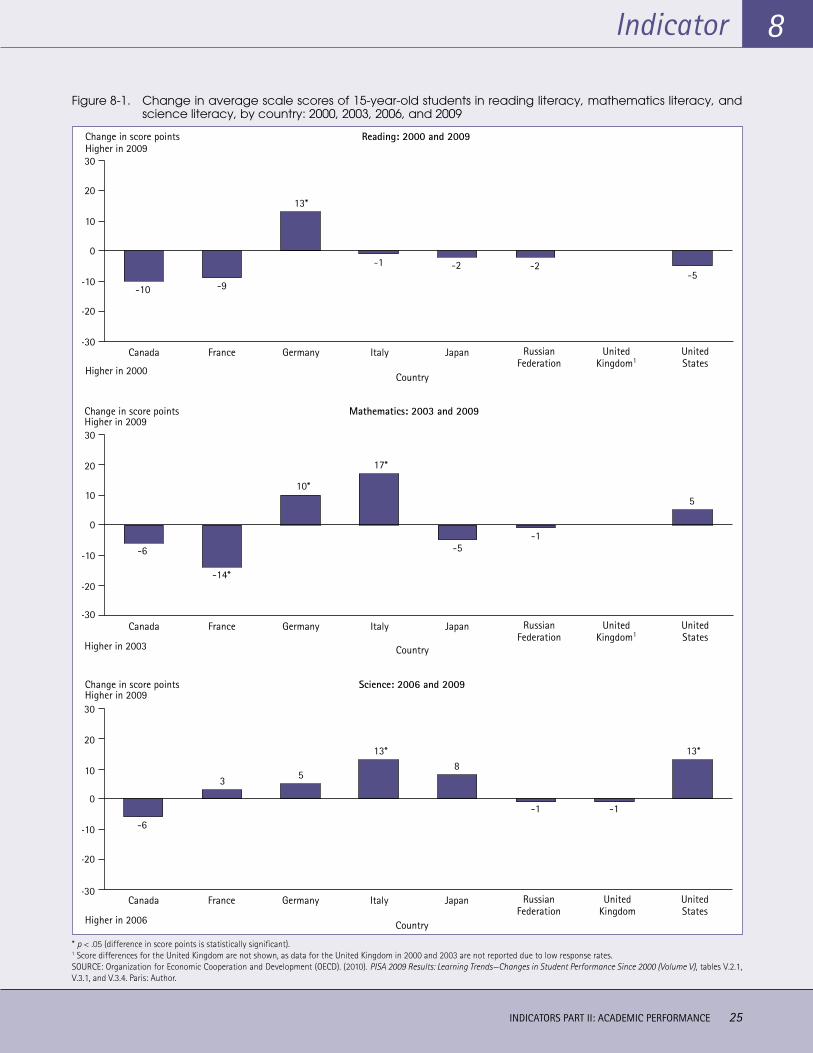
INDICATORS PART II: ACADEMIC PERFORMANCE 25
Indicator 8
Figure 8-1. Change in average scale scores of 15-year-old students in reading literacy, mathematics literacy, and science literacy, by country: 2000, 2003, 2006, and 2009
-30
-20
-10
0
10
20
30
-10 -9
13*
-1 -2 -2-5
Higher in 2009
Higher in 2000
Change in score points Reading: 2000 and 2009
Canada France
Country
Germany Italy Japan RussianFederation
UnitedKingdom1
UnitedStates
Mathematics: 2003 and 2009
-6
-14*
10*
17*
-5-1
5
-30
-20
-10
0
10
20
30
Canada France
Country
Germany Italy Japan RussianFederation
UnitedKingdom1
UnitedStates
Higher in 2009
Higher in 2003
Change in score points
-6
3 5
13*8
-1 -1
13*
-30
-20
-10
0
10
20
30Higher in 2009
Higher in 2006
Change in score points
Canada France
Country
Germany Italy Japan RussianFederation
UnitedKingdom
UnitedStates
Science: 2006 and 2009
* p < .05 (difference in score points is statistically significant).1 Score differences for the United Kingdom are not shown, as data for the United Kingdom in 2000 and 2003 are not reported due to low response rates.SOURCE: Organization for Economic Cooperation and Development (OECD). (2010). PISA 2009 Results: Learning Trends—Changes in Student Performance Since 2000 (Volume V), tables V.2.1, V.3.1, and V.3.4. Paris: Author.
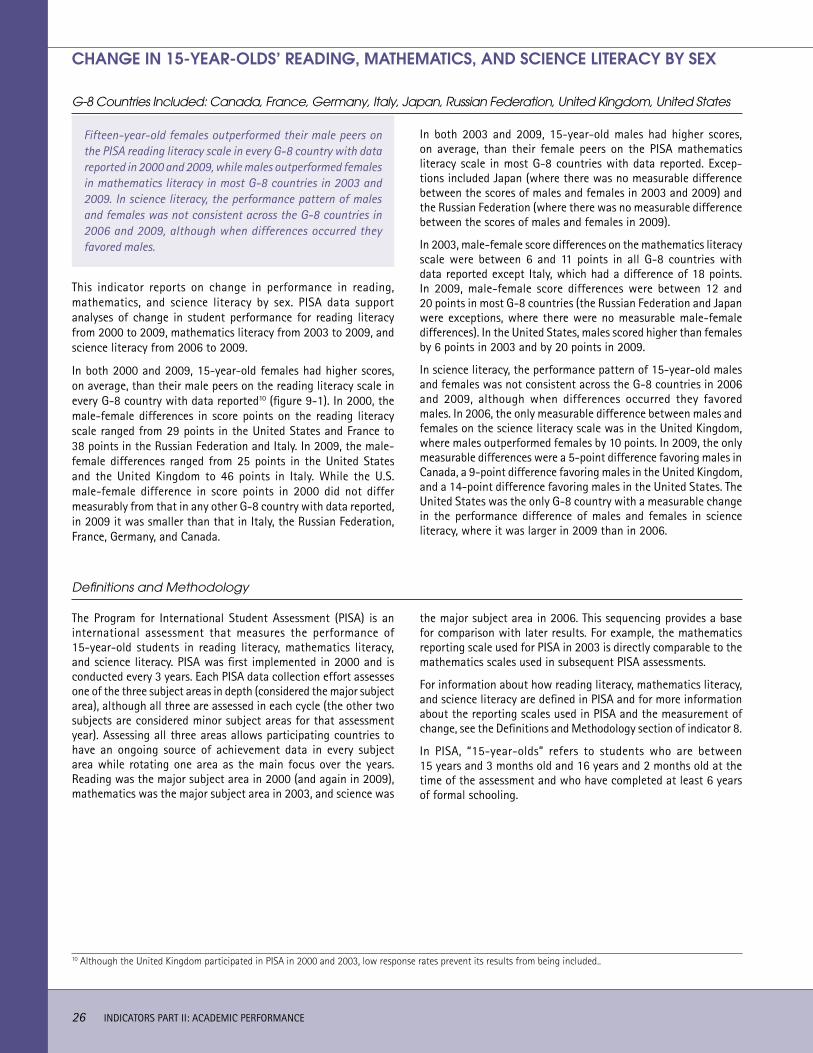
26 INDICATORS PART II: ACADEMIC PERFORMANCE
Fifteen-year-old females outperformed their male peers on the PISA reading literacy scale in every G-8 country with data reported in 2000 and 2009, while males outperformed females in mathematics literacy in most G-8 countries in 2003 and 2009. In science literacy, the performance pattern of males and females was not consistent across the G-8 countries in 2006 and 2009, although when differences occurred they favored males.
G-8 Countries Included: Canada, France, Germany, Italy, Japan, Russian Federation, United Kingdom, United States
CHANGE IN 15-YEAR-OLDS’ READING, MATHEMATICS, AND SCIENCE LITERACY BY SEX
This indicator reports on change in performance in reading, mathematics, and science literacy by sex. PISA data support analyses of change in student performance for reading literacy from 2000 to 2009, mathematics literacy from 2003 to 2009, and science literacy from 2006 to 2009.
In both 2000 and 2009, 15-year-old females had higher scores, on average, than their male peers on the reading literacy scale in every G-8 country with data reported10 (figure 9-1). In 2000, the male-female differences in score points on the reading literacy scale ranged from 29 points in the United States and France to 38 points in the Russian Federation and Italy. In 2009, the male-female differences ranged from 25 points in the United States and the United Kingdom to 46 points in Italy. While the U.S. male-female difference in score points in 2000 did not differ measurably from that in any other G-8 country with data reported, in 2009 it was smaller than that in Italy, the Russian Federation, France, Germany, and Canada.
In both 2003 and 2009, 15-year-old males had higher scores, on average, than their female peers on the PISA mathematics literacy scale in most G-8 countries with data reported. Excep-tions included Japan (where there was no measurable difference between the scores of males and females in 2003 and 2009) and the Russian Federation (where there was no measurable difference between the scores of males and females in 2009).
In 2003, male-female score differences on the mathematics literacy scale were between 6 and 11 points in all G-8 countries with data reported except Italy, which had a difference of 18 points. In 2009, male-female score differences were between 12 and 20 points in most G-8 countries (the Russian Federation and Japan were exceptions, where there were no measurable male-female differences). In the United States, males scored higher than females by 6 points in 2003 and by 20 points in 2009.
In science literacy, the performance pattern of 15-year-old males and females was not consistent across the G-8 countries in 2006 and 2009, although when differences occurred they favored males. In 2006, the only measurable difference between males and females on the science literacy scale was in the United Kingdom, where males outperformed females by 10 points. In 2009, the only measurable differences were a 5-point difference favoring males in Canada, a 9-point difference favoring males in the United Kingdom, and a 14-point difference favoring males in the United States. The United States was the only G-8 country with a measurable change in the performance difference of males and females in science literacy, where it was larger in 2009 than in 2006.
Definitions and Methodology
The Program for International Student Assessment (PISA) is an international assessment that measures the performance of 15-year-old students in reading literacy, mathematics literacy, and science literacy. PISA was first implemented in 2000 and is conducted every 3 years. Each PISA data collection effort assesses one of the three subject areas in depth (considered the major subject area), although all three are assessed in each cycle (the other two subjects are considered minor subject areas for that assessment year). Assessing all three areas allows participating countries to have an ongoing source of achievement data in every subject area while rotating one area as the main focus over the years. Reading was the major subject area in 2000 (and again in 2009), mathematics was the major subject area in 2003, and science was
the major subject area in 2006. This sequencing provides a base for comparison with later results. For example, the mathematics reporting scale used for PISA in 2003 is directly comparable to the mathematics scales used in subsequent PISA assessments.
For information about how reading literacy, mathematics literacy, and science literacy are defined in PISA and for more information about the reporting scales used in PISA and the measurement of change, see the Definitions and Methodology section of indicator 8.
In PISA, “15-year-olds” refers to students who are between 15 years and 3 months old and 16 years and 2 months old at the time of the assessment and who have completed at least 6 years of formal schooling.
10 Although the United Kingdom participated in PISA in 2000 and 2003, low response rates prevent its results from being included..
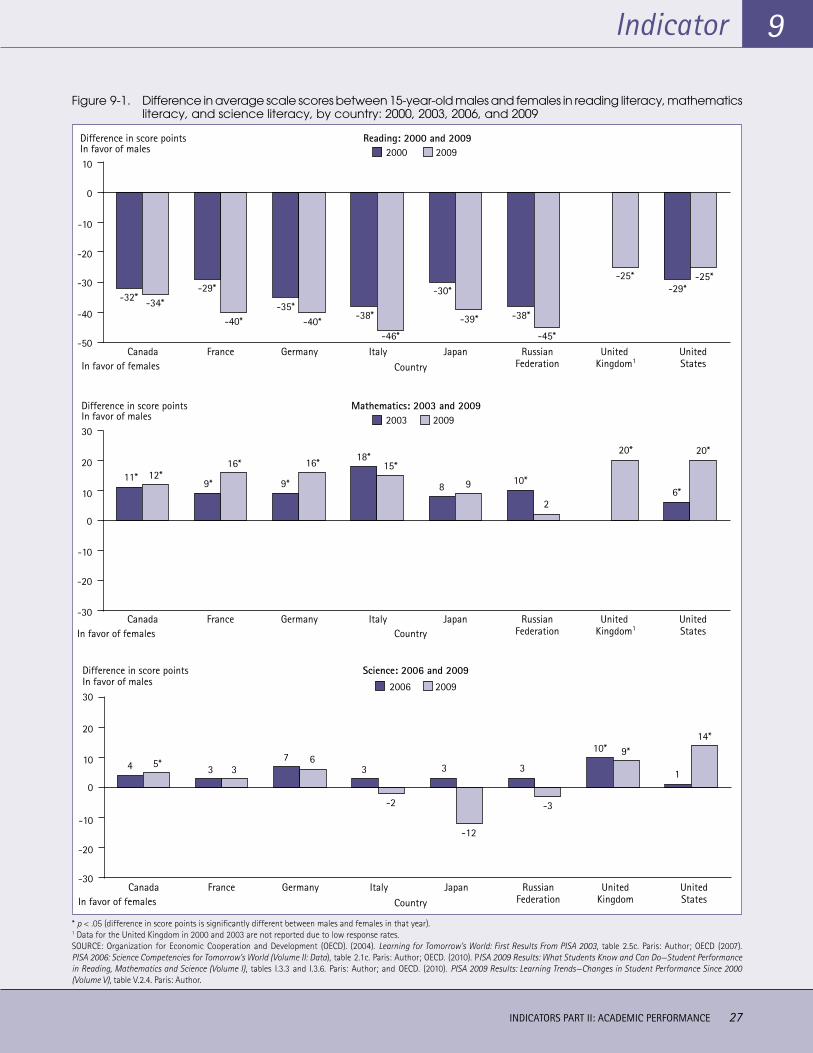
INDICATORS PART II: ACADEMIC PERFORMANCE 27
Indicator 9
Figure 9-1. Difference in average scale scores between 15-year-old males and females in reading literacy, mathematics literacy, and science literacy, by country: 2000, 2003, 2006, and 2009
4 5* 3 37 6
3
-2
3
-12
3
-3
10* 9*
1
14*
-30
-20
-10
0
10
20
30In favor of males
In favor of females
Difference in score points
Canada France
Country
Germany Italy Japan RussianFederation
UnitedKingdom
UnitedStates
-32* -34*-29*
-40*-35*
-40*-38*
-30*
-39* -38*
-45*
-25*-29*
-25*
-50
-40
-30
-20
-10
0
10
In favor of femalesCanada France
Country
Germany Italy Japan RussianFederation
United Kingdom1
UnitedStates
-46*
In favor of malesDifference in score points
20092000Reading: 2000 and 2009
11* 12*9*
16*
9*
16* 18*15*
8 9 10*
2
20*
6*
20*
-30
-20
-10
0
10
20
30
In favor of femalesCanada France
CountryGermany Italy Japan Russian
FederationUnited
Kingdom1UnitedStates
In favor of malesDifference in score points Mathematics: 2003 and 2009
20092003
Science: 2006 and 2009
20092006
* p < .05 (difference in score points is significantly different between males and females in that year).1 Data for the United Kingdom in 2000 and 2003 are not reported due to low response rates.SOURCE: Organization for Economic Cooperation and Development (OECD). (2004). Learning for Tomorrow’s World: First Results From PISA 2003, table 2.5c. Paris: Author; OECD (2007). PISA 2006: Science Competencies for Tomorrow’s World (Volume II: Data), table 2.1c. Paris: Author; OECD. (2010). PISA 2009 Results: What Students Know and Can Do—Student Performance in Reading, Mathematics and Science (Volume I), tables I.3.3 and I.3.6. Paris: Author; and OECD. (2010). PISA 2009 Results: Learning Trends—Changes in Student Performance Since 2000 (Volume V), table V.2.4. Paris: Author.
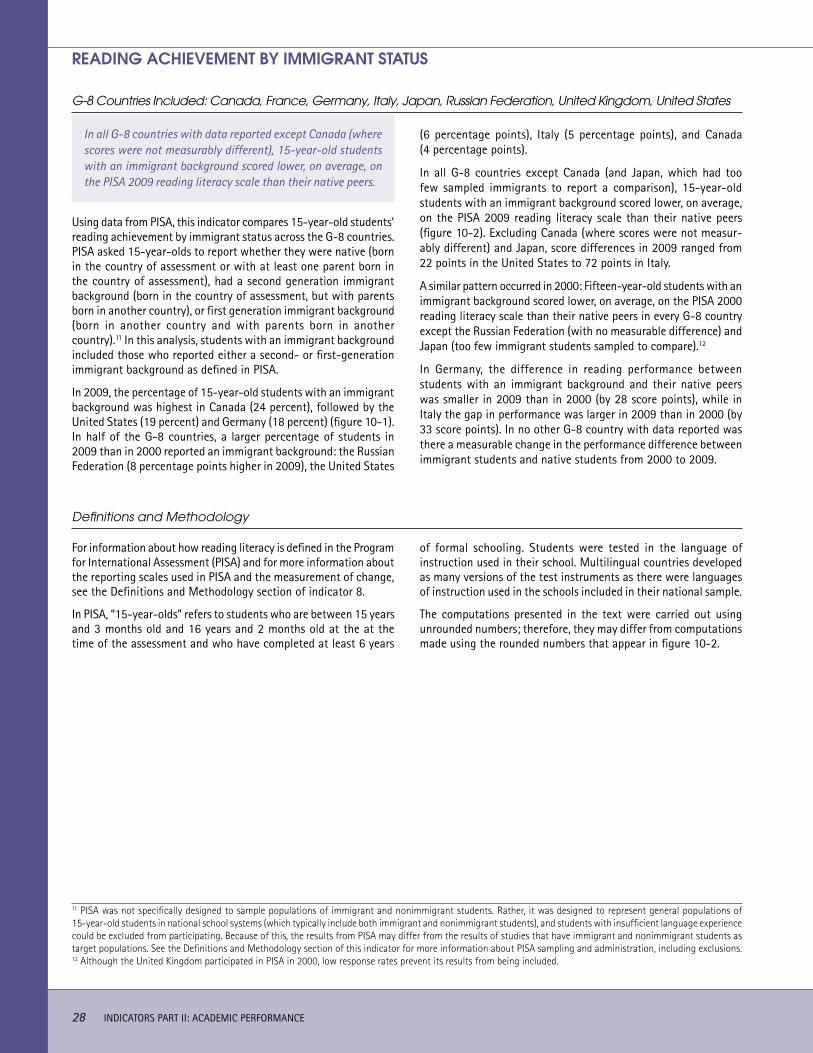
28 INDICATORS PART II: ACADEMIC PERFORMANCE
READING ACHIEVEMENT BY IMMIGRANT STATUS
G-8 Countries Included: Canada, France, Germany, Italy, Japan, Russian Federation, United Kingdom, United States
In all G-8 countries with data reported except Canada (where scores were not measurably different), 15-year-old students with an immigrant background scored lower, on average, on the PISA 2009 reading literacy scale than their native peers.
Using data from PISA, this indicator compares 15-year-old students’ reading achievement by immigrant status across the G-8 countries. PISA asked 15-year-olds to report whether they were native (born in the country of assessment or with at least one parent born in the country of assessment), had a second generation immigrant background (born in the country of assessment, but with parents born in another country), or first generation immigrant background (born in another country and with parents born in another country).11 In this analysis, students with an immigrant background included those who reported either a second- or first-generation immigrant background as defined in PISA.
In 2009, the percentage of 15-year-old students with an immigrant background was highest in Canada (24 percent), followed by the United States (19 percent) and Germany (18 percent) (figure 10-1). In half of the G-8 countries, a larger percentage of students in 2009 than in 2000 reported an immigrant background: the Russian Federation (8 percentage points higher in 2009), the United States
(6 percentage points), Italy (5 percentage points), and Canada (4 percentage points).
In all G-8 countries except Canada (and Japan, which had too few sampled immigrants to report a comparison), 15-year-old students with an immigrant background scored lower, on average, on the PISA 2009 reading literacy scale than their native peers (figure 10-2). Excluding Canada (where scores were not measur-ably different) and Japan, score differences in 2009 ranged from 22 points in the United States to 72 points in Italy.
A similar pattern occurred in 2000: Fifteen-year-old students with an immigrant background scored lower, on average, on the PISA 2000 reading literacy scale than their native peers in every G-8 country except the Russian Federation (with no measurable difference) and Japan (too few immigrant students sampled to compare).12
In Germany, the difference in reading performance between students with an immigrant background and their native peers was smaller in 2009 than in 2000 (by 28 score points), while in Italy the gap in performance was larger in 2009 than in 2000 (by 33 score points). In no other G-8 country with data reported was there a measurable change in the performance difference between immigrant students and native students from 2000 to 2009.
For information about how reading literacy is defined in the Program for International Assessment (PISA) and for more information about the reporting scales used in PISA and the measurement of change, see the Definitions and Methodology section of indicator 8.
In PISA, “15-year-olds” refers to students who are between 15 years and 3 months old and 16 years and 2 months old at the at the time of the assessment and who have completed at least 6 years
Definitions and Methodology
of formal schooling. Students were tested in the language of instruction used in their school. Multilingual countries developed as many versions of the test instruments as there were languages of instruction used in the schools included in their national sample.
The computations presented in the text were carried out using unrounded numbers; therefore, they may differ from computations made using the rounded numbers that appear in figure 10-2.
11 PISA was not specifically designed to sample populations of immigrant and nonimmigrant students. Rather, it was designed to represent general populations of 15-year-old students in national school systems (which typically include both immigrant and nonimmigrant students), and students with insufficient language experience could be excluded from participating. Because of this, the results from PISA may differ from the results of studies that have immigrant and nonimmigrant students as target populations. See the Definitions and Methodology section of this indicator for more information about PISA sampling and administration, including exclusions.12 Although the United Kingdom participated in PISA in 2000, low response rates prevent its results from being included.
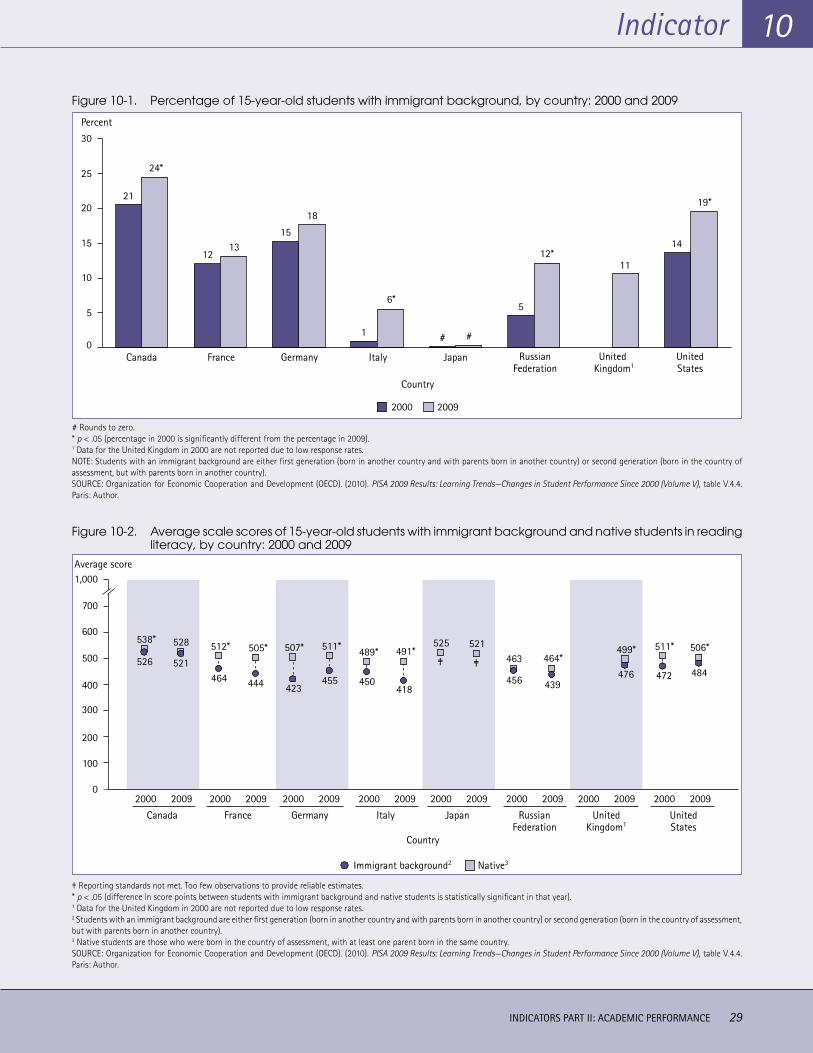
INDICATORS PART II: ACADEMIC PERFORMANCE 29
Indicator 10
Figure 10-1. Percentage of 15-year-old students with immigrant background, by country: 2000 and 2009
21
24*
1213
15
18
1
6*
# #
5
12*11
14
19*
0
5
15
10
20
25
30
Percent
Canada France Germany Italy Japan RussianFederation
United Kingdom1
UnitedStates
Country
20092000
# Rounds to zero. * p < .05 (percentage in 2000 is significantly different from the percentage in 2009).1 Data for the United Kingdom in 2000 are not reported due to low response rates.NOTE: Students with an immigrant background are either first generation (born in another country and with parents born in another country) or second generation (born in the country of assessment, but with parents born in another country).SOURCE: Organization for Economic Cooperation and Development (OECD). (2010). PISA 2009 Results: Learning Trends—Changes in Student Performance Since 2000 (Volume V), table V.4.4. Paris: Author.
Figure 10-2. Average scale scores of 15-year-old students with immigrant background and native students in reading literacy, by country: 2000 and 2009
JJ
JJ J
JJ
J J J
BB B B B
B BB B
B BB B B
100
300
200
400
600
500
700
1,000
0
Average score
538*
526
528
521
512*
464
505* 507* 511* 489*
450
491*525 521
463 464*
439456418
455423444
J‡ ‡
499*
476
511*
472
506*
484
2000 2009 2000 2009 2000 2009 2000 2009 2000 2009 2000 2009 2000 2009 2000 2009
Canada France Germany Italy Japan RussianFederation
UnitedKingdom1
UnitedStates
Country
Native3Immigrant background2J
BJ J
‡ Reporting standards not met. Too few observations to provide reliable estimates.* p < .05 (difference in score points between students with immigrant background and native students is statistically significant in that year).1 Data for the United Kingdom in 2000 are not reported due to low response rates.2 Students with an immigrant background are either first generation (born in another country and with parents born in another country) or second generation (born in the country of assessment, but with parents born in another country).3 Native students are those who were born in the country of assessment, with at least one parent born in the same country. SOURCE: Organization for Economic Cooperation and Development (OECD). (2010). PISA 2009 Results: Learning Trends—Changes in Student Performance Since 2000 (Volume V), table V.4.4. Paris: Author.

INDICATORS PART IIIINDICATORS PART IIIContext for Learning
32 INDICATORS PART III: CONTEXT FOR LEARNING
The U.S. student/teacher ratio at the primary level (14) was lower than the ratio in all but one of the G-8 countries (Italy). At the secondary level, student/teacher ratios ranged from 9 in the Russian Federation to 15 in the United States and Germany.
G-8 Countries Included: France, Germany, Italy, Japan, Russian Federation, United Kingdom, United States
CLASS SIZE AND RATIO OF STUDENTS TO TEACHING STAFF
Figure 11-1 shows average class size in primary education for seven G-8 countries reporting data. In 2008, two countries had an average class size of less than 20 students—the Russian Federation (16 students) and Italy (19 students). Four countries had an average class size between 20 and 25 students—Germany, with 22 students; France and the United States, both with 23 students; and the United Kingdom, with 25 students. Japan had the largest average class size in primary education, with 28 students.
Figure 11-2 shows the ratio of students to teaching staff for the G-8 countries, broken down by four levels of education: preprimary, primary, secondary (lower and upper secondary combined), and higher education. The ratio of students to teaching staff (called student/teacher ratio, below) accounts for teaching staff in addition to regular classroom teachers, such as special education teachers, resource teachers, or other specialized
teachers. In the United States, student/teacher ratios were fairly consistent across education levels. In other countries, such as Japan, ratios tended to be higher at the lower education levels, but lower at the higher levels. On the other hand, in Italy, lower ratios were observed at the lower education levels, with a sharp increase at the higher education level. Specifically, in 2008, the U.S. student/teacher ratio at the preprimary level was 13 students per teacher, which was higher than the corresponding ratio in Italy (11), but lower than the ratios in France (19), the United Kingdom (18), Japan (17), and Germany (14).13 At the primary level, the student/teacher ratio in the United States was 14 students per teacher, which was higher than the corresponding ratio in Italy (11), but lower than the ratios in the other G-8 countries (ranging from 17 to 20). At the secondary level, student/teacher ratios ranged from 9 students per teacher in the Russian Federation to 15 students per teacher in the United States and Germany. Finally, at the higher education level, the student/teacher ratio in the United States was 15 students per teacher, which was higher than the corresponding ratios in the Russian Federation (13), Germany (12), and Japan (10), but lower than those in Italy (20), the United Kingdom (17), and France (16).
Definitions and Methodology
Average class size refers to the division of students who are following a common course of study, based on the highest number of common courses (usually compulsory studies), and excludes teaching in subgroups outside the regular classroom setting. In order to ensure comparability among countries, the data include only regular programs at the primary level of education; special-needs programs have been excluded from the calculation.
Data on average class size are not available for the education levels of preprimary, lower and upper secondary combined, and higher education, and thus are not shown in this indicator as is done for the ratio of students to teaching staff.
The ratio of students to teaching staff is calculated by dividing the number of full-time-equivalent students at a given level of
education by the number of full-time-equivalent teachers at that level. Teaching staff refers to professional personnel directly involved in teaching students. This includes classroom teachers; special education teachers; and other teachers who work with a whole class of students in a classroom, in small groups in a resource room, or in one-to-one teaching situations inside or outside a regular classroom. Teaching staff also includes department chairpersons whose duties include some teaching, but excludes paraprofessional personnel who support teachers in providing instruction to students, such as teacher aides.
As shown in the figures, education levels are defined according to the 1997 International Standard Classification of Education (ISCED97). For more information on the ISCED97 levels, see appendix A.
13 Data on the ratio of students to teaching staff for the Russian Federation are not available at the preprimary education level.
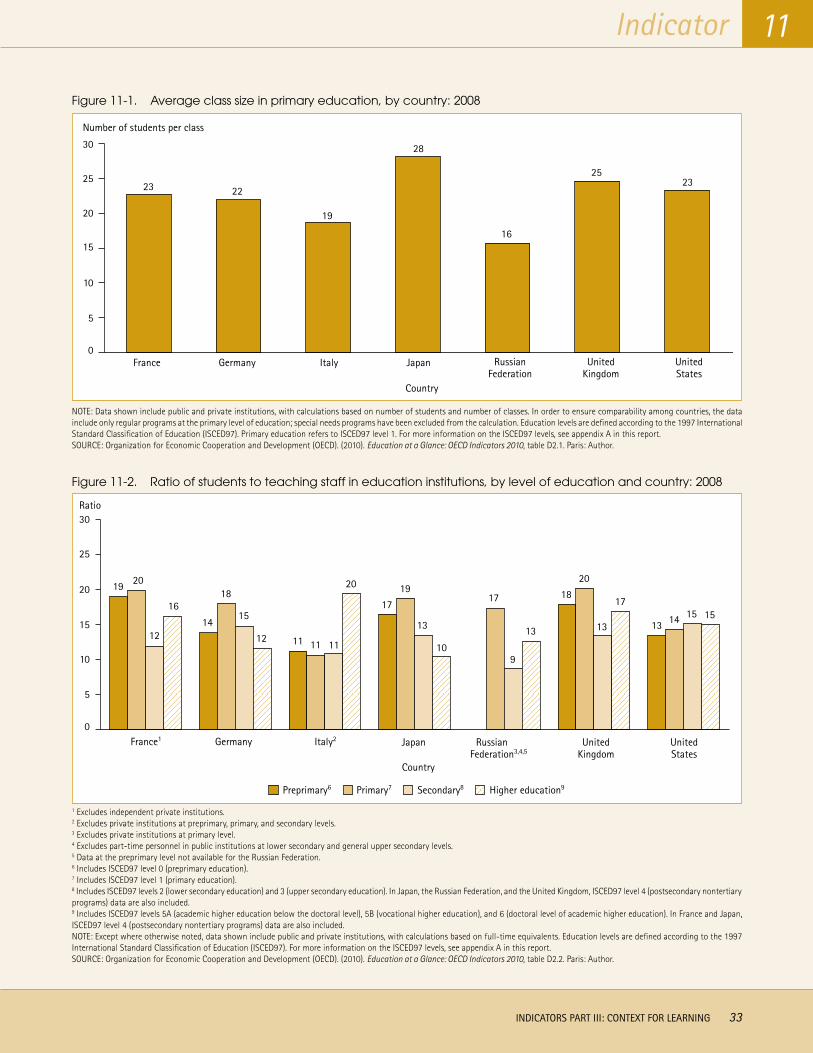
Indicator
INDICATORS PART III: CONTEXT FOR LEARNING 33
11
Figure 11-1. Average class size in primary education, by country: 2008
23 22
19
28
16
2523
France Germany Italy Japan RussianFederation
UnitedKingdom
UnitedStates
Country
0
5
15
10
20
25
30
Number of students per class
NOTE: Data shown include public and private institutions, with calculations based on number of students and number of classes. In order to ensure comparability among countries, the data include only regular programs at the primary level of education; special needs programs have been excluded from the calculation. Education levels are defined according to the 1997 International Standard Classification of Education (ISCED97). Primary education refers to ISCED97 level 1. For more information on the ISCED97 levels, see appendix A in this report. SOURCE: Organization for Economic Cooperation and Development (OECD). (2010). Education at a Glance: OECD Indicators 2010, table D2.1. Paris: Author.
Figure 11-2. Ratio of students to teaching staff in education institutions, by level of education and country: 2008
1920
12
16
14
18
15
12 11 11 11
20
17
19
13
10
17
9
13
18
20
13
17
13 14 15 15
0
5
15
10
20
25
30Ratio
France1 Germany Italy2 Japan Russian Federation3,4,5
UnitedKingdom
UnitedStates
Country
Primary7 Secondary8 Higher education9Preprimary6
1 Excludes independent private institutions.2 Excludes private institutions at preprimary, primary, and secondary levels. 3 Excludes private institutions at primary level. 4 Excludes part-time personnel in public institutions at lower secondary and general upper secondary levels. 5 Data at the preprimary level not available for the Russian Federation.6 Includes ISCED97 level 0 (preprimary education). 7 Includes ISCED97 level 1 (primary education). 8 Includes ISCED97 levels 2 (lower secondary education) and 3 (upper secondary education). In Japan, the Russian Federation, and the United Kingdom, ISCED97 level 4 (postsecondary nontertiary programs) data are also included. 9 Includes ISCED97 levels 5A (academic higher education below the doctoral level), 5B (vocational higher education), and 6 (doctoral level of academic higher education). In France and Japan, ISCED97 level 4 (postsecondary nontertiary programs) data are also included. NOTE: Except where otherwise noted, data shown include public and private institutions, with calculations based on full-time equivalents. Education levels are defined according to the 1997 International Standard Classification of Education (ISCED97). For more information on the ISCED97 levels, see appendix A in this report.SOURCE: Organization for Economic Cooperation and Development (OECD). (2010). Education at a Glance: OECD Indicators 2010, table D2.2. Paris: Author.
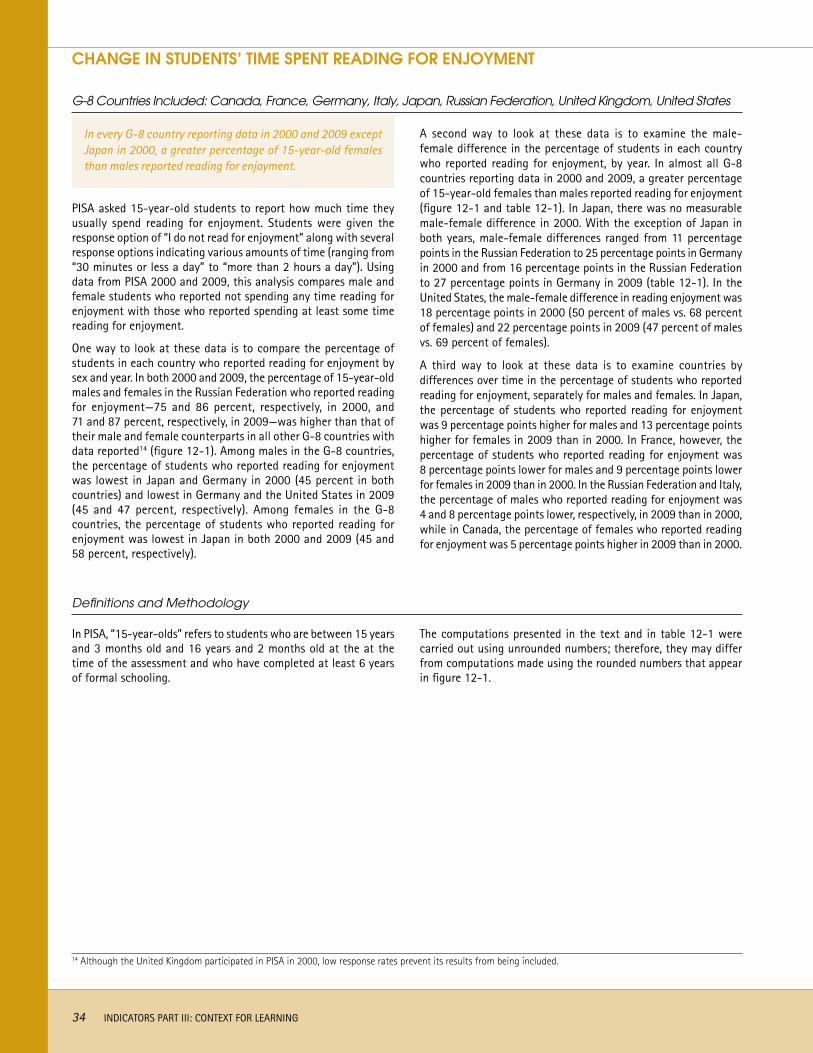
34 INDICATORS PART III: CONTEXT FOR LEARNING
In every G-8 country reporting data in 2000 and 2009 except Japan in 2000, a greater percentage of 15-year-old females than males reported reading for enjoyment.
G-8 Countries Included: Canada, France, Germany, Italy, Japan, Russian Federation, United Kingdom, United States
CHANGE IN STUDENTS’ TIME SPENT READING FOR ENJOYMENT
PISA asked 15-year-old students to report how much time they usually spend reading for enjoyment. Students were given the response option of “I do not read for enjoyment” along with several response options indicating various amounts of time (ranging from “30 minutes or less a day” to “more than 2 hours a day”). Using data from PISA 2000 and 2009, this analysis compares male and female students who reported not spending any time reading for enjoyment with those who reported spending at least some time reading for enjoyment.
One way to look at these data is to compare the percentage of students in each country who reported reading for enjoyment by sex and year. In both 2000 and 2009, the percentage of 15-year-old males and females in the Russian Federation who reported reading for enjoyment—75 and 86 percent, respectively, in 2000, and 71 and 87 percent, respectively, in 2009—was higher than that of their male and female counterparts in all other G-8 countries with data reported14 (figure 12-1). Among males in the G-8 countries, the percentage of students who reported reading for enjoyment was lowest in Japan and Germany in 2000 (45 percent in both countries) and lowest in Germany and the United States in 2009 (45 and 47 percent, respectively). Among females in the G-8 countries, the percentage of students who reported reading for enjoyment was lowest in Japan in both 2000 and 2009 (45 and 58 percent, respectively).
A second way to look at these data is to examine the male-female difference in the percentage of students in each country who reported reading for enjoyment, by year. In almost all G-8 countries reporting data in 2000 and 2009, a greater percentage of 15-year-old females than males reported reading for enjoyment (figure 12-1 and table 12-1). In Japan, there was no measurable male-female difference in 2000. With the exception of Japan in both years, male-female differences ranged from 11 percentage points in the Russian Federation to 25 percentage points in Germany in 2000 and from 16 percentage points in the Russian Federation to 27 percentage points in Germany in 2009 (table 12-1). In the United States, the male-female difference in reading enjoyment was 18 percentage points in 2000 (50 percent of males vs. 68 percent of females) and 22 percentage points in 2009 (47 percent of males vs. 69 percent of females).
A third way to look at these data is to examine countries by differences over time in the percentage of students who reported reading for enjoyment, separately for males and females. In Japan, the percentage of students who reported reading for enjoyment was 9 percentage points higher for males and 13 percentage points higher for females in 2009 than in 2000. In France, however, the percentage of students who reported reading for enjoyment was 8 percentage points lower for males and 9 percentage points lower for females in 2009 than in 2000. In the Russian Federation and Italy, the percentage of males who reported reading for enjoyment was 4 and 8 percentage points lower, respectively, in 2009 than in 2000, while in Canada, the percentage of females who reported reading for enjoyment was 5 percentage points higher in 2009 than in 2000.
Definitions and Methodology
In PISA, “15-year-olds” refers to students who are between 15 years and 3 months old and 16 years and 2 months old at the at the time of the assessment and who have completed at least 6 years of formal schooling.
The computations presented in the text and in table 12-1 were carried out using unrounded numbers; therefore, they may differ from computations made using the rounded numbers that appear in figure 12-1.
14 Although the United Kingdom participated in PISA in 2000, low response rates prevent its results from being included.
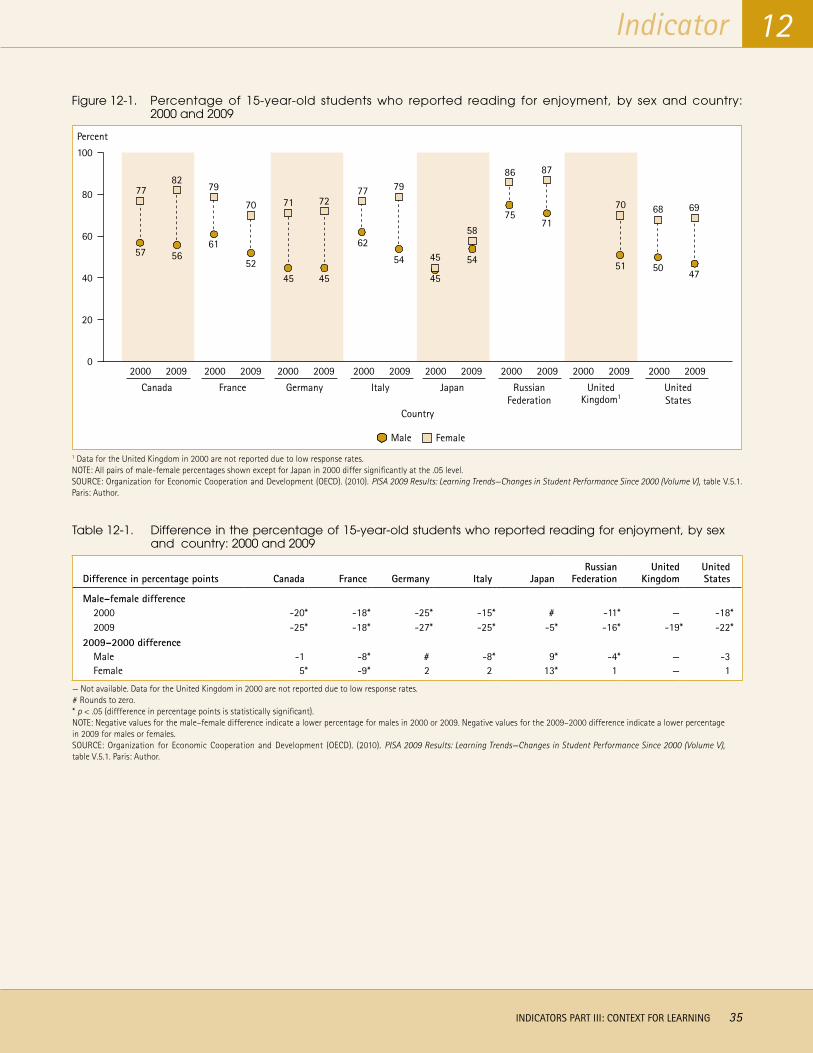
Indicator 12
INDICATORS PART III: CONTEXT FOR LEARNING 35
Figure 12-1. Percentage of 15-year-old students who reported reading for enjoyment, by sex and country: 2000 and 2009
J JJ
J
J J
J
J J
JJ
J JJ
BB
B
B B BB B
B
B B
B B B
J
77
57
82
56
79
61
70 71 7277
62
45 45
45
4552
79
54 54
58
86
75
87
71
70
51
68
50
69
47
20
40
60
80
100
0
Percent
2000 2009 2000 2009 2000 2009 2000 2009 2000 2009 2000 2009 2000 2009 2000 2009
Canada France Germany Italy Japan RussianFederation
UnitedKingdom1
UnitedStates
Country
FemaleMaleJ
B
1 Data for the United Kingdom in 2000 are not reported due to low response rates.NOTE: All pairs of male-female percentages shown except for Japan in 2000 differ significantly at the .05 level.SOURCE: Organization for Economic Cooperation and Development (OECD). (2010). PISA 2009 Results: Learning Trends—Changes in Student Performance Since 2000 (Volume V), table V.5.1. Paris: Author.
Table 12-1. Difference in the percentage of 15-year-old students who reported reading for enjoyment, by sex and country: 2000 and 2009
Difference in percentage points Canada France Germany Italy JapanRussian
FederationUnited
KingdomUnited States
Male–female difference2000 -20* -18* -25* -15* # -11* — -18*2009 -25* -18* -27* -25* -5* -16* -19* -22*
2009–2000 differenceMale -1 -8* # -8* 9* -4* — -3Female 5* -9* 2 2 13* 1 — 1
— Not available. Data for the United Kingdom in 2000 are not reported due to low response rates.# Rounds to zero.* p < .05 (diffference in percentage points is statistically significant).NOTE: Negative values for the male–female difference indicate a lower percentage for males in 2000 or 2009. Negative values for the 2009–2000 difference indicate a lower percentage in 2009 for males or females.SOURCE: Organization for Economic Cooperation and Development (OECD). (2010). PISA 2009 Results: Learning Trends—Changes in Student Performance Since 2000 (Volume V), table V.5.1. Paris: Author.
36 INDICATORS PART III: CONTEXT FOR LEARNING
In 2000 and 2009, the United States had a higher percentage of 15-year-olds whose principals reported that assessment results are used to monitor their school’s progress from year to year than most G-8 countries reporting data and, with one exception, the highest percentage of students whose principals reported that assessment results are used to compare their school’s performance to district- or national-level performance.
G-8 Countries Included: Canada, France, Germany, Italy, Japan, Russian Federation, United Kingdom, United States
CHANGE IN SCHOOL PRINCIPALS’ USES FOR ASSESSMENTS
PISA asked school principals if the assessment results of 15-year-old students are used at their schools for various purposes: inform parents about their child’s progress, make decisions about students’ retention or promotion, group students for instructional purposes, compare school’s performance to district- or national-level performance, monitor the school’s progress from year to year, and make judgments about teachers’ effectiveness. Using data from the 2000 and 2009 PISA assessment, this indicator presents information on the extent to which students in the G-8 countries attended schools that use assessment results for each of these purposes.15
Almost all students in the G-8 countries attended schools that use assessments to inform parents about their child’s progress (figure 13-1). Across the G-8 countries with data reported16 in 2000 and 2009, at least 97 percent of 15-year-olds attended schools whose principals reported that assessments are used to inform parents about their child’s progress.
Most students in the G-8 countries attended schools that use assessment results to make decisions about students’ retention or promotion. Across the G-8 countries with data reported in 2000 and 2009, at least 70 percent of 15-year-olds attended schools whose principals reported using assessment results to make decisions about students’ retention or promotion. In the United States, the percentage in 2009 was lower than the corresponding percentages in Italy, Japan, Canada, the Russian Federation, and Germany—70 percent in the United States compared to a range from 87 to 97 percent. In Germany and Canada, the percentage was 3 and 4 percentage points lower, respectively, in 2009 than in 2000; in Italy, the percentage was 10 percentage points higher in 2009 than in 2000.
The percentage of students who attended schools that use assessment results to group students for instructional purposes varied widely across the G-8 countries with data reported. In 2000, the percentage was higher in Canada (77 percent) than in all other G-8 countries (ranging from 10 percent in Italy to 63 percent in the United States). In 2009, the percentage was higher in the United Kingdom (95 percent) than in all other G-8 countries (ranging from 34 percent in Germany to 76 percent in Canada). In the United States, the corresponding percentages were 63 and 69 percent in 2000 and 2009, respectively. In Japan and Italy, the percentage of 15-year-olds whose principals reported using assessment results to group students
for instructional purposes was 13 and 54 percentage points higher, respectively, in 2009 than in 2000.
Among the G-8 countries reporting data in 2000 and 2009, the United States, with one exception, had the highest percentage of students who attended schools that use assessment results to compare the school’s performance to district- or national-level performance (92 percent in 2000 and 95 percent in 2009). The one exception was that there was no measurable difference between the percentages for the United States and the United Kingdom in 2009. In Japan, Germany, and Italy, no more than about one-third of 15-year-olds in 2000 and 2009 attended schools whose principals reported that assessment results are used to compare their school’s performance to district- or national-level performance. In Japan, the percentage was 13 percentage points higher in 2009 than in 2000; the percentage was 14 percentage points higher in Italy, 22 percentage points higher in Germany, and 29 percentage points higher in Canada in 2009 than in 2000.
In 2000 and 2009, the percentage of students who attended schools that use assessment results to monitor their school’s progress from year to year was higher in the United States than in most other G-8 countries. In 2000, the U.S. percentage (93 percent) was higher than the percentages in all other G-8 countries with data reported except the Russian Federation (the percentages in the United States and the Russian Federation were not measurably different). In 2009, the U.S. percentage (98 percent) was higher than the percentages in all other G-8 countries with data reported except the Russian Federation and the United Kingdom (the percentage in the United States did not differ measurably from the percentages in these countries). In Germany, Japan, and Italy, about one-half to three-fourths of 15-year-olds in 2000 and 2009 attended schools whose principals reported that assessment results are used to monitor their school’s progress from year to year. The percentage was 12 percentage points higher in the Russian Federation and 19 percentage points higher in Canada in 2009 than in 2000.
The percentage of students who attended schools that use assessment results to make judgments about teachers’ effectiveness varied widely across the G-8 countries. In 2000 and 2009, the percentage was higher in the Russian Federation (99 percent in 2000 and 98 percent in 2009) than in all other G-8 countries with data reported (ranging from 8 percent in France to 86 percent in Italy in 2000 and from 20 percent in Italy to 83 percent in the United Kingdom in 2009). In Germany, the percentage of 15-year-olds whose principals reported using assessment results to make judgments about teachers’ effectiveness was 9 percentage points higher in 2009 than in 2000, while in Italy, the percentage was 65 percentage points lower in 2009 than in 2000.
Definitions and Methodology
Data for this indicator are from the PISA 2000 and 2009 school questionnaires, which were designed to obtain information about a variety of school-related aspects, including school characteristics, the school’s resources, the student body, teachers in the school, pedagogical practices of the school, and administrative structures within the school. At all schools with participating 15-year-old students, a school questionnaire was administered to the principal.
It should be noted that the PISA 2000 and 2009 principals do not constitute representative samples of principals. Rather, they are the principals for nationally representative samples of 15-year-old students. Thus, the school data presented in this indicator were analyzed at the student level.
In PISA, “15-year-olds” refers to students who are between 15 years and 3 months old and 16 years and 2 months old at the time of the assess-ment and who have completed at least 6 years of formal schooling.
15 In PISA 2009, school principals were also asked if the assessment results of 15-year-old students are used at their schools to identify aspects of instruction or the curriculum that could be improved and to compare the school with other schools. However, since these items were not asked in PISA 2000, the results are not included here.16 Data for the United Kingdom in 2000 are not reported due to low response rates, and France did not administer the school questionnaire in 2009.
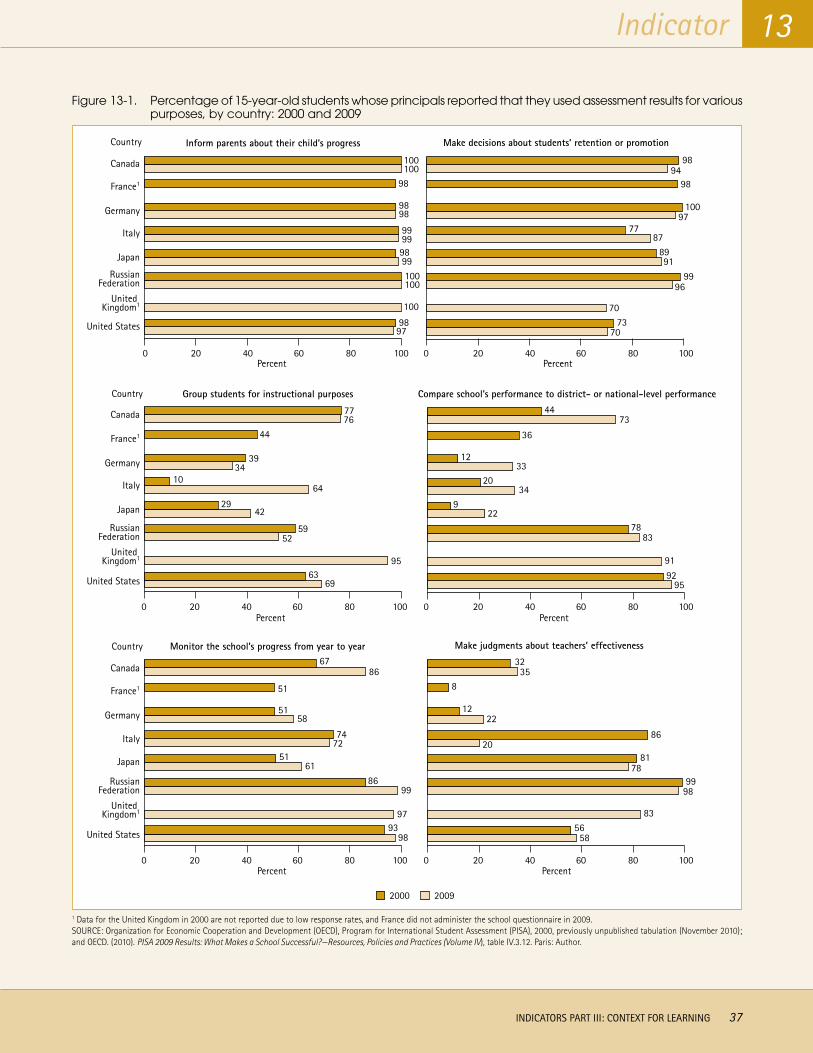
Indicator
INDICATORS PART III: CONTEXT FOR LEARNING 37
13
Figure 13-1. Percentage of 15-year-old students whose principals reported that they used assessment results for various purposes, by country: 2000 and 2009
20092000
5856
83
9899
7881
2086
2212
835
32
Make judgments about teachers’ effectiveness
Percent
9893
97
9986
6151
7274
5851
51
8667
Country
100
Percent
Monitor the school’s progress from year to year
1000 20 40 60 80
9592
83
91
7822
934
2033
12
36
7344
Compare school’s performance to district- or national-level performance
0 20 40 60 80 100
0 20 40 60 80 100
0 20 40 60 80 100
Percent
6963
95
5259
4229
6410
3439
447677
Group students for instructional purposes
Percent
United States
United Kingdom1
Canada
Germany
Italy
Italy
France1
Japan
RussianFederation
United States
United Kingdom1
Canada
Germany
France1
Japan
RussianFederation
United States
United Kingdom1
Canada
Germany
Italy
France1
Japan
RussianFederation
Country
7073
70
9699
9189
8777
97100
9894
98
Make decisions about students’ retention or promotion
Percent
9798
100
100100
99989999
9898
98100100
Country
0 20 40 60 80
1000 20 40 60 80
Percent
Inform parents about their child’s progress
1 Data for the United Kingdom in 2000 are not reported due to low response rates, and France did not administer the school questionnaire in 2009. SOURCE: Organization for Economic Cooperation and Development (OECD), Program for International Student Assessment (PISA), 2000, previously unpublished tabulation (November 2010); and OECD. (2010). PISA 2009 Results: What Makes a School Successful?—Resources, Policies and Practices (Volume IV), table IV.3.12. Paris: Author.

INDICATORS PART IVINDICATORS PART IVExpenditures for Education
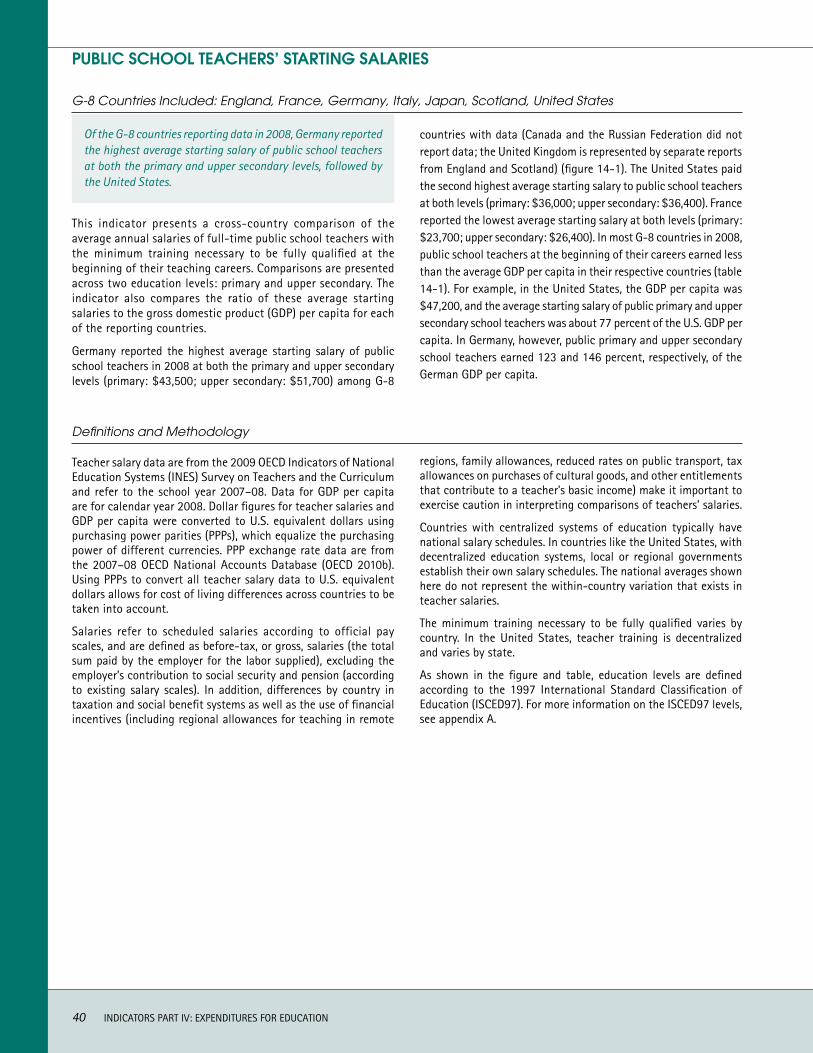
40 INDICATORS PART IV: EXPENDITURES FOR EDUCATION
PUBLIC SCHOOL TEACHERS’ STARTING SALARIES
countries with data (Canada and the Russian Federation did not report data; the United Kingdom is represented by separate reports from England and Scotland) (figure 14-1). The United States paid the second highest average starting salary to public school teachers at both levels (primary: $36,000; upper secondary: $36,400). France reported the lowest average starting salary at both levels (primary: $23,700; upper secondary: $26,400). In most G-8 countries in 2008, public school teachers at the beginning of their careers earned less than the average GDP per capita in their respective countries (table 14-1). For example, in the United States, the GDP per capita was $47,200, and the average starting salary of public primary and upper secondary school teachers was about 77 percent of the U.S. GDP per capita. In Germany, however, public primary and upper secondary school teachers earned 123 and 146 percent, respectively, of the German GDP per capita.
G-8 Countries Included: England, France, Germany, Italy, Japan, Scotland, United States
Of the G-8 countries reporting data in 2008, Germany reported the highest average starting salary of public school teachers at both the primary and upper secondary levels, followed by the United States.
This indicator presents a cross-country comparison of the average annual salaries of full-time public school teachers with the minimum training necessary to be fully qualified at the beginning of their teaching careers. Comparisons are presented across two education levels: primary and upper secondary. The indicator also compares the ratio of these average starting salaries to the gross domestic product (GDP) per capita for each of the reporting countries.
Germany reported the highest average starting salary of public school teachers in 2008 at both the primary and upper secondary levels (primary: $43,500; upper secondary: $51,700) among G-8
Definitions and Methodology
Teacher salary data are from the 2009 OECD Indicators of National Education Systems (INES) Survey on Teachers and the Curriculum and refer to the school year 2007–08. Data for GDP per capita are for calendar year 2008. Dollar figures for teacher salaries and GDP per capita were converted to U.S. equivalent dollars using purchasing power parities (PPPs), which equalize the purchasing power of different currencies. PPP exchange rate data are from the 2007–08 OECD National Accounts Database (OECD 2010b). Using PPPs to convert all teacher salary data to U.S. equivalent dollars allows for cost of living differences across countries to be taken into account.
Salaries refer to scheduled salaries according to official pay scales, and are defined as before-tax, or gross, salaries (the total sum paid by the employer for the labor supplied), excluding the employer’s contribution to social security and pension (according to existing salary scales). In addition, differences by country in taxation and social benefit systems as well as the use of financial incentives (including regional allowances for teaching in remote
regions, family allowances, reduced rates on public transport, tax allowances on purchases of cultural goods, and other entitlements that contribute to a teacher’s basic income) make it important to exercise caution in interpreting comparisons of teachers’ salaries.
Countries with centralized systems of education typically have national salary schedules. In countries like the United States, with decentralized education systems, local or regional governments establish their own salary schedules. The national averages shown here do not represent the within-country variation that exists in teacher salaries.
The minimum training necessary to be fully qualified varies by country. In the United States, teacher training is decentralized and varies by state.
As shown in the figure and table, education levels are defined according to the 1997 International Standard Classification of Education (ISCED97). For more information on the ISCED97 levels, see appendix A.
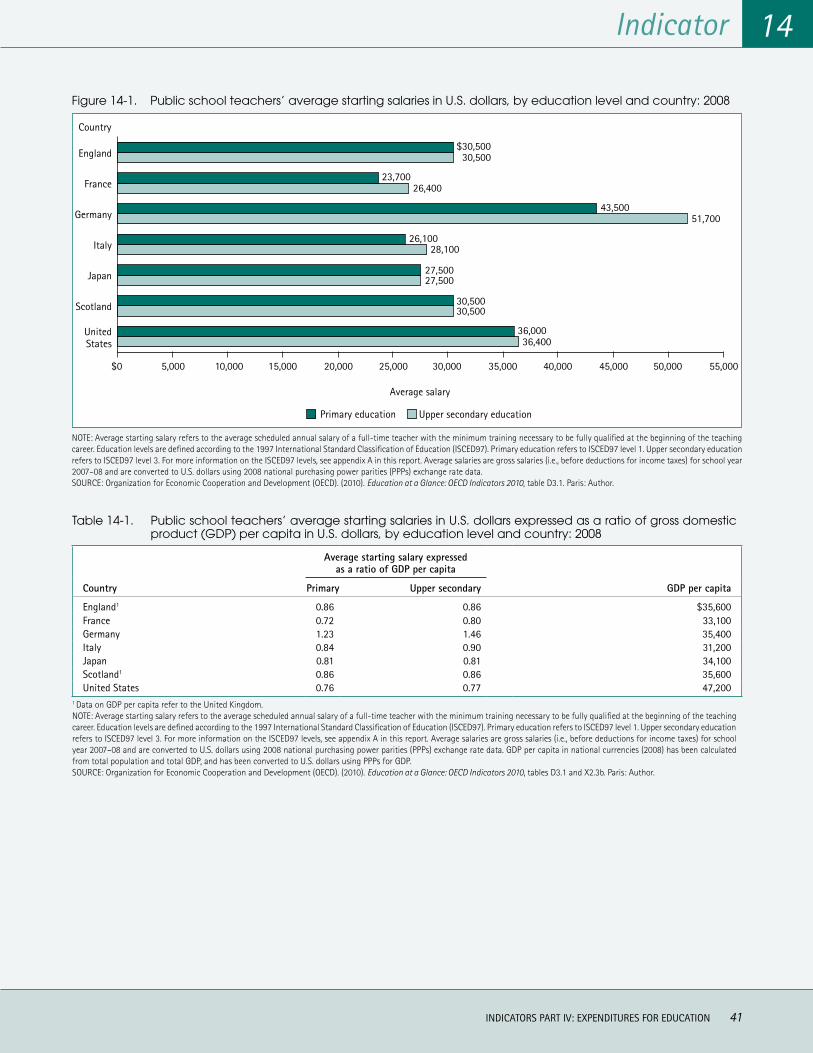
Indicator
INDICATORS PART IV: EXPENDITURES FOR EDUCATION 41
14
Figure 14-1. Public school teachers’ average starting salaries in U.S. dollars, by education level and country: 2008
36,40036,000
30,50030,500
27,50027,500
28,10026,100
51,70043,500
26,40023,700
30,500$30,500
UnitedStates
Scotland
Japan
Italy
Germany
France
England
Country
Average salary
Upper secondary educationPrimary education
$0 5,000 10,000 15,000 20,000 25,000 30,000 35,000 40,000 45,000 50,000 55,000
NOTE: Average starting salary refers to the average scheduled annual salary of a full-time teacher with the minimum training necessary to be fully qualified at the beginning of the teaching career. Education levels are defined according to the 1997 International Standard Classification of Education (ISCED97). Primary education refers to ISCED97 level 1. Upper secondary education refers to ISCED97 level 3. For more information on the ISCED97 levels, see appendix A in this report. Average salaries are gross salaries (i.e., before deductions for income taxes) for school year 2007–08 and are converted to U.S. dollars using 2008 national purchasing power parities (PPPs) exchange rate data. SOURCE: Organization for Economic Cooperation and Development (OECD). (2010). Education at a Glance: OECD Indicators 2010, table D3.1. Paris: Author.
Table 14-1. Public school teachers’ average starting salaries in U.S. dollars expressed as a ratio of gross domestic product (GDP) per capita in U.S. dollars, by education level and country: 2008
Average starting salary expressed
as a ratio of GDP per capita
Country Primary Upper secondary GDP per capita
England1 0.86 0.86 $35,600France 0.72 0.80 33,100Germany 1.23 1.46 35,400Italy 0.84 0.90 31,200Japan 0.81 0.81 34,100Scotland1 0.86 0.86 35,600United States 0.76 0.77 47,200
1 Data on GDP per capita refer to the United Kingdom. NOTE: Average starting salary refers to the average scheduled annual salary of a full-time teacher with the minimum training necessary to be fully qualified at the beginning of the teaching career. Education levels are defined according to the 1997 International Standard Classification of Education (ISCED97). Primary education refers to ISCED97 level 1. Upper secondary education refers to ISCED97 level 3. For more information on the ISCED97 levels, see appendix A in this report. Average salaries are gross salaries (i.e., before deductions for income taxes) for school year 2007–08 and are converted to U.S. dollars using 2008 national purchasing power parities (PPPs) exchange rate data. GDP per capita in national currencies (2008) has been calculated from total population and total GDP, and has been converted to U.S. dollars using PPPs for GDP. SOURCE: Organization for Economic Cooperation and Development (OECD). (2010). Education at a Glance: OECD Indicators 2010, tables D3.1 and X2.3b. Paris: Author.
42 INDICATORS PART IV: EXPENDITURES FOR EDUCATION
ANNUAL EXPENDITURES FOR EDUCATION
In 2007, the United States ranked the highest among the G-8 countries in terms of expenditures per student at the combined primary and secondary education levels as well as at the higher education level.
G-8 Countries Included: Canada, France, Germany, Italy, Japan, Russian Federation, United Kingdom, United States
In this indicator, two measures are used to compare countries’ investment in education: (1) annual public and private educa-tion expenditures per student (expressed in absolute terms); and (2) annual public and private education expenditures as a percentage of gross domestic product (GDP). The latter measure allows a comparison of countries’ expenditures relative to their overall economic output.
In 2007, the expenditures per student in the United States were about $10,800 at the combined primary and secondary education levels17 and about $27,000 at the higher education level (figure 15-1). Both figures were higher than the per student expenditures in all other G-8 countries, which ranged from about $4,900 in the Russian Federation to $8,600 in the United Kingdom at the combined primary and secondary levels and from about
$5,400 in the Russian Federation to $20,300 in Canada at the higher education level.
In 2007, all G-8 countries spent more at the combined primary and secondary education levels than at the higher education level, where the student enrollment is lower (figure 15-2). The United Kingdom spent 4.2 percent of GDP on primary and secondary education, higher than the percentage of GDP spent at this level in all other G-8 countries. The United States spent the second highest percentage of GDP at this level (4.0 percent), followed by France (3.9 percent), while Japan spent the lowest percentage (2.8 percent). At the higher education level, the United States spent 3.1 percent of GDP. This was higher than the percentage of GDP spent at this level in all other G-8 countries, ranging from 0.9 percent in Italy to 2.6 percent in Canada.
Overall (i.e., primary, secondary, and higher education together), the United States spent a higher percentage of GDP on education (7.1 percent) than all other G-8 countries, followed by Canada (6.1 percent), while Italy spent the lowest percentage (4.0 percent), followed by Germany (4.1 percent).
Definitions and Methodology
Expenditures per student (see figure 15-1) are collected by type of institution, while expenditures as a percentage of gross domestic product (GDP) (see figure 15-2) are collected by source of funds. Since the two sources are not the same, the totals can differ in some countries. Per student expenditures are based on public and private full-time-equivalent (FTE) enrollment figures for the 2006–07 school year and current expenditures and capital outlays from both public and private sources, where data are available. Data for GDP per capita are for calendar year 2007. Dollar figures for education expenditures and GDP per capita were converted to U.S. equivalent dollars using purchasing power parities (PPPs), which equalize the purchasing power of different currencies. Using PPPs to convert all education expenditures data to
U.S. equivalent dollars allows for cost-of-living differences across countries to be taken into account. Within-country consumer price indices are used to adjust the PPP indices to account for inflation because the fiscal year has a different starting date in different countries.
The national averages shown here do not represent the within-country variation that may exist in the annual education expenditures per student.
As shown in the figures, education levels are defined according to the 1997 International Standard Classification of Education (ISCED97). For more information on the ISCED97 levels, see appendix A.
17 In this indicator, the category of “primary and secondary education” also includes postsecondary nontertiary programs. See figure 15-1 and appendix A for more information on education levels.
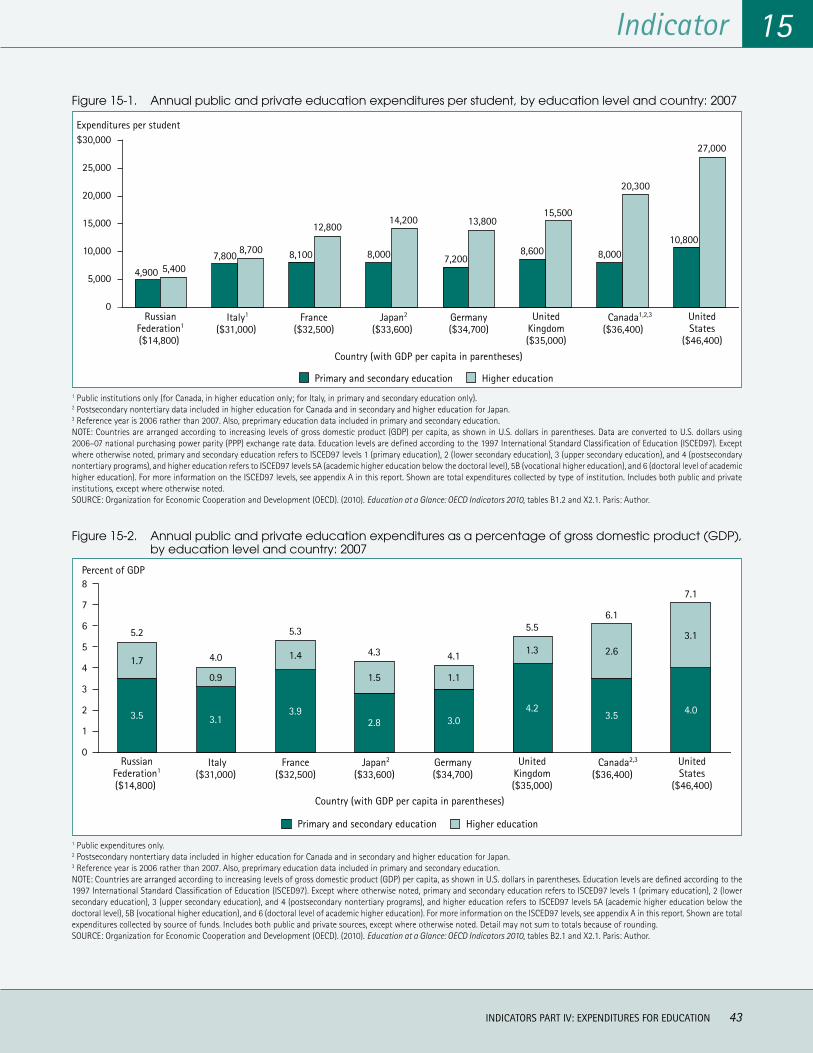
Indicator 15
INDICATORS PART IV: EXPENDITURES FOR EDUCATION 43
Figure 15-1. Annual public and private education expenditures per student, by education level and country: 2007
0
5,000
10,000
15,000
20,000
25,000
$30,000
4,900 5,4007,800 8,700 8,100
12,800
8,000
14,200
7,200
13,800
8,600
15,500
8,000
20,300
10,800
27,000
Canada1,2,3
($36,400)France
($32,500)
Country (with GDP per capita in parentheses)
Germany($34,700)
Italy1
($31,000) Japan2
($33,600) Russian
Federation1
($14,800)
UnitedKingdom($35,000)
UnitedStates
($46,400)
Higher educationPrimary and secondary education
Expenditures per student
1 Public institutions only (for Canada, in higher education only; for Italy, in primary and secondary education only).2 Postsecondary nontertiary data included in higher education for Canada and in secondary and higher education for Japan.3 Reference year is 2006 rather than 2007. Also, preprimary education data included in primary and secondary education.NOTE: Countries are arranged according to increasing levels of gross domestic product (GDP) per capita, as shown in U.S. dollars in parentheses. Data are converted to U.S. dollars using 2006–07 national purchasing power parity (PPP) exchange rate data. Education levels are defined according to the 1997 International Standard Classification of Education (ISCED97). Except where otherwise noted, primary and secondary education refers to ISCED97 levels 1 (primary education), 2 (lower secondary education), 3 (upper secondary education), and 4 (postsecondary nontertiary programs), and higher education refers to ISCED97 levels 5A (academic higher education below the doctoral level), 5B (vocational higher education), and 6 (doctoral level of academic higher education). For more information on the ISCED97 levels, see appendix A in this report. Shown are total expenditures collected by type of institution. Includes both public and private institutions, except where otherwise noted.SOURCE: Organization for Economic Cooperation and Development (OECD). (2010). Education at a Glance: OECD Indicators 2010, tables B1.2 and X2.1. Paris: Author.
Figure 15-2. Annual public and private education expenditures as a percentage of gross domestic product (GDP), by education level and country: 2007
0
1
2
3
4
5
6
7
8
3.5
1.7
5.2
3.1
0.9
4.0
3.9
1.4
5.3
2.8
1.5
4.3
3.0
1.1
4.1
4.2
1.3
5.5
3.5
2.6
6.1
4.0
3.1
7.1
Percent of GDP
Canada2,3
($36,400)France
($32,500)
Country (with GDP per capita in parentheses)
Germany($34,700)
Italy($31,000)
Japan2
($33,600) Russian
Federation1
($14,800)
UnitedKingdom($35,000)
Higher educationPrimary and secondary education
UnitedStates
($46,400)
1 Public expenditures only.2 Postsecondary nontertiary data included in higher education for Canada and in secondary and higher education for Japan.3 Reference year is 2006 rather than 2007. Also, preprimary education data included in primary and secondary education.NOTE: Countries are arranged according to increasing levels of gross domestic product (GDP) per capita, as shown in U.S. dollars in parentheses. Education levels are defined according to the 1997 International Standard Classification of Education (ISCED97). Except where otherwise noted, primary and secondary education refers to ISCED97 levels 1 (primary education), 2 (lower secondary education), 3 (upper secondary education), and 4 (postsecondary nontertiary programs), and higher education refers to ISCED97 levels 5A (academic higher education below the doctoral level), 5B (vocational higher education), and 6 (doctoral level of academic higher education). For more information on the ISCED97 levels, see appendix A in this report. Shown are total expenditures collected by source of funds. Includes both public and private sources, except where otherwise noted. Detail may not sum to totals because of rounding.SOURCE: Organization for Economic Cooperation and Development (OECD). (2010). Education at a Glance: OECD Indicators 2010, tables B2.1 and X2.1. Paris: Author.
44 INDICATORS PART IV: EXPENDITURES FOR EDUCATION
CHANGE IN ANNUAL EXPENDITURES FOR EDUCATION
In both 1995 and 2007, all G-8 countries spent a larger percentage of GDP at the combined primary and secondary education levels than at the higher education level, where the student enrollment is lower (figure 16-2). In 1995, the percentage of GDP spent on primary and secondary education was highest in France (4.5 percent), followed by Canada (4.3 percent), while it was lowest in Japan (3.1 percent). However, in 2007, the percentage of GDP spent on primary and secondary education was highest in the United Kingdom (4.2 percent), followed by the United States (4.0 percent), while it was again lowest in Japan (2.8 percent). In all G-8 countries with data reported except the United Kingdom and the United States, the percentage of GDP spent on education at the combined primary and secondary education levels was lower in 2007 than in 1995.
At the higher education level, all G-8 countries except Canada and the United States spent less than 2 percent of GDP in 1995 and 2007. Germany and France spent about the same percentage of GDP on higher education in 1995 and 2007 (1.1 percent in Germany in both years and 1.4 percent in France in both years). In all other G-8 countries with data reported, the percentage of GDP spent on higher education was higher in 2007 than in 1995. In Italy, the United Kingdom, and Japan, the increase from 1995 to 2007 was no more than two-tenths of a percentage point. However, in Canada, the percentage of GDP spent on higher education increased from 2.1 percent in 1995 to 2.6 percent in 2007, and in the United States, it increased from 2.3 to 3.1 percent.
In 1995, overall (i.e., primary, secondary, and higher education together), Canada spent a higher percentage of GDP on education (6.4 percent) than all other G-8 countries with data reported, followed by the United States (6.2 percent). In 2007, the United States spent a higher percentage of GDP on education (7.1 percent) than all other G-8 countries, followed by Canada (6.1 percent). Italy spent the lowest percentage in both years (4.2 percent in 1995 and 4.0 percent in 2007).
G-8 Countries Included: Canada, France, Germany, Italy, Japan, Russian Federation, United Kingdom, United States
Definitions and Methodology
Expenditures per student (see figure 16-1) are collected by type of institution, while expenditures as a percentage of gross domestic product (GDP) (see figure 16-2) are collected by source of funds. Since the two sources are not the same, the totals can differ in some countries. Per student expenditures are based on public and private full-time-equivalent (FTE) enrollment figures for the 1994–95 and 2006–07 school years and current expenditures and capital outlays from both public and private sources, where data are available. Data for GDP per capita are for calendar years 1995 and 2007. Dollar figures for education expenditures and GDP per capita were converted to U.S. equivalent dollars using purchasing power parities (PPPs), which equalize the purchasing power of different currencies. Using PPPs to convert all education expenditures data to U.S. equivalent dollars allows for cost-of-living differences across countries to be taken into account. Within-country consumer price indices are used to adjust the PPP indices to account for inflation because the fiscal year has a different starting date in different countries.
The national averages shown here do not represent the within-country variation that may exist in the annual education expenditures per student.
Expenditures on core education services are the remaining expen-ditures net of the expenditures on ancillary services and research and development.
Ancillary services are services provided by education institutions that are peripheral to the main educational mission. At the primary, secondary, and postsecondary nontertiary levels, ancillary services include meals, school health services, and transportation to and from school. At the higher education level, these services include residence halls (dormitories), dining halls, and health care. Ancillary services also include services for the general public such as museums, radio and
In all G-8 countries with data reported except the United Kingdom and the United States, the percentage of GDP spent on education at the combined primary and secondary education levels was higher in 1995 than in 2007.
This indicator begins by examining public and private education expenditures per student across the G-8 countries in 2007, including total education expenditures as well as the portion of total expendi-tures devoted to core services. Total expenditures are the combined expenditures for core and ancillary services, and also including research and development activities in higher education. Expenditures on core services pertain to spending on instructional services, including faculty/staff salaries, professional development, and books and other school materials. Expenditures on ancillary services pertain to spending on education services other than instruction, such as meals at school, transportation to and from school, and campus housing. Using data from 1995 and 2007, this indicator also examines annual public and private education expenditures as a percentage of gross domestic product (GDP), allowing a comparison of countries’ education expenditures relative to their overall economic output.
In 2007, the total expenditures per student and the portion of these expenditures devoted to core education services were higher in the United States than in all other G-8 countries with data reported at the combined primary and secondary education levels18 and the higher education level (figure 16-1).
Annual expenditures per student on core education services in the United States were about $9,900 at the combined primary and secondary education levels and about $21,200 at the higher education level. In the other G-8 countries with data reported, annual expenditures per student on core education services ranged from about $7,000 in France and the United Kingdom to $7,600 in Canada at the combined primary and secondary levels and from about $5,200 in Italy to $13,600 in Canada at the higher education level.
television broadcasting, sports, and recreational and cultural programs.
Research and development includes research performed at universities or other higher education institutions, regardless of whether the research is financed from general institution funds or through separate grants or contracts from public or private sponsors. This category does not include research and development activities outside education institutions, such as research and development spending in industry.
As shown in the figures, education levels are defined according to the 1997 International Standard Classification of Education (ISCED97). For more information on the ISCED97 levels, see appendix A.
Percentage-point differences presented in the text were computed from unrounded numbers; therefore, they may differ from computations made using the rounded whole numbers that appear in figure 16-2.
18 In this indicator, the category of “primary and secondary education” also includes postsecondary nontertiary programs. See figure 16-1 and appendix A for more information on education levels.
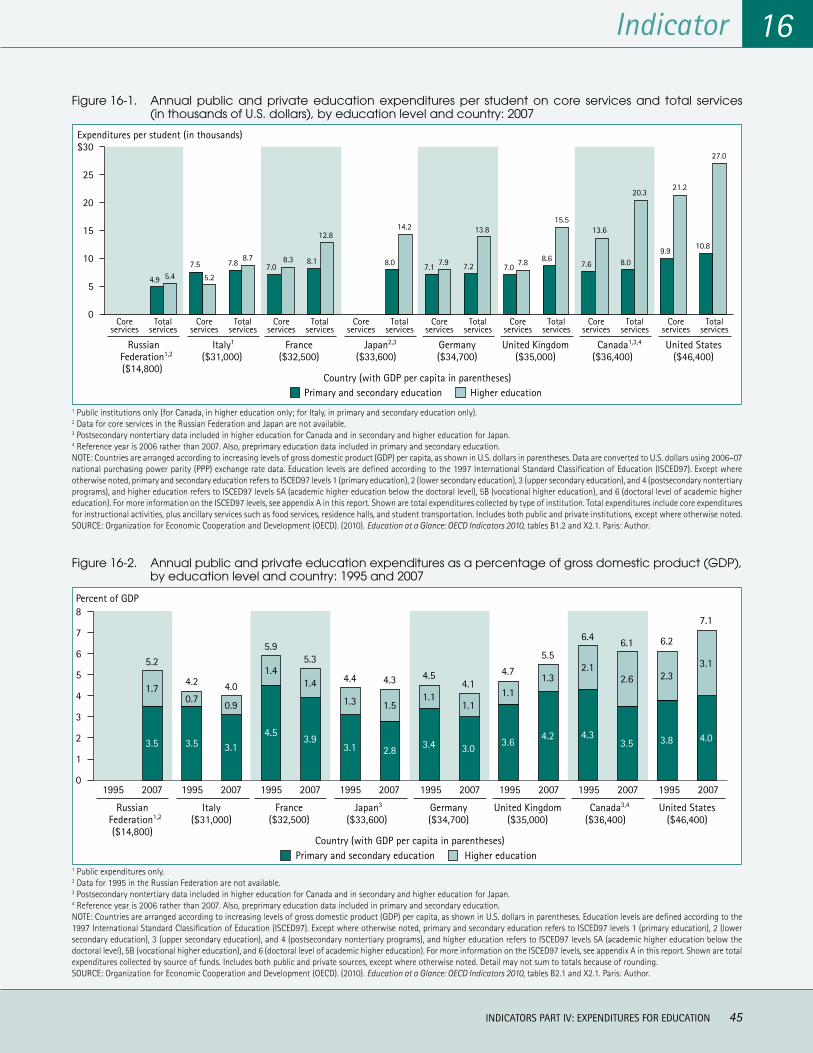
Indicator 16
INDICATORS PART IV: EXPENDITURES FOR EDUCATION 45
Figure 16-1. Annual public and private education expenditures per student on core services and total services (in thousands of U.S. dollars), by education level and country: 2007
4.9 5.47.5
5.2
7.88.7
7.08.3 8.1
12.8
8.0
14.2
7.1 7.9 7.2
13.8
7.0 7.8 8.6
15.5
7.6
13.6
8.0
20.3
9.9
21.2
10.8
27.0
10
5
15
20
25
$30
0
Expenditures per student (in thousands)
Coreservices
Totalservices
Russian Federation1,2
($14,800)
Coreservices
Totalservices
Italy1
($31,000)
Coreservices
Totalservices
France($32,500)
Coreservices
Totalservices
Japan2,3
($33,600)
Coreservices
Totalservices
Germany($34,700)
Coreservices
Totalservices
United Kingdom($35,000)
Coreservices
Totalservices
Canada1,3,4
($36,400)
Coreservices
Totalservices
United States($46,400)
Country (with GDP per capita in parentheses)Higher educationPrimary and secondary education
1 Public institutions only (for Canada, in higher education only; for Italy, in primary and secondary education only). 2 Data for core services in the Russian Federation and Japan are not available.3 Postsecondary nontertiary data included in higher education for Canada and in secondary and higher education for Japan.4 Reference year is 2006 rather than 2007. Also, preprimary education data included in primary and secondary education.NOTE: Countries are arranged according to increasing levels of gross domestic product (GDP) per capita, as shown in U.S. dollars in parentheses. Data are converted to U.S. dollars using 2006–07 national purchasing power parity (PPP) exchange rate data. Education levels are defined according to the 1997 International Standard Classification of Education (ISCED97). Except where otherwise noted, primary and secondary education refers to ISCED97 levels 1 (primary education), 2 (lower secondary education), 3 (upper secondary education), and 4 (postsecondary nontertiary programs), and higher education refers to ISCED97 levels 5A (academic higher education below the doctoral level), 5B (vocational higher education), and 6 (doctoral level of academic higher education). For more information on the ISCED97 levels, see appendix A in this report. Shown are total expenditures collected by type of institution. Total expenditures include core expenditures for instructional activities, plus ancillary services such as food services, residence halls, and student transportation. Includes both public and private institutions, except where otherwise noted. SOURCE: Organization for Economic Cooperation and Development (OECD). (2010). Education at a Glance: OECD Indicators 2010, tables B1.2 and X2.1. Paris: Author.
Figure 16-2. Annual public and private education expenditures as a percentage of gross domestic product (GDP), by education level and country: 1995 and 2007
3.5
1.7
5.2
3.5
0.7
4.2
3.1
0.9
4.0
4.5
1.4
5.9
3.9
1.4
5.3
3.1
1.3
4.4
2.8
1.5
4.3
3.4
1.1
4.5
3.0
1.1
4.1
3.6
1.1
4.7
4.2
1.3
5.5
4.3
2.1
6.4
3.5
2.6
6.1
3.8
2.3
6.2
4.0
3.1
7.1
3
1
2
4
5
6
7
8
0
Percent of GDP
1995 2007 1995 2007 1995 20071995 20071995 20071995 20071995 20071995 2007
Russian Federation1,2
($14,800)
Italy($31,000)
France($32,500)
Japan3
($33,600)Germany($34,700)
United Kingdom($35,000)
Canada3,4
($36,400)United States
($46,400)
Country (with GDP per capita in parentheses)Higher educationPrimary and secondary education
1 Public expenditures only.2 Data for 1995 in the Russian Federation are not available.3 Postsecondary nontertiary data included in higher education for Canada and in secondary and higher education for Japan.4 Reference year is 2006 rather than 2007. Also, preprimary education data included in primary and secondary education.NOTE: Countries are arranged according to increasing levels of gross domestic product (GDP) per capita, as shown in U.S. dollars in parentheses. Education levels are defined according to the 1997 International Standard Classification of Education (ISCED97). Except where otherwise noted, primary and secondary education refers to ISCED97 levels 1 (primary education), 2 (lower secondary education), 3 (upper secondary education), and 4 (postsecondary nontertiary programs), and higher education refers to ISCED97 levels 5A (academic higher education below the doctoral level), 5B (vocational higher education), and 6 (doctoral level of academic higher education). For more information on the ISCED97 levels, see appendix A in this report. Shown are total expenditures collected by source of funds. Includes both public and private sources, except where otherwise noted. Detail may not sum to totals because of rounding.SOURCE: Organization for Economic Cooperation and Development (OECD). (2010). Education at a Glance: OECD Indicators 2010, tables B2.1 and X2.1. Paris: Author.

INDICATORS PART VINDICATORS PART VEducational Attainment and Income
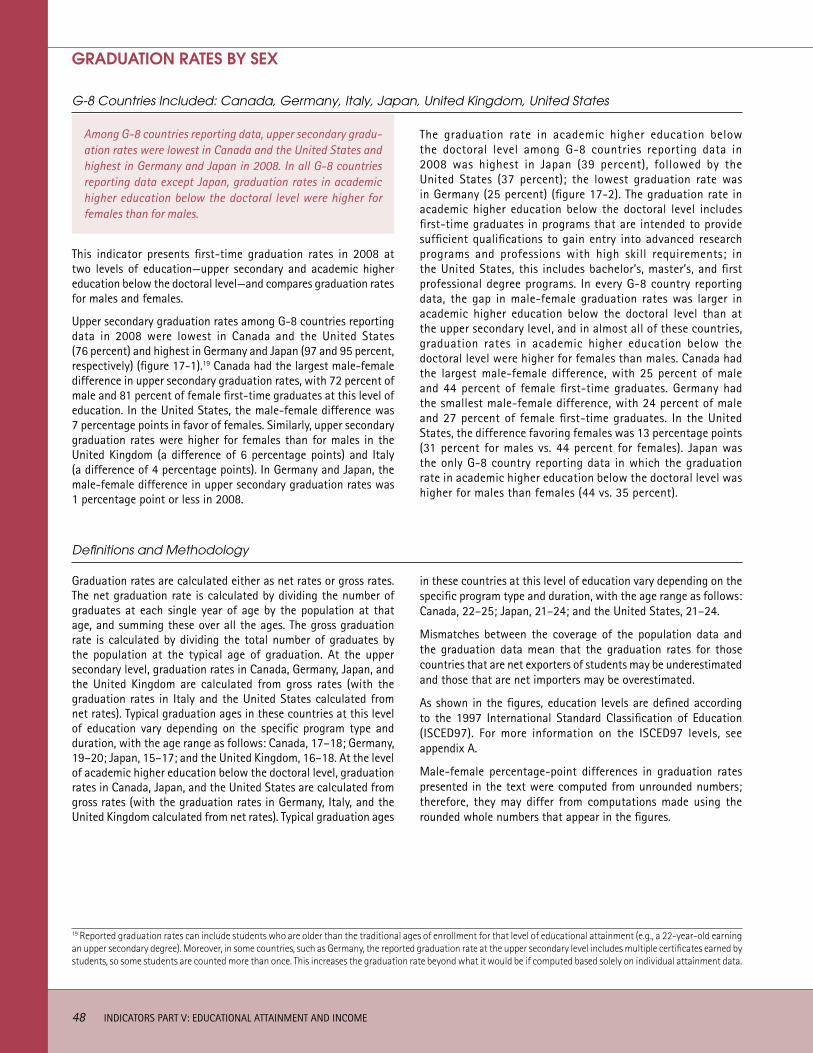
48 INDICATORS PART V: EDUCATIONAL ATTAINMENT AND INCOME
GRADUATION RATES BY SEX
Among G-8 countries reporting data, upper secondary gradu-ation rates were lowest in Canada and the United States and highest in Germany and Japan in 2008. In all G-8 countries reporting data except Japan, graduation rates in academic higher education below the doctoral level were higher for females than for males.
G-8 Countries Included: Canada, Germany, Italy, Japan, United Kingdom, United States
This indicator presents first-time graduation rates in 2008 at two levels of education—upper secondary and academic higher education below the doctoral level—and compares graduation rates for males and females.
Upper secondary graduation rates among G-8 countries reporting data in 2008 were lowest in Canada and the United States (76 percent) and highest in Germany and Japan (97 and 95 percent, respectively) (figure 17-1).19 Canada had the largest male-female difference in upper secondary graduation rates, with 72 percent of male and 81 percent of female first-time graduates at this level of education. In the United States, the male-female difference was 7 percentage points in favor of females. Similarly, upper secondary graduation rates were higher for females than for males in the United Kingdom (a difference of 6 percentage points) and Italy (a difference of 4 percentage points). In Germany and Japan, the male-female difference in upper secondary graduation rates was 1 percentage point or less in 2008.
The graduation rate in academic higher education below the doctoral level among G-8 countries reporting data in 2008 was highest in Japan (39 percent), followed by the United States (37 percent); the lowest graduation rate was in Germany (25 percent) (figure 17-2). The graduation rate in academic higher education below the doctoral level includes first-time graduates in programs that are intended to provide sufficient qualifications to gain entry into advanced research programs and professions with high skill requirements; in the United States, this includes bachelor’s, master’s, and first professional degree programs. In every G-8 country reporting data, the gap in male-female graduation rates was larger in academic higher education below the doctoral level than at the upper secondary level, and in almost all of these countries, graduation rates in academic higher education below the doctoral level were higher for females than males. Canada had the largest male-female difference, with 25 percent of male and 44 percent of female first-time graduates. Germany had the smallest male-female difference, with 24 percent of male and 27 percent of female first-time graduates. In the United States, the difference favoring females was 13 percentage points (31 percent for males vs. 44 percent for females). Japan was the only G-8 country reporting data in which the graduation rate in academic higher education below the doctoral level was higher for males than females (44 vs. 35 percent).
Definitions and Methodology
Graduation rates are calculated either as net rates or gross rates. The net graduation rate is calculated by dividing the number of graduates at each single year of age by the population at that age, and summing these over all the ages. The gross graduation rate is calculated by dividing the total number of graduates by the population at the typical age of graduation. At the upper secondary level, graduation rates in Canada, Germany, Japan, and the United Kingdom are calculated from gross rates (with the graduation rates in Italy and the United States calculated from net rates). Typical graduation ages in these countries at this level of education vary depending on the specific program type and duration, with the age range as follows: Canada, 17–18; Germany, 19–20; Japan, 15–17; and the United Kingdom, 16–18. At the level of academic higher education below the doctoral level, graduation rates in Canada, Japan, and the United States are calculated from gross rates (with the graduation rates in Germany, Italy, and the United Kingdom calculated from net rates). Typical graduation ages
in these countries at this level of education vary depending on the specific program type and duration, with the age range as follows: Canada, 22–25; Japan, 21–24; and the United States, 21–24.
Mismatches between the coverage of the population data and the graduation data mean that the graduation rates for those countries that are net exporters of students may be underestimated and those that are net importers may be overestimated.
As shown in the figures, education levels are defined according to the 1997 International Standard Classification of Education (ISCED97). For more information on the ISCED97 levels, see appendix A.
Male-female percentage-point differences in graduation rates presented in the text were computed from unrounded numbers; therefore, they may differ from computations made using the rounded whole numbers that appear in the figures.
19 Reported graduation rates can include students who are older than the traditional ages of enrollment for that level of educational attainment (e.g., a 22-year-old earning an upper secondary degree). Moreover, in some countries, such as Germany, the reported graduation rate at the upper secondary level includes multiple certificates earned by students, so some students are counted more than once. This increases the graduation rate beyond what it would be if computed based solely on individual attainment data.
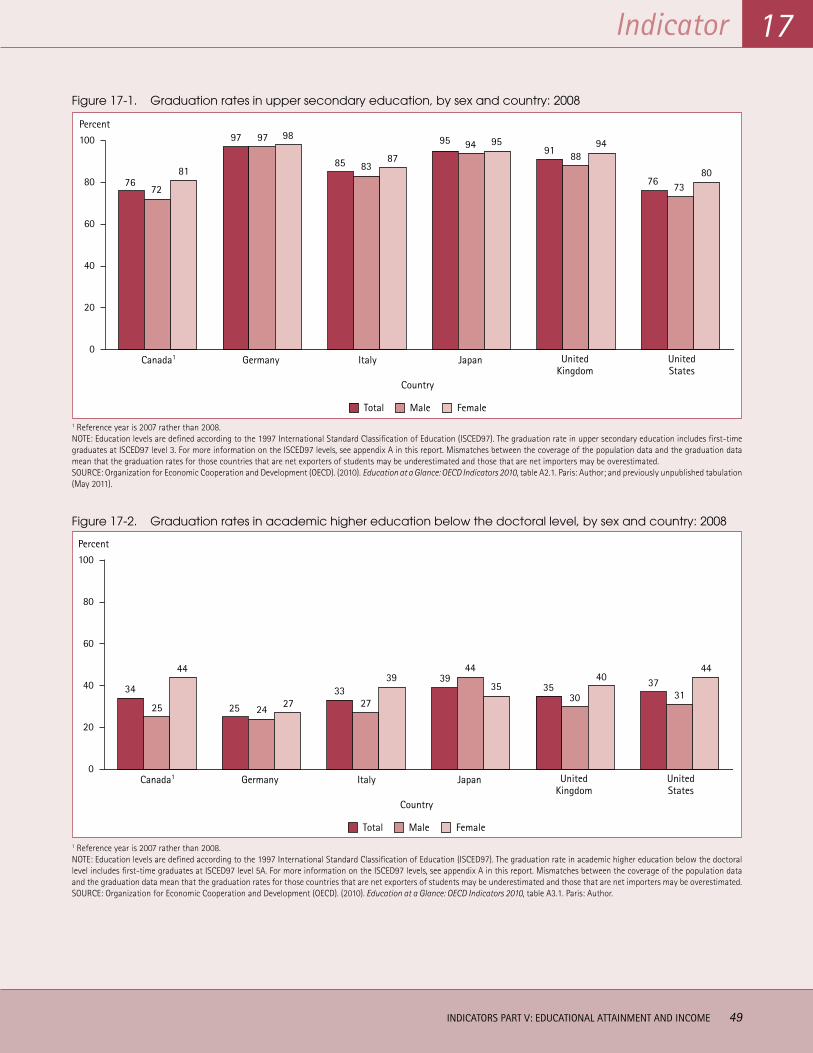
Indicator
INDICATORS PART V: EDUCATIONAL ATTAINMENT AND INCOME 49
17
Figure 17-1. Graduation rates in upper secondary education, by sex and country: 2008
7672
81
97 97 98
85 8387
95 94 9591 88
94
76 7380
0
20
40
60
80
100
Percent
Canada1
Country
Germany Italy Japan UnitedKingdom
UnitedStates
FemaleMaleTotal
1 Reference year is 2007 rather than 2008. NOTE: Education levels are defined according to the 1997 International Standard Classification of Education (ISCED97). The graduation rate in upper secondary education includes first-time graduates at ISCED97 level 3. For more information on the ISCED97 levels, see appendix A in this report. Mismatches between the coverage of the population data and the graduation data mean that the graduation rates for those countries that are net exporters of students may be underestimated and those that are net importers may be overestimated. SOURCE: Organization for Economic Cooperation and Development (OECD). (2010). Education at a Glance: OECD Indicators 2010, table A2.1. Paris: Author; and previously unpublished tabulation (May 2011).
Figure 17-2. Graduation rates in academic higher education below the doctoral level, by sex and country: 2008
34
25
44
25 24 2733
27
39 3944
35 3530
40 3731
44
0
20
40
60
80
100
Percent
Canada1
Country
Germany Italy Japan UnitedKingdom
UnitedStates
FemaleMaleTotal
1 Reference year is 2007 rather than 2008. NOTE: Education levels are defined according to the 1997 International Standard Classification of Education (ISCED97). The graduation rate in academic higher education below the doctoral level includes first-time graduates at ISCED97 level 5A. For more information on the ISCED97 levels, see appendix A in this report. Mismatches between the coverage of the population data and the graduation data mean that the graduation rates for those countries that are net exporters of students may be underestimated and those that are net importers may be overestimated. SOURCE: Organization for Economic Cooperation and Development (OECD). (2010). Education at a Glance: OECD Indicators 2010, table A3.1. Paris: Author.
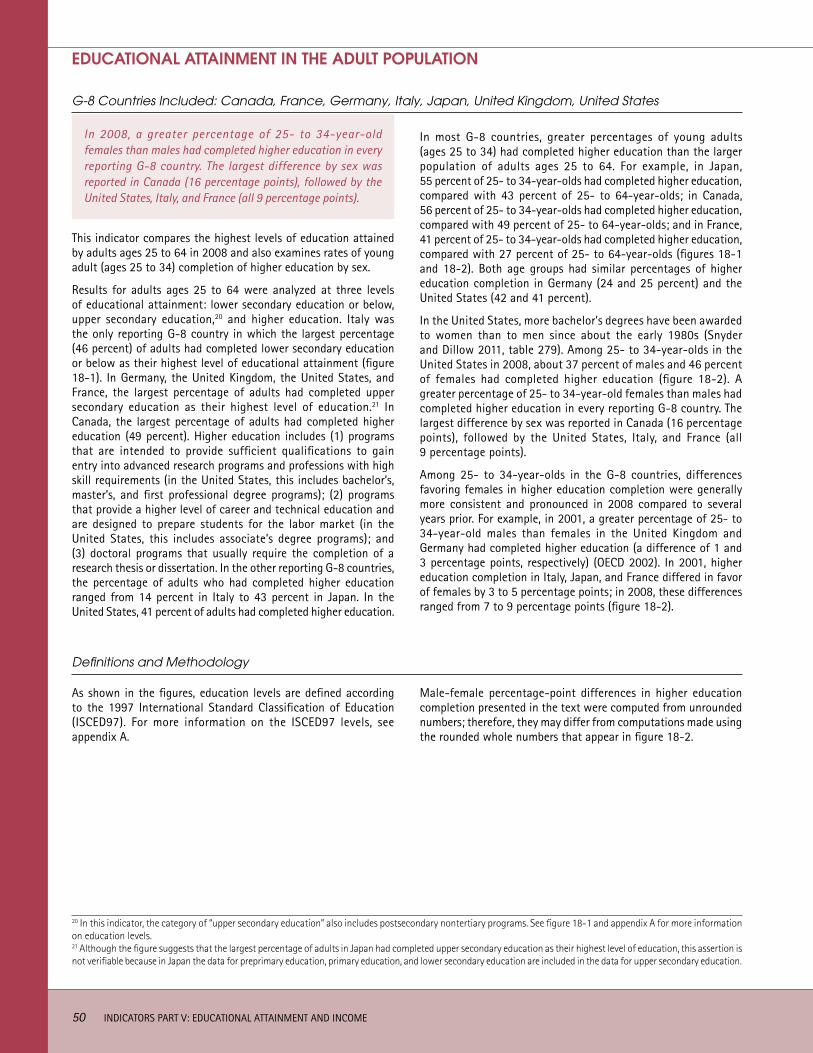
50 INDICATORS PART V: EDUCATIONAL ATTAINMENT AND INCOME
In 2008, a greater percentage of 25- to 34-year-old females than males had completed higher education in every reporting G-8 country. The largest difference by sex was reported in Canada (16 percentage points), followed by the United States, Italy, and France (all 9 percentage points).
G-8 Countries Included: Canada, France, Germany, Italy, Japan, United Kingdom, United States
EDUCATIONAL ATTAINMENT IN THE ADULT POPULATION
This indicator compares the highest levels of education attained by adults ages 25 to 64 in 2008 and also examines rates of young adult (ages 25 to 34) completion of higher education by sex.
Results for adults ages 25 to 64 were analyzed at three levels of educational attainment: lower secondary education or below, upper secondary education,20 and higher education. Italy was the only reporting G-8 country in which the largest percentage (46 percent) of adults had completed lower secondary education or below as their highest level of educational attainment (figure 18-1). In Germany, the United Kingdom, the United States, and France, the largest percentage of adults had completed upper secondary education as their highest level of education.21 In Canada, the largest percentage of adults had completed higher education (49 percent). Higher education includes (1) programs that are intended to provide sufficient qualifications to gain entry into advanced research programs and professions with high skill requirements (in the United States, this includes bachelor’s, master’s, and first professional degree programs); (2) programs that provide a higher level of career and technical education and are designed to prepare students for the labor market (in the United States, this includes associate’s degree programs); and (3) doctoral programs that usually require the completion of a research thesis or dissertation. In the other reporting G-8 countries, the percentage of adults who had completed higher education ranged from 14 percent in Italy to 43 percent in Japan. In the United States, 41 percent of adults had completed higher education.
In most G-8 countries, greater percentages of young adults (ages 25 to 34) had completed higher education than the larger population of adults ages 25 to 64. For example, in Japan, 55 percent of 25- to 34-year-olds had completed higher education, compared with 43 percent of 25- to 64-year-olds; in Canada, 56 percent of 25- to 34-year-olds had completed higher education, compared with 49 percent of 25- to 64-year-olds; and in France, 41 percent of 25- to 34-year-olds had completed higher education, compared with 27 percent of 25- to 64-year-olds (figures 18-1 and 18-2). Both age groups had similar percentages of higher education completion in Germany (24 and 25 percent) and the United States (42 and 41 percent).
In the United States, more bachelor’s degrees have been awarded to women than to men since about the early 1980s (Snyder and Dillow 2011, table 279). Among 25- to 34-year-olds in the United States in 2008, about 37 percent of males and 46 percent of females had completed higher education (figure 18-2). A greater percentage of 25- to 34-year-old females than males had completed higher education in every reporting G-8 country. The largest difference by sex was reported in Canada (16 percentage points), followed by the United States, Italy, and France (all 9 percentage points).
Among 25- to 34-year-olds in the G-8 countries, differences favoring females in higher education completion were generally more consistent and pronounced in 2008 compared to several years prior. For example, in 2001, a greater percentage of 25- to 34-year-old males than females in the United Kingdom and Germany had completed higher education (a difference of 1 and 3 percentage points, respectively) (OECD 2002). In 2001, higher education completion in Italy, Japan, and France differed in favor of females by 3 to 5 percentage points; in 2008, these differences ranged from 7 to 9 percentage points (figure 18-2).
Definitions and Methodology
As shown in the figures, education levels are defined according to the 1997 International Standard Classification of Education (ISCED97). For more information on the ISCED97 levels, see appendix A.
Male-female percentage-point differences in higher education completion presented in the text were computed from unrounded numbers; therefore, they may differ from computations made using the rounded whole numbers that appear in figure 18-2.
20 In this indicator, the category of “upper secondary education” also includes postsecondary nontertiary programs. See figure 18-1 and appendix A for more information on education levels.21 Although the figure suggests that the largest percentage of adults in Japan had completed upper secondary education as their highest level of education, this assertion is not verifiable because in Japan the data for preprimary education, primary education, and lower secondary education are included in the data for upper secondary education.
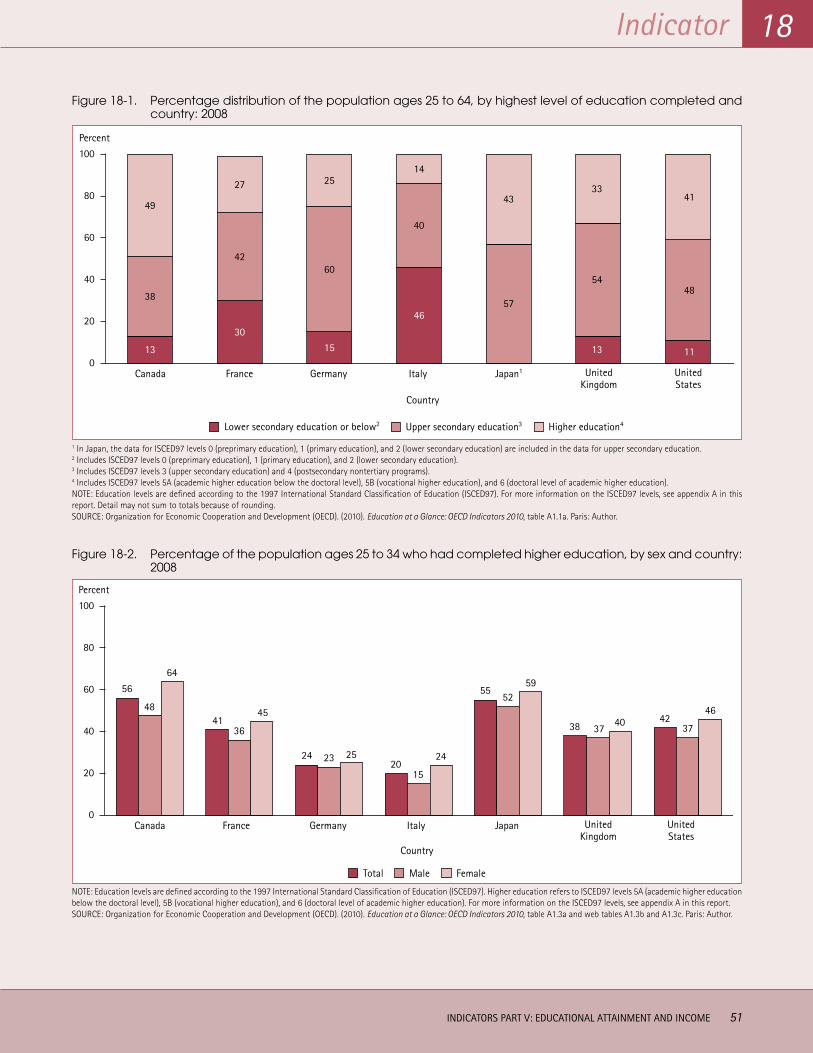
Indicator 18
INDICATORS PART V: EDUCATIONAL ATTAINMENT AND INCOME 51
Figure 18-1. Percentage distribution of the population ages 25 to 64, by highest level of education completed and country: 2008
13
38
49
30
42
27
15
60
25
46
40
14
57
43
13
54
33
11
48
41
0
20
40
60
80
100
Percent
Canada GermanyFrance Italy Japan1 UnitedKingdom
UnitedStates
Country
Higher education4Upper secondary education3Lower secondary education or below2
1 In Japan, the data for ISCED97 levels 0 (preprimary education), 1 (primary education), and 2 (lower secondary education) are included in the data for upper secondary education. 2 Includes ISCED97 levels 0 (preprimary education), 1 (primary education), and 2 (lower secondary education). 3 Includes ISCED97 levels 3 (upper secondary education) and 4 (postsecondary nontertiary programs). 4 Includes ISCED97 levels 5A (academic higher education below the doctoral level), 5B (vocational higher education), and 6 (doctoral level of academic higher education). NOTE: Education levels are defined according to the 1997 International Standard Classification of Education (ISCED97). For more information on the ISCED97 levels, see appendix A in this report. Detail may not sum to totals because of rounding.SOURCE: Organization for Economic Cooperation and Development (OECD). (2010). Education at a Glance: OECD Indicators 2010, table A1.1a. Paris: Author.
Figure 18-2. Percentage of the population ages 25 to 34 who had completed higher education, by sex and country: 2008
56
48
64
4136
45
24 23 2520
15
24
5552
59
38 3740 42
37
46
0
20
40
60
80
100
Percent
Canada
Country
GermanyFrance Italy Japan UnitedKingdom
UnitedStates
FemaleMaleTotal
NOTE: Education levels are defined according to the 1997 International Standard Classification of Education (ISCED97). Higher education refers to ISCED97 levels 5A (academic higher education below the doctoral level), 5B (vocational higher education), and 6 (doctoral level of academic higher education). For more information on the ISCED97 levels, see appendix A in this report. SOURCE: Organization for Economic Cooperation and Development (OECD). (2010). Education at a Glance: OECD Indicators 2010, table A1.3a and web tables A1.3b and A1.3c. Paris: Author.
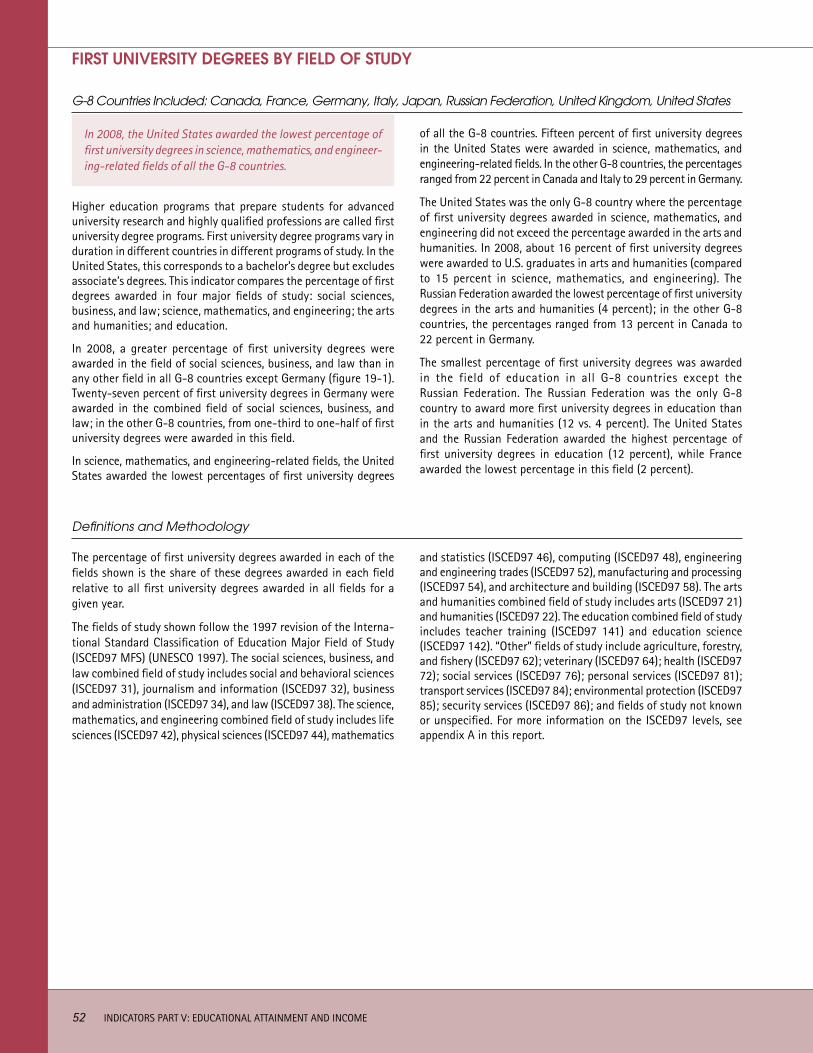
52 INDICATORS PART V: EDUCATIONAL ATTAINMENT AND INCOME
In 2008, the United States awarded the lowest percentage of first university degrees in science, mathematics, and engineer-ing-related fields of all the G-8 countries.
G-8 Countries Included: Canada, France, Germany, Italy, Japan, Russian Federation, United Kingdom, United States
FIRST UNIVERSITY DEGREES BY FIELD OF STUDY
Higher education programs that prepare students for advanced university research and highly qualified professions are called first university degree programs. First university degree programs vary in duration in different countries in different programs of study. In the United States, this corresponds to a bachelor’s degree but excludes associate’s degrees. This indicator compares the percentage of first degrees awarded in four major fields of study: social sciences, business, and law; science, mathematics, and engineering; the arts and humanities; and education.
In 2008, a greater percentage of first university degrees were awarded in the field of social sciences, business, and law than in any other field in all G-8 countries except Germany (figure 19-1). Twenty-seven percent of first university degrees in Germany were awarded in the combined field of social sciences, business, and law; in the other G-8 countries, from one-third to one-half of first university degrees were awarded in this field.
In science, mathematics, and engineering-related fields, the United States awarded the lowest percentages of first university degrees
of all the G-8 countries. Fifteen percent of first university degrees in the United States were awarded in science, mathematics, and engineering-related fields. In the other G-8 countries, the percentages ranged from 22 percent in Canada and Italy to 29 percent in Germany.
The United States was the only G-8 country where the percentage of first university degrees awarded in science, mathematics, and engineering did not exceed the percentage awarded in the arts and humanities. In 2008, about 16 percent of first university degrees were awarded to U.S. graduates in arts and humanities (compared to 15 percent in science, mathematics, and engineering). The Russian Federation awarded the lowest percentage of first university degrees in the arts and humanities (4 percent); in the other G-8 countries, the percentages ranged from 13 percent in Canada to 22 percent in Germany.
The smallest percentage of first university degrees was awarded in the field of education in all G-8 countries except the Russian Federation. The Russian Federation was the only G-8 country to award more first university degrees in education than in the arts and humanities (12 vs. 4 percent). The United States and the Russian Federation awarded the highest percentage of first university degrees in education (12 percent), while France awarded the lowest percentage in this field (2 percent).
Definitions and Methodology
The percentage of first university degrees awarded in each of the fields shown is the share of these degrees awarded in each field relative to all first university degrees awarded in all fields for a given year.
The fields of study shown follow the 1997 revision of the Interna-tional Standard Classification of Education Major Field of Study (ISCED97 MFS) (UNESCO 1997). The social sciences, business, and law combined field of study includes social and behavioral sciences (ISCED97 31), journalism and information (ISCED97 32), business and administration (ISCED97 34), and law (ISCED97 38). The science, mathematics, and engineering combined field of study includes life sciences (ISCED97 42), physical sciences (ISCED97 44), mathematics
and statistics (ISCED97 46), computing (ISCED97 48), engineering and engineering trades (ISCED97 52), manufacturing and processing (ISCED97 54), and architecture and building (ISCED97 58). The arts and humanities combined field of study includes arts (ISCED97 21) and humanities (ISCED97 22). The education combined field of study includes teacher training (ISCED97 141) and education science (ISCED97 142). “Other” fields of study include agriculture, forestry, and fishery (ISCED97 62); veterinary (ISCED97 64); health (ISCED97 72); social services (ISCED97 76); personal services (ISCED97 81); transport services (ISCED97 84); environmental protection (ISCED97 85); security services (ISCED97 86); and fields of study not known or unspecified. For more information on the ISCED97 levels, see appendix A in this report.
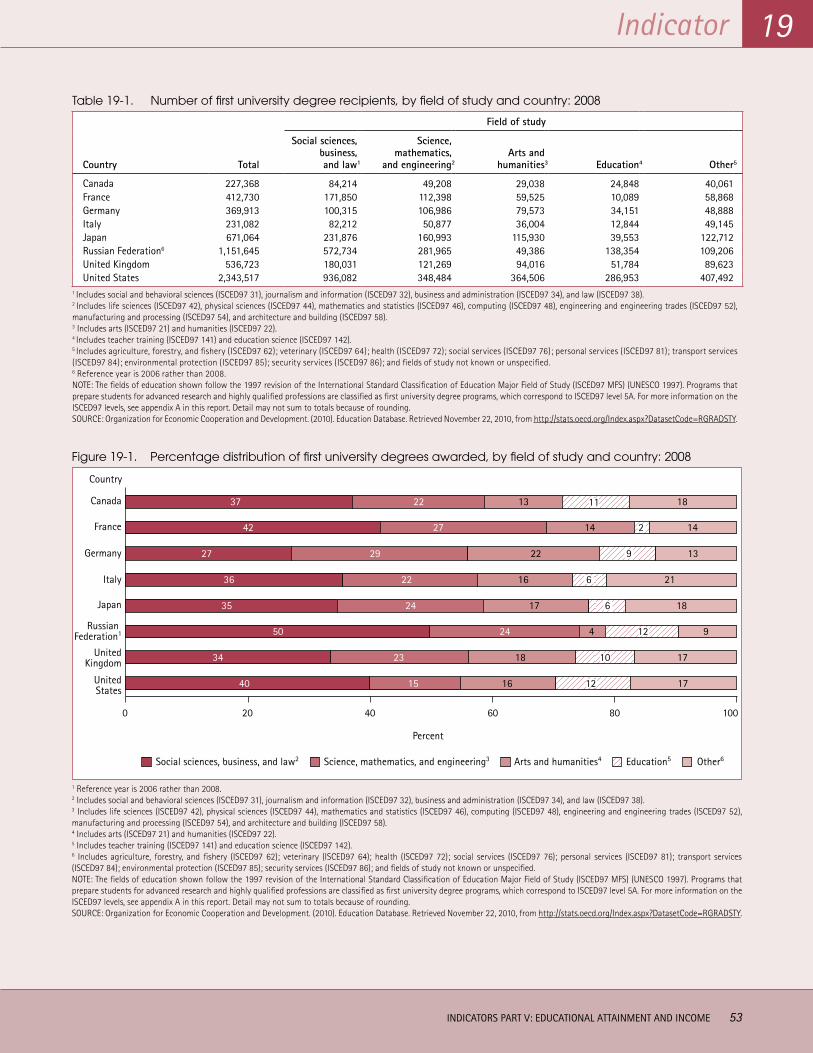
Indicator 19
INDICATORS PART V: EDUCATIONAL ATTAINMENT AND INCOME 53
Table 19-1. Number of first university degree recipients, by field of study and country: 2008
Country
Field of study
Total
Social sciences, business, and law1
Science, mathematics,
and engineering2Arts and
humanities3 Education4 Other5
Canada 227,368 84,214 49,208 29,038 24,848 40,061France 412,730 171,850 112,398 59,525 10,089 58,868Germany 369,913 100,315 106,986 79,573 34,151 48,888Italy 231,082 82,212 50,877 36,004 12,844 49,145Japan 671,064 231,876 160,993 115,930 39,553 122,712Russian Federation6 1,151,645 572,734 281,965 49,386 138,354 109,206United Kingdom 536,723 180,031 121,269 94,016 51,784 89,623United States 2,343,517 936,082 348,484 364,506 286,953 407,492
1 Includes social and behavioral sciences (ISCED97 31), journalism and information (ISCED97 32), business and administration (ISCED97 34), and law (ISCED97 38).2 Includes life sciences (ISCED97 42), physical sciences (ISCED97 44), mathematics and statistics (ISCED97 46), computing (ISCED97 48), engineering and engineering trades (ISCED97 52), manufacturing and processing (ISCED97 54), and architecture and building (ISCED97 58).3 Includes arts (ISCED97 21) and humanities (ISCED97 22).4 Includes teacher training (ISCED97 141) and education science (ISCED97 142).5 Includes agriculture, forestry, and fishery (ISCED97 62); veterinary (ISCED97 64); health (ISCED97 72); social services (ISCED97 76); personal services (ISCED97 81); transport services (ISCED97 84); environmental protection (ISCED97 85); security services (ISCED97 86); and fields of study not known or unspecified.6 Reference year is 2006 rather than 2008.NOTE: The fields of education shown follow the 1997 revision of the International Standard Classification of Education Major Field of Study (ISCED97 MFS) (UNESCO 1997). Programs that prepare students for advanced research and highly qualified professions are classified as first university degree programs, which correspond to ISCED97 level 5A. For more information on the ISCED97 levels, see appendix A in this report. Detail may not sum to totals because of rounding. SOURCE: Organization for Economic Cooperation and Development. (2010). Education Database. Retrieved November 22, 2010, from http://stats.oecd.org/Index.aspx?DatasetCode=RGRADSTY.
Figure 19-1. Percentage distribution of first university degrees awarded, by field of study and country: 2008
40 15 16 17
34 23 18 17
50 24 4 9
35 24 17 18
36 22 16 21
27 29 22 13
42 27 14 14
37 22 13 18
United States
United Kingdom
Japan
Russian Federation1
Italy
Germany
France
Canada
Country
1000 20 40 60 80
Percent
Arts and humanities4Science, mathematics, and engineering3Social sciences, business, and law2 Other6Education5
11
12
10
12
6
6
9
2
1 Reference year is 2006 rather than 2008.2 Includes social and behavioral sciences (ISCED97 31), journalism and information (ISCED97 32), business and administration (ISCED97 34), and law (ISCED97 38).3 Includes life sciences (ISCED97 42), physical sciences (ISCED97 44), mathematics and statistics (ISCED97 46), computing (ISCED97 48), engineering and engineering trades (ISCED97 52), manufacturing and processing (ISCED97 54), and architecture and building (ISCED97 58).4 Includes arts (ISCED97 21) and humanities (ISCED97 22).5 Includes teacher training (ISCED97 141) and education science (ISCED97 142).6 Includes agriculture, forestry, and fishery (ISCED97 62); veterinary (ISCED97 64); health (ISCED97 72); social services (ISCED97 76); personal services (ISCED97 81); transport services (ISCED97 84); environmental protection (ISCED97 85); security services (ISCED97 86); and fields of study not known or unspecified.NOTE: The fields of education shown follow the 1997 revision of the International Standard Classification of Education Major Field of Study (ISCED97 MFS) (UNESCO 1997). Programs that prepare students for advanced research and highly qualified professions are classified as first university degree programs, which correspond to ISCED97 level 5A. For more information on the ISCED97 levels, see appendix A in this report. Detail may not sum to totals because of rounding.SOURCE: Organization for Economic Cooperation and Development. (2010). Education Database. Retrieved November 22, 2010, from http://stats.oecd.org/Index.aspx?DatasetCode=RGRADSTY.
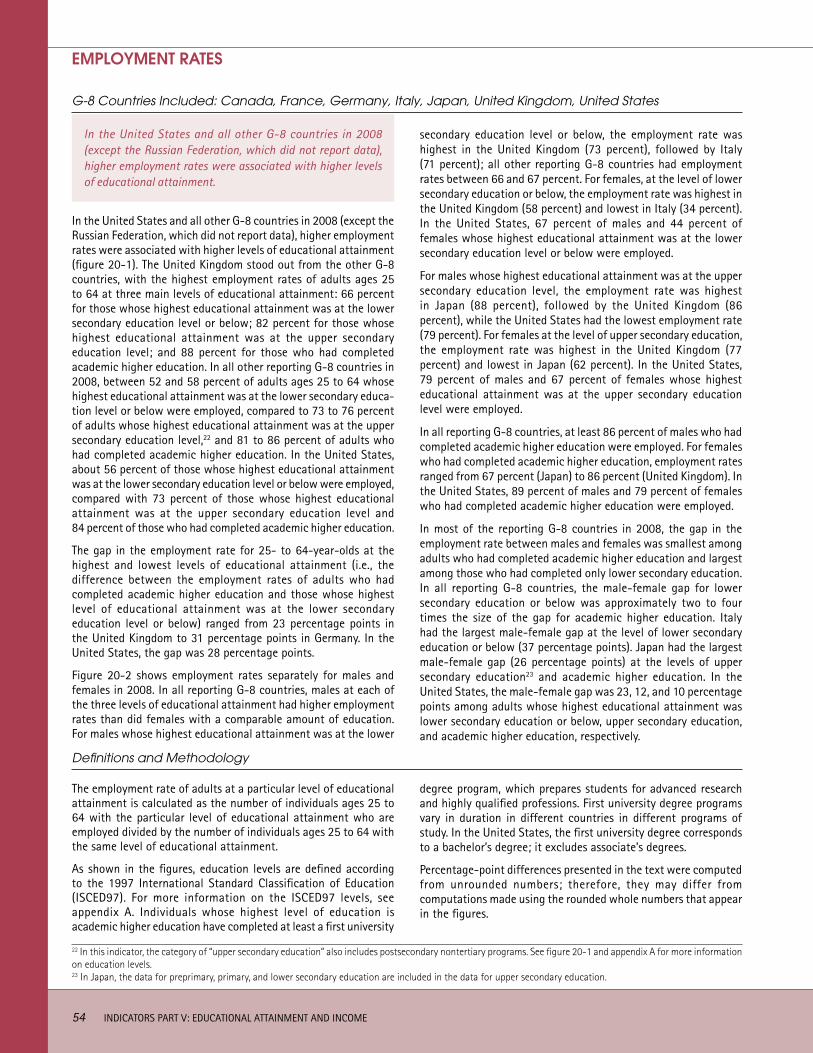
54 INDICATORS PART V: EDUCATIONAL ATTAINMENT AND INCOME
EMPLOYMENT RATES
In the United States and all other G-8 countries in 2008 (except the Russian Federation, which did not report data), higher employment rates were associated with higher levels of educational attainment.
G-8 Countries Included: Canada, France, Germany, Italy, Japan, United Kingdom, United States
In the United States and all other G-8 countries in 2008 (except the Russian Federation, which did not report data), higher employment rates were associated with higher levels of educational attainment (figure 20-1). The United Kingdom stood out from the other G-8 countries, with the highest employment rates of adults ages 25 to 64 at three main levels of educational attainment: 66 percent for those whose highest educational attainment was at the lower secondary education level or below; 82 percent for those whose highest educational attainment was at the upper secondary education level; and 88 percent for those who had completed academic higher education. In all other reporting G-8 countries in 2008, between 52 and 58 percent of adults ages 25 to 64 whose highest educational attainment was at the lower secondary educa-tion level or below were employed, compared to 73 to 76 percent of adults whose highest educational attainment was at the upper secondary education level,22 and 81 to 86 percent of adults who had completed academic higher education. In the United States, about 56 percent of those whose highest educational attainment was at the lower secondary education level or below were employed, compared with 73 percent of those whose highest educational attainment was at the upper secondary education level and 84 percent of those who had completed academic higher education.
The gap in the employment rate for 25- to 64-year-olds at the highest and lowest levels of educational attainment (i.e., the difference between the employment rates of adults who had completed academic higher education and those whose highest level of educational attainment was at the lower secondary education level or below) ranged from 23 percentage points in the United Kingdom to 31 percentage points in Germany. In the United States, the gap was 28 percentage points.
Figure 20-2 shows employment rates separately for males and females in 2008. In all reporting G-8 countries, males at each of the three levels of educational attainment had higher employment rates than did females with a comparable amount of education. For males whose highest educational attainment was at the lower
secondary education level or below, the employment rate was highest in the United Kingdom (73 percent), followed by Italy (71 percent); all other reporting G-8 countries had employment rates between 66 and 67 percent. For females, at the level of lower secondary education or below, the employment rate was highest in the United Kingdom (58 percent) and lowest in Italy (34 percent). In the United States, 67 percent of males and 44 percent of females whose highest educational attainment was at the lower secondary education level or below were employed.
For males whose highest educational attainment was at the upper secondary education level, the employment rate was highest in Japan (88 percent), followed by the United Kingdom (86 percent), while the United States had the lowest employment rate (79 percent). For females at the level of upper secondary education, the employment rate was highest in the United Kingdom (77 percent) and lowest in Japan (62 percent). In the United States, 79 percent of males and 67 percent of females whose highest educational attainment was at the upper secondary education level were employed.
In all reporting G-8 countries, at least 86 percent of males who had completed academic higher education were employed. For females who had completed academic higher education, employment rates ranged from 67 percent (Japan) to 86 percent (United Kingdom). In the United States, 89 percent of males and 79 percent of females who had completed academic higher education were employed.
In most of the reporting G-8 countries in 2008, the gap in the employment rate between males and females was smallest among adults who had completed academic higher education and largest among those who had completed only lower secondary education. In all reporting G-8 countries, the male-female gap for lower secondary education or below was approximately two to four times the size of the gap for academic higher education. Italy had the largest male-female gap at the level of lower secondary education or below (37 percentage points). Japan had the largest male-female gap (26 percentage points) at the levels of upper secondary education23 and academic higher education. In the United States, the male-female gap was 23, 12, and 10 percentage points among adults whose highest educational attainment was lower secondary education or below, upper secondary education, and academic higher education, respectively.
Definitions and Methodology
The employment rate of adults at a particular level of educational attainment is calculated as the number of individuals ages 25 to 64 with the particular level of educational attainment who are employed divided by the number of individuals ages 25 to 64 with the same level of educational attainment.
As shown in the figures, education levels are defined according to the 1997 International Standard Classification of Education (ISCED97). For more information on the ISCED97 levels, see appendix A. Individuals whose highest level of education is academic higher education have completed at least a first university
degree program, which prepares students for advanced research and highly qualified professions. First university degree programs vary in duration in different countries in different programs of study. In the United States, the first university degree corresponds to a bachelor’s degree; it excludes associate’s degrees.
Percentage-point differences presented in the text were computed from unrounded numbers; therefore, they may differ from computations made using the rounded whole numbers that appear in the figures.
22 In this indicator, the category of “upper secondary education” also includes postsecondary nontertiary programs. See figure 20-1 and appendix A for more information on education levels.23 In Japan, the data for preprimary, primary, and lower secondary education are included in the data for upper secondary education.
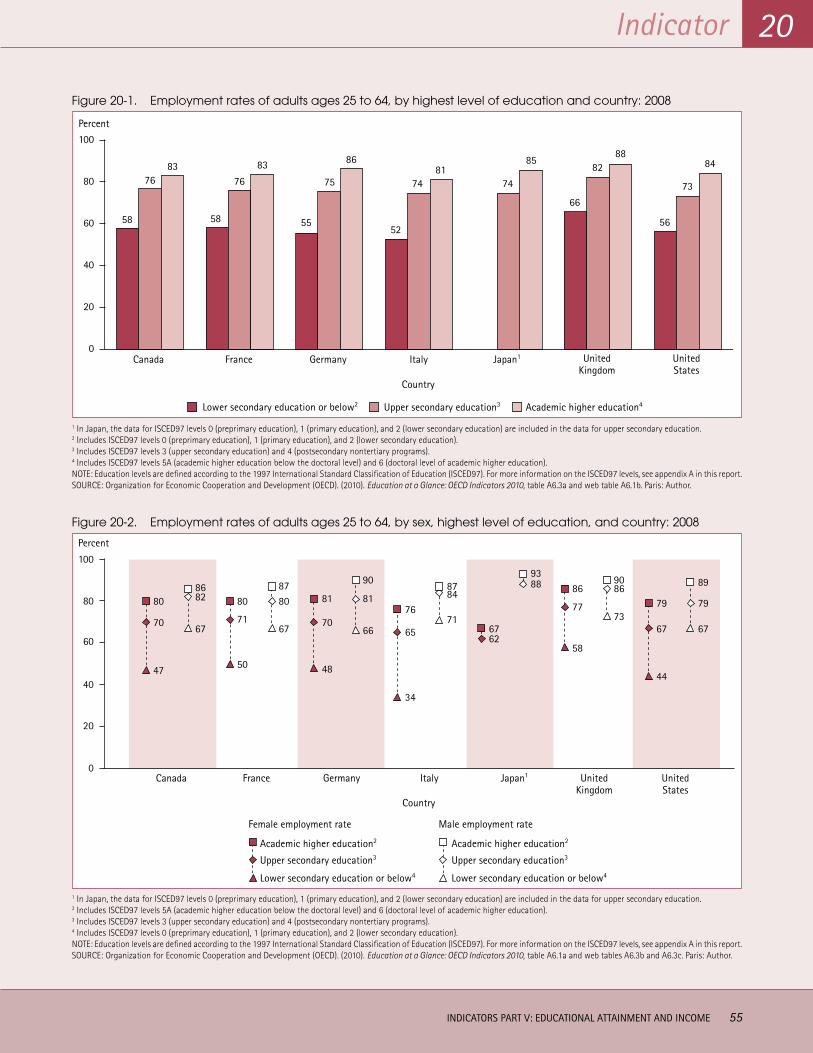
Indicator 20
INDICATORS PART V: EDUCATIONAL ATTAINMENT AND INCOME 55
Figure 20-1. Employment rates of adults ages 25 to 64, by highest level of education and country: 2008
58
7683
58
76
83
55
75
86
52
7481
74
85
66
8288
56
73
84
0
20
40
60
80
100
Percent
Canada
Country
GermanyFrance Italy Japan1 UnitedKingdom
UnitedStates
Academic higher education4Upper secondary education3Lower secondary education or below2
1 In Japan, the data for ISCED97 levels 0 (preprimary education), 1 (primary education), and 2 (lower secondary education) are included in the data for upper secondary education. 2 Includes ISCED97 levels 0 (preprimary education), 1 (primary education), and 2 (lower secondary education). 3 Includes ISCED97 levels 3 (upper secondary education) and 4 (postsecondary nontertiary programs). 4 Includes ISCED97 levels 5A (academic higher education below the doctoral level) and 6 (doctoral level of academic higher education). NOTE: Education levels are defined according to the 1997 International Standard Classification of Education (ISCED97). For more information on the ISCED97 levels, see appendix A in this report. SOURCE: Organization for Economic Cooperation and Development (OECD). (2010). Education at a Glance: OECD Indicators 2010, table A6.3a and web table A6.1b. Paris: Author.
Figure 20-2. Employment rates of adults ages 25 to 64, by sex, highest level of education, and country: 2008
H
H
H
H
H
H
H
H
H
H
H
HF
F
F
F
F
F
F
F
F
F
F
F
F
FB
B
B
B
B
B
B
B
B
B
BB
H
F
B
H
F
B
B
B
40
20
60
80
100
0
Percent
Canada France Germany Italy Japan1 UnitedKingdom
UnitedStates
Country
Female employment rate Male employment rate
Lower secondary education or below4
Upper secondary education3
Academic higher education2
Lower secondary education or below4
Upper secondary education3
Academic higher education2
808682
67
8087
81
90
76
8784
7167
9388 86
9086
7379
67
44
89
79
67
77
5862
65
34
81
6670
48
80
6771
50
70
47
1 In Japan, the data for ISCED97 levels 0 (preprimary education), 1 (primary education), and 2 (lower secondary education) are included in the data for upper secondary education. 2 Includes ISCED97 levels 5A (academic higher education below the doctoral level) and 6 (doctoral level of academic higher education). 3 Includes ISCED97 levels 3 (upper secondary education) and 4 (postsecondary nontertiary programs). 4 Includes ISCED97 levels 0 (preprimary education), 1 (primary education), and 2 (lower secondary education). NOTE: Education levels are defined according to the 1997 International Standard Classification of Education (ISCED97). For more information on the ISCED97 levels, see appendix A in this report. SOURCE: Organization for Economic Cooperation and Development (OECD). (2010). Education at a Glance: OECD Indicators 2010, table A6.1a and web tables A6.3b and A6.3c. Paris: Author.
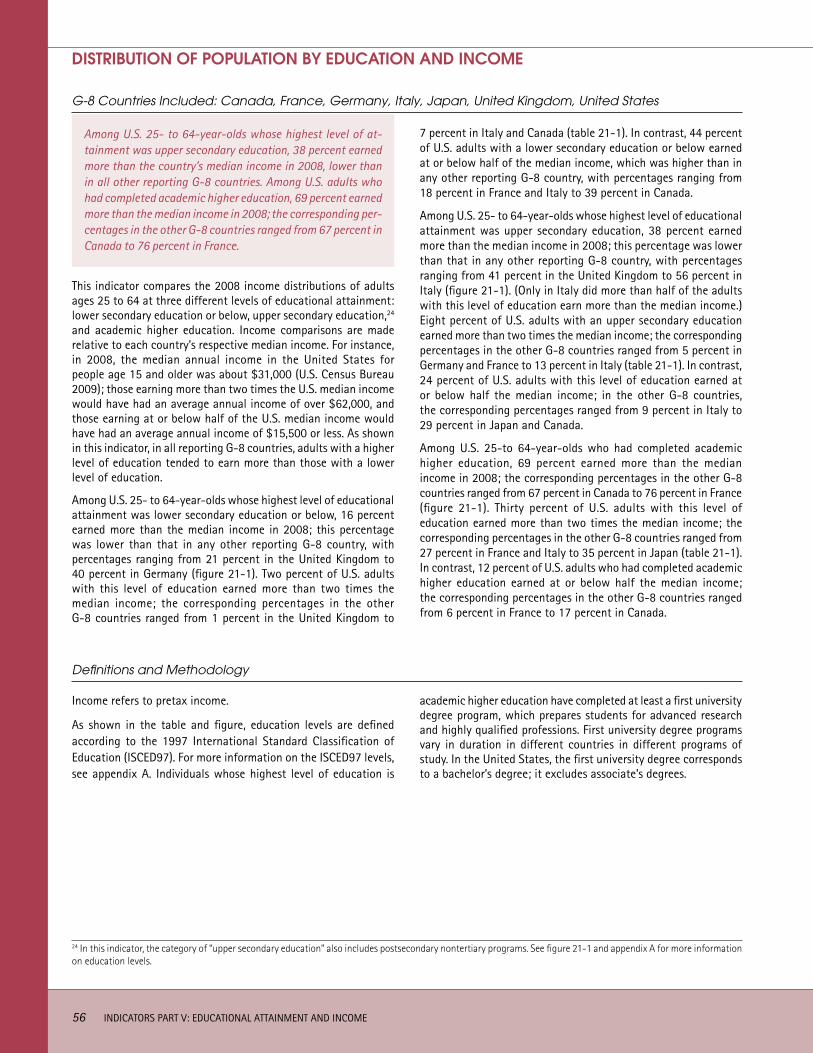
56 INDICATORS PART V: EDUCATIONAL ATTAINMENT AND INCOME
Among U.S. 25- to 64-year-olds whose highest level of at-tainment was upper secondary education, 38 percent earned more than the country’s median income in 2008, lower than in all other reporting G-8 countries. Among U.S. adults who had completed academic higher education, 69 percent earned more than the median income in 2008; the corresponding per-centages in the other G-8 countries ranged from 67 percent in Canada to 76 percent in France.
G-8 Countries Included: Canada, France, Germany, Italy, Japan, United Kingdom, United States
DISTRIBUTION OF POPULATION BY EDUCATION AND INCOME
This indicator compares the 2008 income distributions of adults ages 25 to 64 at three different levels of educational attainment: lower secondary education or below, upper secondary education,24 and academic higher education. Income comparisons are made relative to each country’s respective median income. For instance, in 2008, the median annual income in the United States for people age 15 and older was about $31,000 (U.S. Census Bureau 2009); those earning more than two times the U.S. median income would have had an average annual income of over $62,000, and those earning at or below half of the U.S. median income would have had an average annual income of $15,500 or less. As shown in this indicator, in all reporting G-8 countries, adults with a higher level of education tended to earn more than those with a lower level of education.
Among U.S. 25- to 64-year-olds whose highest level of educational attainment was lower secondary education or below, 16 percent earned more than the median income in 2008; this percentage was lower than that in any other reporting G-8 country, with percentages ranging from 21 percent in the United Kingdom to 40 percent in Germany (figure 21-1). Two percent of U.S. adults with this level of education earned more than two times the median income; the corresponding percentages in the other G-8 countries ranged from 1 percent in the United Kingdom to
7 percent in Italy and Canada (table 21-1). In contrast, 44 percent of U.S. adults with a lower secondary education or below earned at or below half of the median income, which was higher than in any other reporting G-8 country, with percentages ranging from 18 percent in France and Italy to 39 percent in Canada.
Among U.S. 25- to 64-year-olds whose highest level of educational attainment was upper secondary education, 38 percent earned more than the median income in 2008; this percentage was lower than that in any other reporting G-8 country, with percentages ranging from 41 percent in the United Kingdom to 56 percent in Italy (figure 21-1). (Only in Italy did more than half of the adults with this level of education earn more than the median income.) Eight percent of U.S. adults with an upper secondary education earned more than two times the median income; the corresponding percentages in the other G-8 countries ranged from 5 percent in Germany and France to 13 percent in Italy (table 21-1). In contrast, 24 percent of U.S. adults with this level of education earned at or below half the median income; in the other G-8 countries, the corresponding percentages ranged from 9 percent in Italy to 29 percent in Japan and Canada.
Among U.S. 25-to 64-year-olds who had completed academic higher education, 69 percent earned more than the median income in 2008; the corresponding percentages in the other G-8 countries ranged from 67 percent in Canada to 76 percent in France (figure 21-1). Thirty percent of U.S. adults with this level of education earned more than two times the median income; the corresponding percentages in the other G-8 countries ranged from 27 percent in France and Italy to 35 percent in Japan (table 21-1). In contrast, 12 percent of U.S. adults who had completed academic higher education earned at or below half the median income; the corresponding percentages in the other G-8 countries ranged from 6 percent in France to 17 percent in Canada.
Definitions and Methodology
Income refers to pretax income.
As shown in the table and figure, education levels are defined according to the 1997 International Standard Classification of Education (ISCED97). For more information on the ISCED97 levels, see appendix A. Individuals whose highest level of education is
academic higher education have completed at least a first university degree program, which prepares students for advanced research and highly qualified professions. First university degree programs vary in duration in different countries in different programs of study. In the United States, the first university degree corresponds to a bachelor’s degree; it excludes associate’s degrees.
24 In this indicator, the category of “upper secondary education” also includes postsecondary nontertiary programs. See figure 21-1 and appendix A for more information on education levels.
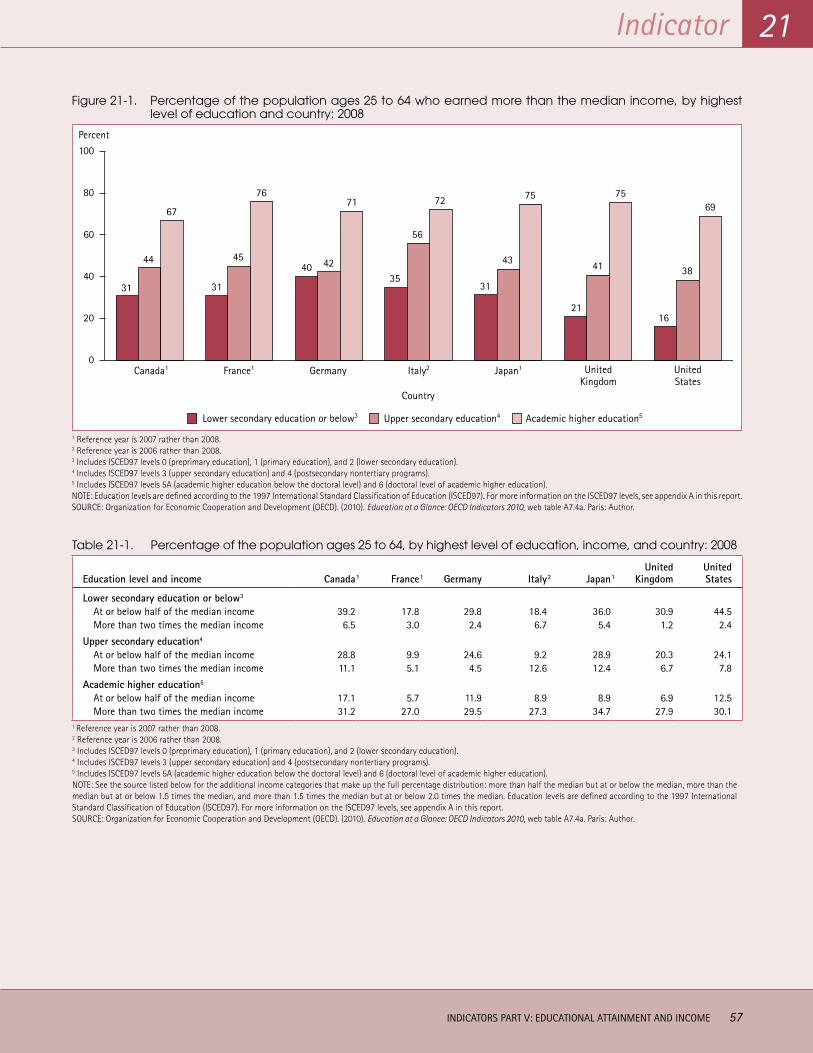
Indicator 21
INDICATORS PART V: EDUCATIONAL ATTAINMENT AND INCOME 57
Figure 21-1. Percentage of the population ages 25 to 64 who earned more than the median income, by highest level of education and country: 2008
31
44
67
31
45
76
40 42
71
35
56
72
31
43
75
21
41
75
16
38
69
0
20
40
60
80
100
Percent
Canada1
Country
GermanyFrance1 Italy2 Japan1 UnitedKingdom
UnitedStates
Academic higher education5Upper secondary education4Lower secondary education or below3
1 Reference year is 2007 rather than 2008.2 Reference year is 2006 rather than 2008. 3 Includes ISCED97 levels 0 (preprimary education), 1 (primary education), and 2 (lower secondary education). 4 Includes ISCED97 levels 3 (upper secondary education) and 4 (postsecondary nontertiary programs). 5 Includes ISCED97 levels 5A (academic higher education below the doctoral level) and 6 (doctoral level of academic higher education). NOTE: Education levels are defined according to the 1997 International Standard Classification of Education (ISCED97). For more information on the ISCED97 levels, see appendix A in this report. SOURCE: Organization for Economic Cooperation and Development (OECD). (2010). Education at a Glance: OECD Indicators 2010, web table A7.4a. Paris: Author.
Table 21-1. Percentage of the population ages 25 to 64, by highest level of education, income, and country: 2008
Education level and income Canada1 France1 Germany Italy2 Japan1United
KingdomUnited States
Lower secondary education or below3
At or below half of the median income 39.2 17.8 29.8 18.4 36.0 30.9 44.5More than two times the median income 6.5 3.0 2.4 6.7 5.4 1.2 2.4
Upper secondary education4
At or below half of the median income 28.8 9.9 24.6 9.2 28.9 20.3 24.1More than two times the median income 11.1 5.1 4.5 12.6 12.4 6.7 7.8
Academic higher education5
At or below half of the median income 17.1 5.7 11.9 8.9 8.9 6.9 12.5More than two times the median income 31.2 27.0 29.5 27.3 34.7 27.9 30.1
1 Reference year is 2007 rather than 2008.2 Reference year is 2006 rather than 2008.3 Includes ISCED97 levels 0 (preprimary education), 1 (primary education), and 2 (lower secondary education).4 Includes ISCED97 levels 3 (upper secondary education) and 4 (postsecondary nontertiary programs).5 Includes ISCED97 levels 5A (academic higher education below the doctoral level) and 6 (doctoral level of academic higher education).NOTE: See the source listed below for the additional income categories that make up the full percentage distribution: more than half the median but at or below the median, more than the median but at or below 1.5 times the median, and more than 1.5 times the median but at or below 2.0 times the median. Education levels are defined according to the 1997 International Standard Classification of Education (ISCED97). For more information on the ISCED97 levels, see appendix A in this report. SOURCE: Organization for Economic Cooperation and Development (OECD). (2010). Education at a Glance: OECD Indicators 2010, web table A7.4a. Paris: Author.

REFERENCES 59
REFERENCESCentral Intelligence Agency. (2011). The World Factbook.
Washington, DC: Author. Retrieved April 26, 2011, from https://www.cia.gov/library/publications/the-world-factbook/index.html.
International Labor Organization. (1988). International Standard Classification of Occupations (ISCO-88). Geneva: Author.
Miller, D.C., Sen, A., Malley, L.B., and Burns, S.D. (2009). Comparative Indicators of Education in the United States and Other G-8 Countries: 2009 (NCES 2009-039). U.S. Department of Education, National Center for Education Statistics. Washington, DC: U.S. Government Printing Office.
Organization for Economic Cooperation and Development (OECD). (forthcoming). PISA 2009 Technical Report. Paris: Author.
Organization for Economic Cooperation and Development (OECD). (2002). Education at a Glance: OECD Indicators 2002. Paris: Author.
Organization for Economic Cooperation and Development (OECD). (2003). The PISA 2003 Assessment Framework—Mathematics, Reading, Science and Problem Solving Knowledge and Skills. Paris: Author.
Organization for Economic Cooperation and Development (OECD). (2006). Assessing Scientific, Reading, and Mathematical Literacy: A Framework for PISA 2006. Paris: Author.
Organization for Economic Cooperation and Development (OECD). (2009). PISA 2009 Assessment Framework: Key Competencies in Reading, Mathematics, and Science. Paris: Author.
Organization for Economic Cooperation and Development (OECD). (2010a). Education at a Glance: OECD Indicators 2010. Paris: Author.
Organization for Economic Cooperation and Development (OECD). (2010b). National Accounts of OECD Countries 2010, Volume I, Main Aggregates. Paris: Author.
Organization for Economic Cooperation and Development (OECD). (2010c). PISA 2009 Results: What Students Know and Can Do—Student Performance in Reading, Mathematics and Science (Volume I). Paris: Author.
Snyder, T.D., and Dillow, S.A. (2011). Digest of Education Statistics 2010 (NCES 2011-015). National Center for Education Statistics, Institute of Education Sciences, U.S. Department of Education. Washington, DC.
United Nations Educational, Scientific and Cultural Organization. (1997). International Standard Classification of Education, ISCED97 1997. Montreal, Canada: Author.
U.S. Census Bureau, Current Population Survey. (2009). Annual Social and Economic Supplement. Retrieved October 21, 2010, from http://www.census.gov/hhes/www/cpstables/032009/perinc/new05_001.htm.

APPENDIX AThe Education Systems of
the G-8 Countries
APPENDIX A

APPENDIX A: THE EDUCATION SYSTEMS OF THE G-8 COUNTRIES 63
THE EDUCATION SYSTEMS OF THE G-8 COUNTRIESReader’s Guide: Education System ChartsDifferences in the structure of countries’ education systems often make international comparisons difficult. To improve the comparability of education indicators, the United Nations Educational, Scientific and Cultural Organization (UNESCO) created an internationally comparable method for describing levels of education across countries called the International Standard Classification of Education (ISCED). This classification system was revised in 1997, and is referred to as ISCED97. Using the ISCED97 classifications as a starting point, NCES worked with education professionals in the G-8 countries to create an overview of each country’s education system.
There are differences within the education systems of some G-8 countries because responsibilities and oversight for education take place at the regional or local level. However, the charts and accompanying text in this appendix are intended to give the reader a general overview of the education system of each G-8 country, from the preprimary to the doctoral level.
As indicated in the source note for each country chart, the information summarizing each country’s education system comes largely from the previous Comparative Indicators report (Miller et al. 2009). However, some modifications were made based on updated online resources and comments received from international reviewers.
The reader is encouraged to seek out additional resources to gain a fuller and deeper understanding of each country’s education system. A list of websites with additional information is provided at the end of this Reader’s Guide, and additional sources are cited after each country’s education system is presented.
How to read the charts
Each of the charts on the following pages is a broad representation of the education system of a G-8 country. The charts are not intended to show all possible pathways that a student can take or the many configurations of grades that may be found within the same school. Rather, each chart is intended to provide a general description that is useful for comparison across the G-8 countries.
The colors on each chart correspond to ISCED97 levels (see next section). The ISCED97 term for each level of education is written within each block. The terms in italics in each block are a country’s designation for that particular level (e.g., high school for upper secondary school). The left side of each chart is labeled with the typical ages corresponding to each level of education. The age labels represent the typical age at which a student begins the corresponding year of schooling; often, students are 1 year older at the end of the school year. Ages in bold text are the ages at which enrollment is universal, defined here as an enrollment rate
of more than 90 percent. The rectangular box encasing some ages represents the range of ages at which enrollment is compulsory, or required by law. (See also indicator 2 for information on the age range at which more than 90 percent of the population is enrolled in formal education and the ending age of compulsory education.) The expected duration of a first university degree program, a bachelor’s degree program in the United States, is listed in the note below each chart. On the right side of each chart are the years of schooling (“grade,” in the United States) corresponding to each level of education. The first year of schooling corresponds to the first year of compulsory education. The ages and years listed assume normal progress through the education system.
ISCED97 levels
The ISCED97 is a classification framework that allows for the alignment of the content of education systems using multiple classification criteria. The ISCED97 levels address the intent (e.g., to study basic subjects or prepare students for university) of each year of a particular education system, but do not indicate the depth or rigor of study in that year. Thus, the ISCED97 is useful when comparing the age range of students in upper secondary schools across nations; however, it does not indicate whether the curriculum and standards are equivalent within the same year of schooling across nations. The ISCED97 allows researchers to compile statistics on education internationally. The ISCED97 levels are as follows:• ISCED97 level 0 is classified as preprimary education. This is
defined as the initial stage of organized instruction, designed primarily to introduce very young children to a school-type environment. ISCED97 level 0 programs can either be center or school based. Preschool and kindergarten programs in the United States fall into the level 0 category, although kindergarten is typically considered an elementary grade in the United States.
• ISCED97 level 1 consists of primary education, which usually lasts 4 to 6 years. ISCED97 level 1 typically begins between ages 5 and 7, and is the stage where students begin to study basic subjects, such as reading, writing, and mathematics. In the United States, elementary school (grades 1 through 6) is classified as level 1.
• At ISCED97 level 2, or lower secondary education, students continue to learn the basic subjects taught in level 1, but this level is typically more subject specific than level 1 and may be taught by specialized teachers. ISCED97 level 2 usually lasts between 2 and 6 years, and begins around the age of 11. Middle school and junior high (grades 7 through 9) in the United States are classified as level 2.
• At ISCED97 level 3, or upper secondary education, student coursework is generally subject specific and often taught by
64 APPENDIX A: THE EDUCATION SYSTEMS OF THE G-8 COUNTRIES
specialized teachers. Students often enter upper secondary education at the age of 15 or 16 and attend anywhere from 2 to 5 years. ISCED97 level 3 can prepare students for university, further schooling, or the labor force. Senior high school (grades 10 through 12) is considered level 3 in the United States.
• ISCED97 level 4 programs consist of postsecondary nontertiary programs. Postsecondary nontertiary programs are primarily vocational and are taken after the completion of secondary school, though the content is not more advanced than the content of secondary school courses. Although not included in the charts, postsecondary nontertiary programs are described in the text. ISCED97 level 4 programs in the United States are often in the form of 1-year certificate programs.
• Tertiary programs1 are divided into ISCED97 levels 5A, 5B, and 6. ISCED97 level 5A refers to academic higher education below the doctoral level. Level 5A programs are intended to provide sufficient qualifications to gain entry into advanced research programs and professions with high skill requirements. The international classification includes programs of medium length that last less than 5 years and long programs that last 5 to 7 years. In the United States, bachelor’s, master’s, and first professional degree programs are classified as ISCED97 level 5A. ISCED97 level 5B refers to vocational higher education. Level 5B programs provide a higher level of career and technical education and are designed to prepare students for the labor market. In the international classification, these programs last 2 to 4 years. In the United States, associate’s degree programs are classified at this level. ISCED97 level 6 refers to the doctoral level of academic higher education. Level 6 programs usually require the completion of a research thesis or dissertation.
Text format
The text accompanying each chart is meant to give the reader more detail on each country’s education system. The bulleted format is designed to make quick comparisons more convenient, and the text is divided into sections corresponding to the ISCED97 levels. The “NOTE” heading in each section presents information that is important, but that may not be included in either the chart or the bulleted text, including within-country variations or features of the education system that are unique to a particular country.
Websites with additional information
Canada: http://www.statcan.ca/english/freepub/81-582-XIE/free.htm (see appendix 1)
France: http://www.eurydice.org
Germany: http://www.eurydice.org
Italy: http://www.eurydice.org
Japan: http://www.mext.go.jp/english/
Russian Federation: http://www.euroeducation.net/prof/russco.htm
United Kingdom:
England, Wales, and Northern Ireland: http://www.eurydice.org
Scotland: http://www.eurydice.org
United States: http://www2.ed.gov/about/offices/list/ous/interna-tional/usnei/us/edlite-structure-us.html
1 In the international classification, more advanced postsecondary education (such as attending a 4-year college or university) is referred to as “tertiary education.” In the current report, the term “higher education” is used because this term is more familiar to American readers.
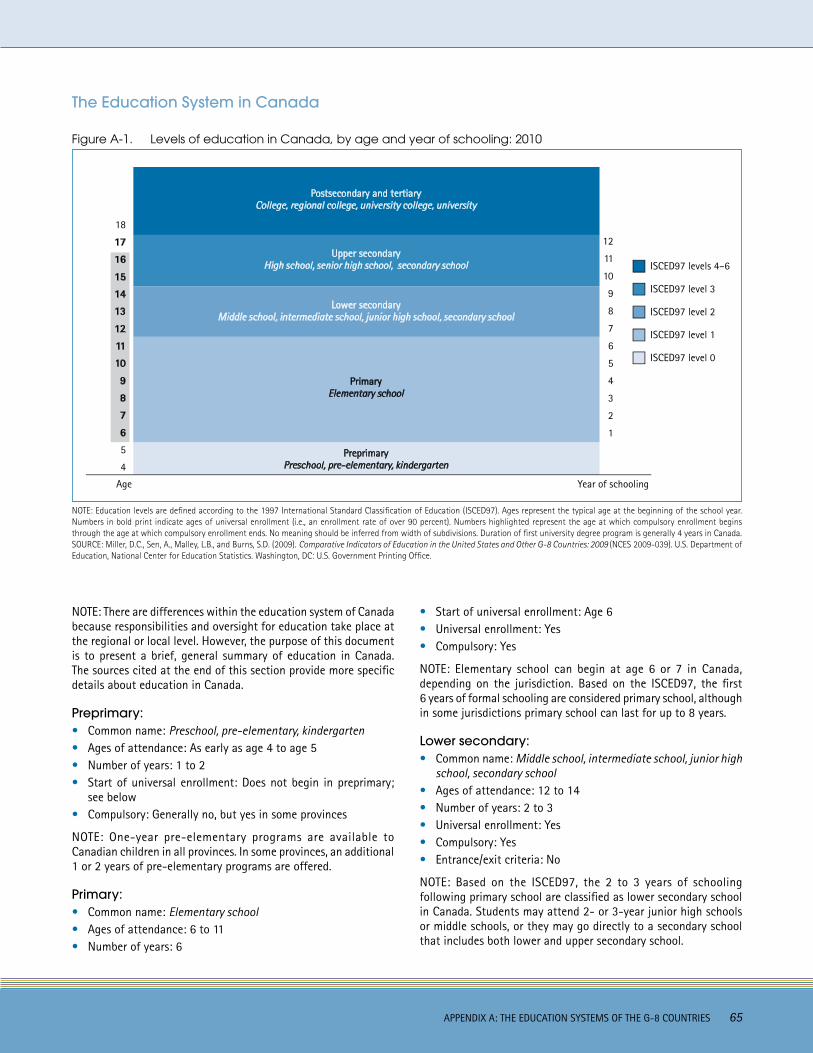
APPENDIX A: THE EDUCATION SYSTEMS OF THE G-8 COUNTRIES 65
The Education System in Canada
Figure A-1. Levels of education in Canada, by age and year of schooling: 2010
PreprimaryPreschool, pre-elementary, kindergarten
Postsecondary and tertiaryCollege, regional college, university college, university
PrimaryElementary school
Lower secondaryMiddle school, intermediate school, junior high school, secondary school
ISCED97 levels 4–6
ISCED97 level 0
ISCED97 level 1
ISCED97 level 2
ISCED97 level 3
Upper secondaryHigh school, senior high school, secondary school
Year of schoolingAge
18
17
16
15
14
13
12
11
10
9
8
6
7
5
4
12
11
10
9
8
6
7
5
4
3
2
1
NOTE: Education levels are defined according to the 1997 International Standard Classification of Education (ISCED97). Ages represent the typical age at the beginning of the school year. Numbers in bold print indicate ages of universal enrollment (i.e., an enrollment rate of over 90 percent). Numbers highlighted represent the age at which compulsory enrollment begins through the age at which compulsory enrollment ends. No meaning should be inferred from width of subdivisions. Duration of first university degree program is generally 4 years in Canada.SOURCE: Miller, D.C., Sen, A., Malley, L.B., and Burns, S.D. (2009). Comparative Indicators of Education in the United States and Other G-8 Countries: 2009 (NCES 2009-039). U.S. Department of Education, National Center for Education Statistics. Washington, DC: U.S. Government Printing Office.
NOTE: There are differences within the education system of Canada because responsibilities and oversight for education take place at the regional or local level. However, the purpose of this document is to present a brief, general summary of education in Canada. The sources cited at the end of this section provide more specific details about education in Canada.
Preprimary:• Common name: Preschool, pre-elementary, kindergarten• Ages of attendance: As early as age 4 to age 5 • Number of years: 1 to 2• Start of universal enrollment: Does not begin in preprimary;
see below • Compulsory: Generally no, but yes in some provinces
NOTE: One-year pre-elementary programs are available to Canadian children in all provinces. In some provinces, an additional 1 or 2 years of pre-elementary programs are offered.
Primary:• Common name: Elementary school• Ages of attendance: 6 to 11• Number of years: 6
• Start of universal enrollment: Age 6• Universal enrollment: Yes• Compulsory: Yes
NOTE: Elementary school can begin at age 6 or 7 in Canada, depending on the jurisdiction. Based on the ISCED97, the first 6 years of formal schooling are considered primary school, although in some jurisdictions primary school can last for up to 8 years.
Lower secondary:• Common name: Middle school, intermediate school, junior high
school, secondary school• Ages of attendance: 12 to 14• Number of years: 2 to 3• Universal enrollment: Yes• Compulsory: Yes• Entrance/exit criteria: No
NOTE: Based on the ISCED97, the 2 to 3 years of schooling following primary school are classified as lower secondary school in Canada. Students may attend 2- or 3-year junior high schools or middle schools, or they may go directly to a secondary school that includes both lower and upper secondary school.
66 APPENDIX A: THE EDUCATION SYSTEMS OF THE G-8 COUNTRIES
Upper secondary:• Common name: High school, senior high school, secondary
school• Ages of attendance: 15 to 17 (graduation generally at age 18)• Number of years: 3• Universal enrollment: Through age 17• Compulsory: Until age 16 in most jurisdictions; until 18 or
graduation in New Brunswick• Entrance/exit criteria: Some provinces have what could be
considered an exit exam (e.g., Ontario administers a grade 10 literacy test, and Quebec requires that students take core subject exams, which are a significant part of the graduation requirements).
NOTE: Based on the ISCED97, the last 3 years of schooling prior to receiving a high school diploma are classified as upper secondary school in Canada. Senior high schools may be up to 4 years in length, and many students attend secondary schools that include both lower and upper secondary school programs.
Postsecondary and tertiary:• Common name: College, regional college, university college,
university• Ages of attendance: Varies• Number of years: Varies according to degree• Universal enrollment: No • Entrance criteria: Graduation from a secondary school academic
or university preparatory program—or, in the case of Quebec, completion of a 2-year pre-university program—is typically the minimum requirement to be eligible for admission to undergraduate degree programs. However, most institutions and/or departments set their own admissions standards, often with more rigorous requirements.
Common degree programs:• Pre-university programs: 2-year programs that students in
Quebec are generally required to complete before they are eligible to attend university.
• Certificate: 1-year programs offered at colleges, regional colleges, community colleges, institutes, and colleges of applied arts and technology (the name depends on the jurisdiction). These programs are vocational and are oriented toward preparing students for the labor force in semiprofessional and technical fields.
• Diploma: 2- to 3-year programs offered at community colleges, regional colleges, etc. These programs are vocational and are oriented toward preparing students for the labor force in semiprofessional and technical fields.
• Bachelor’s degree: 3- to 4-year academic programs at a university college or university. (University bachelor’s degree programs are usually 4 years, while university college programs can be 3 or 4 years.)
• Master’s degree: Graduate programs at a university requiring 1 to 2 years beyond the bachelor’s degree. This degree is designed to prepare students for professional careers.
• Doctorate: Academic graduate programs at a university requiring 3 to 5 years after the bachelor’s degree. Doctoral programs prepare students for careers in research.
Sources:
Canadian Education Statistics Council. (2003). Report of the Pan-Canadian Education Indicators Program, appendix 1. Ontario, Canada: Statistics Canada. Retrieved December 15, 2010, from http://www.cesc.ca/pceip/PCEIP2003en.pdf.
Marlow-Ferguson, R. (Ed.) (2002). World Education Encyclopedia: A Survey of Educational Systems Worldwide, Vol. 1 (2nd ed.). Farmington Hills, MI: Gale Group.
Organization for Economic Cooperation and Development. (1996). Education at a Glance: OECD Indicators. Paris: Author.
Robitaille, D.F. (1997). National Contexts for Mathematics and Science Education: An Encyclopedia of the Education Systems Participating in TIMSS. Vancouver, Canada: Pacific Educational Press.
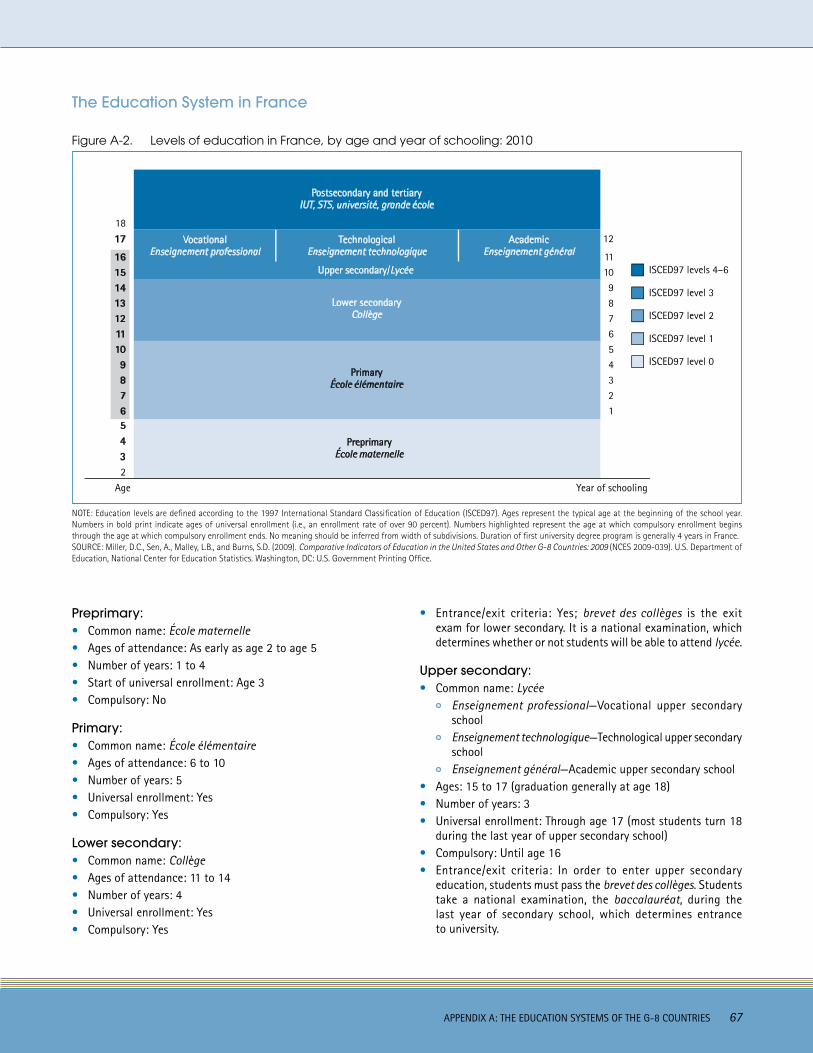
APPENDIX A: THE EDUCATION SYSTEMS OF THE G-8 COUNTRIES 67
The Education System in France
Figure A-2. Levels of education in France, by age and year of schooling: 2010
ISCED97 levels 4–6
ISCED97 level 0
ISCED97 level 1
ISCED97 level 2
ISCED97 level 3
Year of schoolingAge
PreprimaryÉcole maternelle
Postsecondary and tertiaryIUT, STS, université, grande école
PrimaryÉcole élémentaire
Lower secondaryCollège
VocationalEnseignement professional
AcademicEnseignement général
TechnologicalEnseignement technologique
18
17
1615141312111098
67
5432
12
111098
67
54321
Upper secondary/Lycée
NOTE: Education levels are defined according to the 1997 International Standard Classification of Education (ISCED97). Ages represent the typical age at the beginning of the school year. Numbers in bold print indicate ages of universal enrollment (i.e., an enrollment rate of over 90 percent). Numbers highlighted represent the age at which compulsory enrollment begins through the age at which compulsory enrollment ends. No meaning should be inferred from width of subdivisions. Duration of first university degree program is generally 4 years in France.SOURCE: Miller, D.C., Sen, A., Malley, L.B., and Burns, S.D. (2009). Comparative Indicators of Education in the United States and Other G-8 Countries: 2009 (NCES 2009-039). U.S. Department of Education, National Center for Education Statistics. Washington, DC: U.S. Government Printing Office.
Preprimary:• Common name: École maternelle• Ages of attendance: As early as age 2 to age 5• Number of years: 1 to 4• Start of universal enrollment: Age 3• Compulsory: No
Primary:• Common name: École élémentaire• Ages of attendance: 6 to 10• Number of years: 5• Universal enrollment: Yes• Compulsory: Yes
Lower secondary: • Common name: Collège• Ages of attendance: 11 to 14• Number of years: 4• Universal enrollment: Yes• Compulsory: Yes
• Entrance/exit criteria: Yes; brevet des collèges is the exit exam for lower secondary. It is a national examination, which determines whether or not students will be able to attend lycée.
Upper secondary:• Common name: Lycée
Enseignement professional—Vocational upper secondary schoolEnseignement technologique—Technological upper secondary schoolEnseignement général—Academic upper secondary school
• Ages: 15 to 17 (graduation generally at age 18)• Number of years: 3• Universal enrollment: Through age 17 (most students turn 18
during the last year of upper secondary school) • Compulsory: Until age 16• Entrance/exit criteria: In order to enter upper secondary
education, students must pass the brevet des collèges. Students take a national examination, the baccalauréat, during the last year of secondary school, which determines entrance to university.
68 APPENDIX A: THE EDUCATION SYSTEMS OF THE G-8 COUNTRIES
NOTE: All three types of upper secondary school (enseignement professional, technologique, and général) qualify a student to enter university, although certain tracks are more likely to lead to university: the academic branch (enseignement général) typically leads to university and other forms of higher education; the technological branch (enseignement technologique) may also lead to specialized technological or professional forms of higher education; and the vocational branch (enseignement professional) more often leads to the labor force and/or job training.
Postsecondary and tertiary:• Common name: IUT, STS, université, grande école • Ages of attendance: Varies• Number of years: Varies according to degree or program• Universal enrollment: No• Entrance criteria: In order to enter into higher education
programs in France, students are required to have passed the baccalauréat or an equivalent. Entrance to the university is nonselective, meaning that students who have passed the baccalauréat are entitled to enter. There are, however, competitive entrance exams for the grandes écoles.
Common programs (short fields):• DUT (University degree in technology): Taken at the University
Institute of Technology (IUT). Two-year program in mostly vocational subjects. Student may choose to continue on toward a license (see section below).
• BTS (Higher technical diploma): Two-year program taken in higher education departments of lycées (STS, Institute for Higher Technical Studies); more specialized than degrees from IUT, but also in mostly vocational subjects.
• DEUG (General university studies degree): Academic degree received after completion of 2 years of university.
Common degree programs (long fields):• License: DEUG (see above) plus 1 additional year at university.• Maîtrise: Degree following the license. Requires 1 additional
year at university.
• DESS (Diploma of specialized higher studies): Follows the maîtrise; 1-year professional course involving a required internship.
• DEA (Diploma of advanced studies): Follows the maîtrise; 1-year program designed to prepare students for doctoral research. Involves the preparation of a research project.
• Medical doctor/dental/pharmacy: Degree programs taken at the university. Length of program varies and can lead to degrees such as the doctorat de médecine specializé, doctorat de médecine generale, and doctorat pharmacie.
• Doctorat: Research-based graduate degree program at a university, leading to a doctorate. Usually requires 5 years of study beyond the maîtrise.
• Diplôme grande école: Competitive degree programs (students must pass a selective entrance exam) in academic subjects, science, commerce, management, engineering, business, and architecture. These are typically 5-year programs and are taken at the grandes écoles.
Sources:
Eurybase. (2009). The Information Database on Education Systems in Europe: Organization of the Education System in France, 2008/2009. Brussels: Eurydice. Retrieved December 15, 2010, from http://eacea.ec.europa.eu/education/eurydice/documents/eurybase/eurybase_full_reports/FR_EN.pdf.
Marlow-Ferguson, R. (Ed.) (2002). World Education Encyclopedia: A Survey of Educational Systems Worldwide, Vol. 1 (2nd ed.). Farmington Hills, MI: Gale Group.
Organization for Economic Cooperation and Development. (1996). Education at a Glance: OECD Indicators. Paris: Author.
Robitaille, D.F. (1997). National Contexts for Mathematics and Science Education: An Encyclopedia of the Education Systems Participating in TIMSS. Vancouver, Canada: Pacific Educational Press.
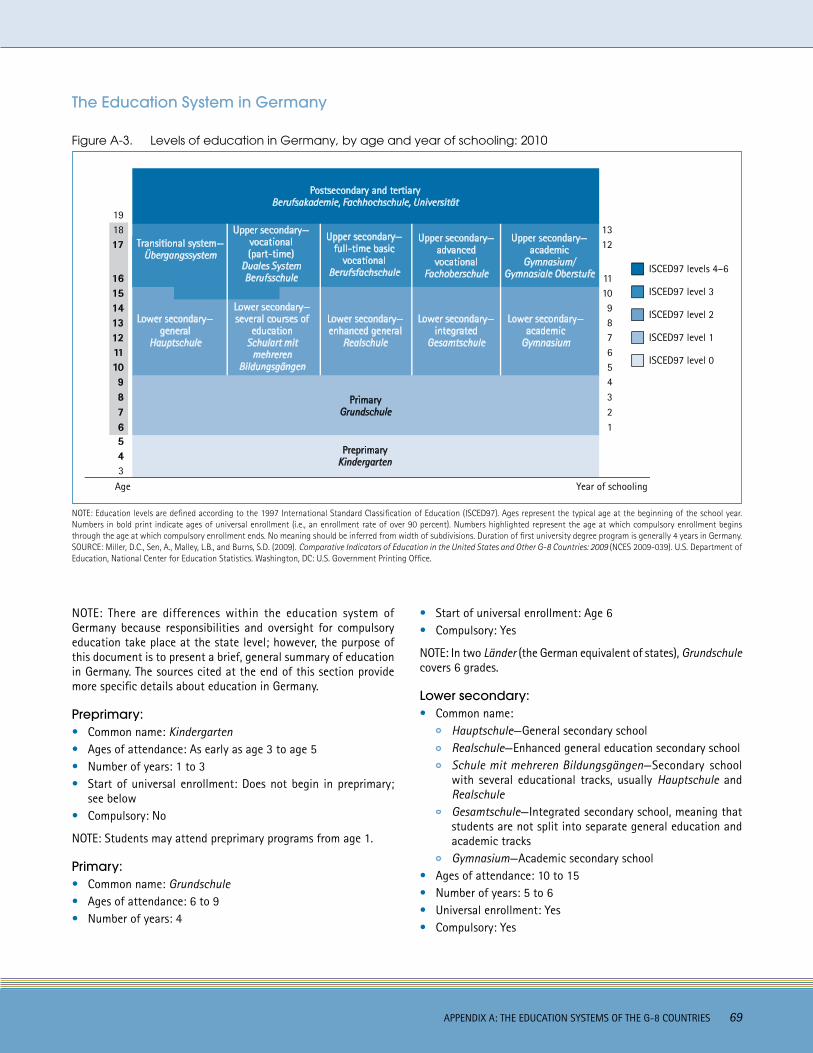
APPENDIX A: THE EDUCATION SYSTEMS OF THE G-8 COUNTRIES 69
The Education System in Germany
Figure A-3. Levels of education in Germany, by age and year of schooling: 2010
ISCED97 levels 4–6
ISCED97 level 0
ISCED97 level 1
ISCED97 level 2
ISCED97 level 3
Year of schoolingAge
1819
17
1615141312111098
67
543
1213
111098
67
54321
PreprimaryKindergarten
Lower secondary— general
Hauptschule
Lower secondary— enhanced general
Realschule
Lower secondary— several courses of
educationSchulart mit
mehreren Bildungsgängen
Lower secondary— academic
Gymnasium
Lower secondary— integrated
Gesamtschule
Upper secondary— academic
Gymnasium/Gymnasiale Oberstufe
Upper secondary—full-time basic
vocational Berufsfachschule
Upper secondary— advanced vocational
Fachoberschule
Transitional system— Übergangssystem
PrimaryGrundschule
Postsecondary and tertiaryBerufsakademie, Fachhochschule, Universität
Upper secondary—vocational(part-time)
Duales System Berufsschule
NOTE: Education levels are defined according to the 1997 International Standard Classification of Education (ISCED97). Ages represent the typical age at the beginning of the school year. Numbers in bold print indicate ages of universal enrollment (i.e., an enrollment rate of over 90 percent). Numbers highlighted represent the age at which compulsory enrollment begins through the age at which compulsory enrollment ends. No meaning should be inferred from width of subdivisions. Duration of first university degree program is generally 4 years in Germany. SOURCE: Miller, D.C., Sen, A., Malley, L.B., and Burns, S.D. (2009). Comparative Indicators of Education in the United States and Other G-8 Countries: 2009 (NCES 2009-039). U.S. Department of Education, National Center for Education Statistics. Washington, DC: U.S. Government Printing Office.
NOTE: There are differences within the education system of Germany because responsibilities and oversight for compulsory education take place at the state level; however, the purpose of this document is to present a brief, general summary of education in Germany. The sources cited at the end of this section provide more specific details about education in Germany.
Preprimary:• Common name: Kindergarten• Ages of attendance: As early as age 3 to age 5• Number of years: 1 to 3• Start of universal enrollment: Does not begin in preprimary;
see below• Compulsory: No
NOTE: Students may attend preprimary programs from age 1.
Primary:• Common name: Grundschule• Ages of attendance: 6 to 9• Number of years: 4
• Start of universal enrollment: Age 6• Compulsory: Yes
NOTE: In two Länder (the German equivalent of states), Grundschule covers 6 grades.
Lower secondary: • Common name:
Hauptschule—General secondary schoolRealschule—Enhanced general education secondary schoolSchule mit mehreren Bildungsgängen—Secondary school with several educational tracks, usually Hauptschule and RealschuleGesamtschule—Integrated secondary school, meaning that students are not split into separate general education and academic tracksGymnasium—Academic secondary school
• Ages of attendance: 10 to 15• Number of years: 5 to 6• Universal enrollment: Yes• Compulsory: Yes
70 APPENDIX A: THE EDUCATION SYSTEMS OF THE G-8 COUNTRIES
• Entrance/exit criteria: Based on a transition referral of the primary school. If parents disagree, in some Länder, admissions tests determine if a student can take the education tracks of Realschule or Gymnasium.
NOTE: There are different types of secondary schools, some combining Hauptschule and Realschule (for reporting purposes this type is referred to as Schule mit mehreren Bildungsgängen). The secondary school a student in Germany attends is determined by a combination of factors, depending on the Länder: admissions tests, previous grade point average, teacher recommendations, and parents’ wishes. The degree of flexibility that parents have in choosing which educational track their child enters also varies between Länder.
However, the type of school a student attends is sometimes less important than the chosen track: at the end of lower secondary, all students who meet the requirements receive a leaving certificate. At the Hauptschule it is generally the Hauptschulabschluss. In some Länder, students who excel may receive a Qualifizierter Hauptschulabschluss at the end of grade 9. In some Länder, students may obtain a Realschulabschluss on completing grade 10. (At the Realschule, students typi-cally receive the Realschulabschluss (also called the Mittlere Schulabschluss), and at the Gesamtschule, both types of diplomas are offered). All students attending Gymnasium who advance to the upper secondary level automatically receive the Realschulabschluss.
Some Länder also have an orientation phase during the first 2 years of lower secondary school, which gives parents and teachers 2 more years to decide a child’s educational path. In Länder with a 6-year primary school, lower secondary school is 2 years shorter.
Upper secondary:• Common name:
Übergangssystem: 3- to 4-year vocational full-time instruction for young people who do not have a training contract, helping them to choose a career and providing them with vocational basic training or with an introduction to one or two occupational fields. It does not lead to a vocational school qualification.Berufsschule: 3- to 4-year vocational school, which regularly includes an apprenticeship; students at this school attend part time while also doing an apprenticeship.Berufsfachschule: 1- to 3-year full-time basic vocational schoolFachoberschule: 2-year advanced vocational schoolGymnasiale Oberstufe: Academic upper secondary school. May continue from lower secondary Gymnasium or Gesamtschule. Comprises grades 11 to 13 or 10 to 12.
• Ages: Generally 16 to 18 (graduation at 18 or 19)• Number of years: 1 to 4• Universal enrollment: Through age 18
• Compulsory: Until age 18 • Entrance/exit criteria: Students must pass the Abitur, the
general higher education entrance qualification for university entrance. Through certain courses of vocational education at upper secondary level, students may pass the Fachabitur and obtain a qualification entitling the holder to study particular subjects at a higher education institution.
NOTE: Gymnasium and Gesamtschule are generally combined lower and upper secondary schools, although students concentrate their studies on fewer subjects during the Gymnasiale Oberstufe. In most Länder there is currently a gradual conversion from a 9-year to an 8-year Gymnasium course of education. Additionally, a few Länder offer the Berufsoberschule, a vocational upper secondary school for those who have completed vocational training or have 5 years of work experience.
Postsecondary and tertiary:• Common name: Berufsakademie, Fachhochschule, Universität• Ages of attendance: Varies• Number of years: Varies according to degree• Universal enrollment: No• Entrance criteria: Students must pass the Abitur (general higher
education entrance qualification) in order to enter university. Students must have at a minimum the Fachabitur (vocational upper secondary diploma) in order to enter the tertiary sector.
Common degree programs:• Diplom Berufsakademie—BA: 3-year program of academic
training combined with work experience. Offered at a Berufsakademie.
• Diplom Fachhochschule—FH: 4-year degree program in applied fields such as engineering, administration, social services, and design. Admission to a Fachhochschule is competitive because of restricted numbers of available spaces. Within the framework of the Bologna process, study programs in tertiary education move from Diplom to Bachelor and Master programs.
• Diplom Universität: Master’s degree equivalent usually requiring a minimum of 4 to 5 years of study. Universität offers this degree in academic fields as well as scientific, technical, and engineering fields. Within the framework of the Bologna process, study programs in tertiary education move from Diplom to Bachelor and Master programs.
• Bachelor: First university degree obtained after 3 to 4 years of study.
• Master: Second degree obtained after 1 to 2 years of study. Entrants must have obtained a Bachelor degree. Moreover, in some universities students must pass oral or written entrance examinations.
• Doktor: Doctoral degree program, focused on research and taken at university. Normally requires at least 2 years beyond the Diplom or Master.
APPENDIX A: THE EDUCATION SYSTEMS OF THE G-8 COUNTRIES 71
Sources:
Autorengruppe Bildungsberichterstattung. (2010). Bildung in Deutschland 2010. Ein indikatorengestützter Bericht mit einer Analyse zu Perspektiven des Bildungswesens im demografischen Wandel. Bielefeld: WBV. [Education in Germany 2010. An indicator-based report including an analysis of demographic challenges for the education system]
Avenarius, H. & Füssel, H.-P. (2010) (8. ed.). Schulrecht. Ein Handbuch für Praxis, Rechtsprechung und Wissenschaft. Kronach: Carl Link. [School laws. A handbook for practice, law and research]
Eurybase. (2007). The Information Database on Education Systems in Europe: The Education System in Germany, 2006/2007. Brussels: Eurydice. Retrieved December 15, 2008, from http://eacea.ec.europa.eu/ressources/eurydice/eurybase/pdf/0_integral/DE_EN.pdf.
German Education Server (Deutscher Bildungs Server). (2006). Glossary for the Education System in the Federal Republic of Germany. Chiefly compiled by the Standing Conference of the State Ministers of Education and the Arts in the Federal Republic of Germany (KMK). Retrieved October 31, 2006, from http://www.eduserver.de/glossare.html?sp=1.
Marlow-Ferguson, R. (Ed.) (2002). World Education Encyclopedia: A Survey of Educational Systems Worldwide, Vol. 1 (2nd ed.). Farmington Hills, MI: Gale Group.
Organization for Economic Cooperation and Development. (1996). Education at a Glance: OECD Indicators. Paris: Author.
Organization for Economic Cooperation and Development. (1999). INES Network A Newsletter, Issue 10. Paris: Author.
Robitaille, D.F. (1997). National Contexts for Mathematics and Science Education: An Encyclopedia of the Education Systems Participating in TIMSS. Vancouver, Canada: Pacific Educational Press.
Secretariat of the Standing Conference of the Ministers of Educa-tion and Cultural Affairs of the Länder in the Federal Republic of Germany. (2010). Glossary on Education. Institutions, Examinations, Qualifications, Titles and other Specialist Terms. Bonn: KMK. Retrieved April, 7, 2011, from http://www.kmk.org/fileadmin/doc/Dokumentation/Glossary_dt_ engl.pdf.
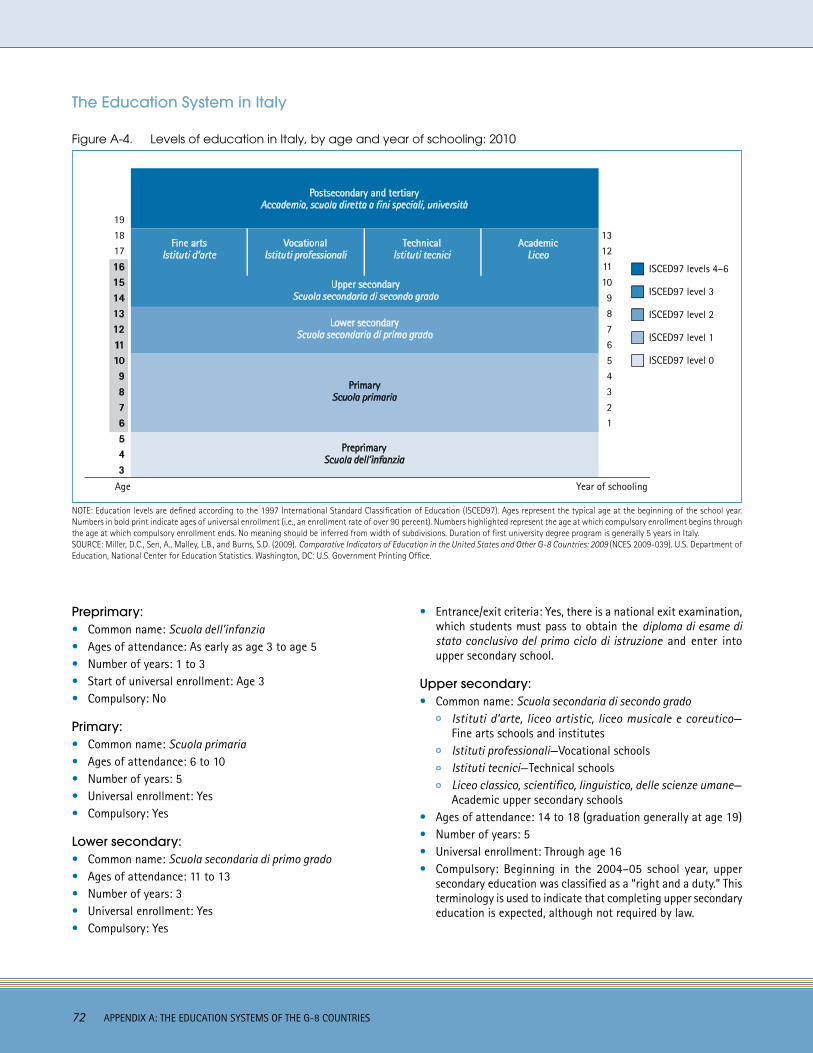
72 APPENDIX A: THE EDUCATION SYSTEMS OF THE G-8 COUNTRIES
The Education System in Italy
Figure A-4. Levels of education in Italy, by age and year of schooling: 2010
PreprimaryScuola dell’infanzia
Postsecondary and tertiaryAccademia, scuola diretta a fini speciali, università
Fine artsIstituti d’arte
VocationalIstituti professionali
TechnicalIstituti tecnici
AcademicLiceo
PrimaryScuola primaria
Lower secondaryScuola secondaria di primo grado
Upper secondaryScuola secondaria di secondo grado
ISCED97 levels 4–6
ISCED97 level 0
ISCED97 level 1
ISCED97 level 2
ISCED97 level 3
Year of schoolingAge
18
19
17
1615141312111098
67
543
12
13
11
10
9
8
6
7
5
4
3
2
1
NOTE: Education levels are defined according to the 1997 International Standard Classification of Education (ISCED97). Ages represent the typical age at the beginning of the school year. Numbers in bold print indicate ages of universal enrollment (i.e., an enrollment rate of over 90 percent). Numbers highlighted represent the age at which compulsory enrollment begins through the age at which compulsory enrollment ends. No meaning should be inferred from width of subdivisions. Duration of first university degree program is generally 5 years in Italy.SOURCE: Miller, D.C., Sen, A., Malley, L.B., and Burns, S.D. (2009). Comparative Indicators of Education in the United States and Other G-8 Countries: 2009 (NCES 2009-039). U.S. Department of Education, National Center for Education Statistics. Washington, DC: U.S. Government Printing Office.
Preprimary:• Common name: Scuola dell’infanzia• Ages of attendance: As early as age 3 to age 5• Number of years: 1 to 3• Start of universal enrollment: Age 3• Compulsory: No
Primary: • Common name: Scuola primaria• Ages of attendance: 6 to 10• Number of years: 5• Universal enrollment: Yes• Compulsory: Yes
Lower secondary:• Common name: Scuola secondaria di primo grado• Ages of attendance: 11 to 13• Number of years: 3• Universal enrollment: Yes• Compulsory: Yes
• Entrance/exit criteria: Yes, there is a national exit examination, which students must pass to obtain the diploma di esame di stato conclusivo del primo ciclo di istruzione and enter into upper secondary school.
Upper secondary:• Common name: Scuola secondaria di secondo grado
Istituti d’arte, liceo artistic, liceo musicale e coreutico— Fine arts schools and institutesIstituti professionali—Vocational schoolsIstituti tecnici—Technical schoolsLiceo classico, scientifico, linguistico, delle scienze umane—Academic upper secondary schools
• Ages of attendance: 14 to 18 (graduation generally at age 19)• Number of years: 5• Universal enrollment: Through age 16• Compulsory: Beginning in the 2004–05 school year, upper
secondary education was classified as a “right and a duty.” This terminology is used to indicate that completing upper secondary education is expected, although not required by law.
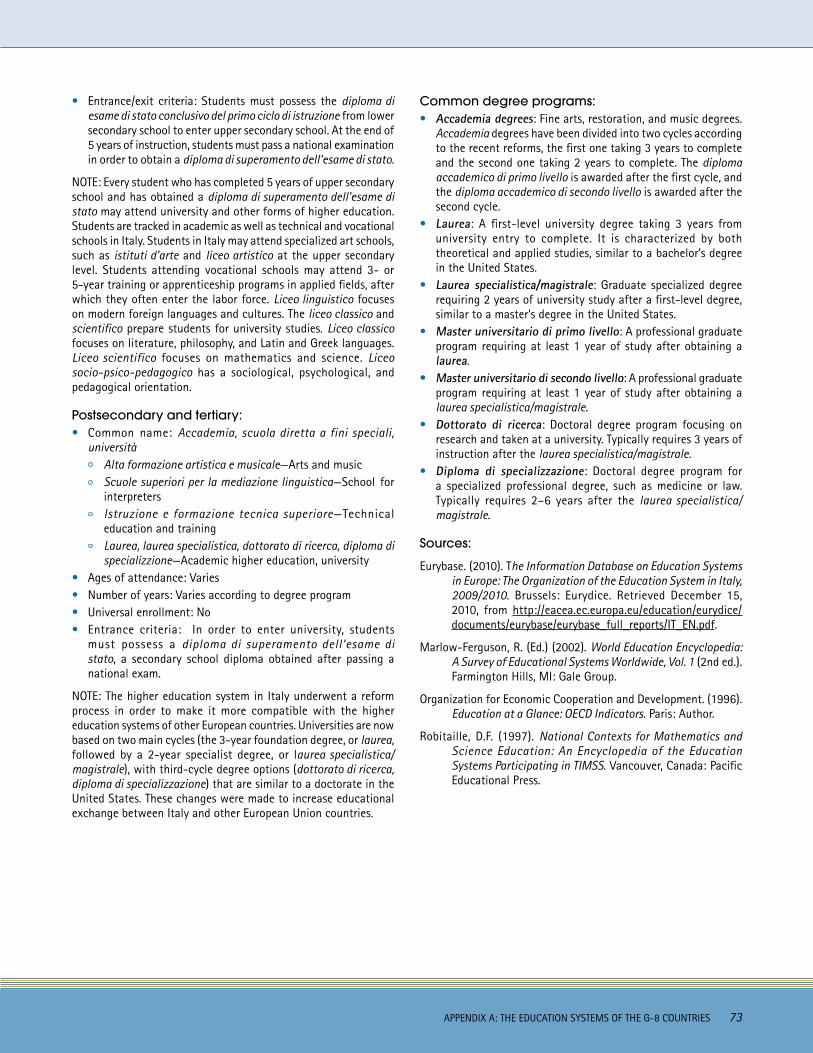
APPENDIX A: THE EDUCATION SYSTEMS OF THE G-8 COUNTRIES 73
• Entrance/exit criteria: Students must possess the diploma di esame di stato conclusivo del primo ciclo di istruzione from lower secondary school to enter upper secondary school. At the end of 5 years of instruction, students must pass a national examination in order to obtain a diploma di superamento dell’esame di stato.
NOTE: Every student who has completed 5 years of upper secondary school and has obtained a diploma di superamento dell’esame di stato may attend university and other forms of higher education. Students are tracked in academic as well as technical and vocational schools in Italy. Students in Italy may attend specialized art schools, such as istituti d’arte and liceo artistico at the upper secondary level. Students attending vocational schools may attend 3- or 5-year training or apprenticeship programs in applied fields, after which they often enter the labor force. Liceo linguistico focuses on modern foreign languages and cultures. The liceo classico and scientifico prepare students for university studies. Liceo classico focuses on literature, philosophy, and Latin and Greek languages. Liceo scientifico focuses on mathematics and science. Liceo socio-psico-pedagogico has a sociological, psychological, and pedagogical orientation.
Postsecondary and tertiary:• Common name: Accademia, scuola diretta a fini speciali,
universitàAlta formazione artistica e musicale—Arts and music Scuole superiori per la mediazione linguistica—School for interpretersIstruzione e formazione tecnica superiore—Technical education and trainingLaurea, laurea specialistica, dottorato di ricerca, diploma di specializzione—Academic higher education, university
• Ages of attendance: Varies • Number of years: Varies according to degree program• Universal enrollment: No• Entrance criteria: In order to enter university, students
must possess a diploma di superamento dell’esame di stato, a secondary school diploma obtained after passing a national exam.
NOTE: The higher education system in Italy underwent a reform process in order to make it more compatible with the higher education systems of other European countries. Universities are now based on two main cycles (the 3-year foundation degree, or laurea, followed by a 2-year specialist degree, or laurea specialistica/magistrale), with third-cycle degree options (dottorato di ricerca, diploma di specializzazione) that are similar to a doctorate in the United States. These changes were made to increase educational exchange between Italy and other European Union countries.
Common degree programs:• Accademia degrees: Fine arts, restoration, and music degrees.
Accademia degrees have been divided into two cycles according to the recent reforms, the first one taking 3 years to complete and the second one taking 2 years to complete. The diploma accademico di primo livello is awarded after the first cycle, and the diploma accademico di secondo livello is awarded after the second cycle.
• Laurea: A first-level university degree taking 3 years from university entry to complete. It is characterized by both theoretical and applied studies, similar to a bachelor’s degree in the United States.
• Laurea specialistica/magistrale: Graduate specialized degree requiring 2 years of university study after a first-level degree, similar to a master’s degree in the United States.
• Master universitario di primo livello: A professional graduate program requiring at least 1 year of study after obtaining a laurea.
• Master universitario di secondo livello: A professional graduate program requiring at least 1 year of study after obtaining a laurea specialistica/magistrale.
• Dottorato di ricerca: Doctoral degree program focusing on research and taken at a university. Typically requires 3 years of instruction after the laurea specialistica/magistrale.
• Diploma di specializzazione: Doctoral degree program for a specialized professional degree, such as medicine or law. Typically requires 2–6 years after the laurea specialistica/magistrale.
Sources:
Eurybase. (2010). The Information Database on Education Systems in Europe: The Organization of the Education System in Italy, 2009/2010. Brussels: Eurydice. Retrieved December 15, 2010, from http://eacea.ec.europa.eu/education/eurydice/documents/eurybase/eurybase_full_reports/IT_EN.pdf.
Marlow-Ferguson, R. (Ed.) (2002). World Education Encyclopedia: A Survey of Educational Systems Worldwide, Vol. 1 (2nd ed.). Farmington Hills, MI: Gale Group.
Organization for Economic Cooperation and Development. (1996). Education at a Glance: OECD Indicators. Paris: Author.
Robitaille, D.F. (1997). National Contexts for Mathematics and Science Education: An Encyclopedia of the Education Systems Participating in TIMSS. Vancouver, Canada: Pacific Educational Press.
74 APPENDIX A: THE EDUCATION SYSTEMS OF THE G-8 COUNTRIES
The Education System in Japan
Figure A-5. Levels of education in Japan, by age and year of schooling: 2010
PreprimaryYochien
Postsecondary and tertiaryDaigaku, Tankidaigaku
PrimaryShogakkou
Lower secondaryChugakkou
Upper secondaryKoutougakkou
KoutousenmongakkouCollege of technology
Year of schoolingAge
18
17
16
15
14
13
12
11
10
9
8
6
7
5
4
3
12
11
10
9
8
6
7
5
4
3
2
1
ISCED97 levels 4–6
ISCED97 level 0
ISCED97 level 1
ISCED97 level 2
ISCED97 level 3
NOTE: Education levels are defined according to the 1997 International Standard Classification of Education (ISCED97). Ages represent the typical age at the beginning of the school year. Numbers in bold print indicate ages of universal enrollment (i.e., an enrollment rate of over 90 percent). Numbers highlighted represent the age at which compulsory enrollment begins through the age at which compulsory enrollment ends. No meaning should be inferred from width of subdivisions. Duration of first university degree program is generally 4 years in Japan.SOURCE: Miller, D.C., Sen, A., Malley, L.B., and Burns, S.D. (2009). Comparative Indicators of Education in the United States and Other G-8 Countries: 2009 (NCES 2009-039). U.S. Department of Education, National Center for Education Statistics. Washington, DC: U.S. Government Printing Office.
Preprimary:• Common name: Yochien• Ages of attendance: As early as age 3 to age 5• Number of years: 1 to 3• Start of universal enrollment: Age 4• Compulsory: No
NOTE: Around 60 percent of 5-year-old students attend Yochien (kindergarten), while most others attend Hoikusho (nursery schools that infants and younger children can attend).
Primary: • Common name: Shogakkou• Ages of attendance: 6 to 11• Number of years: 6• Universal enrollment: Yes• Compulsory: Yes
Lower secondary:• Common name: Chugakkou• Ages of attendance: 12 to 14• Number of years: 3
• Universal enrollment: Yes• Compulsory: Yes• Entrance/exit criteria: No, not to enter public schools for
the majority of students. Private schools (whose enrollment accounts for 7 percent of all students) usually require a competitive examination for entry.
NOTE: Recently, secondary schools (Chutoukyoikugakkou) that unify lower and upper secondary schools have been introduced in Japan.
Upper secondary:• Common name: Koutougakkou• Ages of attendance: 15 to 17 (graduation generally at age 18)• Number of years: 3• Universal enrollment: Through age 17• Compulsory: No• Entrance/exit criteria: Yes, students in Japan are placed into
upper secondary schools based primarily on test scores and school report cards from lower secondary school. Scoring well influences students’ chances of attending the most prestigious upper secondary schools in their area.
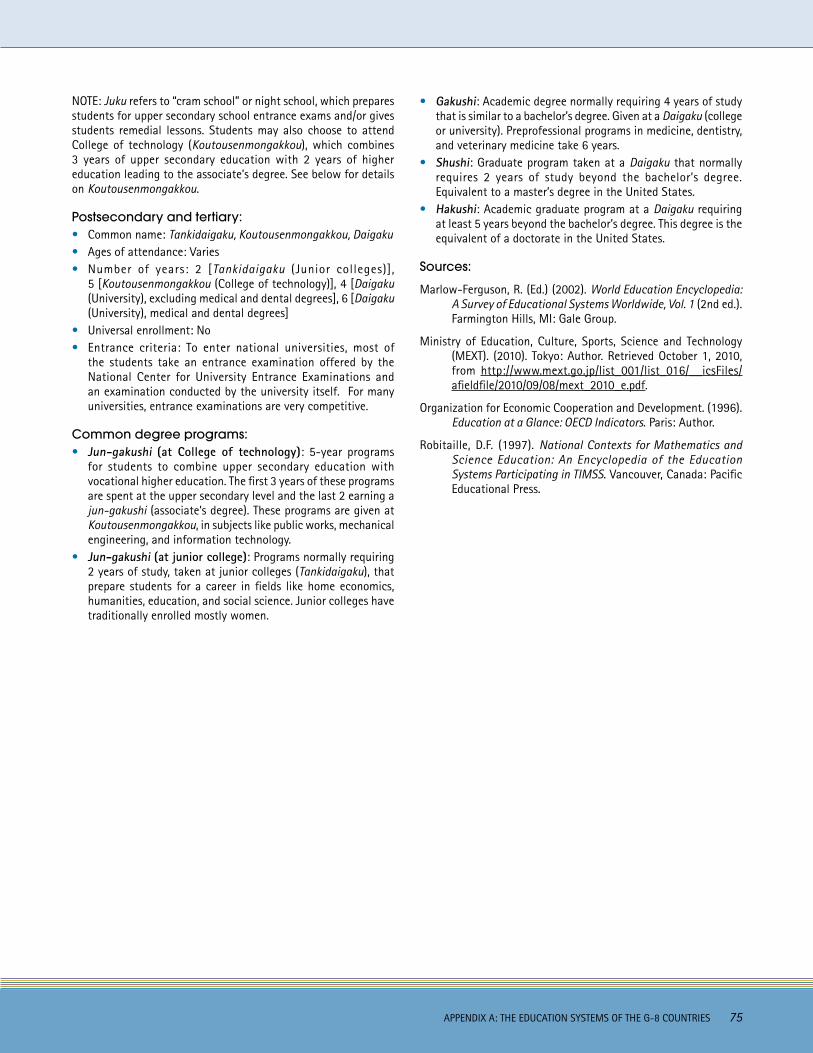
APPENDIX A: THE EDUCATION SYSTEMS OF THE G-8 COUNTRIES 75
NOTE: Juku refers to “cram school” or night school, which prepares students for upper secondary school entrance exams and/or gives students remedial lessons. Students may also choose to attend College of technology (Koutousenmongakkou), which combines 3 years of upper secondary education with 2 years of higher education leading to the associate’s degree. See below for details on Koutousenmongakkou.
Postsecondary and tertiary:• Common name: Tankidaigaku, Koutousenmongakkou, Daigaku • Ages of attendance: Varies• Number of years: 2 [Tankidaigaku (Junior colleges)],
5 [Koutousenmongakkou (College of technology)], 4 [Daigaku (University), excluding medical and dental degrees], 6 [Daigaku (University), medical and dental degrees]
• Universal enrollment: No• Entrance criteria: To enter national universities, most of
the students take an entrance examination offered by the National Center for University Entrance Examinations and an examination conducted by the university itself. For many universities, entrance examinations are very competitive.
Common degree programs:• Jun-gakushi (at College of technology): 5-year programs
for students to combine upper secondary education with vocational higher education. The first 3 years of these programs are spent at the upper secondary level and the last 2 earning a jun-gakushi (associate’s degree). These programs are given at Koutousenmongakkou, in subjects like public works, mechanical engineering, and information technology.
• Jun-gakushi (at junior college): Programs normally requiring 2 years of study, taken at junior colleges (Tankidaigaku), that prepare students for a career in fields like home economics, humanities, education, and social science. Junior colleges have traditionally enrolled mostly women.
• Gakushi: Academic degree normally requiring 4 years of study that is similar to a bachelor’s degree. Given at a Daigaku (college or university). Preprofessional programs in medicine, dentistry, and veterinary medicine take 6 years.
• Shushi: Graduate program taken at a Daigaku that normally requires 2 years of study beyond the bachelor’s degree. Equivalent to a master’s degree in the United States.
• Hakushi: Academic graduate program at a Daigaku requiring at least 5 years beyond the bachelor’s degree. This degree is the equivalent of a doctorate in the United States.
Sources:
Marlow-Ferguson, R. (Ed.) (2002). World Education Encyclopedia: A Survey of Educational Systems Worldwide, Vol. 1 (2nd ed.). Farmington Hills, MI: Gale Group.
Ministry of Education, Culture, Sports, Science and Technology (MEXT). (2010). Tokyo: Author. Retrieved October 1, 2010, from http://www.mext.go.jp/list_001/list_016/__icsFiles/afieldfile/2010/09/08/mext_2010_e.pdf.
Organization for Economic Cooperation and Development. (1996). Education at a Glance: OECD Indicators. Paris: Author.
Robitaille, D.F. (1997). National Contexts for Mathematics and Science Education: An Encyclopedia of the Education Systems Participating in TIMSS. Vancouver, Canada: Pacific Educational Press.
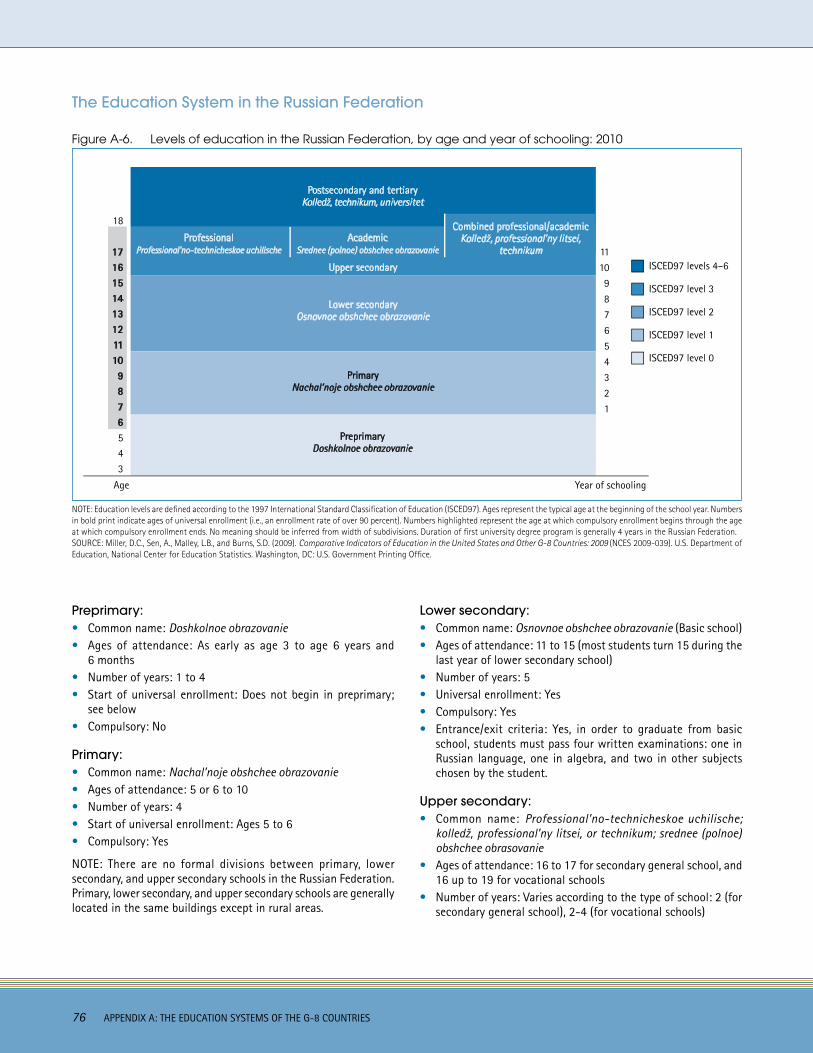
76 APPENDIX A: THE EDUCATION SYSTEMS OF THE G-8 COUNTRIES
The Education System in the Russian Federation
Figure A-6. Levels of education in the Russian Federation, by age and year of schooling: 2010
PreprimaryDoshkolnoe obrazovanie
ProfessionalProfessional’no-technicheskoe uchilische
AcademicSrednee (polnoe) obshchee obrazovanie
PrimaryNachal’noje obshchee obrazovanie
Lower secondaryOsnovnoe obshchee obrazovanie
Upper secondary
Postsecondary and tertiaryKolledž, technikum, universitet
Combined professional/academicKolledž, professional’ny litsei,
technikum
Year of schoolingAge
18
171615141312111098
67
543
11
10
9
8
6
7
5
4
3
2
1
ISCED97 levels 4–6
ISCED97 level 0
ISCED97 level 1
ISCED97 level 2
ISCED97 level 3
NOTE: Education levels are defined according to the 1997 International Standard Classification of Education (ISCED97). Ages represent the typical age at the beginning of the school year. Numbers in bold print indicate ages of universal enrollment (i.e., an enrollment rate of over 90 percent). Numbers highlighted represent the age at which compulsory enrollment begins through the age at which compulsory enrollment ends. No meaning should be inferred from width of subdivisions. Duration of first university degree program is generally 4 years in the Russian Federation.SOURCE: Miller, D.C., Sen, A., Malley, L.B., and Burns, S.D. (2009). Comparative Indicators of Education in the United States and Other G-8 Countries: 2009 (NCES 2009-039). U.S. Department of Education, National Center for Education Statistics. Washington, DC: U.S. Government Printing Office.
Preprimary:• Common name: Doshkolnoe obrazovanie• Ages of attendance: As early as age 3 to age 6 years and
6 months• Number of years: 1 to 4• Start of universal enrollment: Does not begin in preprimary;
see below• Compulsory: No
Primary: • Common name: Nachal’noje obshchee obrazovanie• Ages of attendance: 5 or 6 to 10• Number of years: 4• Start of universal enrollment: Ages 5 to 6• Compulsory: Yes
NOTE: There are no formal divisions between primary, lower secondary, and upper secondary schools in the Russian Federation. Primary, lower secondary, and upper secondary schools are generally located in the same buildings except in rural areas.
Lower secondary:• Common name: Osnovnoe obshchee obrazovanie (Basic school)• Ages of attendance: 11 to 15 (most students turn 15 during the
last year of lower secondary school)• Number of years: 5• Universal enrollment: Yes • Compulsory: Yes• Entrance/exit criteria: Yes, in order to graduate from basic
school, students must pass four written examinations: one in Russian language, one in algebra, and two in other subjects chosen by the student.
Upper secondary:• Common name: Professional’no-technicheskoe uchilische;
kolledž, professional’ny litsei, or technikum; srednee (polnoe) obshchee obrasovanie
• Ages of attendance: 16 to 17 for secondary general school, and 16 up to 19 for vocational schools
• Number of years: Varies according to the type of school: 2 (for secondary general school), 2-4 (for vocational schools)
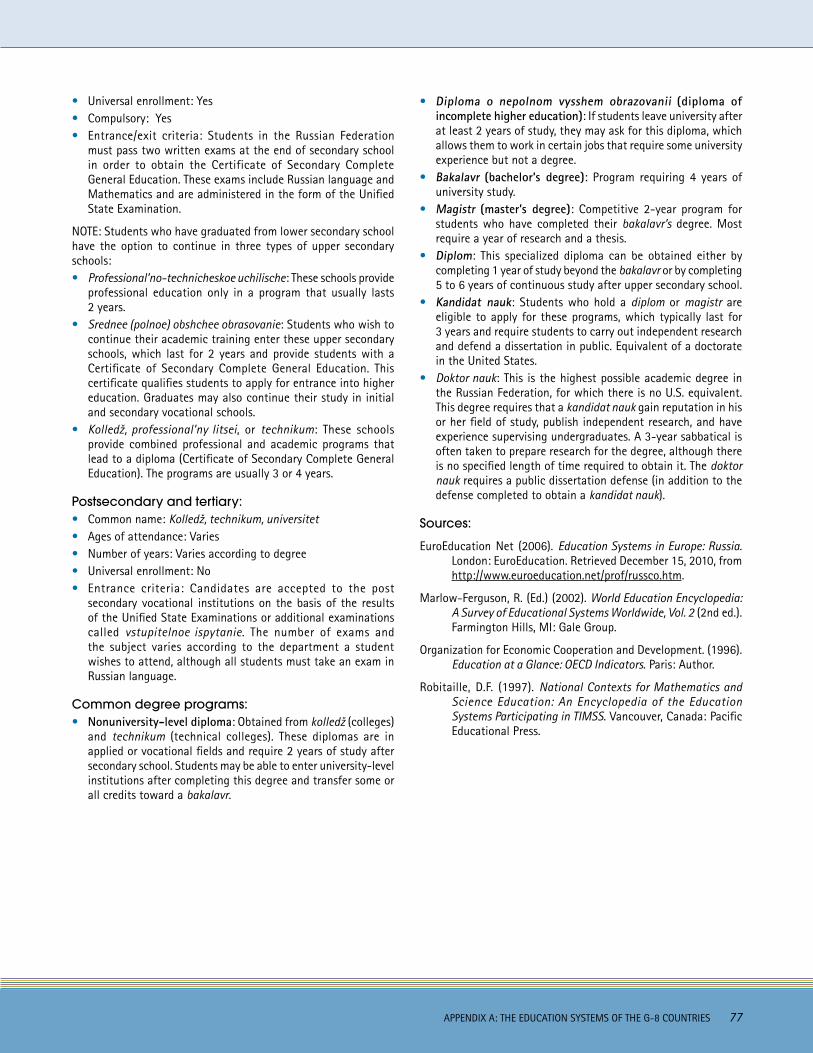
APPENDIX A: THE EDUCATION SYSTEMS OF THE G-8 COUNTRIES 77
• Universal enrollment: Yes• Compulsory: Yes• Entrance/exit criteria: Students in the Russian Federation
must pass two written exams at the end of secondary school in order to obtain the Certificate of Secondary Complete General Education. These exams include Russian language and Mathematics and are administered in the form of the Unified State Examination.
NOTE: Students who have graduated from lower secondary school have the option to continue in three types of upper secondary schools: • Professional’no-technicheskoe uchilische: These schools provide
professional education only in a program that usually lasts 2 years.
• Srednee (polnoe) obshchee obrasovanie: Students who wish to continue their academic training enter these upper secondary schools, which last for 2 years and provide students with a Certificate of Secondary Complete General Education. This certificate qualifies students to apply for entrance into higher education. Graduates may also continue their study in initial and secondary vocational schools.
• Kolledž, professional’ny litsei, or technikum: These schools provide combined professional and academic programs that lead to a diploma (Certificate of Secondary Complete General Education). The programs are usually 3 or 4 years.
Postsecondary and tertiary:• Common name: Kolledž, technikum, universitet • Ages of attendance: Varies• Number of years: Varies according to degree• Universal enrollment: No• Entrance criteria: Candidates are accepted to the post
secondary vocational institutions on the basis of the results of the Unified State Examinations or additional examinations called vstupitelnoe ispytanie. The number of exams and the subject varies according to the department a student wishes to attend, although all students must take an exam in Russian language.
Common degree programs:• Nonuniversity-level diploma: Obtained from kolledž (colleges)
and technikum (technical colleges). These diplomas are in applied or vocational fields and require 2 years of study after secondary school. Students may be able to enter university-level institutions after completing this degree and transfer some or all credits toward a bakalavr.
• Diploma o nepolnom vysshem obrazovanii (diploma of incomplete higher education): If students leave university after at least 2 years of study, they may ask for this diploma, which allows them to work in certain jobs that require some university experience but not a degree.
• Bakalavr (bachelor’s degree): Program requiring 4 years of university study.
• Magistr (master’s degree): Competitive 2-year program for students who have completed their bakalavr’s degree. Most require a year of research and a thesis.
• Diplom: This specialized diploma can be obtained either by completing 1 year of study beyond the bakalavr or by completing 5 to 6 years of continuous study after upper secondary school.
• Kandidat nauk: Students who hold a diplom or magistr are eligible to apply for these programs, which typically last for 3 years and require students to carry out independent research and defend a dissertation in public. Equivalent of a doctorate in the United States.
• Doktor nauk: This is the highest possible academic degree in the Russian Federation, for which there is no U.S. equivalent. This degree requires that a kandidat nauk gain reputation in his or her field of study, publish independent research, and have experience supervising undergraduates. A 3-year sabbatical is often taken to prepare research for the degree, although there is no specified length of time required to obtain it. The doktor nauk requires a public dissertation defense (in addition to the defense completed to obtain a kandidat nauk).
Sources:
EuroEducation Net (2006). Education Systems in Europe: Russia. London: EuroEducation. Retrieved December 15, 2010, from http://www.euroeducation.net/prof/russco.htm.
Marlow-Ferguson, R. (Ed.) (2002). World Education Encyclopedia: A Survey of Educational Systems Worldwide, Vol. 2 (2nd ed.). Farmington Hills, MI: Gale Group.
Organization for Economic Cooperation and Development. (1996). Education at a Glance: OECD Indicators. Paris: Author.
Robitaille, D.F. (1997). National Contexts for Mathematics and Science Education: An Encyclopedia of the Education Systems Participating in TIMSS. Vancouver, Canada: Pacific Educational Press.
78 APPENDIX A: THE EDUCATION SYSTEMS OF THE G-8 COUNTRIES
The Education System in the United Kingdom: The Education System in England, Northern Ireland, and Wales
Figure A-7. Levels of education in England, Northern Ireland, and Wales, by age and year of schooling: 2010
PreprimaryFoundation stage, nursery school, reception class, day nursery
Postsecondary and tertiaryHigher education (HE), college, university
Further education (FE) college School sixth form, sixth form college
PrimaryKey stages 1 and 2, infant school, junior school
Lower secondaryAcademy (England), comprehensive school, high school, grammar school, key stage 3,
post-primary (NI), secondary school
Upper secondaryAcademy (England), comprehensive school, further education college, grammar school, high school,
key stages 4 and 5, post-primary (NI)
Year of schooling2Age1
18
17
16
15
14
13
12
11
10
9
8
6
7
5
4
3
12
13
11
10
9
8
6
7
5
4
3
2
1
ISCED97 levels 4–6
ISCED97 level 0
ISCED97 level 1
ISCED97 level 2
ISCED97 level 3
1 In Northern Ireland, however, compulsory enrollment begins at age 4 and this year is considered as ISCED 1. 2 In Northern Ireland, however, there are 14 years of schooling, with year 1 beginning at the preprimary level (age 4). NOTE: Education levels are defined according to the 1997 International Standard Classification of Education (ISCED97). Ages represent the typical age at the beginning of the school year. Numbers in bold print indicate ages of universal enrollment (i.e. an enrollment rate of over 90 percent). Numbers highlighted represent the age at which compulsory enrollment begins through the age at which compulsory enrollment ends. No meaning should be inferred from width of subdivisions. Duration of first university degree program is generally 3 years in England, Northern Ireland, and Wales. SOURCE: Miller, D.C., Sen, A., Malley, L.B., and Burns, S.D. (2009). Comparative Indicators of Education in the United States and Other G-8 Countries: 2009 (NCES 2009-039). U.S. Department of Education, National Center for Education Statistics. Washington, DC: U.S. Government Printing Office.
NOTE: There are differences within the education system of the United Kingdom because responsibilities and oversight for education has been transferred to the devolved administrations in Wales and Northern Ireland (the Welsh Assembly Government and Northern Ireland Assembly respectively). However, the purpose of this document is to present a brief, general summary of education in the United Kingdom. The sources cited at the end of this section provide more specific details about education in the United Kingdom.
Preprimary:• Common name: (Early years) foundation stage/phase, nursery
school/class, reception class in primary school (England and Wales only), day nursery
• Ages of attendance: 3 to 4• Number of years: 1 to 2• Start of universal enrollment: Age 4• Compulsory: No
NOTE: Within the foundation stage/phase, some students attend a “reception class” in primary school. This is comparable to kindergarten in the United States (with academic activities) and provides a “bridge” between nursery school and key stage 1.
Primary: • Common name: Key stages 1 and 2, infant school, junior school,
primary school • Ages of attendance: 5 to 10 (England and Wales), 4 to 10
(Northern Ireland)• Number of years: 6 (England and Wales), 7 (Northern Ireland)• Universal enrollment: Yes• Compulsory: Yes
NOTE: The primary school years are divided into stages. In England, these are key stage 1 and key stage 2. In Wales, since 2008, they have been known as the foundation phase and key stage 2. In Northern Ireland, since 2008, they have been known as the foundation stage, key stage 1 and key stage 2.
Lower secondary:• Common name: Academy (England), comprehensive school, high
school, grammar school, key stage 3, post-primary (Northern Ireland), secondary school
• Ages of attendance: 11 to 13• Number of years: 3
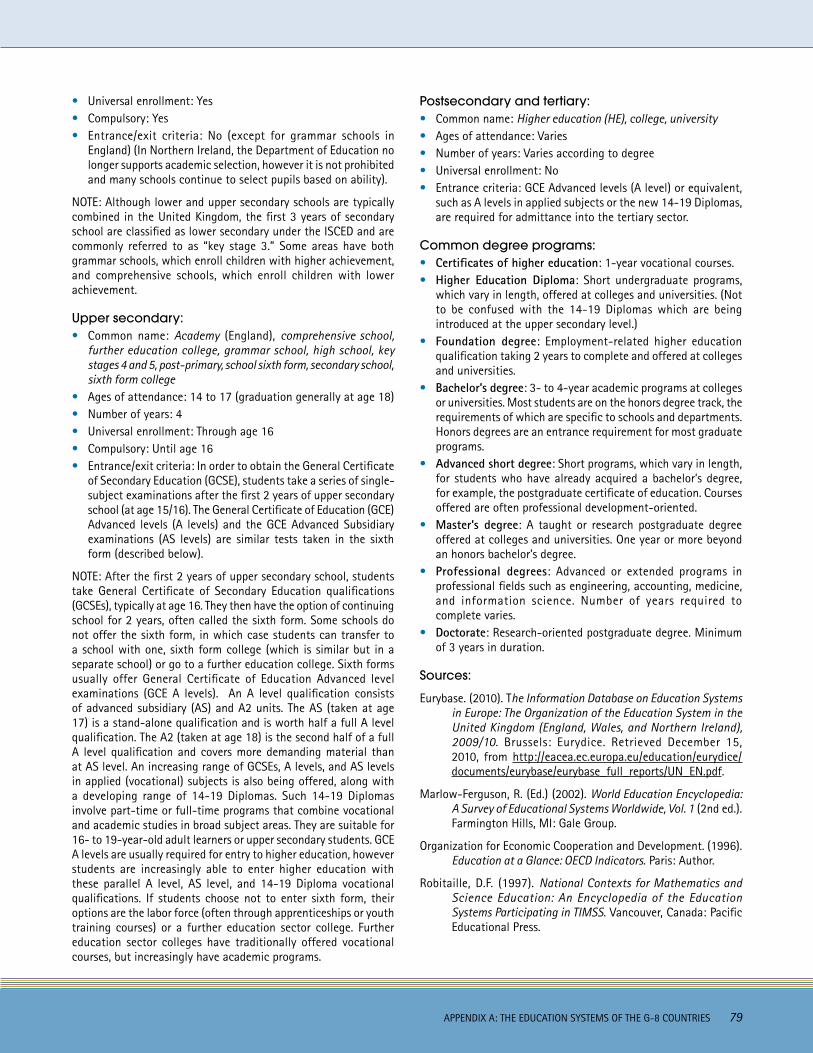
APPENDIX A: THE EDUCATION SYSTEMS OF THE G-8 COUNTRIES 79
• Universal enrollment: Yes• Compulsory: Yes• Entrance/exit criteria: No (except for grammar schools in
England) (In Northern Ireland, the Department of Education no longer supports academic selection, however it is not prohibited and many schools continue to select pupils based on ability).
NOTE: Although lower and upper secondary schools are typically combined in the United Kingdom, the first 3 years of secondary school are classified as lower secondary under the ISCED and are commonly referred to as “key stage 3.” Some areas have both grammar schools, which enroll children with higher achievement, and comprehensive schools, which enroll children with lower achievement.
Upper secondary:• Common name: Academy (England), comprehensive school,
further education college, grammar school, high school, key stages 4 and 5, post-primary, school sixth form, secondary school, sixth form college
• Ages of attendance: 14 to 17 (graduation generally at age 18)• Number of years: 4• Universal enrollment: Through age 16• Compulsory: Until age 16• Entrance/exit criteria: In order to obtain the General Certificate
of Secondary Education (GCSE), students take a series of single-subject examinations after the first 2 years of upper secondary school (at age 15/16). The General Certificate of Education (GCE) Advanced levels (A levels) and the GCE Advanced Subsidiary examinations (AS levels) are similar tests taken in the sixth form (described below).
NOTE: After the first 2 years of upper secondary school, students take General Certificate of Secondary Education qualifications (GCSEs), typically at age 16. They then have the option of continuing school for 2 years, often called the sixth form. Some schools do not offer the sixth form, in which case students can transfer to a school with one, sixth form college (which is similar but in a separate school) or go to a further education college. Sixth forms usually offer General Certificate of Education Advanced level examinations (GCE A levels). An A level qualification consists of advanced subsidiary (AS) and A2 units. The AS (taken at age 17) is a stand-alone qualification and is worth half a full A level qualification. The A2 (taken at age 18) is the second half of a full A level qualification and covers more demanding material than at AS level. An increasing range of GCSEs, A levels, and AS levels in applied (vocational) subjects is also being offered, along with a developing range of 14-19 Diplomas. Such 14-19 Diplomas involve part-time or full-time programs that combine vocational and academic studies in broad subject areas. They are suitable for 16- to 19-year-old adult learners or upper secondary students. GCE A levels are usually required for entry to higher education, however students are increasingly able to enter higher education with these parallel A level, AS level, and 14-19 Diploma vocational qualifications. If students choose not to enter sixth form, their options are the labor force (often through apprenticeships or youth training courses) or a further education sector college. Further education sector colleges have traditionally offered vocational courses, but increasingly have academic programs.
Postsecondary and tertiary:• Common name: Higher education (HE), college, university • Ages of attendance: Varies• Number of years: Varies according to degree• Universal enrollment: No• Entrance criteria: GCE Advanced levels (A level) or equivalent,
such as A levels in applied subjects or the new 14-19 Diplomas, are required for admittance into the tertiary sector.
Common degree programs:• Certificates of higher education: 1-year vocational courses.• Higher Education Diploma: Short undergraduate programs,
which vary in length, offered at colleges and universities. (Not to be confused with the 14-19 Diplomas which are being introduced at the upper secondary level.)
• Foundation degree: Employment-related higher education qualification taking 2 years to complete and offered at colleges and universities.
• Bachelor’s degree: 3- to 4-year academic programs at colleges or universities. Most students are on the honors degree track, the requirements of which are specific to schools and departments. Honors degrees are an entrance requirement for most graduate programs.
• Advanced short degree: Short programs, which vary in length, for students who have already acquired a bachelor’s degree, for example, the postgraduate certificate of education. Courses offered are often professional development-oriented.
• Master’s degree: A taught or research postgraduate degree offered at colleges and universities. One year or more beyond an honors bachelor’s degree.
• Professional degrees: Advanced or extended programs in professional fields such as engineering, accounting, medicine, and information science. Number of years required to complete varies.
• Doctorate: Research-oriented postgraduate degree. Minimum of 3 years in duration.
Sources:
Eurybase. (2010). The Information Database on Education Systems in Europe: The Organization of the Education System in the United Kingdom (England, Wales, and Northern Ireland), 2009/10. Brussels: Eurydice. Retrieved December 15, 2010, from http://eacea.ec.europa.eu/education/eurydice/ documents/eurybase/eurybase_full_reports/UN_EN.pdf.
Marlow-Ferguson, R. (Ed.) (2002). World Education Encyclopedia: A Survey of Educational Systems Worldwide, Vol. 1 (2nd ed.). Farmington Hills, MI: Gale Group.
Organization for Economic Cooperation and Development. (1996). Education at a Glance: OECD Indicators. Paris: Author.
Robitaille, D.F. (1997). National Contexts for Mathematics and Science Education: An Encyclopedia of the Education Systems Participating in TIMSS. Vancouver, Canada: Pacific Educational Press.
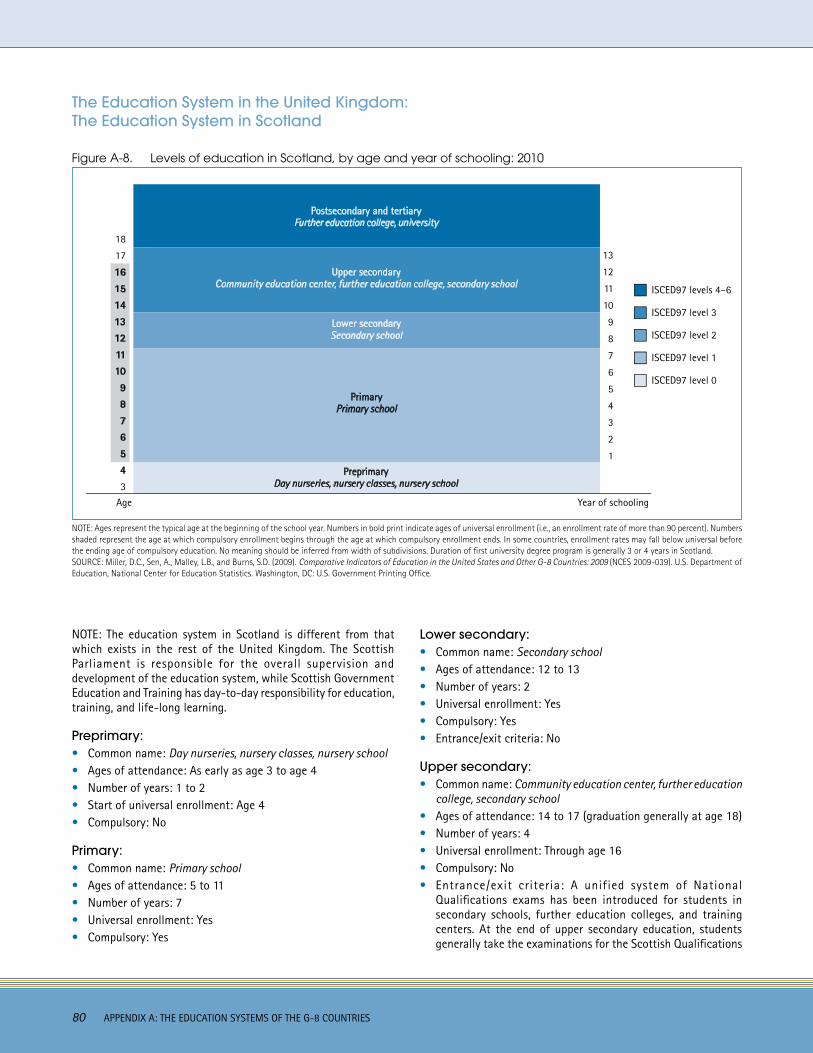
80 APPENDIX A: THE EDUCATION SYSTEMS OF THE G-8 COUNTRIES
The Education System in the United Kingdom: The Education System in Scotland
Figure A-8. Levels of education in Scotland, by age and year of schooling: 2010
PreprimaryDay nurseries, nursery classes, nursery school
Postsecondary and tertiaryFurther education college, university
PrimaryPrimary school
Lower secondarySecondary school
Upper secondaryCommunity education center, further education college, secondary school
Year of schoolingAge
18
17
16
15
14
13
12
11
10
9
8
6
7
5
4
3
12
13
11
10
9
8
6
7
5
4
3
2
1
ISCED97 levels 4–6
ISCED97 level 0
ISCED97 level 1
ISCED97 level 2
ISCED97 level 3
NOTE: Ages represent the typical age at the beginning of the school year. Numbers in bold print indicate ages of universal enrollment (i.e., an enrollment rate of more than 90 percent). Numbers shaded represent the age at which compulsory enrollment begins through the age at which compulsory enrollment ends. In some countries, enrollment rates may fall below universal before the ending age of compulsory education. No meaning should be inferred from width of subdivisions. Duration of first university degree program is generally 3 or 4 years in Scotland. SOURCE: Miller, D.C., Sen, A., Malley, L.B., and Burns, S.D. (2009). Comparative Indicators of Education in the United States and Other G-8 Countries: 2009 (NCES 2009-039). U.S. Department of Education, National Center for Education Statistics. Washington, DC: U.S. Government Printing Office.
NOTE: The education system in Scotland is different from that which exists in the rest of the United Kingdom. The Scottish Parliament is responsible for the overall supervision and development of the education system, while Scottish Government Education and Training has day-to-day responsibility for education, training, and life-long learning.
Preprimary:• Common name: Day nurseries, nursery classes, nursery school• Ages of attendance: As early as age 3 to age 4• Number of years: 1 to 2• Start of universal enrollment: Age 4• Compulsory: No
Primary: • Common name: Primary school• Ages of attendance: 5 to 11• Number of years: 7• Universal enrollment: Yes• Compulsory: Yes
Lower secondary:• Common name: Secondary school• Ages of attendance: 12 to 13 • Number of years: 2 • Universal enrollment: Yes• Compulsory: Yes• Entrance/exit criteria: No
Upper secondary:• Common name: Community education center, further education
college, secondary school • Ages of attendance: 14 to 17 (graduation generally at age 18)• Number of years: 4 • Universal enrollment: Through age 16• Compulsory: No• Entrance/exit criteria: A unified system of National
Qualifications exams has been introduced for students in secondary schools, further education colleges, and training centers. At the end of upper secondary education, students generally take the examinations for the Scottish Qualifications

APPENDIX A: THE EDUCATION SYSTEMS OF THE G-8 COUNTRIES 81
Certificate (SQC) at Standard Grade or National Qualifications courses/units. These examinations are intended to be taken by the whole school population. Students who plan to go into higher education take the higher level examinations of the SQC.
NOTE: During upper secondary school, students in Scotland have the option to continue in a traditional secondary school or to attend further education colleges. There are also nationally funded training and apprenticeship programs in which students can participate if they choose not to attend upper secondary school.
Postsecondary and tertiary:• Common name: Further education college, university • Ages of attendance: Varies• Number of years: Varies according to course/degree• Universal enrollment: No• Entrance criteria: The usual entry requirements for university
are the higher or advanced higher level examinations of the SQC (see above). Further education colleges admit students who have just left school at age 16, students who have left school at age 17 or 18 with and without formal certification, and are now also admitting an increasing number of older students. Admission requirements at further education colleges are decided by the institution.
Common degree programs:• Certificates of higher education: 1-year vocational courses.• Higher Education Diploma: Short undergraduate programs,
which vary in length, offered at colleges and universities.• Bachelor’s degree: Courses leading to an ordinary bachelor’s
degree last 3 years, while courses leading to a degree with honors are typically 4 years. There are also some courses where the first award is a master’s degree.
• Advanced short degree: Short programs, which vary in length, for students who have already acquired a bachelor’s degree; for example, the postgraduate diploma of education. Courses offered are often professional development-oriented.
• Master’s degree: Taught master’s degrees are typically 1-year programs, but research master’s degrees are generally longer. Entrance into a master’s program generally requires a bachelor’s degree.
• Professional degree programs: Advanced or extended programs leading to professional registration as a doctor, dentist, etc., that typically require 5 years beyond the bachelor’s degree.
• Doctorate: A doctorate generally requires 3 years of full-time study or 4 to 6 years if part time.
Sources:
Eurybase. (2009). The Information Database on Education Systems in Europe: The Organization of the Education System in the United Kingdom (Scotland), 2008/09. Brussels: Eurydice. Retrieved December 15, 2010, from http://eacea.ec.europa.eu/education/eurydice/documents/eurybase/eurybase_full_reports/SC_EN.pdf.
Eurydice. (2007). Focus on the Structure of Higher Education in Europe 2006/07: National Trends in the Bologna Process. Brussels: Eurydice. Retrieved December 15, 2010, from http://eacea.ec.europa.eu/education/eurydice/documents/thematic_reports/086en.pdf.
Marlow-Ferguson, R. (Ed.) (2002). World Education Encyclopedia: A Survey of Educational Systems Worldwide, Vol. 3 (2nd ed.). Farmington Hills, MI: Gale Group.
Organization for Economic Cooperation and Development. (1996). Education at a Glance: OECD Indicators. Paris: Author.
Robitaille, D.F. (1997). National Contexts for Mathematics and Science Education: An Encyclopedia of the Education Systems Participating in TIMSS. Vancouver, Canada: Pacific Educational Press.
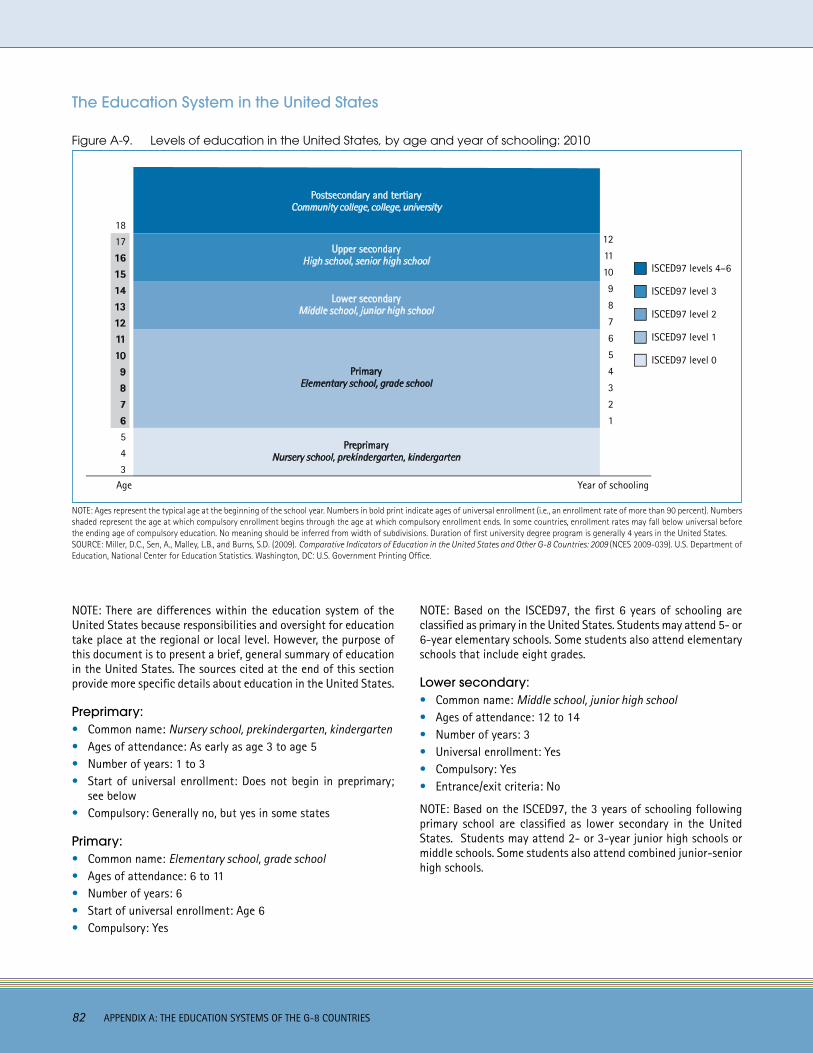
82 APPENDIX A: THE EDUCATION SYSTEMS OF THE G-8 COUNTRIES
The Education System in the United States
Figure A-9. Levels of education in the United States, by age and year of schooling: 2010
PreprimaryNursery school, prekindergarten, kindergarten
Postsecondary and tertiaryCommunity college, college, university
PrimaryElementary school, grade school
Lower secondaryMiddle school, junior high school
Upper secondaryHigh school, senior high school
Year of schoolingAge
18
17
1615141312111098
67
5
4
3
12
11
10
9
8
6
7
5
4
3
2
1
ISCED97 levels 4–6
ISCED97 level 0
ISCED97 level 1
ISCED97 level 2
ISCED97 level 3
NOTE: Ages represent the typical age at the beginning of the school year. Numbers in bold print indicate ages of universal enrollment (i.e., an enrollment rate of more than 90 percent). Numbers shaded represent the age at which compulsory enrollment begins through the age at which compulsory enrollment ends. In some countries, enrollment rates may fall below universal before the ending age of compulsory education. No meaning should be inferred from width of subdivisions. Duration of first university degree program is generally 4 years in the United States. SOURCE: Miller, D.C., Sen, A., Malley, L.B., and Burns, S.D. (2009). Comparative Indicators of Education in the United States and Other G-8 Countries: 2009 (NCES 2009-039). U.S. Department of Education, National Center for Education Statistics. Washington, DC: U.S. Government Printing Office.
NOTE: There are differences within the education system of the United States because responsibilities and oversight for education take place at the regional or local level. However, the purpose of this document is to present a brief, general summary of education in the United States. The sources cited at the end of this section provide more specific details about education in the United States.
Preprimary:• Common name: Nursery school, prekindergarten, kindergarten • Ages of attendance: As early as age 3 to age 5• Number of years: 1 to 3• Start of universal enrollment: Does not begin in preprimary;
see below • Compulsory: Generally no, but yes in some states
Primary: • Common name: Elementary school, grade school• Ages of attendance: 6 to 11• Number of years: 6• Start of universal enrollment: Age 6• Compulsory: Yes
NOTE: Based on the ISCED97, the first 6 years of schooling are classified as primary in the United States. Students may attend 5- or 6-year elementary schools. Some students also attend elementary schools that include eight grades.
Lower secondary:• Common name: Middle school, junior high school • Ages of attendance: 12 to 14• Number of years: 3• Universal enrollment: Yes • Compulsory: Yes• Entrance/exit criteria: No
NOTE: Based on the ISCED97, the 3 years of schooling following primary school are classified as lower secondary in the United States. Students may attend 2- or 3-year junior high schools or middle schools. Some students also attend combined junior-senior high schools.
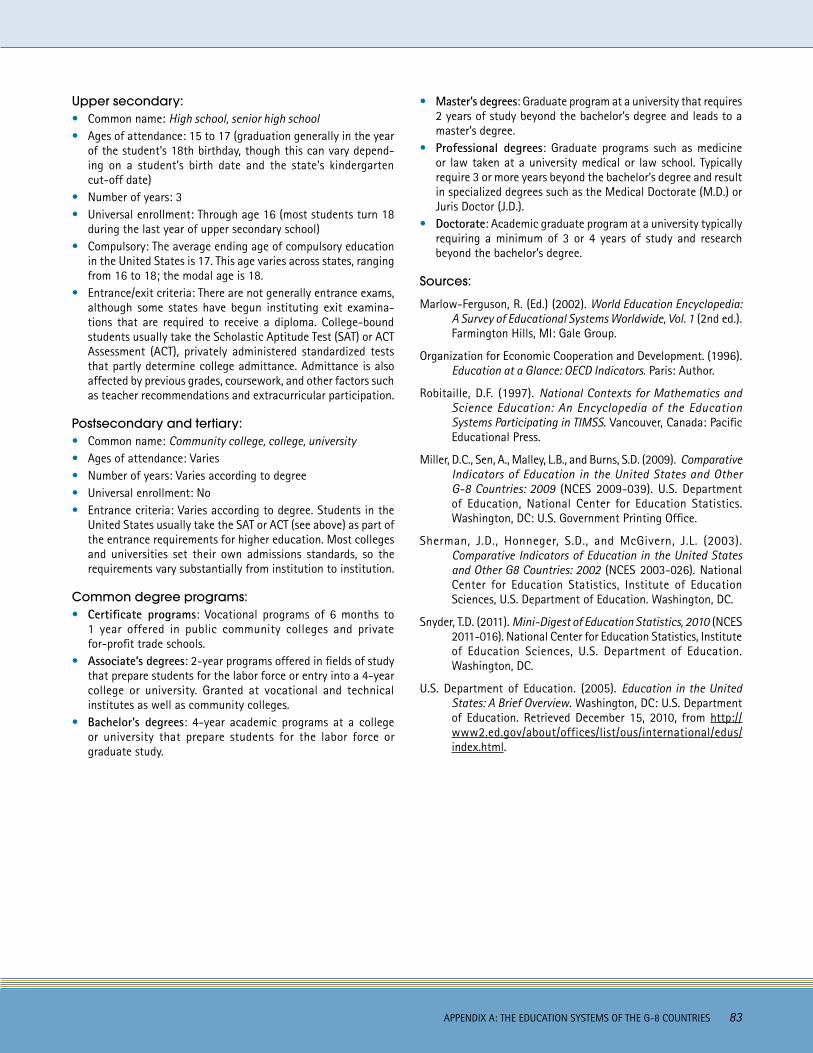
APPENDIX A: THE EDUCATION SYSTEMS OF THE G-8 COUNTRIES 83
Upper secondary:• Common name: High school, senior high school• Ages of attendance: 15 to 17 (graduation generally in the year
of the student’s 18th birthday, though this can vary depend-ing on a student’s birth date and the state’s kindergarten cut-off date)
• Number of years: 3• Universal enrollment: Through age 16 (most students turn 18
during the last year of upper secondary school) • Compulsory: The average ending age of compulsory education
in the United States is 17. This age varies across states, ranging from 16 to 18; the modal age is 18.
• Entrance/exit criteria: There are not generally entrance exams, although some states have begun instituting exit examina-tions that are required to receive a diploma. College-bound students usually take the Scholastic Aptitude Test (SAT) or ACT Assessment (ACT), privately administered standardized tests that partly determine college admittance. Admittance is also affected by previous grades, coursework, and other factors such as teacher recommendations and extracurricular participation.
Postsecondary and tertiary:• Common name: Community college, college, university• Ages of attendance: Varies• Number of years: Varies according to degree• Universal enrollment: No• Entrance criteria: Varies according to degree. Students in the
United States usually take the SAT or ACT (see above) as part of the entrance requirements for higher education. Most colleges and universities set their own admissions standards, so the requirements vary substantially from institution to institution.
Common degree programs:• Certificate programs: Vocational programs of 6 months to
1 year offered in public community colleges and private for-profit trade schools.
• Associate’s degrees: 2-year programs offered in fields of study that prepare students for the labor force or entry into a 4-year college or university. Granted at vocational and technical institutes as well as community colleges.
• Bachelor’s degrees: 4-year academic programs at a college or university that prepare students for the labor force or graduate study.
• Master’s degrees: Graduate program at a university that requires 2 years of study beyond the bachelor’s degree and leads to a master’s degree.
• Professional degrees: Graduate programs such as medicine or law taken at a university medical or law school. Typically require 3 or more years beyond the bachelor’s degree and result in specialized degrees such as the Medical Doctorate (M.D.) or Juris Doctor (J.D.).
• Doctorate: Academic graduate program at a university typically requiring a minimum of 3 or 4 years of study and research beyond the bachelor’s degree.
Sources:
Marlow-Ferguson, R. (Ed.) (2002). World Education Encyclopedia: A Survey of Educational Systems Worldwide, Vol. 1 (2nd ed.). Farmington Hills, MI: Gale Group.
Organization for Economic Cooperation and Development. (1996). Education at a Glance: OECD Indicators. Paris: Author.
Robitaille, D.F. (1997). National Contexts for Mathematics and Science Education: An Encyclopedia of the Education Systems Participating in TIMSS. Vancouver, Canada: Pacific Educational Press.
Miller, D.C., Sen, A., Malley, L.B., and Burns, S.D. (2009). Comparative Indicators of Education in the United States and Other G-8 Countries: 2009 (NCES 2009-039). U.S. Department of Education, National Center for Education Statistics. Washington, DC: U.S. Government Printing Office.
Sherman, J.D., Honneger, S.D., and McGivern, J.L. (2003). Comparative Indicators of Education in the United States and Other G8 Countries: 2002 (NCES 2003-026). National Center for Education Statistics, Institute of Education Sciences, U.S. Department of Education. Washington, DC.
Snyder, T.D. (2011). Mini-Digest of Education Statistics, 2010 (NCES 2011-016). National Center for Education Statistics, Institute of Education Sciences, U.S. Department of Education. Washington, DC.
U.S. Department of Education. (2005). Education in the United States: A Brief Overview. Washington, DC: U.S. Department of Education. Retrieved December 15, 2010, from http://www2.ed.gov/about/offices/list/ous/international/edus/index.html.