Embed Size (px)
Citation preview

U.S. DEPARTMENT OF EDUCAT IONNCES 2009-039
Comparative Indicators ofEducation in the United States and Other G-8 Countries: 2009March 2009


Comparative Indicators of Education in the United States and Other G-8 Countries: 2009
David C. Miller Anindita Sen Education Statistics Services Institute – American Institutes for Research
Lydia B. Malley Stephanie D. BurnsEducation Statistics Services Institute – Child Trends
Eugene OwenProject OfficerNational Center for Education Statistics
MARCH 2009
NCES 2009-039
U.S. DEPARTMENT OF EDUCATION

U.S. Department of Education Arne Duncan Secretary
Institute of Education Sciences Sue Betka Acting Director
National Center for Education Statistics Stuart Kerachsky Acting Commissioner
The National Center for Education Statistics (NCES) is the primary federal entity for collecting, analyzing, and reporting data related to education in the United States and other nations. It fulfills a congressional mandate to collect, collate, analyze, and report full and complete statistics on the condition of education in the United States; conduct and publish reports and specialized analyses of the meaning and significance of such statistics; assist state and local education agencies in improving their statistical systems; and review and report on education activities in foreign countries.
NCES activities are designed to address high-priority education data needs; provide consistent, reliable, complete, and accurate indicators of education status and trends; and report timely, useful, and high-quality data to the U.S. Department of Education, the Congress, the states, other education policymakers, practitioners, data users, and the general public. Unless specifically noted, all information contained herein is in the public domain.
We strive to make our products available in a variety of formats and in language that is appropriate to a variety of audiences. You, as our customer, are the best judge of our success in communicating information effectively. If you have any comments or suggestions about this or any other NCES product or report, we would like to hear from you. Please direct your comments to
National Center for Education Statistics Institute of Education Sciences U.S. Department of Education 1990 K Street NW Washington, DC 20006-5651
March 2009
The NCES World Wide Web Home Page address is http://nces.ed.gov. The NCES World Wide Web Electronic Catalog is http://nces.ed.gov/pubsearch.
Suggested Citation
Miller, D.C., Sen, A., Malley, L.B., and Burns, S.D. (2009). Comparative Indicators of Education in the United States and Other G-8 Countries: 2009 (NCES 2009-039). National Center for Education Statistics, Institute of Education Sciences, U.S. Department of Education. Washington, DC.
For ordering information on this report, write to
U.S. Department of Education ED Pubs P.O. Box 1398 Jessup, MD 20794-1398
or call toll free 1-877-4ED-PUBS or order online at http://www.edpubs.org/webstore/content/search.asp.
Content Contact Eugene Owen (202) 502-7422 [email protected]

SUMMArY iii
SUMMARyIntroductionThis report describes how the education system in the United States compares with education systems in the other Group of Eight (G-8) countries—Canada, France, Germany, Italy, Japan, the russian Federation, the United Kingdom—that are among the world’s most economically developed countries and among the United States’ largest economic partners. Comparative Indicators of Education in the United States and Other G-8 Countries: 2009 draws on the most current information about education from four primary sources: the Indicators of National Education Systems (INES) at the Organization for Economic Cooperation and Development (OECD); the Progress in International reading Literacy Study (PIrLS); the Program for International Student Assessment (PISA); and the Trends in International Mathematics and Science Study (TIMSS). Begun in 2002, the series is published on a biennial basis.
It should be noted that most of the indicators in this report do not contain data for the complete set of G-8 countries. This is the result of a G-8 country not reporting data or not participating in a study. Also, the United Kingdom participated as one country in PISA, but in PIrLS and TIMSS England and Scotland participated as individual systems. Similarly, Canada participated as separate provinces in PIrLS 2006. Indicators that use PIrLS and TIMSS as data sources report England and Scotland separately. Indicators that use PIrLS data present results for the participating Canadian provinces in appendix tables (see appendix B). Thus, in indicators using PIrLS data and discussed in the summary that follows, the “participating” G-8 countries include England, France, Germany, Italy, the russian Federation, Scotland, and the United States. In indicators using TIMSS data, “participating” G-8 countries include England, Germany, Italy, Japan, the russian Federation, Scotland, and the United States at fourth grade, and England, Italy, Japan, the russian Federation, Scotland, and the United States at eighth grade.1 In indicators using INES data, the “reporting” G-8 countries vary somewhat; these are shown in each indicator and noted in the summary.
The main findings of this report are summarized below. These highlights are organized around the five major sections of the report—population and school enrollment; academic performance;
context for learning; expenditure for education; and education returns: educational attainment and income.
Population and School Enrollment
School-age population
In 2008, the population of 5- to 29-year-olds (roughly the population most likely to be enrolled in education) represented 34 percent of the total population in the United States. In the other G-8 countries, the corresponding percentages ranged from 25 percent in Italy to 33 percent in the russian Federation. From 1998 to 2008, the United States had the largest net percentage gain in population size of 5- to 29-year-olds (6 percent) among the G-8 countries (indicator 1).
Enrollment in formal education
In 2006, all or almost all 3- and 4-year-old children were enrolled in preprimary or primary education in France and Italy.2 In Germany, the United Kingdom, and Japan, at least 80 percent of 3- and 4-year-olds were enrolled; in the United States, 48 percent were enrolled. Compulsory education ends at age 18 in Germany; age 17 in the United States; age 16 in Canada, France, and the United Kingdom; and age 15 in Italy, Japan, and the russian Federation (indicator 2).3
Foreign students in postsecondary education
In 2006, G-8 countries hosted close to two-thirds of all foreign students in higher education.4 The United States received the largest percentage of these foreign students (20 percent), followed by the United Kingdom (11 percent), Germany (9 percent), and France (9 percent) (indicator 3).
Academic Performance
Reading
On the PIrLS 2006 assessment, fourth-graders in the russian Federation outperformed their peers in all other participating
1 Germany participated in TIMSS 2007 at fourth grade, but not eighth grade.2 Internationally, education levels are defined according to the International Standard Classification of Education (ISCED97). “Preprimary education” refers to ISCED97 level 0. This is defined as the initial stage of organized instruction, designed primarily to introduce very young children to a school-type environment. Education programs at ISCED97 level 0 can either be center or school based. Preschool and kindergarten programs in the United States fall into level 0. “Primary education” refers to ISCED97 level 1. This level of education usually lasts 4 to 6 years, and typically begins between ages 5 and 7. At ISCED97 level 1, students begin to study basic subjects, such as reading, writing, and mathematics. In the United States, elementary school (grades 1 through 6) is classified as level 1. For more information on the ISCED97 levels, see appendix A.3 In some countries, the ending age of compulsory education is an average. For example, in the United States this age varies across states, ranging from 16 to 18; the modal age in the United States is 16.4 As used in this report, “higher education” refers to ISCED97 levels 5A (academic higher education below the doctoral level), 5B (vocational higher education), and 6 (academic higher education at the doctoral level) (except where specific data exclusions are noted).

iv SUMMArY
G-8 countries5 in terms of average scores in reading literacy. U.S. fourth-graders scored higher on average in reading literacy than their peers in Scotland and France, but lower than their peers in Italy and the russian Federation. Twelve percent of U.S. fourth-graders reached the advanced international benchmark, the highest of the benchmarks set by PIrLS to describe the range of student performance (indicator 4). Average scores of fourth-grade females in reading literacy were higher than the average scores of fourth-grade males in all participating G-8 countries. Among countries with the largest score differences between males and females were Scotland (with a difference of 22 points), England (with a difference of 19 points), and the russian Federation (with a difference of 15 points). In the United States, females outperformed males by 10 points (indicator 5).
Mathematics
On the TIMSS 2007 assessment, students in Japan outperformed students in the other participating G-8 countries in mathematics,6 with higher percentages of Japanese fourth- and eighth-graders reaching each of the four international benchmarks set by TIMSS to describe the range of student performance. For example, the advanced benchmark (the highest TIMSS benchmark) was reached by 26 percent of Japan’s eighth-graders in mathematics, compared with percentages ranging from 3 percent in Italy to 8 percent in the russian Federation and England. In the United States, 6 percent of eighth-graders reached the advanced benchmark (indicator 6). In Italy, Germany, Scotland, and the United States, fourth-grade males scored higher, on average, than fourth-grade females in mathematics; however, no measurable differences related to sex were detected among eighth-graders (indicator 7).
Science
On the TIMSS 2007 fourth-grade science assessment, students in Japan scored higher, on average, than their peers in Scotland, Germany, Italy, and the United States, but not measurably different from their peers in England and the russian Federation. At eighth grade, students in Japan had a higher average score in science and generally had larger percentages of students reaching each of the four international benchmarks compared to their G-8 peers (indicator 8). In Germany and Italy, fourth-grade males scored higher, on average, than fourth-grade females in science; in the United States and Italy, eighth-grade males outperformed females (indicator 9).
On the PISA 2006 assessment, 15-year-old students in Canada and Japan scored higher, on average, than their peers in all other G-8 countries on the combined science literacy scale. The United States scored lower, on average, than their peers in the United Kingdom, Germany, Japan, and Canada on the combined science literacy scale and on each of the three science literacy subscales: identifying scientific issues, explaining phenomena scientifically, and using scientific evidence. U.S. students outperformed their peers in Italy and the russian Federation on the identifying scientific issues subscale and in Italy on the using scientific evidence subscale (indicator 10). About one-quarter of 15-year-old students in the
United States scored at or below the lowest proficiency level on the PISA 2006 combined science literacy scale, a larger percentage of students than in the United Kingdom, Germany, Japan, and Canada (indicator 11).
Although parent occupational status was generally higher for U.S. 15-year-old students compared to their G-8 peers, U.S. students from families with low occupational status were outperformed by students from families with low occupational status in the United Kingdom, Germany, Canada, and Japan in science literacy (indicator 12).
In PISA, students reported if they were native (born in the country of assessment with at least one of their parents born in the same country), or had an immigrant background within two generations. Students not reporting native also reported if they were second generation (born in the country of assessment but with parents born in another country), or first generation (born in another country and with parents born in another country). In all of the G-8 countries except the russian Federation, 15-year-old second- and first-generation students scored lower on the PISA 2006 combined science literacy scale compared to their native peers (indicator 13).
Context for Learning
Reading instruction
There are three indicators pertaining to reading instruction (indica-tors 14-16) that use teacher-reported data from PIrLS.
In 2006, fourth-grade teachers’ reports of the average number of hours spent on reading instruction each week generally varied widely both across countries and within countries (indicator 14). In three G-8 countries (England, Germany, and Italy), the highest percentages of fourth-graders had teachers who reported spending 3 hours or less on reading instruction per week. In two G-8 countries (France and the russian Federation), teachers most frequently cited spending over 3 hours but not more than 6 hours on reading instruction. The United States was the only participating G-8 country in which the majority of fourth-graders had teachers who reported spending more than 6 hours on reading instruction per week (68 percent) (indicator 14).
In 2006, one of the most common strategies for assisting students having difficulty reading was to ask parents to help their child with reading. A second strategy commonly used was working with students individually. When asked about access to remedial reading specialists, 34 percent of fourth-graders in the United States and 24 percent of fourth-graders in England had teachers who reported always having a remedial reading specialist available. Less than 10 percent of fourth-graders in France, Germany, and Italy had teachers who reported always having a remedial reading specialist available. England had the lowest percentage of fourth-graders whose teach-ers never had access to a remedial reading specialist (16 percent), while Italy had the highest (95 percent). In the United States, 29 percent of fourth-graders had teachers who reported never having access to a remedial reading specialist (indicator 15).
5 England, France, Germany, Italy, the Russian Federation, Scotland, and the United States participated in PIRLS 2006. Canada also participated, but as separate provinces (Alberta, British Columbia, Nova Scotia, Ontario, and Quebec). PIRLS 2006 data for Canadian provinces are included in appendix B.6 England, Germany (fourth grade only), Italy, Japan, the Russian Federation, Scotland, and the United States participated in TIMSS 2007.

SUMMArY v
Among the G-8 countries, the only measurable difference from 2001 to 2006 in the percentage of fourth-graders with teachers reporting their age as 50 years or older was in the United States, where it was 12 percentage points lower in 2006 compared to 2001. The reported average years of teaching experience declined by 3 years in France, Germany, and the United States during this time period. In 2006, teachers of fourth-graders in England and the United States reported an average of 12 years of teaching experience (at all grades). This was lower than in all other participating G-8 countries, where teaching experience ranged from an average of 15 years in France to 22 years in Italy and the russian Federation (indicator 16).
Teachers’ working time
In 2006, teachers in the United States at the primary, lower secondary, and upper secondary levels were contracted to teach 1,080 hours during the school year.7 Teachers in the United States were contracted to teach more hours than their peers in the other reporting G-8 countries (France, Germany, Italy, the russian Federation, and Scotland). However, U.S. teachers worked less total hours than their peers in Japan and Germany when working time was defined not only as time spent on teaching but also as time spent on other work-related activities (indicator 17).
Teacher professional development in mathematics and science
There are indicators pertaining to teacher professional development in mathematics (indicator 18) and science (indicator 19) that use teacher-reported data from TIMSS.
In 2007, the percentage of students whose teachers reported participating in professional development in mathematics content in the previous 2 years ranged from 22 percent in Italy to 66 percent in the russian Federation at fourth grade and 16 percent in Italy to 84 percent in the russian Federation at eighth grade; in the United States, the percentages were 60 percent at fourth grade and 81 percent at eighth grade. The percentage of students whose teachers reported participating in professional development in mathematics assessment ranged from 14 percent in Italy to 55 percent in the russian Federation at fourth grade and 17 percent in Italy to 71 percent in Scotland at eighth grade; in the United States, the percentages were 47 percent at fourth grade and 69 percent at eighth grade (indicator 18).
The percentage of students whose teachers reported participating in professional development in science content in the previous 2 years ranged from 16 percent in Italy to 58 percent in the russian Federation at fourth grade and 24 percent in Italy to 82 percent in the United States at eighth grade. The percentage of students whose teachers reported participating in professional development in science on improving students’ critical thinking or problem-solving skills ranged from 11 percent in Japan to 47 percent in Scotland
at fourth grade and 10 percent in Italy to 73 percent in the United States at eighth grade. Compared to their participating G-8 peers, the United States had a greater percentage of eighth-graders whose science teachers reported participating in these two areas of professional development (indicator 19).
School principals’ uses of summative achievement data
results from PISA indicate that in 2006, at least 90 percent of 15-year-old students in the United States and the United Kingdom had principals who reported that school achievement data were posted publicly (e.g., in the media). This compares to 75 percent of students in the russian Federation, 64 percent in Canada, and 33 percent in Italy. In Germany and Japan, 14 and 11 percent of students, respectively, had principals who reported that school achievement data were posted publicly. A greater percentage of 15-year-olds in the United States than in all other reporting G-8 countries had principals who reported that school achievement data were used in decisions about instructional resource allocation to the school; in the United States, 79 percent of students had principals who reported this use. At least 90 percent of students in Canada, the United Kingdom, the United States, and the russian Federation had principals who reported that school achievement data were tracked over time by an administrative authority (such as a district, state, or national education agency (indicator 20).
Frequency of behavior problems
results from TIMSS indicate that in 2007, the percentage of eighth-graders in schools whose principals reported at least a weekly occurrence of a classroom disturbance ranged from 8 percent in Japan to 60 percent in Scotland, with the United States at 55 percent. The percentage of eighth-graders in schools whose principals reported at least a weekly occurrence of intimidation or verbal abuse of other students ranged from 1 percent in the russian Federation to 39 percent in the United States, with the U.S. percentage higher than in all other participating G-8 countries (indicator 21).
Expenditure for Education
Public school teachers’ starting salaries
Of the G-8 countries reporting data in 2006 (England, France, Germany, Italy, Japan, Scotland, and the United States), Germany reported the highest average starting salary of public school teachers at both the primary and upper secondary levels, followed by the United States. In most G-8 countries in 2006 (Germany being the exception), public school teachers at the beginning of their careers earned less than the average Gross Domestic Product (GDP) per capita in their respective countries (indicator 22).
7 “Lower secondary education” refers to ISCED97 level 2. At this level of education, students continue to learn the basic subjects taught in level 1, but this level is typically more subject specific than level 1 and may be taught by specialized teachers. ISCED97 level 2 usually lasts between 2 and 6 years, and begins around the age of 11. Middle school and junior high (grades 7 through 9) in the United States are classified as level 2. “Upper secondary education” refers to ISCED97 level 3. At this level of education, student coursework is generally subject specific and often taught by specialized teachers. Students often enter upper secondary education at the age of 15 or 16 and attend anywhere from 2 to 5 years. ISCED97 level 3 can prepare students for university, further schooling, or the labor force. Senior high school (grades 10 through 12) is considered level 3 in the United States.

vi SUMMArY
Expenditure for education
All reporting G-8 countries in 2005 (Italy, France, Japan, Germany, the United Kingdom, and the United States) spent more money per student at the higher education level than at the combined primary and secondary education levels. More money in total was spent in 2005 at the combined primary and secondary education levels than at the higher education level, where the student enrollment is much lower. The United States spent $24,400 per student at the higher education level and $9,800 per student at the combined primary and secondary education levels, with both amounts higher than the figures in all other reporting G-8 countries. In total dollars as a percentage of GDP, the United States spent 2.9 percent of its GDP on higher education and 3.8 percent of its GDP on primary and secondary education. Overall, the United States spent a higher percentage of its GDP on education (6.7 percent) than all other G-8 countries (indicator 23).
Education Returns: Educational Attainment and IncomeIn 2006, the russian Federation had the largest percentage of adults ages 25 to 64 who had completed higher education (54 percent), followed by Canada (47 percent); Italy had the smallest percentage (13 percent).8 In the United States, 39 percent of adults ages 25 to 64 had completed higher education. Among 25- to 34-year-olds, greater percentages of females than males had completed higher
education in every G-8 country except Germany, where there was no measurable difference (indicator 24). A greater percentage of first university degrees9 were awarded in the combined field of social sciences, business, and law than in any other field in all G-8 countries. In science, mathematics, and engineering-related fields, the United States awarded among the lowest percentages of first university degrees of all the G-8 countries. The United States was the only G-8 country to award more first university degrees in the arts and humanities than in science, mathematics, and engineering (indicator 25).
In 2006, the United Kingdom had higher employment rates than all other reporting G-8 countries (Canada, France, Germany, Italy, Japan, and the United States) at three main levels of educational attainment. In all reporting G-8 countries, higher employment rates were associated with higher levels of educational attainment. The gap in employment rates between adults ages 25 to 64 whose highest educational attainment was lower secondary education or below and those who had completed academic higher education ranged from 23 percentage points in the United Kingdom and France to 31 percentage points in Germany. In all reporting G-8 countries, males had higher employment rates than did females with a comparable amount of education (indicator 26). Among U.S. 25- to 64-year-olds whose highest level of attainment was lower secondary education or below, 42 percent earned half the U.S. median income or less in 2006. This percentage was higher than in all other reporting G-8 countries (indicator 27).
8 In the Russian Federation, the reference year is 2003 rather than 2006.9 Programs that prepare students for advanced research and highly qualified professions are called first university degree programs and are classified under ISCED97 level 5A. First university degree programs vary in duration in different countries in different programs of study. In the United States, the first university degree corresponds to a bachelor’s degree; it excludes associate’s degrees.

ACKNOWLEDGMENTS vii
ACknOwLEDGMEntS
Much of the work for this report was performed by staff at the Education Statistics Services Institute (ESSI), which is funded by the National Center for Education Statistics (NCES) and composed of staff from the American Institutes for research (AIr) and a number of partner organizations. It is based on a similar publication produced by the French Ministry of Education.
The following international colleagues reviewed the descriptions of the education systems in appendix A and offered useful comments for updating them: Yves Beaudin of the Canadian Information Centre for International Credentials (Toronto, Canada), Galina Kovalyova of the russian Academy of Education (Moscow, russian Federation), Thierry rocher of the Ministry of National Education (Paris, France), Hanako Senuma of the National Institute for Educational Policy research (Tokyo, Japan), and Linda Sturman and Liz Twist of the National Foundation for Educational research (Slough, United Kingdom).


Contents ix
Contents
Summary .......................................................................................................................................................................................iii
Acknowledgments ..................................................................................................................................................................... vii
List of Tables ................................................................................................................................................................................. xi
List of Figures ...............................................................................................................................................................................xiii
Introduction ..................................................................................................................................................................................3
What’s New in 2009? ............................................................................................................................................................3
Education Levels Used for the Indicators ...........................................................................................................................3
Mapping G-8 Countries’ Education Systems to the ISCED97 ..........................................................................................4
Organization of the Report .................................................................................................................................................4
Data Sources ........................................................................................................................................................................5
Availability of Country Data ...............................................................................................................................................5
Data Quality and Response Rates .....................................................................................................................................6
Statistical Testing ..................................................................................................................................................................6
Other International Indicator Publications ........................................................................................................................6
Indicators
Part I: Population and School Enrollment .................................................................................................................................7
1: School-Age Population .............................................................................................................................................8
2: Enrollment in Formal Education ..............................................................................................................................10
3: Foreign Students in Higher Education ....................................................................................................................12
Part II: Academic Performance ...............................................................................................................................................15
Reading
4: Fourth-Grade Reading Literacy .............................................................................................................................16
5: Differences in Fourth-Grade Reading Literacy by Sex ........................................................................................18
Mathematics
6: Performance of Fourth- and Eighth-Graders in Mathematics ............................................................................22
7: Differences in Fourth- and Eighth-Grade Mathematics Achievement by Sex .................................................24
Science
8: Performance of Fourth- and Eighth-Graders in Science .....................................................................................28
9: Differences in Fourth- and Eighth-Grade Science Achievement by Sex ..........................................................30
10: Science Performance of 15-Year-Olds Across Content Areas ...........................................................................32
11: Science Proficiency of 15-Year-Olds ......................................................................................................................34
12: Science Achievement and Parent Occupational Status ...................................................................................36
13: Science Achievement and Immigrant Status ......................................................................................................38
Page

x CONTENTS
Part III: Context for Learning .....................................................................................................................................................41
14: Time Devoted to Reading Instruction During the School Week .........................................................................42
15: Fourth-Grade Teachers’ Strategies for Assisting Students Having Difficulty Reading .......................................44
16: Trends in Teachers’ Age and Experience ..............................................................................................................46
17: Teachers’ Working Time ...........................................................................................................................................48
18: Teacher Professional Development in Mathematics ...........................................................................................50
19: Teacher Professional Development in Science ....................................................................................................52
20: School Principals’ Uses of Summative Achievement Data .................................................................................54
21: Frequency and Severity of Behavior Problems .....................................................................................................56
Part IV: Expenditure for Education ...........................................................................................................................................59
22: Public School Teachers’ Starting Salaries ..............................................................................................................60
23: Expenditure for Education ......................................................................................................................................62
Part V: Education Returns: Educational Attainment and Income ........................................................................................65
24: Educational Attainment in the Adult Population .................................................................................................66
25: First University Degrees by Field of Study ...............................................................................................................68
26: Employment Rates ...................................................................................................................................................70
27: Distribution of Population by Education and Income .........................................................................................72
References ..................................................................................................................................................................................75
Appendix A: The Education Systems of the G-8 Countries ...................................................................................................77
Reader’s Guide: Education System Charts......................................................................................................................79
The Education System in Canada ....................................................................................................................................81
The Education System in France .......................................................................................................................................83
The Education System in Germany ...................................................................................................................................85
The Education System in Italy ............................................................................................................................................87
The Education System in Japan ........................................................................................................................................89
The Education System in the Russian Federation ............................................................................................................91
The Education System in the United Kingdom ................................................................................................................93
The Education System in England, Northern Ireland, and Wales .......................................................................93
The Education System in Scotland .........................................................................................................................95
The Education System in the United States ......................................................................................................................97
Appendix B: PIRLS 2006 Indicator Tables Including Canadian Provincial Data ..................................................................99
Page

CONTENTS xi
LISt Of tABLES
1. Population ages 5 to 29, 5 to 19, and 20 to 29, by country: 1998 and 2008 ...........................................................9
2. Percentage of population ages 5 to 29, 5 to 19, and 20 to 29, by country: 1998 and 2008 ................................9
3. Percentage of population ages 3 to 29 enrolled in formal education, by age group and country: 2006 ...............................................................................................................................................................................11
4. Percentage of fourth-graders whose teachers reported employing specific strategies for assisting students having difficulty reading, by country: 2006 ..............................................................................................................45
5. Teacher working time required at school and statutory working time in hours over the school year, by level of education and country: 2006 ................................................................................................................................49
6. Public school teachers’ average starting salaries in U.S. dollars converted using purchasing power parities (PPPs) expressed as a ratio of gross domestic product (GDP) per capita in U.S. dollars, by education level and country: 2006 ...........................................................................................................................61
7. Number of first university degree recipients, by field of study and country: 2006 ...............................................69
8. Percentage of the population ages 25 to 64, by highest level of education, income, and country: 2006 ...............................................................................................................................................................................73
B1. Average scale scores of fourth-grade students in reading literacy, by jurisdiction: 2006 ...............................100
B2. Percentage of fourth-grade students reaching PIRLS international benchmarks in reading literacy, by jurisdiction: 2006 ..................................................................................................................................................100
B3. Average scale scores of fourth-grade males and females in reading literacy, by jurisdiction: 2006 .............101
B4. Percentage distribution of fourth-grade students receiving reading instruction each week, by teacher reports of average number of hours spent on reading instruction each week and jurisdiction: 2006 ...........................................................................................................................................................................101
B5. Percentage of fourth-graders whose teachers reported employing specific strategies for assisting students having difficulty reading, by jurisdiction: 2006 ......................................................................................102
B6. Percentage distribution of fourth-graders, by teacher reports of availability of remedial reading specialist and jurisdiction: 2006 ...............................................................................................................................................102
B7. Difference in percentage points of fourth-grade students with teachers ages 29 years or younger and 50 years or older as reported by teachers, by jurisdiction: 2001 and 2006 ...............................................103
B8. Average number of years of teaching experience (at all grades) as reported by teachers of fourth-grade students, by jurisdiction: 2001 and 2006 .........................................................................................103
Table Page


contents xiii
List of figures
1. Percentage change in population ages 5 to 29, 5 to 19, and 20 to 29, by country: 1998 to 2008 .....................9
2. Range of ages at which more than 90 percent of the population is enrolled in formal education, and ending age of compulsory education, by country: 2006 .......................................................................................11
3a. Percentage distribution of foreign students enrolled in higher education programs, by host country: 2006 ...............................................................................................................................................................................13
3b. Percentage of a country’s students enrolled in higher education who are foreign students, by country: 2006 ................................................................................................................................................................13
4a. Average scale scores of fourth-grade students in reading literacy, by country: 2006 .......................................17
4b. Percentage of fourth-grade students reaching PIRLS international benchmarks in reading literacy, by country: 2006 .........................................................................................................................................................17
5a. Average scale scores of fourth-grade students in reading literacy, by sex and country: 2006 .........................19
5b. Difference in average scale scores between fourth-grade males and females in reading literacy, by country: 2006 ..........................................................................................................................................................19
6. Percentage of fourth- and eighth-grade students reaching TIMSS international benchmarks in mathematics, by country: 2007 .................................................................................................................................23
7a. Average scale scores of fourth- and eighth-grade students in mathematics literacy, by sex and country: 2007 ................................................................................................................................................................25
7b. Difference in average scale scores between fourth- and eighth-grade males and females in mathematics, by country: 2007 .................................................................................................................................25
8. Percentage of fourth- and eighth-grade students reaching TIMSS international benchmarks in science, by country: 2007 ..........................................................................................................................................29
9a. Average scale scores of fourth- and eighth-grade students in science, by sex and country: 2007 .................31
9b. Difference in average scale scores between fourth- and eighth-grade males and females in science, by country: 2007 ...........................................................................................................................................31
10. Average subscale scores of 15-year-old students in science literacy, by country: 2006 ....................................33
11. Percentage distribution of 15-year-old students on PISA 2006 proficiency levels in science literacy, by country: 2006 .........................................................................................................................................................35
12a. Average scale scores of 15-year-old students in science literacy in PISA 2006, by parent occupational status and country: 2006 .............................................................................................................................................37
12b. Change in average scale scores of 15-year-old students in science literacy in PISA 2006 per one-standard-deviation increase in the parent occupational index, by country: 2006 ....................................37
13a. Percentage distribution of 15-year-old students, by immigrant status and country: 2006 .................................39
13b. Average scale scores of 15-year-old students in science literacy, by immigrant status and country: 2006 ...............................................................................................................................................................................39
14. Percentage distribution of fourth-grade students receiving reading instruction each week, by teacher reports of average number of hours spent on reading instruction each week and country: 2006 ..................43
15. Percentage distribution of fourth-graders, by teacher reports of availability of remedial reading specialist and country: 2006 .......................................................................................................................................45
Figure Page

xiv CONTENTS
16a. Difference in percentage points of fourth-grade students with teachers ages 29 years or younger and 50 years or older as reported by teachers, by country: 2001 and 2006 .......................................................47
16b. Average number of years of teaching experience (at all grades) as reported by teachers of fourth-grade students, by country: 2001 and 2006 .........................................................................................................................47
17. Average number of teaching hours over the school year, by level of education and country: 2006 .............49
18. Percentage of fourth-grade and eighth-grade students whose teachers reported that they participated in various professional development activities in mathematics in the 2 years prior to assessment, by country: 2007 ................................................................................................................................................................51
19. Percentage of fourth-grade and eighth-grade students whose teachers reported that they participated in various professional development activities in science in the 2 years prior to assessment, by country: 2007 ...............................................................................................................................................................................53
20. Percentage of 15-year-old students whose principals reported that they used summative achievement data in various ways, by country: 2006 ............................................................................................55
21a. Percentage of eighth-grade students whose principals reported that behavior threatening a safe and orderly environment occurs at least weekly, by selected behavior and country: 2007 ............................57
21b. Percentage of eighth-grade students whose principals reported that behavior threatening a safe and orderly environment is a serious problem, by selected behavior and country: 2007 .................................57
22. Public school teachers’ average starting salaries in U.S. dollars converted using purchasing power parities (PPPs), by education level and country: 2006 ............................................................................................61
23a. Annual education expenditure per student, by education level and country: 2005 .........................................63
23b. Annual education expenditure as a percentage of gross domestic product (GDP), by education level and country: 2005 ..............................................................................................................................................63
24a. Percentage distribution of the population ages 25 to 64, by highest level of education completed and country: 2006 ........................................................................................................................................................67
24b. Percentage of the population ages 25 to 34 who had completed higher education, by sex and country: 2006 ................................................................................................................................................................67
25. Percentage distribution of first university degrees awarded, by field of study and country: 2006 ....................69
26a. Employment rates of adults ages 25 to 64, by highest level of education and country: 2006 ..........................71
26b. Employment rates of adults ages 25 to 64, by sex, highest level of education, and country: 2006 ..................71
27. Percentage of the population ages 25 to 64 who earned more than the median income, by highest level of education and country: 2006 .......................................................................................................................73
A-1. Levels of education in Canada, by age and year of schooling: 2008 .................................................................81
A-2. Levels of education in France, by age and year of schooling: 2008 ....................................................................83
A-3. Levels of education in Germany, by age and year of schooling: 2008 ...............................................................85
A-4. Levels of education in Italy, by age and year of schooling: 2008 .........................................................................87
A-5. Levels of education in Japan, by age and year of schooling: 2008 .....................................................................89
A-6. Levels of education in the Russian Federation, by age and year of schooling: 2008 .........................................91
A-7. Levels of education in England, Northern Ireland, and Wales, by age and year of schooling: 2008 ...............93
A-8. Levels of education in Scotland, by age and year of schooling: 2008 ................................................................95
A-9. Levels of education in the United States, by age and year of schooling: 2008 ..................................................97
Figure Page

Introduction


IntroductIon 3
IntroductIonWith the long-term growth in the trade of goods and services in the global economy, policymakers have turned to international comparisons to assess how well national systems of education are performing. these comparisons shed light on a host of issues, including access to education, equity of resources, and outcomes such as educational attainment and performance on standardized tests. they provide the opportunity to compare different aspects of countries’ education systems, assess these systems’ performance, and identify potential strategies to improve student achievement and system outputs.
Since the 1960s, the united States has participated actively in international projects that are designed to provide key information about the performance of the u.S. education system relative to education systems in other countries. these projects include the Indicators of national Education Systems (InES) at the organization for Economic cooperation and development (oEcd); the Progress in International reading Literacy Study (PIrLS); the Program for International Student Assessment (PISA); and the trends in International Mathematics and Science Study (tIMSS). this report, Comparative Indicators of Education in the United States and Other G-8 Countries: 2009, draws on the most current information available from most of these projects at the time the report was being produced (in the summer and fall of 2008) to present a set of education indicators that describes how the u.S. education system compares with education systems in other economically developed countries. updated information from these various projects will be incorporated in subsequent reports.
Although the international education projects cited above involve many countries worldwide, the comparisons in this report focus on the Group of Eight (G-8) countries: canada, France, Germany, Italy, Japan, the russian Federation, the united Kingdom, and the united States. these are among the most industrialized countries in the world. the G 8 countries were selected as a comparison group because of the similarities in their economic development and because the other G-8 countries are among the major economic partners of the united States. the leaders of these countries meet regularly to discuss economic and other policy issues.
What’s New in 2009?this report is the fourth in a series of reports published by the national center for Education Statistics (ncES) that describes how the education system in the united States compares with education systems in the other G-8 countries. It is the first of these reports to include data from all three international assessments of students in which the united States regularly participates—PIrLS, PISA, and tIMSS. the indicators use 2006 data from PIrLS and PISA and 2007 data from tIMSS. Many of the indicators in this report are updates of previous indicators that used data from earlier cycles, such as tIMSS 1999 and PIrLS 2001. there are also a few new
PIrLS indicators—one presenting data using the PIrLS international performance benchmarks, another reporting the amount of time spent on reading instruction at school, and another highlighting trends in teacher preparation and experience.
the PISA indicators, in particular, offer a unique contribution to the series of Comparative Indicators reports. PISA is a system of international assessments that measures 15-year-old students’ performance in reading literacy, mathematics literacy, and science literacy every 3 years. Although all three of these subject areas are assessed in each PISA data collection effort, one is assessed in depth (i.e., is considered the major subject area) on a rotating basis. the major subject area in 2000 (when PISA was initiated) was reading literacy; in 2003, it was mathematics literacy. thus, prior Comparative Indicators reports have focused on 15-year-old students’ reading and mathematics performance. the current report features indicators pertaining to students’ science performance, as assessed in the most recent (2006) study.
the 2008 edition of Education at a Glance, which presents international education data compiled by oEcd, was used largely to update several indicators that have been presented previously. However, this resource was also used to produce a new indicator in this report: teachers’ working time.
Education Levels Used for the IndicatorsMany of the indicators in this report refer to at least one of the following education levels: preprimary education, primary educa-tion, secondary education, and higher education. A brief overview of the education levels is presented here to provide the reader with a frame of reference while reading the indicators (see appendix A for more detailed descriptions). to ensure comparability in the indicators across countries, each country restructured its national education data to correspond with the definitions of education levels that were developed in the 1997 revision of the International Standard classification of Education (IScEd97) (united nations Educational, Scientific and cultural organization [unESco] 1997). the following descriptions highlight the key features of (1) educa-tion programs from preprimary through secondary education and (2) higher education programs.
Preprimary education includes programs of education for children at least 3 years of age that involve organized, center-based instructional activities; in most countries, preprimary education is not compulsory. Primary education includes programs that are designed to give students a sound basic education in reading, writing, and mathematics, along with an elementary understand-ing of other subjects, such as history, geography, science, art, and music. In the international classification, primary education usually begins at the start of compulsory education (around age 6) and lasts for 6 years. Secondary education encompasses two stages: lower secondary education and upper secondary

4 INTrODUCTION
education. Lower secondary education includes programs that are designed to complete basic education; the standard duration in the international classification is 3 years. Upper secondary education is designed to provide students with more in-depth knowledge of academic or vocational subjects and to prepare them for higher level academic or vocational studies or entry into the labor market. The standard duration of upper secondary education in the international classification is 3 years.
Higher education includes tertiary programs1 that fall into three main categories:
Academic higher education below the doctoral level. • These largely theory-based programs are intended to provide sufficient qualifications to gain entry into advanced research programs and professions with high skill requirements. To be classified as such, a degree program must last at least 3 years and is typically preceded by at least 13 years of formal schooling. In the United States, bachelor’s, master’s, and first professional degree programs are classified at this level. Vocational higher education. • These programs provide a higher level of career and technical education and are designed to prepare students for the labor market. In the international classification, these programs last 2 to 4 years. In the United States, associate’s degree programs are classified at this level.Doctoral level of academic higher education. • These programs usually require the completion of a research thesis or dissertation.
The international classification also includes an education level that straddles the boundary between upper secondary and higher education: postsecondary nontertiary education. These programs of study—which are primarily vocational in nature—are generally taken after the completion of upper secondary education. They are often not significantly more advanced than upper secondary programs, but they serve to broaden the knowledge of participants who have already completed upper secondary education. In the United States, these programs are often in the form of occupationally specific vocational certificate programs, such as 1-year certification programs offered at technical institutes or community colleges.2
Mapping G-8 Countries’ Education Systems to the ISCED97 Matching the education levels of individual countries to the ISCED97 classification can be challenging, because the particulars of individual countries seldom fit ISCED97 perfectly. Using ISCED97 classifications as a starting point, NCES worked with education professionals in other G-8 countries to create a general overview of each country’s education system. As an aid to the reader, schematics of how the ISCED97 applies to each of the G-8 countries are provided in appendix A, accompanied by text describing each system in greater detail.
Organization of the Report The report begins with a summary section that highlights key findings; it then presents 27 indicators that compare different aspects of the education system in the United States to education systems in other G-8 countries. The indicators are organized into the following sections:
population and school enrollment;•academic performance, with subsections for reading, mathemat-•ics, and science;context for learning;•expenditure for education; and•education returns: educational attainment and income.•
The first section, population and school enrollment, presents indicators that suggest the potential demand for education in countries as measured by the size and growth of their school-age population and current levels of enrollment in formal education. The section concludes with an indicator that examines the extent to which foreign students are enrolled in higher education across the G-8 countries.
The next section, academic performance, has indicators grouped by subject area into three subsections: reading, mathematics, and science. The indicators present findings on student performance in the G-8 countries, including achievement differences across key demographic variables such as sex, parent occupational status, and immigrant status.
The third section highlights a range of key policy-relevant issues pertaining to the context for learning across the G-8 countries. For example, using data as reported by school teachers, there are indicators pertaining to the amount of time devoted to reading instruction, strategies used to assist students who have fallen behind in reading, trends in teacher preparation and experience, teachers’ working time, and teacher professional development in mathematics and science. This section also presents the reports of school principals on the uses of summative achievement data and the frequency of student behavior problems.
The fourth section provides a comparative look at expenditure for education, including breakdowns by expenditure as a percentage of a country’s gross domestic product (GDP) and an indicator on public school teacher salaries in primary and secondary education.
The final section, education returns: educational attainment and income, focuses on educational attainment, employment rates, and earnings (including breakdowns by sex and field of study).
Each indicator is presented in a two-page format. The first page presents key findings that highlight how the United States compares with its G-8 peers (with data available) on the issue examined in the indicator. The key findings are followed by a section that defines
1 In the international classification, more advanced postsecondary education (such as attending a 4-year college or university) is referred to as “tertiary education.” In the current report, the term “higher education” is used because this term is more familiar to American readers.2 In data showing annual education expenditure (indicator 23), postsecondary nontertiary education data are included under secondary education and/or higher education for one or more countries as specified in the figures. In data showing the percentage distribution of the population by highest level of education completed (indicator 24), employment rates (indicator 26), and the distribution of the population by education and income (indicator 27), postsecondary nontertiary education data are included under upper secondary education for all G-8 countries reporting data.

INTrODUCTION 5
the terms used in the indicator and describes key features of the methodology used to produce it. The second page presents graphical depictions of the data that support the key findings. These tables and/or figures also include the specific data source for the indicator and more detailed notes on interpreting the data.
Data Sources There are four main sources of data for this report:
INES data. • Data from the INES project come from tables in Education at a Glance: OECD Indicators 2008 or from OECD’s online Education Database. These data are derived from annual data collections carried out by OECD, with member countries’ data coming from a variety of national data sources, including administrative data collections, school surveys, household surveys, and national financial reports. Most of the indicator data for the United States come from the Current Population Survey (CPS) of the U.S. Census Bureau, the NCES Common Core of Data (CCD), the NCES Integrated Postsecondary Education Data System (IPEDS), and the NCES Schools and Staffing Survey (SASS).PIRLS 2006 data. • PIrLS is conducted by the International Association for the Evaluation of Educational Achievement (IEA) and is an assessment of fourth-graders in reading literacy.PISA 2006 data.• PISA is conducted by OECD and is an assessment of 15-year-old students, with a major focus in 2006 on science literacy.TIMSS 2007 data. • TIMSS is conducted by IEA and is an assessment of fourth- and eighth-graders in mathematics and science.
Data for indicator 1, on school-age population, are from the International Data Base (IDB) of the U.S. Census Bureau.
Throughout this report, student data are often presented. Some indicators show
the mean scores of students (e.g., indicators 5 and 10), •the percentage of students meeting certain criteria, such as •the percentage of students reaching established achievement benchmarks (e.g., indicators 6 and 11), orthe percentage of students with particular characteristics, •such as the percentage of students by immigrant status (indicator 13).
Other indicators also use the student as the unit of analysis, but the data are reported from other sources. These include
school principals, such as the percentage of students whose •principals reported that they used summative achievement data in various ways (indicator 20) or teachers, such as the percentage of students whose teachers •reported participating in various professional development activities (indicators 18 and 19).
In several other indicators, the unit of analysis is not the student. For example, the unit of analysis may be
the teacher, as in public school teachers’ salaries (indicator 22) •or postsecondary degrees, as in first university degrees by field of •study (indicator 25).
When interpreting the data presented in this report, it is important for readers to be aware of limitations based on the source of information and problems that may exist in verifying comparability in reporting.
Except for indicator 22, which explicitly states that the data pertain to public school teachers only, the indicators in this report include data from both public and private schools.
Availability of Country Data It should be noted that many of the indicators in this report do not contain data for the complete set of G-8 countries. That is, specific countries are sometimes not included or are only partially included in an indicator. This is the result of source data not being reported, or specific countries or jurisdictions within a country not participating in a particular survey. For example, Japan did not participate in PIrLS 2006, France did not participate in TIMSS 2007, and Germany did not participate in TIMSS 2007 at the eighth grade; therefore, these countries do not appear in indicators using these data. Two other countries that warrant special mention include Canada and the United Kingdom.
Canada participated as a unified country in PISA 2006, and in this report, data for Canada are shown and discussed in the PISA indicators. However, in PIrLS 2006, Canada participated as separate provinces. In this report, results for the Canadian provinces are not reported in the PIrLS indicators; rather, they can be found in the appendix tables (see appendix B). In TIMSS 2007, some Canadian provinces took part in the study as benchmarking participants. These findings do not appear in this report, but they can be found in the international reports published by IEA (Mullis, Martin, and Foy 2008; Martin, Mullis, and Foy 2008).
The United Kingdom, which includes England, Northern Ireland, Scotland, and Wales, participated in PISA 2006. However, in PIrLS 2006 and TIMSS 2007, only England and Scotland participated, and they participated as separate jurisdictions. Northern Ireland and Wales did not participate in PIrLS 2006 or TIMSS 2007. In this report, the PISA indicators include data for the United Kingdom, and the PIrLS and TIMSS indicators include data for England and Scotland shown separately.
Thus, as discussed in indicators using PIrLS data, the participating G-8 countries include England, France, Germany, Italy, the russian Federation, Scotland, and the United States. In indicators using TIMSS data, participating G-8 countries include England, Germany, Italy, Japan, the russian Federation, Scotland, and the United States at fourth grade, and England, Italy, Japan, the russian Federation, Scotland, and the United States at eighth grade.3 In indicators using INES data, the reporting G-8 countries vary somewhat; these are shown in each indicator.
While every effort was made to use the most up-to-date data available across the G-8 countries (usually from 2006 or 2007), data from earlier years were sometimes used if more recent data were not available. To make this clear to the reader, these occurrences are noted in relevant tables and figures.
3 Germany participated in TIMSS 2007 at the fourth grade, but not the eighth grade.

6 INTrODUCTION
Data Quality and Response Rates PIrLS, PISA, and TIMSS have established technical standards of data quality including participation and response rate standards that countries must meet in order to be included in the compara-tive results. response rate standards were set using composites of response rates at the school, classroom, student, and teacher levels, and response rates were calculated with and without the inclusion of substitute schools that were selected to replace schools refusing to participate.4 These standards are described in detail in the technical reports (Martin, Mullis, and Kennedy 2007; OECD 2009; Olson, Martin, and Mullis 2008).
Consistent with NCES statistical standards, item response rates less than 85 percent are footnoted in the tables and figures of this report, as well as instances where reporting standards are not met because of too few observations to provide reliable estimates.
Statistical Testing Ten of the indicators presented in this report (indicators 1, 2, 3, 17, and 22-27) are derived either from administrative records that are based on universe collections or from national sample surveys for which standard errors were not available. Consequently, for these indicators, no tests of statistical significance were conducted to establish whether observed differences from the U.S. average were statistically significant. However, for the 17 other indicators derived from PIrLS, PISA, or TIMSS data (indicators 4-16 and 18-21), standard t tests were calculated for comparisons of estimates within or between countries (e.g., to test whether a U.S. estimate
is statistically different from other G-8 countries’ estimates). Differences were reported if they were found to be statistically significant at the .05 level, using two-tailed tests of significance for comparisons of independent samples.
Other International Indicator Publications Prior to this report, NCES produced three earlier reports—in 2006, 2004, and 2002—describing how the education system in the United States compares with education systems in the other G-8 countries. The 2006 report can be found at http://nces.ed.gov/pubsearch/pubsinfo.asp?pubid=2007006. The 2004 report can be found at http://nces.ed.gov/pubsearch/pubsinfo.asp?pubid=2005021. The 2002 report can be found at http://nces.ed.gov/pubsearch/pubsinfo.asp?pubid=2003026. General information about the International Activities Program at NCES, including work on international comparisons in education, can be found at http://nces.ed.gov/surveys/international.
4 International requirements state that each country must make every effort to obtain cooperation from the sampled schools, but the requirements also recognize that this is not always possible. Thus, it is allowable to use substitute schools as a means to avoid sample size loss associated with school nonresponse. To do this, each sampled school was assigned two substitute schools in the sampling frame. Substitutes for noncooperating sampled schools were identified by assigning as substitute schools the schools that immediately preceded and followed the sampled school on the frame. The sampling frame was sorted by the stratification variables and by a measure of size to ensure that any sampled school’s substitute had similar characteristics.

indicators part iindicators part iPopulation and School Enrollment

8 INDICATOrS PArT I: POPULATION AND SCHOOL ENrOLLMENT
From 1998 to 2008, the United States had the largest net percentage gain in population size of 5- to 29-year-olds (6 percent) among the G-8 countries.
In 2008, the total population across the G-8 countries ranged from 33.2 million in Canada to 303.8 million in the United States, and the population of 5- to 29-year-olds (roughly the population most likely to be enrolled in education) ranged from 10.4 million in Canada to 104.2 million in the United States (table 1). The population of 5- to 29-year-olds represented 34 percent of the total population in the United States (table 2). In the other G-8 countries, the corresponding percentages ranged from 25 percent in Italy to 33 percent in the russian Federation.
From 1998 to 2008, the United States had the largest net percent-age gain in population size of 5- to 29-year-olds (6 percent) among the G-8 countries (figure 1). The population of 5- to 29-year-olds declined in every other G-8 country except for Canada, with decreases from 1998 to 2008 ranging from 1 percent in the United Kingdom to 18 percent in Japan. In Canada, growth of this population was essentially flat (0.4 percent).
The subpopulation of 5- to 19-year-olds (which generally includes individuals of primary- and secondary-school age) represented 20 percent of the total population in the United States in 2008 (table 2). The U.S. percentage was higher than the percentages in
G-8 Countries Included: Canada, France, Germany, Italy, Japan, Russian Federation, United Kingdom, United States
SCHOOL-AGE pOpULAtIOn
all other G-8 countries, which ranged from 14 percent in Italy and Japan to 18 percent in France, the United Kingdom, and Canada.
The United States was the only G-8 country to experience a net percentage gain in subpopulation size of 5- to 19-year-olds from 1998 to 2008 (3 percent) (figure 1). The population of 5- to 19-year-olds declined in all other G-8 countries, with decreases from 1998 to 2008 ranging from 1 percent in France to 32 percent in the russian Federation.
The subpopulation of 20- to 29-year-olds (which generally includes individuals of postsecondary education age) represented 14 percent of the total population in the United States in 2008, below the percentage in the russian Federation (17 percent) (table 2). The percentages in the other G-8 countries were slightly lower than in the United States, ranging from 11 percent in Italy to 13 percent in Canada, the United Kingdom, and France.
The russian Federation had the largest net percentage gain in subpopulation size of 20- to 29-year-olds, an increase of 14 percent from 1998 to 2008 (figure 1). The United States had the second largest net percentage gain in subpopulation size (11 percent). Among the other G-8 countries, Canada and the United Kingdom experienced a net percentage gain from 1998 to 2008 (7 and 1 percent, respectively), while the other G-8 countries experienced declines over this period, ranging from 5 percent in France to 28 percent in Italy.
Definitions and Methodology
In each country, the percentage of the population of 5- to 29-year-olds in 1998 and 2008 is calculated by dividing the population of 5- to 29-year-olds by the total population. The percentage change in the population of 5- to 29-year-olds is calculated by subtracting the population of 5- to 29-year-olds in 1998 from this population in 2008 and dividing by the 1998 population of 5- to 29-year-olds.
These calculations are applied in the same way to the age groups 5 to 19 and 20 to 29. The age group (e.g., 5 to 29) as a percentage of the total population may have declined from 1998 to 2008 even though the size of the age group may have increased. This is because of a higher rate of increase of the total population compared to the rate of increase for the specific population age group.

Indicator
INDICATOrS PArT I: POPULATION AND SCHOOL ENrOLLMENT 9
1
Table 1. Population ages 5 to 29, 5 to 19, and 20 to 29, by country: 1998 and 2008[in millions]
Age group and year Canada France Germany Italy JapanRussian
FederationUnited
Kingdom1United States
Total population (all ages)1998 30.6 60.5 82.0 57.6 126.2 147.8 59.0 276.12008 33.2 64.1 82.4 58.1 127.3 140.7 60.9 303.8
Population ages 5 to 291998 10.4 20.5 23.9 17.5 40.1 54.0 19.3 98.32008 10.4 20.0 22.2 14.5 32.9 46.1 19.1 104.2
Population ages 5 to 191998 6.2 11.9 13.6 8.8 21.0 33.4 11.4 60.22008 6.0 11.8 12.5 8.2 18.2 22.7 11.1 61.9
Population ages 20 to 291998 4.2 8.6 10.2 8.7 19.1 20.6 7.9 38.12008 4.5 8.2 9.7 6.3 14.8 23.5 8.0 42.3
1 The United Kingdom includes England, Northern Ireland, Scotland, and Wales.NOTE: Detail may not sum to totals because of rounding. SOURCE: U.S. Department of Commerce, U.S. Census Bureau. (2008). International Data Base (IDB), Table 94: Midyear Population, by Age and Sex, 1998 and 2008.
Table 2. Percentage of population ages 5 to 29, 5 to 19, and 20 to 29, by country: 1998 and 2008
Age group and year Canada France Germany Italy JapanRussian
FederationUnited
Kingdom1United States
Population ages 5 to 291998 34.0 33.9 29.1 30.4 31.7 36.5 32.7 35.62008 31.4 31.2 26.9 24.9 25.9 32.8 31.3 34.3
Population ages 5 to 191998 20.3 19.7 16.6 15.2 16.6 22.6 19.2 21.82008 17.9 18.4 15.2 14.1 14.3 16.1 18.2 20.4
Population ages 20 to 291998 13.7 14.2 12.5 15.2 15.1 14.0 13.4 13.82008 13.4 12.8 11.7 10.8 11.6 16.7 13.2 13.9
1 The United Kingdom includes England, Northern Ireland, Scotland, and Wales.NOTE: Detail may not sum to totals because of rounding. SOURCE: U.S. Department of Commerce, U.S. Census Bureau. (2008). International Data Base (IDB), Table 94: Midyear Population, by Age and Sex, 1998 and 2008.
Figure 1. Percentage change in population ages 5 to 29, 5 to 19, and 20 to 29, by country: 1998 to 2008
1 The United Kingdom includes England, Northern Ireland, Scotland, and Wales.SOURCE: U.S. Department of Commerce, U.S. Census Bureau. (2008). International Data Base (IDB), Table 94: Midyear Population, by Age and Sex, 1998 and 2008.
-50
-40
-30
-20
-10
0
10
20
30
40
50
0
-4
7
-3 -1-5 -7 -8 -6
-17
-7
-28
-18-13
-23
-15
-32
14
-1 -2
16 3
11
Canada France
Country
Percent change
Germany Italy Japan Russian Federation
UnitedKingdom1
UnitedStates
20 to 29 years5 to 19 years5 to 29 years

10 INDICATOrS PArT I: POPULATION AND SCHOOL ENrOLLMENT
G-8 Countries Included: France, Germany, Italy, Japan, Russian Federation, United Kingdom, United States
EnROLLMEnt In fORMAL EDUCAtIOn
While the United States and the other reporting G-8 countries generally had nearly universal school participation of children ages 5–14, enrollment rates varied across countries at other age ranges.
In 2006, all or almost all 3- and 4-year-old children were enrolled in preprimary or primary education programs in France and Italy (table 3). In Germany, the United Kingdom, and Japan, at least 80 percent of 3- and 4-year-olds were enrolled in preprimary or primary education programs; in the United States, 48 percent were enrolled. Beginning at age 6 in the United States and at age 7 in the russian Federation, at least 90 percent of the population was enrolled in formal education (figure 2).
In 2006, the United States and most other reporting G-8 countries had nearly universal school participation of children ages 5–14—the age range that typically corresponds with primary and lower secondary education (table 3). In the russian Federation, 82 percent of 5- to 14-year-olds were enrolled in formal education programs; all other G-8 countries were at 98 percent participation or higher.
The United States had an enrollment rate of 78 percent in 2006 for youth ages 15–19—the age range that corresponds most closely with upper secondary education. The U.S. rate was lower than the rates in Italy (81 percent), France (86 percent), and Germany (89 percent), but higher than the rates in the russian Federation (74 percent) and the United Kingdom (70 percent).
Compulsory education ends at age 18 in Germany, age 17 in the United States, age 16 in France and the United Kingdom, and age 15 in Italy, Japan, and the russian Federation (figure 2).5 While participation rates were at 90 percent or higher through the end of compulsory education in Italy, the russian Federation, France, and Japan, they fell below this level in Germany, the United Kingdom, and the United States.
Enrollment rates for 20- to 29-year olds—the age range that corresponds most closely to the typical age of enrollment in higher education—were less than 30 percent among the six G-8 countries reporting data (table 3). The United States had an enrollment rate of 23 percent for this age range. The U.S. rate was lower than the rate in Germany (28 percent), but higher than the rates in Italy and France (both at 20 percent), the russian Federation (19 percent), and the United Kingdom (17 percent).
Definitions and Methodology
The percentage of the population at given ages enrolled in education is called an “enrollment rate.” In this indicator, the term “enrollment rate” refers to the “net enrollment rate” and is defined as the number of students in a particular age group enrolled in education divided by the population of that same age group.
The reference year is 2006 for population and enrollment data in all countries except the russian Federation, which has a reference year of 2005. Enrollment rates may exceed 100 percent for some countries and some age categories largely because of different reference dates for school enrollment and population data.
Enrollments include all full-time and part-time students in public and private institutions. Enrollment in preprimary education programs (generally the 3- to 4-year-old age group) includes only children in preschool, nursery, or center-based daycare programs and excludes children in daycare operated in homes.
The ending age of compulsory education is the age at which individuals are no longer legally required to participate in formal education.
5 In some countries, the ending age of compulsory education is an average. For example, in the United States this age varies across states, ranging from 16 to 18; the modal age in the United States is 16.

Indicator
INDICATOrS PArT I: POPULATION AND SCHOOL ENrOLLMENT 11
2
Table 3. Percentage of population ages 3 to 29 enrolled in formal education, by age group and country: 2006
Country
Students participating in formal education
3- to 4-year-olds1 5- to 14-year-olds 15- to 19-year-olds 20- to 29-year-olds
France 100 100 86 20Germany 97 99 89 28Italy 100 100 81 20Japan 83 100 — —russian Federation2 — 82 74 19United Kingdom3 90 100 70 17United States 48 98 78 23
— Not available.1 Data show students age 4 and under as a percentage of the population of 3- to 4-year-olds.2 Reference year is 2005 rather than 2006.3 The United Kingdom includes England, Northern Ireland, Scotland, and Wales.NOTE: Reference year is 2006 for population and enrollment data in all countries except the Russian Federation, as noted above; however, reference dates may differ within that year. Thus, percentages shown in the table are approximations. As described in the source cited below, enrollment rates for some countries were reported as slightly exceeding 100 percent in one or more age ranges (e.g., see 5- to 14-year-olds) due to different reference dates for school enrollment and population data. Enrollment in formal education at the preprimary education level includes children in center-based programs and excludes children in home-based early childhood education. SOURCE: Organization for Economic Cooperation and Development (OECD). (2008). Education at a Glance: OECD Indicators 2008, table C2.1. Paris: Author.
Figure 2. Range of ages at which more than 90 percent of the population is enrolled in formal education, and ending age of compulsory education, by country: 2006
1 Reference year is 2005 rather than 2006.2 The United Kingdom includes England, Northern Ireland, Scotland, and Wales.3 The average ending age of compulsory education in the United States is 17. This age varies across states, ranging from 16 to 18; the modal age is 16 (Digest of Education Statistics, 2007, Table 157, U.S. Department of Education, National Center for Education Statistics, 2008). NOTE: Reference year is 2006 for population and enrollment data in all countries except the Russian Federation, as noted above; however, reference dates may differ within that year. Enrollment in formal education at the preprimary education level includes children who attended center-based programs and excludes children in home-based early childhood education. The ending age of compulsory education is the age at which individuals are no longer required to participate in formal education. For example, an ending age of 18 indicates that all students under 18 are legally obliged to participate in formal education. Data for Canada are not available except that Canada reports an ending age of compulsory education of 16–18 in 2005 (data not shown in figure). There are differences within the education system of Canada due to responsibilities and oversight for education taking place at the regional or local level. SOURCE: Organization for Economic Cooperation and Development (OECD). (2008). Education at a Glance: OECD Indicators, 2008, table C2.1. Paris: Author.
0
2
4
6
8
10
12
14
16
18
20Age
Country
��
UnitedKingdom2
4
1516
�
France
1617
3�
�
�
Germany
4
1718
�
�
�
Italy
3
15�
�
�
Russian Federation1
7
15
�
��
Japan
4
17
15
�
�
�
Age range at which more than 90 percent of population enrolled in formal education�
� Ending age of compulsory education
�
UnitedStates3
6
1617
�
�
�

12 INDICATOrS PArT I: POPULATION AND SCHOOL ENrOLLMENT
G-8 Countries Included: Canada, France, Germany, Italy, Japan, Russian Federation, United Kingdom, United States
fOREIGn StUDEntS In HIGHER EDUCAtIOn
Among the G-8 countries, the United States had the most foreign students (in absolute numbers) enrolled in higher education, but foreign students made up a larger percentage of enrollment in higher education in the United Kingdom, Canada, Germany, and France.
Over the past 3 decades, the number of foreign students (i.e., students enrolled outside their country of citizenship) in higher education has grown almost fivefold: from 0.6 million worldwide in 1975 to 2.9 million in 2006 (OECD 2008a). In 2006, G-8 countries (as countries of destination) hosted close to two-thirds of all foreign students in higher education (figure 3a). The United States received the largest percentage of these foreign students (20 percent), followed by the United Kingdom (11 percent), Germany (9 percent), and France (9 percent). Altogether, in 2006, these four G-8 countries accounted for almost one-half of all foreign students enrolled in higher education. The other G-8 countries each took
in between 2 and 5 percent of all foreign students enrolled in higher education.
In addition to the share of foreign students hosted by each G-8 country, another measure can be examined that takes into account the size of a country’s higher education system: the percentage of a country’s students enrolled in higher education who are foreign students. Among the G-8 countries, the United States had the largest number of foreign students enrolled in higher education (OECD 2008a). However, in comparison to the United States, foreign students made up a larger percentage of enrollments in higher education in the United Kingdom (18 percent), Canada (15 percent), Germany (11 percent), and France (11 percent) (figure 3b). In the United States, nonresidents made up 3 percent of the total enrollment in higher education.6 In the russian Federation, foreign students made up 1 percent of the total enrollment in higher education, lower than in all other G-8 countries.
Definitions and Methodology
Foreign students are defined as noncitizens enrolled in education programs in a host country, and thus some permanent residents are included. International students are defined as students who enrolled in institutions in other countries, and thus do not include
permanent residents. As shown in the figures, education levels are defined according to the International Standard Classification of Education (ISCED97). For more information on the ISCED97 levels, see appendix A.
6 Unlike the other G-8 countries, the United States did not specifically report the percentage of higher education enrollment consisting of foreign students. It instead reported the percentage of higher education enrollment consisting of international students. International students are defined as students who have crossed borders expressly with the intention to study, and thus do not include permanent residents. This measure, then, is a somewhat underestimated proxy for the number of foreign students.

Indicator
INDICATOrS PArT I: POPULATION AND SCHOOL ENrOLLMENT 13
3
Figure 3b. Percentage of a country’s students enrolled in higher education who are foreign students, by country: 2006
1 Percentage in total tertiary underestimated because of the exclusion of certain programs. 2 Reference year is 2005 rather than 2006. 3 Excludes private institutions. 4 The United Kingdom includes England, Northern Ireland, Scotland, and Wales. 5 The United States reports data on international students rather than foreign students. International students are defined as students who have crossed borders expressly with the intention to study (thus, do not include permanent residents). NOTE: Foreign students are defined as noncitizens enrolled in education programs in a host country (thus, some permanent residents are included). Countries of origin include 30 OECD countries, 177 non-OECD countries, and some nonspecified countries. Education levels are defined according to the International Standard Classification of Education (ISCED97). Except where otherwise noted, data shown include ISCED97 levels 5A (academic higher education below the doctoral level), 5B (vocational higher education), and 6 (doctoral level of academic higher education). For more information on the ISCED97 levels, see appendix A in this report. SOURCE: Organization for Economic Cooperation and Development (OECD). (2008). Education at a Glance: OECD Indicators 2008, table C3.1. Paris: Author.
Figure 3a. Percentage distribution of foreign students enrolled in higher education programs, by host country: 2006
1 Data are for international students defined on the basis of their country of residence. 2 The United Kingdom includes England, Northern Ireland, Scotland, and Wales. 3 Excludes private institutions.4 Excludes advanced research programs.5 Excludes tertiary-type B programs.6 Reference year is 2005 rather than 2006.NOTE: Most countries report the enrollment of foreign students, who are defined as noncitizens enrolled in education programs in a host country (thus, some permanent residents are included). Some countries, including the United States, report the enrollment of international students, who are defined as students who have crossed borders expressly with the intention to study (thus, do not include permanent residents). Countries of origin include 30 OECD countries, 177 non-OECD countries, and some nonspecified countries. Education levels are defined according to the International Standard Classification of Education (ISCED97). Except where otherwise noted, data shown include ISCED97 levels 5A (academic higher education below the doctoral level), 5B (vocational higher education), and 6 (doctoral level of academic higher education). For more information on the ISCED97 levels, see appendix A in this report. Detail may not sum to totals because of rounding. SOURCE: Organization for Economic Cooperation and Development (OECD). (2008). Education at a Glance: OECD Indicators 2008, chart C3.2 and web table C3.7. Paris: Author. Retrieved December 22, 2008, from http://dx.doi.org/10.1787/402158641726.
14.6
11.2 11.4
2.43.2
0.9
17.9
3.3
0
2
4
6
8
10
12
14
16
18
20Percent
Canada1,2,3 France Germany Italy Japan RussianFederation3
UnitedKingdom4
UnitedStates5
Country
Other than the G-838
Canada3,5,6
5France
9Germany4
9
Italy2
Japan4
Russian Federation3,4
3
United Kingdom1,2
11
United States1
20


indicators part iiindicators part iiAcademic Performance—Reading

16 INDICATOrS PArT II: ACADEMIC PErFOrMANCE—rEADING
G-8 Countries Included: England, France, Germany, Italy, Russian Federation, Scotland, United States
fOURtH-GRADE READInG LItERACy
On average, U.S. fourth-graders scored higher in reading lit-eracy than their peers in Scotland and France, but lower than their peers in Italy and the Russian Federation. Twelve percent of U.S. fourth-graders reached the advanced international benchmark.
The Progress in International reading Literacy Study (PIrLS) measures the reading comprehension of students in their 4th year of formal schooling. Begun in 2001, PIrLS is implemented every 5 years. Using data from PIrLS 2006, this indicator presents average scores on the combined reading literacy scale and the percentage of fourth-grade students reaching four established international benchmarks (low, intermediate, high, and advanced) in participating G-8 countries.7
In 2006, average scores on the combined reading literacy scale ranged from 522 in France to 565 in the russian Federation (figure 4a). Every participating G-8 country had an average score above the PIrLS scale average of 500.8 Fourth-graders in the russian Federation outperformed their peers in all other participating G-8 countries in terms of average scores, with students in Scotland and France scoring the lowest among the G-8 countries. Fourth-graders in the United States scored 540 on the combined reading literacy scale, higher than their peers in Scotland and France but lower than their peers in Italy and the russian Federation.
A greater percentage of students reached the advanced benchmark in the russian Federation than in all other participating G-8
countries except England (England’s score was not measurably different from the russian Federation’s), and France had the smallest percentage of students reach the advanced benchmark. The advanced benchmark is the highest of four benchmarks PIrLS uses to describe performance at various skill levels. In the United States, 12 percent of fourth-graders reached the advanced benchmark (figure 4b). The percentage in the United States was higher than in France (5 percent) but lower than in England (15 percent) and the russian Federation (19 percent).
Sixty-one percent of fourth-graders scored at or above the high benchmark (the second highest PIrLS benchmark) in the russian Federation. This is higher than in all other participating G-8 countries, where the percentages ranged from 35 percent in France to 52 percent in Germany and Italy. In the United States, 47 percent of fourth-graders scored at or above the high benchmark. The percentage in the United States was higher than in Scotland and France but lower than in Italy and the russian Federation.
A greater percentage of students scored at or above the intermediate benchmark in the russian Federation than in all other participating G-8 countries except Italy (Italy’s score was not measurably differ-ent from the russian Federation’s). In the United States, 82 percent of fourth-graders scored at or above the intermediate benchmark (figure 4b). The percentage in the United States was higher than in Scotland (77 percent) and France (76 percent), but lower than in Germany and Italy (both at 87 percent) and the russian Federation (90 percent).
Definitions and Methodology
In PIrLS 2006, countries were required to sample students in the grade that corresponded to the end of 4 years of formal schooling, providing that the mean age at the time of testing was at least 9.5 years. As defined by PIrLS, the 1st year of formal schooling begins with the 1st year of primary school (ISCED97 level 1), which should mark the beginning of formal instruction in reading, writing, and mathematics. Note that kindergarten is not counted. For most countries, the target grade was fourth grade, or its national equivalent.
PIrLS scores are reported on a scale from 0 to 1,000 with the scale average fixed at 500 and the standard deviation fixed at 100. Since the PIrLS reading achievement scales were designed to reliably measure student achievement over time, the metric of the scales was established originally with the 2001 assessment. In order to describe concretely the knowledge and skills attained along the performance scale, PIrLS 2006 established four international achievement benchmarks in reading literacy (low, intermediate, high, and advanced). These benchmarks are identical to the cutpoints used for the Trends in International Mathematics and Science Study (TIMSS). Information about the rationale underlying the benchmarks and the procedures used to set the cutpoints is available in Martin, Mullis, and Kennedy (2007). Four points on the
scales were identified for use as international benchmarks: 400 for the low benchmark, 475 for the intermediate benchmark, 550 for the high benchmark, and 625 for the advanced benchmark. These were selected to represent the range of performance shown by students internationally.
Students at the low benchmark display basic reading skills, such as retrieving explicitly stated details from literary and informational texts. Students at the intermediate benchmark demonstrate some reading proficiency. They can identify central events, plot sequences, and relevant story details; make some inferences and connections across parts of the text; and use text organizers (e.g., headings and illustrations) to find information. At the high benchmark, students are competent readers who can recognize some textual features, such as figurative language and abstract messages. They can make inferences on the basis of abstract or embedded information and integrate information to recognize main ideas and provide explana-tions. Students at the advanced benchmark demonstrate the highest level of reading proficiency. They can interpret figurative language, distinguish and interpret complex information from different parts of text, and integrate ideas across text to provide interpretations about characters’ intentions and feelings.
7 Canada also participated in PIRLS 2006 but not at the national level. Canada participated as separate provinces (Alberta, British Columbia, Nova Scotia, Ontario, and Quebec). Data corresponding with this indicator for the participating Canadian provinces can be found in appendix tables B1 and B2. 8 PIRLS scores are reported on a scale from 0 to 1,000. The metric of the scale was established originally with the 2001 assessment, with the scale average fixed at 500 and the standard deviation fixed at 100.
INDICATOrS PArT II: ACADEMIC PErFOrMANCE—rEADING 17
Indicator 4
Figure 4b. Percentage of fourth-grade students reaching PIRLS international benchmarks in reading literacy, by country: 2006
1 Met international guidelines for participation rates only after substitute schools were included. That is, to avoid sample size losses resulting from sampled schools not participating, a mechanism was instituted to identify, a priori, substitute schools that have similar characteristics to the sampled schools that they may replace.SOURCE: Mullis, I.V.S., Martin, M.O., Kennedy, A.M., and Foy, P. (2007). PIRLS 2006 International Report: IEA’s Progress in International Reading Literacy Study in Primary Schools in 40 Countries, exhibit 2.1. Chestnut Hill, MA: TIMSS & PIRLS International Study Center, Boston College.
Figure 4a. Average scale scores of fourth-grade students in reading literacy, by country: 2006
1 Met international guidelines for participation rates only after substitute schools were included. That is, to avoid sample size losses resulting from sampled schools not participating, a mechanism was instituted to identify, a priori, substitute schools that have similar characteristics to the sampled schools that they may replace.SOURCE: Mullis, I.V.S., Martin, M.O., Kennedy, A.M., and Foy, P. (2007). PIRLS 2006 International Report: IEA’s Progress in International Reading Literacy Study in Primary Schools in 40 Countries, exhibit 1.1. Chestnut Hill, MA: TIMSS & PIRLS International Study Center, Boston College.
0
100
200
300
400
500
600
1,000
539 522548 551 565
527 540
England France Germany Italy RussianFederation
Scotland1 UnitedStates1
Country
Average score
Advanced international benchmark
United States1
Scotland1
England
France
Germany
ItalyRussian
Federation
Country
0 20 40 60 80 100Percent
15
5
11
14
19
10
12
High international benchmark
0 20 40 60 80 100Percent
48
35
52
52
61
40
47
Intermediate international benchmark
0 20 40 60 80 100Percent
78
76
87
87
90
77
82United States1
Scotland1
England
France
Germany
ItalyRussian
Federation
Country Low international benchmark
0 20 40 60 80 100Percent
93
96
97
98
98
93
96

18 INDICATOrS PArT II: ACADEMIC PErFOrMANCE—rEADING
G-8 Countries Included: England, France, Germany, Italy, Russian Federation, Scotland, United States
DIffEREnCES In fOURtH-GRADE READInG LItERACy By SEx
In 2006, average scores of fourth-grade females in reading literacy were higher than the average scores of fourth-grade males in all participating G-8 countries. In the United States, females outperformed males by 10 points.
The Progress in International reading Literacy Study (PIrLS) measures the reading comprehension of students in their 4th year of formal schooling. Using data from PIrLS 2006, this indicator compares differences by sex in average scores on the combined reading literacy scale among fourth-graders in participating G-8 countries.9
In 2006, average scores of fourth-grade females in reading literacy were higher than the average scores of fourth-grade males in all participating G-8 countries. Among countries with the largest score differences between males and females were Scotland (538 for females vs. 516 for males), with a difference of 22 points; England (549 for females vs. 530 for males), with a difference of 19 points; and the russian Federation (572 for females vs. 557 for males), with a difference of 15 points (figure 5a and figure 5b). Among countries with the smallest differences related to sex were Germany (551 for females vs. 544 for males) and Italy (555 for females vs. 548 for males), both with a difference of 7 points. In the United States, females outperformed males by 10 points (545 for females vs. 535 for males).
Definitions and Methodology
In PIrLS 2006, countries were required to sample students in the grade that corresponded to the end of 4 years of formal schooling, providing that the mean age at the time of testing was at least 9.5 years. As defined by PIrLS, the 1st year of formal schooling begins with the 1st year of primary school (ISCED97 level 1), which should mark the beginning of formal instruction in reading, writing, and mathematics. Note that kindergarten is not counted. For most countries, the target grade was fourth grade, or its national equivalent.
PIrLS scores are reported on a scale from 0 to 1,000 with the scale average fixed at 500 and the standard deviation fixed at 100. Since the PIrLS reading achievement scales were designed to reliably measure student achievement over time, the metric of the scales was established originally with the 2001 assessment.
Male-female score-point differences in reading literacy presented in the text and in figure 5b were computed from unrounded numbers; therefore, they may differ from computations made using the rounded whole numbers that appear in figure 5a.
9 Canada also participated in PIRLS 2006 but not at the national level. Canada participated as separate provinces (Alberta, British Columbia, Nova Scotia, Ontario, and Quebec). Data corresponding with this indicator for the participating Canadian provinces can be found in appendix table B3.

INDICATOrS PArT II: ACADEMIC PErFOrMANCE—rEADING 19
Indicator 5
Figure 5b. Difference in average scale scores between fourth-grade males and females in reading literacy, by country: 2006
*p < .05 (difference in score points is statistically significant). 1 Met international guidelines for participation rates only after substitute schools were included. That is, to avoid sample size losses resulting from sampled schools not participating, a mechanism was instituted to identify, a priori, substitute schools that have similar characteristics to the sampled schools that they may replace. SOURCE: Mullis, I.V.S., Martin, M.O., Kennedy, A.M., and Foy, P. (2007). PIRLS 2006 International Report: IEA’s Progress in International Reading Literacy Study in Primary Schools in 40 Countries, exhibit 1.4. Chestnut Hill, MA: TIMSS & PIRLS International Study Center, Boston College.
Figure 5a. Average scale scores of fourth-grade students in reading literacy, by sex and country: 2006
1 Met international guidelines for participation rates only after substitute schools were included. That is, to avoid sample size losses resulting from sampled schools not participating, a mechanism was instituted to identify, a priori, substitute schools that have similar characteristics to the sampled schools that they may replace. SOURCE: Mullis, I.V.S., Martin, M.O., Kennedy, A.M., and Foy, P. (2007). PIRLS 2006 International Report: IEA’s Progress in International Reading Literacy Study in Primary Schools in 40 Countries, exhibit 1.4. Chestnut Hill, MA: TIMSS & PIRLS International Study Center, Boston College.
UnitedStates1
Scotland1
RussianFederation
Italy
Germany
France
England
0 100 200 300 400 500 600 1,000
545535
538516
572557
555548
551544
527516
549530
Average score
FemaleMale
Country
-50
-40
-30
-20
-10
0
10
20
30
40
50
-19*
England
-11*
France
Country
-7*
Germany
-7*
Italy
-15*
RussianFederation
-22*
Scotland1
-10*
UnitedStates1
Difference in score points
In favor of males
In favor of females

indicators part iiindicators part iiAcademic Performance—Mathematics

22 INDICATOrS PArT II: ACADEMIC PErFOrMANCE—MATHEMATICS
G-8 Countries Included: England, Germany,10 Italy, Japan, Russian Federation, Scotland, United States
pERfORMAnCE Of fOURtH- AnD EIGHtH-GRADERS In MAtHEMAtICS
On TIMSS 2007, students in Japan outperformed students in the other participating G-8 countries in mathematics, with higher percentages of Japanese fourth- and eighth-graders reaching each of the four international benchmarks.
The Trends in International Mathematics and Science Study (TIMSS) assessed students in fourth and eighth grade in mathematics and science in 2007. This indicator presents the percentages of fourth- and eighth-graders reaching the four established international benchmarks in mathematics (low, intermediate, high, and advanced).
On the TIMSS 2007 fourth-grade mathematics assessment, students in Japan outperformed students in the other participating G-8 countries, with higher percentages of Japanese fourth-graders reaching each of the four international benchmarks. The highest international benchmark, advanced, was reached by 23 percent of Japan’s fourth-graders in mathematics, compared with percentages ranging from 4 percent in Scotland to 16 percent in the russian Federation and England (figure 6). In the United States, 10 percent of fourth-graders reached the advanced benchmark. The percentage in the United States was higher than in Germany, Italy, and Scotland, but lower than in the russian Federation, England, and Japan.
In Japan, 61 percent of fourth-graders reached the high benchmark in mathematics; the percentages in the other G-8 countries ranged from 25 percent in Scotland to 48 percent in England and the russian Federation. In the United States, 40 percent of fourth-graders reached the high benchmark, a larger percentage than in Italy and Scotland but smaller than in England, the russian Federation, and Japan.
As at fourth grade, eighth-graders in Japan outperformed their peers in the other participating G-8 countries, with higher percentages of Japanese eighth-graders reaching each of the four benchmarks. The advanced benchmark was reached by 26 percent of Japan’s eighth-graders in mathematics, compared with percentages ranging from 3 percent in Italy to 8 percent in the russian Federation and England. In the United States, 6 percent of eighth-graders reached the advanced benchmark. The percentage in the United States was higher than in Scotland and Italy, but lower than in the russian Federation and Japan.
In Japan, 61 percent of eighth-graders reached the high benchmark in mathematics; the percentages in the other G-8 countries ranged from 17 percent in Italy to 35 percent in England. In the United States, 31 percent of eighth-graders reached the high benchmark, a larger percentage than in Scotland and Italy.
Definitions and Methodology
In TIMSS 2007 at fourth grade, countries were required to sample students in the grade that corresponded to the end of 4 years of formal schooling (the end of primary school), providing that the mean age at the time of testing was at least 9.5 years. At eighth grade, countries were required to sample students in the grade that corresponded to the end of 8 years of formal schooling (the end of lower secondary education), providing that the mean age at the time of testing was at least 13.5 years.
TIMSS scores are reported on a scale from 0 to 1,000 with the scale average fixed at 500 and the standard deviation fixed at 100. Since the TIMSS mathematics achievement scales were designed to reliably measure student achievement over time, the metric of the scales was established originally with the 1995 assessment. In order to describe concretely the knowledge and skills attained along the performance scales, TIMSS established four international achieve-ment benchmarks in mathematics and science (low, intermediate, high, and advanced). Four points on the scales were identified for use as international benchmarks: 400 for the low benchmark, 475 for the intermediate benchmark, 550 for the high benchmark, and 625 for the advanced benchmark. These were selected to represent the range of performance shown by students internationally.
At the fourth-grade level in mathematics, students at the low benchmark have some basic mathematical knowledge, such as an understanding of whole numbers and the properties of basic geometric shapes. At the intermediate benchmark, students can apply basic mathematical knowledge in straightforward situations,
such as performing operations with 3- and 4-digit numbers and decimals and extending simple patterns. At the high benchmark, students can apply their knowledge and understanding to solve multistep word problems involving addition, multiplication, and division and problems requiring the use of data in tables and graphs. Students at the advanced benchmark can apply their understanding and knowledge in a wide variety of relatively complex situations to solve problems involving fractions, decimals, proportions, area, and rotation.
At the eighth-grade level in mathematics, students at the low benchmark have some basic mathematical knowledge, such as the ability to do basic computations with whole numbers and reading information from a line on a graph. At the intermediate benchmark, students can apply basic mathematical knowledge in straightforward situations. For example, they can understand simple algebraic relationships, interpret graphs and tables, and perform basic computations to solve one-step word problems involving whole numbers and decimals. Students at the high benchmark can apply their understanding and knowledge in a wide variety of relatively complex situations to solve problems involving fractions, decimals, negative integers, proportions, area, volume, and probability. Students at the advanced benchmark can organize information, make generalizations, solve nonroutine problems, and draw and justify conclusions from data. For example, they can compute percent change, solve simultaneous linear equations, and model simple situations algebraically.
10 Data for Germany are only available at the fourth grade, as Germany did not participate in TIMSS 2007 at the eighth grade.

INDICATOrS PArT II: ACADEMIC PErFOrMANCE—MATHEMATICS 23
Indicator
— Not available. Data for Germany are only available at the fourth grade, as Germany did not participate in TIMSS 2007 at the eighth grade.1 Met international guidelines for participation rates only after substitute schools were included. That is, to avoid sample size losses resulting from sampled schools not participating, a mechanism was instituted to identify, a priori, substitute schools that have similar characteristics to the sampled schools that they may replace. For England, this applies to eighth-grade only. 2 National Defined Population covers 90 percent to 95 percent of National Target Population.SOURCE: Mullis, I.V.S., Martin, M.O., and Foy, P. (2008). TIMSS 2007 International Mathematics Report: Findings From IEA’s Trends in International Mathematics and Science Study at the Fourth and Eighth Grades, exhibit 2.2. Chestnut Hill, MA: TIMSS & PIRLS International Study Center, Boston College.
Figure 6. Percentage of fourth- and eighth-grade students reaching TIMSS international benchmarks in mathematics, by country: 2007
6
Low international benchmark
Intermediate international benchmark
High international benchmark
Advanced international benchmark
Grade 4 Grade 8
1000 20 40 60 80Percent
0 20 40 60 80 100Percent
0 20 40 60 80 100Percent
0 20 40 60 80 100Percent
0 20 40 60 80 100Percent
0 20 40 60 80 100Percent
United States1,2
Scotland1
England1
Germany
Italy
JapanRussian
Federation
Country
0 20 40 60 80 100Percent
94
96 —
—
—
—
91
98
95
88
95
90
85
97
91
85
92
United States1,2
Scotland1
England1
Germany
Italy
JapanRussian
Federation
Country
0 20 40 60 80 100Percent
79
78
67
89
81
62
77
69
54
87
68
57
67
United States1,2
Scotland1
England1
Germany
Italy
JapanRussian
Federation
Country
48
37
29
61
48
25
40
35
17
61
33
23
31
United States1,2
Scotland1
England1
Germany
Italy
Japan
RussianFederation
Country16
6
6
23
16
4
10
8
3
26
8
4
6

24 INDICATOrS PArT II: ACADEMIC PErFOrMANCE—MATHEMATICS
DIffEREnCES In fOURtH- AnD EIGHtH-GRADE MAtHEMAtICS ACHIEvEMEnt By SEx
In 2007, fourth-grade males in Italy, Germany, Scotland, and the United States scored higher, on average, than fourth-grade females in mathematics; however, no measurable differences related to sex were detected among eighth-graders.
This indicator addresses differences by sex in mathematics achieve-ment among fourth- and eighth-grade students in the G-8 countries that participated in the Trends in International Mathematics and Science Study (TIMSS) in 2007.
On the TIMSS 2007 fourth-grade mathematics assessment, males in Italy, Germany, Scotland, and the United States outperformed females. In Italy, the difference in performance was 15 points,
with males scoring an average of 514 compared with 499 among females (figures 7a and 7b). In Germany, the difference by sex was 12 points (531 for males vs. 519 for females); in Scotland, the difference by sex was 9 points (499 for males vs. 490 for females); and in the United States, the difference by sex was 6 points (532 for males vs. 526 for females). In the russian Federation, however, females outperformed males by 7 points (540 for males vs. 548 for females). In England and Japan, no measurable differences were detected between the average scale scores of fourth-grade males and females.
On the TIMSS 2007 eighth-grade mathematics assessment, no measurable differences related to sex were detected for any of the participating G-8 countries.
Definitions and Methodology
In TIMSS 2007 at fourth grade, countries were required to sample students in the grade that corresponded to the end of 4 years of formal schooling (the end of primary school), providing that the mean age at the time of testing was at least 9.5 years. At eighth grade, countries were required to sample students in the grade that corresponded to the end of 8 years of formal schooling (the end of lower secondary education), providing that the mean age at the time of testing was at least 13.5 years.
TIMSS scores are reported on a scale from 0 to 1,000 with the scale average fixed at 500 and the standard deviation fixed at 100. Since the TIMSS mathematics achievement scales were designed to reliably measure student achievement over time, the metric of the scales was established originally with the 1995 assessment.
Male-female score-point differences in mathematics achievement presented in the text and in figure 7b were computed from unrounded numbers; therefore, they may differ from computations made using the rounded whole numbers that appear in figure 7a.
G-8 Countries Included: England, Germany,11 Italy, Japan, Russian Federation, Scotland, United States
11 Data for Germany are only available at the fourth grade, as Germany did not participate in TIMSS 2007 at the eighth grade.

indicators part ii: academic performance—mathematics 25
Indicator 7
Figure 7b. Difference in average scale scores between fourth- and eighth-grade males and females in mathematics, by country: 2007
— Not available. Data for Germany are only available at the fourth grade, as Germany did not participate in TIMSS 2007 at the eighth grade. # Rounds to zero. *p < .05 (difference in score points is statistically significant). 1 Met international guidelines for participation rates only after substitute schools were included. That is, to avoid sample size losses resulting from sampled schools not participating, a mechanism was instituted to identify, a priori, substitute schools that have similar characteristics to the sampled schools that they may replace. For England, this applies to eighth grade only. 2 National Defined Population covers 90 percent to 95 percent of National Target Population.NOTE: Differences shown are computed by subtracting the average unrounded score for females from the average unrounded score for males. Thus, positive values indicate higher average scores for males. SOURCE: Mullis, I.V.S., Martin, M.O., and Foy, P. (2008). TIMSS 2007 International Mathematics Report: Findings From IEA’s Trends in International Mathematics and Science Study at the Fourth and Eighth Grades, exhibit 1.5. Chestnut Hill, MA: TIMSS & PIRLS International Study Center, Boston College.
Figure 7a. Average scale scores of fourth- and eighth-grade students in mathematics literacy, by sex and country: 2007
— Not available. Data for Germany are only available at the fourth grade, as Germany did not participate in TIMSS 2007 at the eighth grade. 1 Met international guidelines for participation rates only after substitute schools were included. That is, to avoid sample size losses resulting from sampled schools not participating, a mechanism was instituted to identify, a priori, substitute schools that have similar characteristics to the sampled schools that they may replace. For England, this applies to eighth grade only. 2 National Defined Population covers 90 percent to 95 percent of National Target Population.SOURCE: Mullis, I.V.S., Martin, M.O., and Foy, P. (2008). TIMSS 2007 International Mathematics Report: Findings From IEA’s Trends in International Mathematics and Science Study at the Fourth and Eighth Grades, exhibit 1.5. Chestnut Hill, MA: TIMSS & PIRLS International Study Center, Boston College.
FemaleMale
Eighth gradeCountry
Average score0 100 200 300 400 500 600 1,000
516
——
511
482477
572568
509514
489486
510507
Fourth grade
Average score0 100 200 300 400 500 600 1,000
542541
531519
514499
568568
540548
499490
532526
United States1,2
Scotland1
England1
Germany
Italy
Japan
RussianFederation
-50
-40
-30
-20
-10
0
10
20
30
40
50
#6
England1
Country
12*
—
Germany
15*
6
Italy
#4
Japan
-7* -5
RussianFederation
9*3
Scotland1
6* 4
UnitedStates1,2
Difference in score points
In favor of males
In favor of females
Eighth gradeFourth grade

indicators part iiindicators part iiAcademic Performance—Science
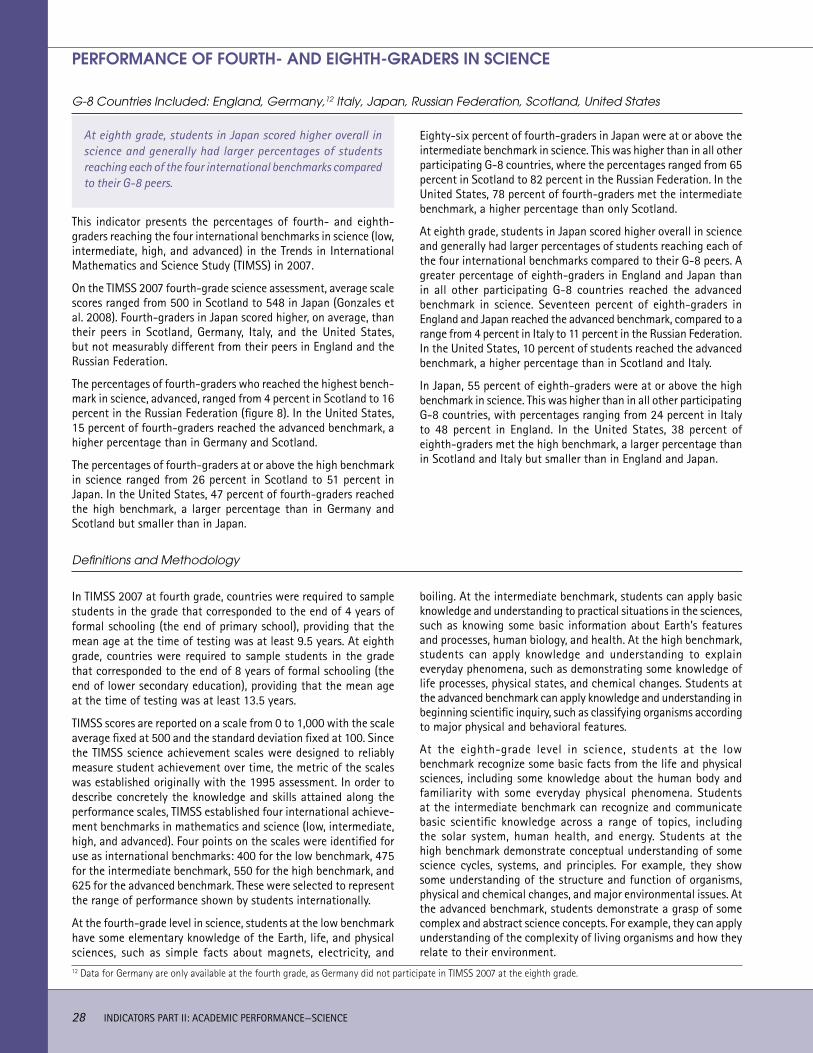
28 INDICATOrS PArT II: ACADEMIC PErFOrMANCE—SCIENCE
G-8 Countries Included: England, Germany,12 Italy, Japan, Russian Federation, Scotland, United States
pERfORMAnCE Of fOURtH- AnD EIGHtH-GRADERS In SCIEnCE
At eighth grade, students in Japan scored higher overall in science and generally had larger percentages of students reaching each of the four international benchmarks compared to their G-8 peers.
This indicator presents the percentages of fourth- and eighth-graders reaching the four international benchmarks in science (low, intermediate, high, and advanced) in the Trends in International Mathematics and Science Study (TIMSS) in 2007.
On the TIMSS 2007 fourth-grade science assessment, average scale scores ranged from 500 in Scotland to 548 in Japan (Gonzales et al. 2008). Fourth-graders in Japan scored higher, on average, than their peers in Scotland, Germany, Italy, and the United States, but not measurably different from their peers in England and the russian Federation.
The percentages of fourth-graders who reached the highest bench-mark in science, advanced, ranged from 4 percent in Scotland to 16 percent in the russian Federation (figure 8). In the United States, 15 percent of fourth-graders reached the advanced benchmark, a higher percentage than in Germany and Scotland.
The percentages of fourth-graders at or above the high benchmark in science ranged from 26 percent in Scotland to 51 percent in Japan. In the United States, 47 percent of fourth-graders reached the high benchmark, a larger percentage than in Germany and Scotland but smaller than in Japan.
Eighty-six percent of fourth-graders in Japan were at or above the intermediate benchmark in science. This was higher than in all other participating G-8 countries, where the percentages ranged from 65 percent in Scotland to 82 percent in the russian Federation. In the United States, 78 percent of fourth-graders met the intermediate benchmark, a higher percentage than only Scotland.
At eighth grade, students in Japan scored higher overall in science and generally had larger percentages of students reaching each of the four international benchmarks compared to their G-8 peers. A greater percentage of eighth-graders in England and Japan than in all other participating G-8 countries reached the advanced benchmark in science. Seventeen percent of eighth-graders in England and Japan reached the advanced benchmark, compared to a range from 4 percent in Italy to 11 percent in the russian Federation. In the United States, 10 percent of students reached the advanced benchmark, a higher percentage than in Scotland and Italy.
In Japan, 55 percent of eighth-graders were at or above the high benchmark in science. This was higher than in all other participating G-8 countries, with percentages ranging from 24 percent in Italy to 48 percent in England. In the United States, 38 percent of eighth-graders met the high benchmark, a larger percentage than in Scotland and Italy but smaller than in England and Japan.
Definitions and Methodology
In TIMSS 2007 at fourth grade, countries were required to sample students in the grade that corresponded to the end of 4 years of formal schooling (the end of primary school), providing that the mean age at the time of testing was at least 9.5 years. At eighth grade, countries were required to sample students in the grade that corresponded to the end of 8 years of formal schooling (the end of lower secondary education), providing that the mean age at the time of testing was at least 13.5 years.
TIMSS scores are reported on a scale from 0 to 1,000 with the scale average fixed at 500 and the standard deviation fixed at 100. Since the TIMSS science achievement scales were designed to reliably measure student achievement over time, the metric of the scales was established originally with the 1995 assessment. In order to describe concretely the knowledge and skills attained along the performance scales, TIMSS established four international achieve-ment benchmarks in mathematics and science (low, intermediate, high, and advanced). Four points on the scales were identified for use as international benchmarks: 400 for the low benchmark, 475 for the intermediate benchmark, 550 for the high benchmark, and 625 for the advanced benchmark. These were selected to represent the range of performance shown by students internationally.
At the fourth-grade level in science, students at the low benchmark have some elementary knowledge of the Earth, life, and physical sciences, such as simple facts about magnets, electricity, and
boiling. At the intermediate benchmark, students can apply basic knowledge and understanding to practical situations in the sciences, such as knowing some basic information about Earth’s features and processes, human biology, and health. At the high benchmark, students can apply knowledge and understanding to explain everyday phenomena, such as demonstrating some knowledge of life processes, physical states, and chemical changes. Students at the advanced benchmark can apply knowledge and understanding in beginning scientific inquiry, such as classifying organisms according to major physical and behavioral features.
At the eighth-grade level in science, students at the low benchmark recognize some basic facts from the life and physical sciences, including some knowledge about the human body and familiarity with some everyday physical phenomena. Students at the intermediate benchmark can recognize and communicate basic scientific knowledge across a range of topics, including the solar system, human health, and energy. Students at the high benchmark demonstrate conceptual understanding of some science cycles, systems, and principles. For example, they show some understanding of the structure and function of organisms, physical and chemical changes, and major environmental issues. At the advanced benchmark, students demonstrate a grasp of some complex and abstract science concepts. For example, they can apply understanding of the complexity of living organisms and how they relate to their environment.
12 Data for Germany are only available at the fourth grade, as Germany did not participate in TIMSS 2007 at the eighth grade.
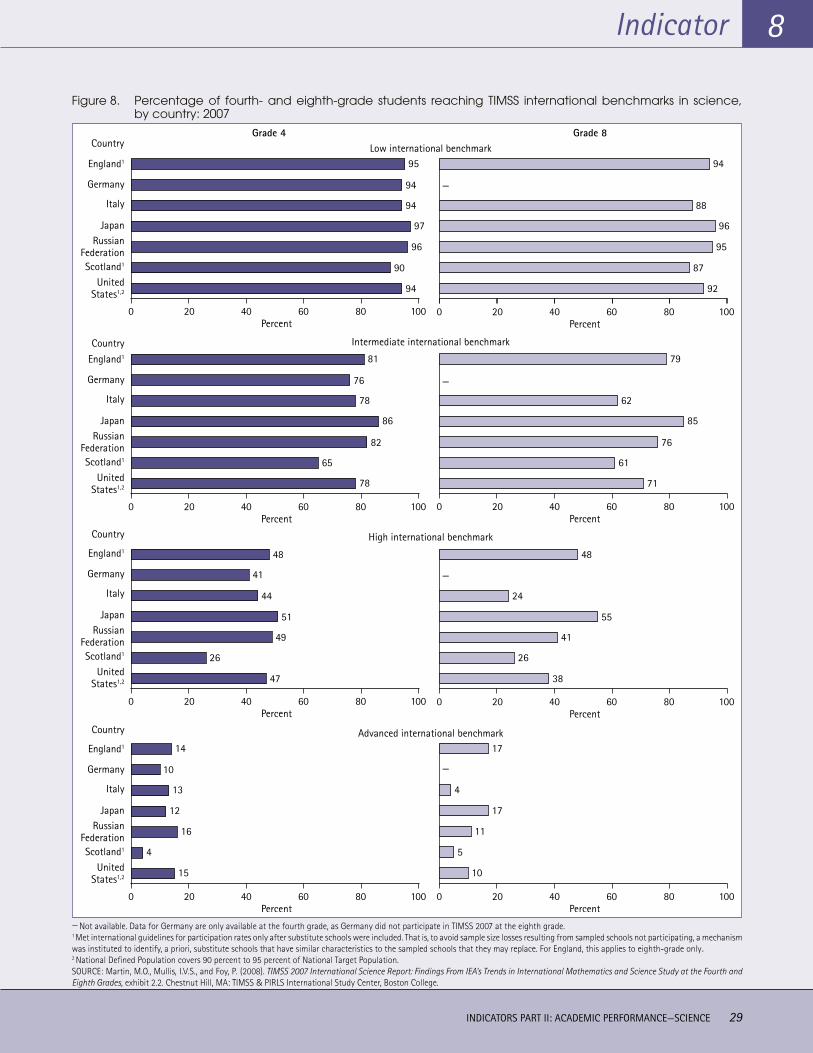
INDICATOrS PArT II: ACADEMIC PErFOrMANCE—SCIENCE 29
Indicator 8
— Not available. Data for Germany are only available at the fourth grade, as Germany did not participate in TIMSS 2007 at the eighth grade.1 Met international guidelines for participation rates only after substitute schools were included. That is, to avoid sample size losses resulting from sampled schools not participating, a mechanism was instituted to identify, a priori, substitute schools that have similar characteristics to the sampled schools that they may replace. For England, this applies to eighth-grade only. 2 National Defined Population covers 90 percent to 95 percent of National Target Population.SOURCE: Martin, M.O., Mullis, I.V.S., and Foy, P. (2008). TIMSS 2007 International Science Report: Findings From IEA’s Trends in International Mathematics and Science Study at the Fourth and Eighth Grades, exhibit 2.2. Chestnut Hill, MA: TIMSS & PIRLS International Study Center, Boston College.
Figure 8. Percentage of fourth- and eighth-grade students reaching TIMSS international benchmarks in science, by country: 2007
Low international benchmark
Intermediate international benchmark
High international benchmark
Advanced international benchmark
Grade 4 Grade 8
1000 20 40 60 80Percent
0 20 40 60 80 100Percent
0 20 40 60 80 100Percent
0 20 40 60 80 100Percent
0 20 40 60 80 100Percent
0 20 40 60 80 100Percent
United States1,2
Scotland1
England1
Germany
Italy
JapanRussian
Federation
Country
0 20 40 60 80 100Percent
—
—
—
United States1,2
Scotland1
England1
Germany
Italy
JapanRussian
Federation
Country
0 20 40 60 80 100Percent
United States1,2
Scotland1
England1
Germany
Italy
JapanRussian
Federation
Country
United States1,2
Scotland1
England1
Germany
Italy
JapanRussian
Federation
Country
95
94
94
97
96
90
94
94
88
96
95
87
92
81
76
78
86
82
65
78
79
62
85
76
61
71
48
41
44
51
49
26
47
48
24
55
41
26
38
14
10
13
12
16
4
15
—
17
4
17
11
5
10
30 INDICATOrS PArT II: ACADEMIC PErFOrMANCE—SCIENCE
G-8 Countries Included: England, Germany,13 Italy, Japan, Russian Federation, Scotland, United States
DIffEREnCES In fOURtH- AnD EIGHtH-GRADE SCIEnCE ACHIEvEMEnt By SEx
In Germany and Italy, fourth-grade males scored higher, on average, than fourth-grade females in science; in the United States and Italy, eighth-grade males outperformed females.
This indicator addresses differences by sex in science achievement among fourth- and eighth-grade students in the G-8 countries that participated in the Trends in International Mathematics and Science Study (TIMSS) in 2007.
On the TIMSS 2007 science assessment, fourth-grade males in Germany and Italy outperformed females. In Germany, the differ-ence in performance was 15 points, with males scoring an average of 535 compared with 520 among females (figures 9a and 9b). In
Italy, the difference related to sex was 13 points (541 for males vs. 529 for females). In all other G-8 countries, including the United States, no measurable differences were detected between the average scale scores of fourth-grade males and females.
On the TIMSS 2007 eighth-grade science assessment, males in the United States and Italy outperformed females. In the United States, the difference in performance was 12 points, with males scoring an average of 526 compared with 514 among females. In Italy, the difference related to sex was 8 points (499 for males vs. 491 for females). In all other participating G-8 countries, no measurable differences were detected between the average scale scores of eighth-grade males and females.
Definitions and Methodology
In TIMSS 2007 at fourth grade, countries were required to sample students in the grade that corresponded to the end of 4 years of formal schooling (the end of primary school), providing that the mean age at the time of testing was at least 9.5 years. At eighth grade, countries were required to sample students in the grade that corresponded to the end of 8 years of formal schooling (the end of lower secondary education), providing that the mean age at the time of testing was at least 13.5 years.
TIMSS scores are reported on a scale from 0 to 1,000 with the scale average fixed at 500 and the standard deviation fixed at 100. Since the TIMSS science achievement scales were designed to reliably measure student achievement over time, the metric of the scales was established originally with the 1995 assessment.
Male-female score-point differences in science achievement presented in the text and in figure 9b were computed from unrounded numbers; therefore, they may differ from computations made using the rounded whole numbers that appear in figure 9a.
13 Data for Germany are only available at the fourth grade, as Germany did not participate in TIMSS 2007 at the eighth grade.

INDICATOrS PArT II: ACADEMIC PErFOrMANCE—SCIENCE 31
Indicator 9
Figure 9b. Difference in average scale scores between fourth- and eighth-grade males and females in science, by country: 2007
Figure 9a. Average scale scores of fourth- and eighth-grade students in science, by sex and country: 2007
— Not available. Data for Germany are only available at the fourth grade, as Germany did not participate in TIMSS 2007 at the eighth grade. 1 Met international guidelines for participation rates only after substitute schools were included. That is, to avoid sample size losses resulting from sampled schools not participating, a mechanism was instituted to identify, a priori, substitute schools that have similar characteristics to the sampled schools that they may replace. For England, this applies to eighth-grade only. 2 National Defined Population covers 90 percent to 95 percent of National Target Population.SOURCE: Martin, M.O., Mullis, I.V.S., and Foy, P. (2008). TIMSS 2007 International Science Report: Findings From IEA’s Trends in International Mathematics and Science Study at the Fourth and Eighth Grades, exhibit 1.5. Chestnut Hill, MA: TIMSS & PIRLS International Study Center, Boston College.
— Not available. Data for Germany are only available at the fourth grade, as Germany did not participate in TIMSS 2007 at the eighth grade. *p < .05 (difference in score points is statistically significant). 1 Met international guidelines for participation rates only after substitute schools were included. That is, to avoid sample size losses resulting from sampled schools not participating, a mechanism was instituted to identify, a priori, substitute schools that have similar characteristics to the sampled schools that they may replace. For England, this applies to eighth grade only. 2 National Defined Population covers 90 percent to 95 percent of National Target Population.NOTE: Differences shown are computed by subtracting the average unrounded score for females from the average unrounded score for males. Thus, positive values indicate higher average scores for males. SOURCE: Martin, M.O., Mullis, I.V.S., and Foy, P. (2008). TIMSS 2007 International Science Report: Findings From IEA’s Trends in International Mathematics and Science Study at the Fourth and Eighth Grades, exhibit 1.5. Chestnut Hill, MA: TIMSS & PIRLS International Study Center, Boston College.
FemaleMale
Eighth grade
United States1,2
Scotland1
England1
Germany
Italy
Japan
RussianFederation
Country
Average score0 100 200 300 400 500 600 1,000
——
Fourth grade
Average score0 100 200 300 400 500 600 1,000
540543
535520
541529
547548
544548
501500
541536
546537
499491
556552
533527
498493
526514
-3
913*
8*
-1
4
-4
62
5 512*15*
—
Eighth gradeFourth grade
-50
-40
-30
-20
-10
0
10
20
30
40
50
England1
Country
Germany Italy Japan RussianFederation
Scotland1 UnitedStates1,2
Difference in score points
In favor of males
In favor of females

32 INDICATOrS PArT II: ACADEMIC PErFOrMANCE—SCIENCE
G-8 Countries Included: Canada, France, Germany, Italy, Japan, Russian Federation, United Kingdom, United States
SCIEnCE pERfORMAnCE Of 15-yEAR-OLDS ACROSS COntEnt AREAS
In the United States, 15-year-old students in PISA 2006 scored lower, on average, than their peers in Canada, Germany, Japan, and the United Kingdom on each of the three science literacy subscales: identifying scientific issues, explaining phenomena scientifically, and using scientific evidence. U.S. students outperformed their peers in Italy and the Russian Federation on identifying scientific issues and in Italy on using scientific evidence.
The Program for International Student Assessment (PISA) is a system of international assessments that measures 15-year-old students’ performance in reading literacy, mathematics literacy, and science literacy every 3 years. In 2006, PISA included an in-depth assessment of science literacy, with less detailed assessments in mathematics and reading literacy.14 This indicator examines student performance in the G-8 countries on the combined science literacy scale and on the three science literacy subscales: identifying scientific issues, explaining phenomena scientifically, and using scientific evidence.
Average scores of 15-year-old students on the combined science literacy scale ranged from 475 in Italy to 534 in Canada, with the United States at 489 (figure 10). The U.S. average score was lower than the average score of 500 for the participating Organization for Economic Cooperation and Development (OECD) countries (Baldi et al. 2007). Among the G-8 countries, the U.S. average score was lower than the average scores of the United Kingdom, Germany, Japan, and Canada; higher than the average score of Italy; and not measurably different from the average scores of the russian Federation and France.
U.S. 15-year-olds scored lower, on average, than their peers in the United Kingdom, Germany, Japan, and Canada on the three science literacy subscales. The U.S. average score of 492 on the identifying scientific issues subscale was lower than the average scores of Germany (510), the United Kingdom (514), Japan (522), and Canada (532) (figure 10). However, students in the United States outperformed their peers in Italy (474) and the russian Federation (463) on this subscale. Among the G-8 countries, students in Canada had the highest score on the identifying scientific issues subscale.
On the explaining phenomena scientifically subscale, 15-year-olds in Canada scored higher, on average, than their peers in all other G-8 countries except for Japan (there was no measurable difference between Canada and Japan on this subscale). U.S. students had an average score of 486 and were outperformed by students in the United Kingdom (517), Germany (519), Japan (527), and Canada (531). Unlike the identifying scientific issues subscale, U.S. students did not perform better, on average, than their peers in any other G-8 country on this subscale.
On the using scientific evidence subscale, students in Japan and Canada scored higher, on average, than their peers in all other G-8 countries. U.S. students had an average score of 489 and were outperformed, on average, by students in France (511), the United Kingdom (514), Germany (515), Canada (542), and Japan (544). However, students in the United States outperformed their peers in Italy (467) on this subscale.
Definitions and Methodology
In PISA, “15-year-olds” refers to students between 15 years and 3 months to 16 years and 2 months old at the time of the assessment and who have completed at least 6 years of formal schooling.
PISA defines scientific literacy as “an individual’s scientific knowledge and use of that knowledge to identify questions, to acquire new knowledge, to explain scientific phenomena, and to draw evidence-based conclusions about science-related issues, understanding of the characteristic features of science as a form of human knowledge and inquiry, awareness of how science and technology shape our material, intellectual, and cultural environments, and willingness to engage in science-related issues, and with the ideas of science, as a reflective citizen” (OECD 2006, p. 12). In PISA 2006, students were assessed on their scientific literacy in relation to scientific knowledge or concepts, scientific processes, and situations or contexts, which were reflected in three subscales (identifying scientific issues, explaining phenomena scientifically, and using scientific evidence).
The identifying scientific issues subscale includes recognizing issues that are possible to investigate scientifically; identifying keywords to search for scientific information; and recognizing the key features of a scientific investigation. The explaining phenomena scientifically subscale includes applying knowledge of science in a given situation; describing or interpreting phenomena scientifically and predicting changes; and identifying appropriate descriptions, explanations, and predictions. The using scientific evidence subscale includes interpreting scientific evidence and making and communicating conclusions; identifying the assumptions, evidence, and reasoning behind conclusions; and reflecting on the societal implications of science and technological developments.
Scores on the PISA 2006 combined science literacy scale are reported on a scale from 0 to 1,000 with the OECD average fixed at 500 and the standard deviation fixed at 100.
14 Reading scores were not reported for the United States because of an error in printing the test booklets.
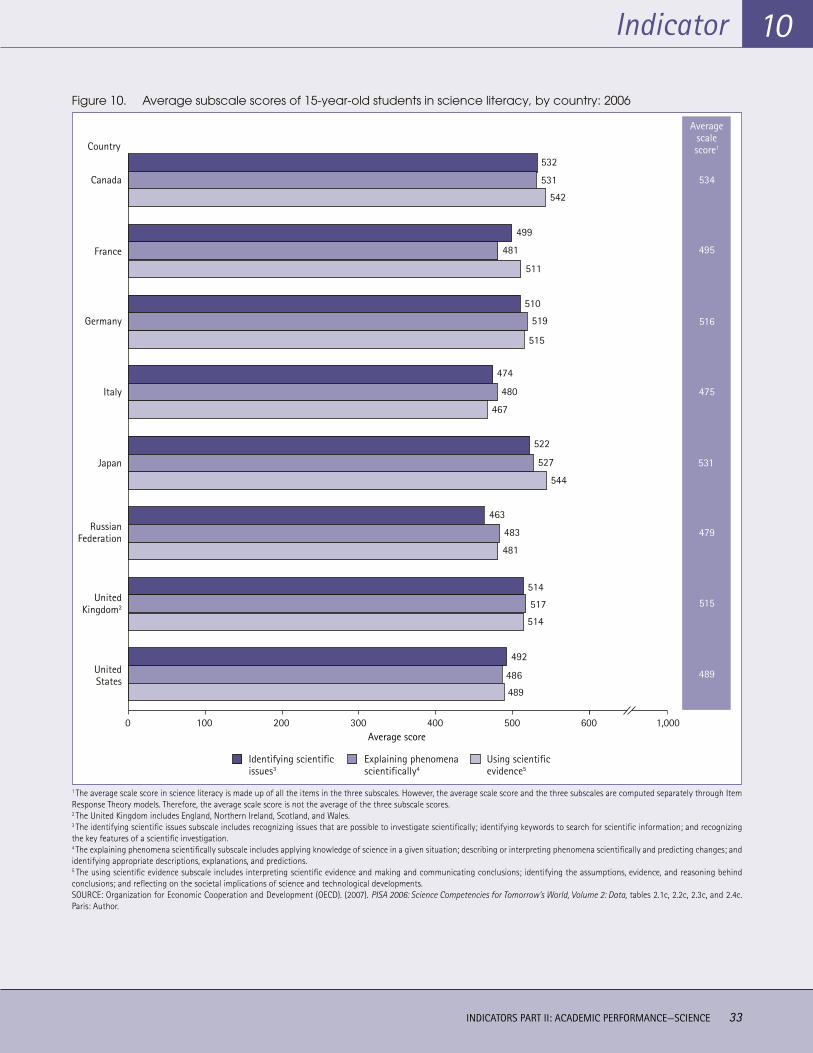
INDICATOrS PArT II: ACADEMIC PErFOrMANCE—SCIENCE 33
Indicator 10
1 The average scale score in science literacy is made up of all the items in the three subscales. However, the average scale score and the three subscales are computed separately through Item Response Theory models. Therefore, the average scale score is not the average of the three subscale scores.2 The United Kingdom includes England, Northern Ireland, Scotland, and Wales.3 The identifying scientific issues subscale includes recognizing issues that are possible to investigate scientifically; identifying keywords to search for scientific information; and recognizing the key features of a scientific investigation. 4 The explaining phenomena scientifically subscale includes applying knowledge of science in a given situation; describing or interpreting phenomena scientifically and predicting changes; and identifying appropriate descriptions, explanations, and predictions. 5 The using scientific evidence subscale includes interpreting scientific evidence and making and communicating conclusions; identifying the assumptions, evidence, and reasoning behind conclusions; and reflecting on the societal implications of science and technological developments. SOURCE: Organization for Economic Cooperation and Development (OECD). (2007). PISA 2006: Science Competencies for Tomorrow’s World, Volume 2: Data, tables 2.1c, 2.2c, 2.3c, and 2.4c. Paris: Author.
Figure 10. Average subscale scores of 15-year-old students in science literacy, by country: 2006
492
486
489
514
517
514
463
483
481
522
527
544
474
480
467
510
519
515
499
481
511
532
531
542
United States
Russian Federation
UnitedKingdom2
Japan
Italy
Germany
France
Canada
0 100 200 300 400 500 600 1,000
Using scientificevidence5
Explaining phenomenascientifically4
Identifying scientificissues3
Average score
Country
Average scale score1
534
495
516
475
531
479
515
489

34 INDICATOrS PArT II: ACADEMIC PErFOrMANCE—SCIENCE
G-8 Countries Included: Canada, France, Germany, Italy, Japan, Russian Federation, United Kingdom, United States
SCIEnCE pROfICIEnCy Of 15-yEAR-OLDS
About one-quarter of 15-year-old students in the United States scored at or below the lowest proficiency level on the PISA 2006 combined science literacy scale, a larger percentage of students than in the United Kingdom, Germany, Japan, and Canada.
The Program for International Student Assessment (PISA) assessed the science literacy of 15-year-old students in 2006. This indicator presents the percentages of students reaching the established international proficiency levels in science literacy. These range from level 1 to level 6, with level 6 the highest. Students who failed to answer correctly more than half of the items associated with level 1 were categorized as having proficiency below level 1.
In Italy and the russian Federation, 15-year-old students performed, on average, at proficiency level 2 on the PISA 2006 combined science literacy scale (see average scale scores as shown in indicator 10 and Definitions and Methodology of this indicator for cut point scores of proficiency levels). In all other G-8 countries, students scored, on average, at level 3 on the combined science literacy scale.
The United States had a lower percentage of students at each of the higher proficiency levels of 6, 5, and 4 than did the United Kingdom, Japan, and Canada, and a lower percentage of students at levels 5 and 4 than Germany. Italy and the russian Federation had lower percentages of students scoring at levels 6, 5, and 4 than the United States. For example, the percentage of students who scored at level 5 was 12 percent in Japan and Canada, 11 percent in the United Kingdom, 10 percent in Germany, 8 percent in the United States, 7 percent in France, and 4 percent in Italy and the russian Federation (figure 11).
The percentage of 15-year-olds who scored at level 1 or below ranged from 10 percent in Canada to 25 percent in Italy; these students failed to demonstrate the kind of science literacy skills that enable them to actively use science as outlined in the PISA definition (see Definitions and Methodology). Canada had a lower percentage of students who scored at level 1 or below than all other G-8 countries except Japan (Japan’s percentage did not measurably differ from Canada’s). Twenty-four percent of U.S. students scored at level 1 or below, which was higher than the percentages in four other G-8 countries (the United Kingdom, Germany, Japan, and Canada), and not measurably different from the percentages in France, the russian Federation, and Italy.
Definitions and Methodology
In PISA, “15-year-olds” refers to students between 15 years and 3 months to 16 years and 2 months old at the time of the assessment and who have completed at least 6 years of formal schooling.
PISA defines science literacy as “an individual’s scientific knowledge and use of that knowledge to identify questions, to acquire new knowledge, to explain scientific phenomena, and to draw evidence-based conclusions about science-related issues, understanding of the characteristic features of science as a form of human knowledge and inquiry, awareness of how science and technology shape our material, intellectual, and cultural environments, and willingness to engage in science-related issues, and with the ideas of science, as a reflective citizen” (OECD 2006, p. 12).
Scores on the PISA 2006 combined science literacy scale are reported on a scale from 0 to 1,000 with the OECD average fixed at 500 and the standard deviation fixed at 100.
Science proficiency was defined in terms of six levels (levels 1 through 6) based on student performance scores on the combined science literacy scale. Exact cut point scores are as follows: level 6 (a score greater than 707.93); level 5 (a score greater than 633.33 and less than or equal to 707.93); level 4 (a score greater than 558.73 and less than or equal to 633.33); level 3 (a score greater than 484.14 and less than or equal to 558.73); level 2 (a score greater than 409.54 and less than or equal to 484.14); and level 1 (a score greater than 334.94 and less than or equal to 409.54). Students who perform below level 1 (a score less than or equal to 334.94) “…are unable to demonstrate science competencies in situations required by the easiest PISA tasks… such a low level of science competency can be regarded as putting them at a serious disadvantage for full participation in society and the economy” (OECD 2007a, p. 42). In order to reach a particular proficiency level, a student must have been able to correctly answer a majority of
items at that level. Students at each succeeding level are capable of solving science problems of increasing complexity.
Students proficient at level 1 have such a limited scientific knowledge that it can only be applied to a few, familiar situations. They can present scientific explanations that are obvious and that follow explicitly from given evidence. Students at level 2 have adequate scientific knowledge to provide possible explanations or draw conclusions based on simple investigations; they are capable of direct reasoning and making literal interpretations of the results of scientific inquiry or technological problem solving. At level 3, students can identify clearly described scientific issues in a range of contexts; they can directly apply simple models or inquiry strategies to explain phenomena, interpret and use scientific concepts, and can make decisions based on scientific knowledge. At level 4, students can work effectively with situations that may involve explicit phenomena requiring them to make inferences about the role of science; they can select, integrate, and link explanations from different disciplines of science to real-world situations; they can reflect on their actions and can communicate decisions using scientific evidence. Students at level 5 can identify the scientific components of many complex real-world situations and can apply scientific concepts to these situations and evaluate scientific evidence; they can use well-developed inquiry abilities, bring critical insights to situations, and construct explanations based on evidence and arguments based on their critical analysis. Students proficient at level 6 clearly and consistently demonstrate advanced scientific thinking and reasoning, demonstrate willing-ness to use their scientific understanding in support of solutions to unfamiliar situations, and can develop real-world arguments based on scientific knowledge. For more information about how proficiency levels were set for PISA 2006, see the technical appendix in Baldi et al. (2007).

INDICATOrS PArT II: ACADEMIC PErFOrMANCE—SCIENCE 35
Indicator 11
Figure 11. Percentage distribution of 15-year-old students on PISA 2006 proficiency levels in science literacy, by country: 2006
# Rounds to zero.1 The United Kingdom includes England, Northern Ireland, Scotland, and Wales.NOTE: In the Program for International Student Assessment (PISA), science proficiency was defined in terms of six levels (levels 1 through 6) based on student performance scores on the combined science literacy scale. In this way, science literacy was assessed along a continuum, with level 1 or below indicative of the lowest performing students. Detail may not sum to totals because of rounding. SOURCE: Organization for Economic Cooperation and Development (OECD), Program for International Student Assessment (PISA), 2006.
24 24 24
17 22 26 11
22 30 28 4
12 18 27 12
25 28 27 4
15 21 28 10
21 23 27 7
10 19 29 12 2
1
2
3
1
3
2United States
United Kingdom1
Japan
RussianFederation
Italy
Germany
France
Canada
1000 20 40 60 80Percent
Country
Level 3Level 2Level 1 or below Level 5 Level 6Level 4
27
18
28
22
15
15
24
21
#
8

36 INDICATOrS PArT II: ACADEMIC PErFOrMANCE—SCIENCE
G-8 Countries Included: Canada, France, Germany, Italy, Japan, Russian Federation, United Kingdom, United States
SCIEnCE ACHIEvEMEnt AnD pAREnt OCCUpAtIOnAL StAtUS
In 2006, U.S. students from families with low occupational status were outperformed by students from families with low occupational status in the United Kingdom, Germany, Canada, and Japan in science literacy.
The Program for International Student Assessment (PISA) measured the occupational status of the 15-year-old student’s mother or father (whichever parent had the higher occupational status), with parental occupation reported by the student. Parental occupations were translated into index scores. A low index score (i.e., between 16 and 34 points) corresponds with a parental occupation requiring a minimal level of education (e.g., taxi driver, waiter/waitress), and a high index score (i.e., between 71 and 90 points) corresponds with a parental occupation requiring a high level of education (e.g., medical doctor, university professor). This indicator focuses on the relationship between parent occupational status and science achievement as measured in PISA 2006.
results from PISA showed that U.S. students tended to come from homes with parents whose occupations required comparatively higher levels of education relative to their peers in other G-8 countries. In 2006, the United States and Canada had the highest mean occupational index scores of all the G-8 countries, which is similar to what was found in PISA in 2003.15 In 2006, the range across the G-8 countries was from 46.4 in Italy to 53.5 in Canada, with the United States at 52.5 (OECD 2007b). Furthermore, when students were classified into national quarters on the occupational index, U.S. 15-year-olds in the bottom national quarter had a higher mean index score than their peers in Italy, France, Germany, and the russian Federation (29.9 in the United States compared to a range from 27.2 in Italy to 29.5 in the russian Federation). In Canada and Japan, students in the bottom national quarter had a higher mean index score (32.7 and 34.2, respectively) than their U.S. counterparts. These results showed that parent occupational status was generally higher for U.S. students compared to their G-8 peers. Among those students from families with low occupational status relative to other students in their country, U.S. students tended to
have parents whose occupations required comparatively higher levels of education relative to their peers in other G-8 countries.
On the other hand, when looking at the science achievement of those students from families with low occupational status, U.S. students did not perform higher than their counterparts in any G-8 country. U.S. students in the bottom national quarter of the occupational index were outperformed by students in the bottom national quarter of the index in the United Kingdom, Germany, Canada, and Japan on the PISA 2006 combined science literacy scale (445 in the United States compared to a range from 472 in the United Kingdom to 506 in Japan) (figure 12a).
Nevertheless, within all G-8 countries, there was a relationship between parent occupational status and students’ achievement scores. Specifically, students in the top national quarter of the occupational index scored higher on the combined science literacy scale than students in the bottom national quarter of the index. This difference ranged from 53 points in Japan to 111 points in France; in the United States, this difference was 97 points.
Another way to evaluate the relationship between parent occupational status and science achievement is to examine the specific change in score on the combined science literacy scale in response to a one-standard-deviation increase (i.e., 17.1 units) in the occupational index score. A greater increase in a country’s aver-age achievement score per one-standard-deviation increase in the occupational index score implies a stronger relationship between parent occupational status and performance in that country. Across the G-8 countries, an increase of one standard deviation on the index was associated with an average performance increase that ranged from 19 score points in Japan to 42 score points in France (figure 12b). In the United States, an increase of one standard deviation on the index was associated with an average performance increase of 36 score points. Compared to the United States, four G-8 countries had a weaker relationship between the occupational index and science literacy performance—Japan, the russian Federation, Canada, and Italy—and the other G-8 countries were not measurably different from the United States in this regard.
Definitions and Methodology
In PISA, “15-year-olds” refers to students between 15 years and 3 months to 16 years and 2 months old at the at the time of the assessment and who have completed at least 6 years of formal schooling.
Scores on the PISA 2006 combined science literacy scale are reported on a scale from 0 to 1,000 with the OECD average fixed at 500 and the standard deviation fixed at 100. For more informa-tion about science literacy in PISA 2006, see the Definitions and Methodology section of indicators 10 and 11.
Parent occupational status is measured by the Highest International Socioeconomic Index of Occupational Status (HISEI), which corresponds to the highest occupational index score of the student’s father or mother. Parental occupation, as reported by the student,
was coded based on the current version of the International Standard Classification of Occupations (ISCO-88) (International Labor Organization 1988). Occupational codes were, in turn, mapped onto an internationally comparable index of occupational status, the International Socioeconomic Index of Occupational Status (ISEI), developed by Ganzeboom, De Graaf, and Treiman (1992). The ISEI captures the attributes of occupations that convert parents’ education into income. It is derived by optimally scaling occupation groups to maximize the indirect effect of education on income through occupation and to minimize the direct effect of education on income, net of occupation (both effects being net of age). As discussed in this indicator, students were also classified into national quarters on the ISEI.
15 In PISA 2003, the United States had the highest mean index score of all the G-8 countries reporting data (OECD 2004).

INDICATOrS PArT II: ACADEMIC PErFOrMANCE—SCIENCE 37
Indicator 12
Figure 12b. Change in average scale scores of 15-year-old students in science literacy in PISA 2006 per one-standard-deviation increase in the parent occupational index, by country: 2006
Figure 12a. Average scale scores of 15-year-old students in science literacy in PISA 2006, by parent occupational status and country: 2006
1 The United Kingdom includes England, Northern Ireland, Scotland, and Wales.NOTE: In the 2006 Program for International Student Assessment (PISA 2006), parent occupational status is measured by the Highest International Socioeconomic Index of Occupational Status (HISEI), which corresponds to the highest occupational index score of the student’s father or mother. This information, derived from students’ responses to questionnaire items pertaining to parental occupation, is transformed into an index developed by Ganzeboom, De Graaf, and Treiman (1992). The index is keyed to the International Standard Classification of Occupations (ISCO) and allows direct comparisons between nations. Shown in this figure is the average score-point difference that is associated with an increase of one standard deviation (i.e., 17.1 units) on the parent occupational index. SOURCE: Organization for Economic Cooperation and Development (OECD). (2007). PISA 2006: Science Competencies for Tomorrow’s World, Volume 2: Data, table 4.8b. Paris: Author.
1 The United Kingdom includes England, Northern Ireland, Scotland, and Wales.NOTE: In the 2006 Program for International Student Assessment (PISA 2006), parent occupational status is measured by the Highest International Socioeconomic Index of Occupational Status (HISEI), which corresponds to the highest occupational index score of the student’s father or mother. This information, derived from students’ responses to questionnaire items pertaining to parental occupation, is transformed into an index developed by Ganzeboom, De Graaf, and Treiman (1992). The index is keyed to the International Standard Classification of Occupations (ISCO) and allows direct comparisons between nations. SOURCE: Organization for Economic Cooperation and Development (OECD). (2007). PISA 2006: Science Competencies for Tomorrow’s World, Volume 2: Data, table 4.8b. Paris: Author.
-50
-40
-30
-20
-10
0
10
20
30
40
50
27
4238
28
19 22
3936
Canada France Germany Italy Japan RussianFederation
UnitedKingdom1
UnitedStates
Country
Change in score points
0
100
200
300
400
500
600
1,000
502
569
448
559
474
569
442
512 506
559
451
507472
568
445
541
Canada France Germany Italy Japan RussianFederation
United Kingdom1
UnitedStates
Country
Average score
Top national quarterof occupational index
Bottom national quarterof occupational index

38 INDICATOrS PArT II: ACADEMIC PErFOrMANCE—SCIENCE
G-8 Countries Included: Canada, France, Germany, Italy, Japan, Russian Federation, United Kingdom, United States
SCIEnCE ACHIEvEMEnt AnD IMMIGRAnt StAtUS
In all G-8 countries with data shown except the Russian Federation, 15-year-old second- and first-generation students scored lower on the PISA 2006 combined science literacy scale compared to their native peers.
Using data from the 2006 Program for International Student Assessment (PISA 2006), this indicator compares 15-year-old students’ science achievement by immigration status across the G-8 countries. In PISA 2006, the student background questionnaire asked 15-year-olds to report if they were native (born in the country of assessment with at least one of their parents born in the same country), or had an immigrant background within two generations. Students not reporting native also reported if they were second generation (born in the country of assessment but with parents born in another country), or first generation (born in another country and with parents born in another country).16 In 2006, 15 percent of U.S. 15-year-olds had an immigrant background within two generations; of these, 9 percent reported being second generation students and 6 percent reported being first generation students (figure 13a). The U.S. percentage of students with an immigrant background within two generations (15 percent) was higher than the corresponding percentage for the russian Federation (9 percent), the United
Kingdom (9 percent), Italy (4 percent), and Japan (0.4 percent), but lower than that for Canada (21 percent).
In all G-8 countries with data shown17 except the russian Federa-tion, 15-year-old students with an immigrant background scored lower, on average, on the PISA 2006 combined science literacy scale than their native peers (figure 13b). Excluding the russian Federation (where score points were not measurably different), score-point differences ranged from 12 points in Canada to 93 points in Germany between second-generation and native students and from 22 points in Canada to 77 points in Germany between first-generation and native students; in the United States, the corresponding score-point differences were 43 and 57 points, respectively.
Among native students, the United States scored lower, on average, than the United Kingdom, Japan, Germany, and Canada but higher, on average, than the russian Federation and Italy on the combined science literacy scale. Second- and first-generation students in the United States were outperformed, on average, by their peers in the United Kingdom and Canada. First-generation students in the United States were also outperformed, on average, by their peers in the russian Federation, although U.S. first-generation students scored higher, on average, than their peers in Italy.
Definitions and Methodology
In PISA, “15-year-olds” refers to students between 15 years and 3 months to 16 years and 2 months old at the at the time of the assessment and who have completed at least 6 years of formal schooling. Students were tested in the language of instruction used in their school. Multilingual countries developed as many versions of the test instruments as there were languages of instruction used in the schools included in their national sample.
PISA was designed to be as inclusive as possible. Each participating country attempted to maximize the coverage of 15-year-olds enrolled in education in its national sample so that results would be representative of the entire national school system. Thus, efforts were made to ensure that exclusions at the school or student level, if they were necessary, were minimized according to the PISA technical standards. Countries might find it necessary to reduce their coverage of the target population by excluding, for example, a small, remote geographical region due to inaccessibility. Instances where minority languages were used in only a very limited number of schools could be excluded from the target population if this was determined not to affect the overall quality of the data collection. Within schools, students could be excluded for being intellectually disabled, functionally disabled, or having insufficient language experience. Students were not to be excluded solely because of poor academic performance or normal discipline problems. With respect
to insufficient language experience, students could be excluded only if they met the following three criteria: not being native speakers in the assessment language, having limited proficiency in the assessment language, and receiving less than 1 year of instruction in the assessment language.
The sampling standards used in PISA permitted countries to exclude up to a total of 5 percent of the relevant population for approved reasons. All G-8 countries achieved this standard except for Canada, which had an overall exclusion rate of 6 percent. Canada’s within-school exclusion rate was 5 percent. In all other G-8 countries, the within-school exclusion rates ranged from 0 percent in Japan to 4 percent in the United States. (See OECD 2009 for additional details about exclusions, including procedures, criteria, and rates.)
Scores on the PISA 2006 combined science literacy scale are reported on a scale from 0 to 1,000 with the OECD average fixed at 500 and the standard deviation fixed at 100. For more informa-tion about science literacy in PISA 2006, see the Definitions and Methodology section of indicators 10 and 11.
The computations presented in the text were carried out using unrounded numbers; therefore, they may differ from computations made using the rounded numbers that appear in figures 13a and 13b.
16 PISA was not designed to specifically sample populations of immigrant and non-immigrant students. Rather, the study was designed to represent general populations of 15-year-old students in national school systems, which typically include both immigrant and non-immigrant students. Students with insufficient language experience could be excluded from participating in PISA. Thus, results from PISA may differ from other studies that have immigrant and non-immigrant students as target populations. See the Definitions and Methodology section for more information about the PISA sampling and administration, including exclusions. 17 Combined science literacy scores are not shown for Italy for second-generation students and for Japan for first-and second-generation students because there are too few cases to provide reliable estimates.
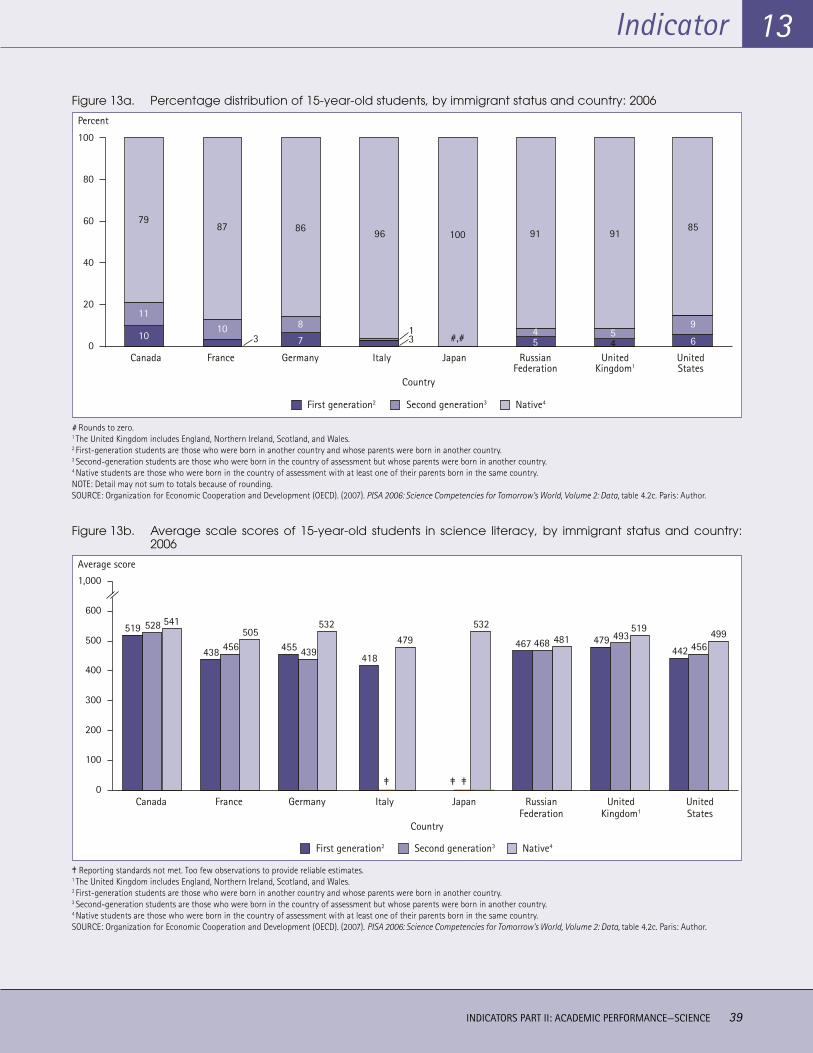
INDICATOrS PArT II: ACADEMIC PErFOrMANCE—SCIENCE 39
Indicator 13
Figure 13a. Percentage distribution of 15-year-old students, by immigrant status and country: 2006
Figure 13b. Average scale scores of 15-year-old students in science literacy, by immigrant status and country: 2006
# Rounds to zero. 1 The United Kingdom includes England, Northern Ireland, Scotland, and Wales. 2 First-generation students are those who were born in another country and whose parents were born in another country. 3 Second-generation students are those who were born in the country of assessment but whose parents were born in another country. 4 Native students are those who were born in the country of assessment with at least one of their parents born in the same country. NOTE: Detail may not sum to totals because of rounding. SOURCE: Organization for Economic Cooperation and Development (OECD). (2007). PISA 2006: Science Competencies for Tomorrow’s World, Volume 2: Data, table 4.2c. Paris: Author.
‡ Reporting standards not met. Too few observations to provide reliable estimates. 1 The United Kingdom includes England, Northern Ireland, Scotland, and Wales. 2 First-generation students are those who were born in another country and whose parents were born in another country. 3 Second-generation students are those who were born in the country of assessment but whose parents were born in another country. 4 Native students are those who were born in the country of assessment with at least one of their parents born in the same country. SOURCE: Organization for Economic Cooperation and Development (OECD). (2007). PISA 2006: Science Competencies for Tomorrow’s World, Volume 2: Data, table 4.2c. Paris: Author.
10
11
79
310
87
7
8
86 96
1#,#3
100
54
91
45
91
6
9
85
Canada France Germany Italy Japan RussianFederation
UnitedKingdom1
UnitedStates
0
20
40
60
80
100
First generation2 Native4Second generation3
Percent
Country
541528519 505456438
532
439455479
418
532481468467
519493479 499
456442
First generation2 Native4Second generation3
Canada France Germany Italy Japan RussianFederation
UnitedKingdom1
UnitedStates
0
100
200
300
400
500
600
1,000
Country
Average score
‡ ‡ ‡


indicators part iiiindicators part iiiContext for Learning

42 INDICATOrS PArT III: CONTExT FOr LEArNING
tIME DEvOtED tO READInG InStRUCtIOn DURInG tHE SCHOOL wEEk
The United States had the highest percentage of fourth-graders with teachers who reported spending more than 6 hours on reading instruction in a typical week. It was most common for U.S. fourth-graders to spend more than 6 hours in reading instruction, unlike students in the other participating G-8 countries.
Using data from the 2006 Progress in International reading Literacy Study (PIrLS 2006), this indicator presents the reports of teachers of fourth-graders about how much time in a typical week they spend on reading instruction. As reported in this indicator, the average number of hours spent on reading instruction is grouped into three categories: 3 hours or less, more than 3 and up to and including 6 hours, and more than 6 hours.
Teachers’ reports of the average number of hours spent on reading instruction each week generally varied widely both across and within the participating G-8 countries18 (figure 14). For example,
in 2006, the percentage of fourth-graders whose teachers reported spending 3 hours or less in a typical week on reading instruction ranged from 10 percent in the United States to 71 percent in Germany. This category was reported more frequently than the other two categories in three G-8 countries, including Germany (71 percent), England (67 percent), and Italy (51 percent). For the category of more than 3 and up to and including 6 hours of reading instruction, the percentages ranged from 22 percent in the United States to 60 percent in the russian Federation. This category was reported more frequently than the other two categories in two G-8 countries, including the russian Federation (60 percent) and France (48 percent). For the category of more than 6 hours of reading instruction, the percentages ranged from 6 percent in Germany to 68 percent in the United States. The United States not only had the highest percentage of fourth-graders with teachers who reported spending more than 6 hours on reading instruction in a typical week, but it also was the only participating G-8 country to cite this category more frequently than any other category.
Data for this indicator are from the PIrLS 2006 fourth-grade teacher questionnaire, which was administered to the teachers of the students sampled for PIrLS. The questionnaire included questions on teachers’ background and on their teaching practices in the sampled students’ classes. One or two classes were randomly sampled in each school, and teachers were asked to complete a questionnaire for each class they taught that contained sampled students. Thus, if a teacher taught two classes with sampled students, he or she was expected to complete a questionnaire for each of these classes. It should be noted that the PIrLS 2006 fourth-grade teachers do not constitute representative samples of teachers. rather, they are the teachers for nationally representative samples of fourth-grade students. Thus, the teacher data presented in this indicator were analyzed at the student level.
In PIrLS 2006, countries were required to sample students in the grade that corresponded to the end of 4 years of formal schooling,
Definitions and Methodology
G-8 Countries Included: England, France, Germany, Italy, Russian Federation, Scotland, United States
providing that the mean age at the time of testing was at least 9.5 years. As defined by PIrLS, the 1st year of formal schooling begins with the 1st year of primary school (ISCED97 level 1), which should mark the beginning of formal instruction in reading, writ-ing, and mathematics. Note that kindergarten is not counted. For most countries, the target grade was fourth grade, or its national equivalent.
Teachers’ reports of how much time in a typical week is spent on reading instruction are based on the following question: “regardless of whether or not you have formally scheduled time for reading instruction, in a typical week about how much time do you spend on reading instruction and/or activities with the students? Include things you do across curriculum areas and during formally scheduled time for reading instruction.” Teachers were asked to write in the hours and minutes per week.
18 Canada also participated in PIRLS 2006 but not at the national level. Canada participated as separate provinces (Alberta, British Columbia, Nova Scotia, Ontario, and Quebec). Data corresponding with this indicator for the participating Canadian provinces can be found in appendix table B4.

Indicator
INDICATOrS PArT III: CONTExT FOr LEArNING 43
14
Figure 14. Percentage distribution of fourth-grade students receiving reading instruction each week, by teacher reports of average number of hours spent on reading instruction each week and country: 2006
1 Data are available for at least 70 percent, but less than 85 percent, of the students. Missing data have not been explicitly accounted for in the data. 2 Met international guidelines for participation rates only after substitute schools were included. That is, to avoid sample size losses resulting from sampled schools not participating, a mechanism was instituted to identify, a priori, substitute schools that have similar characteristics to the sampled schools that they may replace.NOTE: Detail may not sum to totals because of rounding.SOURCE: Mullis, I.V.S., Martin, M.O., Kennedy, A.M., and Foy, P. (2007). PIRLS 2006 International Report: IEA’s Progress in International Reading Literacy Study in Primary Schools in 40 Countries, exhibit 5.11. Chestnut Hill, MA: TIMSS & PIRLS International Study Center, Boston College.
67
25
8
23
48
29
71
23
6
51
30
19
12
60
28
45
43
12
10
22
68
England France Germany1 Italy RussianFederation
Scotland1,2 UnitedStates2
0
20
40
60
80
100
More than 3 and up toand including 6 hours
3 hours or less More than 6 hours
Percent
Country

44 INDICATOrS PArT III: CONTExT FOr LEArNING
G-8 Countries Included: England, France, Germany, Italy, Russian Federation, Scotland, United States
fOURtH-GRADE tEACHERS’ StRAtEGIES fOR ASSIStInG StUDEntS HAvInG DIffICULty READInG
One of the most common strategies reported by teachers to assist fourth-graders having difficulty reading was to ask the parents to help their child with reading. Thirty-four percent of fourth-graders in the United States had teachers who reported always having a remedial reading specialist available (compared to less than 10 percent of fourth-graders in France, Germany, and Italy).
Using data from the 2006 Progress in International reading Literacy Study (PIrLS 2006), this indicator presents teachers’ reports about the strategies that they used to help fourth-graders having difficulty reading. Teachers were given a list of strategies and asked whether each one was used if a student begins to fall behind in reading.
In 2006, a combination of strategies was reportedly used to varying degrees in the participating G-8 countries19 to assist students having difficulty reading. One of the most common strategies was to ask parents to help their child with reading (table 4). The percentage of fourth-graders whose teachers reported asking parents to help their child with reading ranged from 84 percent in France to 99 percent in the russian Federation and England. In the United States, this strategy was used more frequently than any of the others; 97 percent of fourth-graders had a teacher who reported using it.
A second strategy commonly used to assist students having difficulty reading was working with students individually. The percentage of fourth-graders whose teachers reported working with students individually ranged from 78 percent in England to 92 percent in Scotland and Italy. In the United States, 89 percent of fourth-graders had a teacher who reported doing this. In Italy, Scotland, and France, working with students individually was done about as frequently as asking the parents to help their child with reading.
A third strategy commonly used by several G-8 countries to assist students having difficulty reading was to have the student work with other students; its reported use ranged from 45 percent in Scotland to
83 percent in Italy. In the United States 80 percent of fourth-graders had a teacher who reported using this strategy.
There were a few strategies for assisting students having difficulty reading where reported use varied considerably across the G-8 countries. For example, the percentage of fourth-graders who had a teacher who reported assigning homework to help the student catch up ranged from 23 percent in France to 94 percent in the russian Federation, with the United States at 45 percent. The reported use of the strategy of having the student work in the regular classroom with a teacher aide ranged from 8 percent in Germany to 72 percent in England, with the United States at 31 percent. The reported use of the strategy of waiting to see if performance improves with maturation ranged from 17 percent in Scotland to 65 percent in the russian Federation, with the United States at 32 percent.
A reading specialist may also be used to assist students having difficulty reading. In most of the G-8 countries, this was more likely to take place in a remedial classroom than in the regular classroom. For example, in England, the United States, and Scotland, about half of fourth-graders had a teacher who reported having students work in a remedial classroom with a reading specialist, which compares to 28, 15, and 18 percent, respectively, for having students work in the regular classroom with a reading specialist.
PIrLS also asked teachers of fourth-graders about their access to remedial reading specialists. Thirty-four percent of fourth-graders in the United States and 24 percent of fourth-graders in England had teachers who reported always having a remedial reading specialist available (figure 15). Less than 10 percent of fourth-graders in France, Germany, and Italy had teachers who reported always having a remedial reading specialist available. England had the lowest percentage of fourth-graders whose teachers never had access to a remedial reading specialist (16 percent), while Italy had the highest (95 percent). In the United States, 29 percent of fourth-graders had teachers who reported never having access to a remedial reading specialist.
Definitions and Methodology
Data for this indicator are from the PIrLS 2006 fourth-grade teacher questionnaire, which was administered to the teachers of the students sampled for PIrLS. The questionnaire included questions on teachers’ background and on their teaching practices in the sampled students’ classes. One or two classes were randomly sampled in each school, and teachers were asked to complete a questionnaire for each class they taught that contained sampled students. Thus, if a teacher taught two classes with sampled students, he or she was expected to complete a questionnaire for each of these classes. It should be noted that the PIrLS 2006 fourth-grade teachers do not constitute representative samples of teachers. rather, they are the teachers for nationally representative samples of fourth-grade students. Thus, the teacher data presented in this indicator were analyzed at the student level.
In PIrLS 2006, countries were required to sample students in the grade that corresponded to the end of 4 years of formal schooling, providing that the mean age at the time of testing was at least 9.5 years. As defined by PIrLS, the 1st year of formal schooling begins with the
1st year of primary school (ISCED97 level 1), which should mark the beginning of formal instruction in reading, writing, and mathematics. Note that kindergarten is not counted. For most countries, the target grade was fourth grade, or its national equivalent.
Teachers’ reports about whether or not they used various strategies to help fourth-graders who are having difficulty reading are based on the percentages of students whose teachers responded “yes” to a list of strategies that follow the question, “What do you usually do if a student begins to fall behind in reading?”
Teachers’ reports about the availability of remedial reading specialists to assist fourth-graders who are having difficulty reading were based on teachers’ responses to the question, “Are the following resources available to you to deal with students who have difficulty with reading?” As shown in figure 15, results are based on the percentages of students whose teachers responded “always,” “sometimes,” or “never” to the availability of a remedial reading specialist either in the classroom or in a remedial reading classroom.
19 Canada also participated in PIRLS 2006 but not at the national level. Canada participated as separate provinces (Alberta, British Columbia, Nova Scotia, Ontario, and Quebec). Data corresponding with this indicator for the participating Canadian provinces can be found in appendix tables B5 and B6.

Indicator
INDICATOrS PArT III: CONTExT FOr LEArNING 45
15
Table 4. Percentage of fourth-graders whose teachers reported employing specific strategies for assisting students having difficulty reading, by country: 2006
Country
Wait to see if performance
improves with maturation
Work with student
individually
Have other students work with student
Assign homework to help student
catch up
Ask parents to help student
with reading
Have student work in
regular class-room with
teacher aide
Have student work in regular
classroom with reading
specialist
Have student work in
remedial classroom
with reading specialist
England 34 78 53 39 99 72 28 50France 41 82 58 23 84 11 14 23Germany 25 80 69 63 98 8 5 33Italy 48 92 83 72 93 22 1 4russian Federation 65 89 67 94 99 26 5 27Scotland1 17 92 45 68 96 67 18 51United States1 32 89 80 45 97 31 15 50
1 Met international guidelines for participation rates only after substitute schools were included. That is, to avoid sample size losses resulting from sampled schools not participating, a mechanism was instituted to identify, a priori, substitute schools that have similar characteristics to the sampled schools that they may replace. SOURCE: International Association for the Evaluation of Educational Achievement, Progress in International Reading Literacy Study (PIRLS), 2006.
# Rounds to zero. 1 Met international guidelines for participation rates only after substitute schools were included. That is, to avoid sample size losses resulting from sampled schools not participating, a mechanism was instituted to identify, a priori, substitute schools that have similar characteristics to the sampled schools that they may replace. NOTE: Availability of remedial reading specialist indicates that a specialist was available either in the classroom or in a remedial reading classroom. Detail may not sum to totals because of rounding. SOURCE: Mullis, I.V.S., Martin, M.O., Kennedy, A.M., and Foy, P. (2007). PIRLS 2006 International Report: IEA’s Study of Reading Literacy Achievement in Primary Schools in 40 Countries, exhibit 5.18. Chestnut Hill, MA: TIMSS & PIRLS International Study Center, Boston College.
Figure 15. Percentage distribution of fourth-graders, by teacher reports of availability of remedial reading specialist and country: 2006
24
60
16
6
33
61
5
35
59
5 #
95
15
22
63
18
36
46
34
37
29
England France Germany Italy RussianFederation
Scotland1 UnitedStates1
0
20
40
60
80
100
Percent
Country
NeverSometimesAlways

46 INDICATOrS PArT III: CONTExT FOr LEArNING
Definitions and Methodology
Data for this indicator are from the PIrLS fourth-grade teacher questionnaire, which was administered to the teachers of the students sampled for PIrLS in 2001 and 2006. The questionnaire included questions on teachers’ background and on their teaching practices in the sampled students’ classes. One or two classes were randomly sampled in each school, and teachers were asked to complete a questionnaire for each class they taught that contained sampled students. Thus, if a teacher taught two classes with sampled students, he or she was expected to complete a questionnaire for each of these classes. It should be noted that the PIrLS fourth-grade teachers do not constitute representative samples of teachers in 2001 and 2006. rather, they are the teachers for nationally representative samples of fourth-grade students. Thus, the teacher data presented in this indicator were analyzed at the student level.
In PIrLS 2006, countries were required to sample students in the grade that corresponded to the end of 4 years of formal schooling, providing that the mean age at the time of testing was at least 9.5 years. As defined by PIrLS, the 1st year of formal schooling
G-8 Countries Included: England, France, Germany, Italy, Russian Federation, Scotland, United States
tREnDS In tEACHERS’ AGE AnD ExpERIEnCE
In England and the United States, the average years of teaching experience among teachers of fourth-graders was lower than in all other participating G-8 countries in 2006. In France, Germany, and the United States, average teaching experience was 3 years lower in 2006 compared to 2001.
Using data from the Progress in International reading Literacy Study (PIrLS) administrations of 2001 and 2006, this indicator reports trends in the age and experience of fourth grade teachers.
Across the G-8 countries in 2006, the percentage of fourth-graders with teachers reporting their age as 29 years or younger at the time of the assessment ranged from 2 percent in Italy to 30 percent in England, with the United States at 21 percent (data not shown). In Scotland and the United States, the estimates were 12 and 8 percentage points higher, respectively, in 2006 compared to 2001 (figure 16a). The only measurable decrease from 2001 to 2006 in the percentage of fourth-graders with teachers reporting their age as 29 years or younger was in the russian Federation, where it was 11 percentage points lower in 2006 compared to 2001.
The percentage of fourth-graders with teachers reporting their age as 50 years or older in 2006 ranged from 18 percent in France
to 49 percent in Germany, with the United States at 25 percent (data not shown). Among the G-8 countries, the only measurable difference from 2001 to 2006 in the percentage of fourth-graders with teachers reporting their age as 50 years or older was in the United States, where it was 12 percentage points lower in 2006 compared to 2001 (figure 16a).
Teachers of fourth-graders also reported their years of teaching experience (at all grades). Across the G-8 countries,20 the average years of teaching experience ranged from 12 years in England and the United States to 22 years in Italy and the russian Federation in 2006 (figure 16b). The average years of teaching experience in England and the United States was lower than in all other participating G-8 countries. In France, Germany, and the United States, average teaching experience was 3 years lower in 2006 compared to 2001. The only increase in average years of teaching experience from 2001 to 2006 was in the russian Federation, where it was 2 years higher in 2006 compared to 2001. Thus, comparing data from 2001 and 2006 on teachers’ age and experience, the russian Federation showed a pattern where fourth-graders had a decrease in the percentage of beginning teachers and an increase in teachers’ years of teaching experience, while the United States showed the opposite pattern.
begins with the 1st year of primary school (ISCED97 level 1), which should mark the beginning of formal instruction in reading, writ-ing, and mathematics. Note that kindergarten is not counted. For most countries, the target grade was fourth grade, or its national equivalent.
For teachers’ reports of their age, teachers were given the following response options in the PIrLS teacher questionnaire: (1) under 25; (2) 25 to 29; (3) 30 to 39; (4) 40 to 49; (5) 50 to 59; or (6) 60 or more. For the purposes of this indicator, the bottom two categories were combined and the top two categories were combined. The categories of “29 years or younger” and “50 years or older” were used in this indicator in order to highlight the percentage of fourth-graders with beginning teachers and the percentage with teachers nearing retirement.
As presented in the text or shown in figure 16a, differences from 2001 to 2006 were computed from unrounded numbers; therefore, they may differ from computations made using the rounded numbers cited in the text or shown in figure 16b.
20 Canada also participated in PIRLS 2006 but not at the national level. Canada participated as separate provinces (Alberta, British Columbia, Nova Scotia, Ontario, and Quebec). Data corresponding with this indicator for the participating Canadian provinces can be found in appendix tables B7 and B8.

Indicator
INDICATOrS PArT III: CONTExT FOr LEArNING 47
16
* p < .05 (difference in the percentage points of students from 2001 to 2006 is statistically significant). 1 Met international guidelines for participation rates only after substitute schools were included. That is, to avoid sample size losses resulting from sampled schools not participating, a mechanism was instituted to identify, a priori, substitute schools that have similar characteristics to the sampled schools that they may replace. For England, this applies to 2001 only. SOURCE: Mullis, I.V.S., Martin, M.O., Gonzalez, E.J., and Kennedy, A.M. (2003). PIRLS 2001 International Report: IEA’s Study of Reading Literacy Achievement in Primary Schools in 35 Countries, exhibit 6.1. Chestnut Hill, MA: TIMSS & PIRLS International Study Center, Boston College; Mullis, I.V.S., Martin, M.O., Kennedy, A.M., and Foy, P. (2007). PIRLS 2006 International Report: IEA’s Progress in International Reading Literacy Study in Primary Schools in 40 Countries, exhibit 6.3. Chestnut Hill, MA: TIMSS & PIRLS International Study Center, Boston College.
* p < .05 (difference in the number of years teaching in 2006 compared to 2001 is statistically significant). 1 Met international guidelines for participation rates only after substitute schools were included. That is, to avoid sample size losses resulting from sampled schools not participating, a mechanism was instituted to identify, a priori, substitute schools that have similar characteristics to the sampled schools that they may replace. For England, this applies to 2001 only. SOURCE: Mullis, I.V.S., Martin, M.O., Gonzalez, E.J., and Kennedy, A.M. (2003). PIRLS 2001 International Report: IEA’s Study of Reading Literacy Achievement in Primary Schools in 35 Countries, exhibit 6.1. Chestnut Hill, MA: TIMSS & PIRLS International Study Center, Boston College; Mullis, I.V.S., Martin, M.O., Kennedy, A.M., and Foy, P. (2007). PIRLS 2006 International Report: IEA’s Progress in International Reading Literacy Study in Primary Schools in 40 Countries, exhibit 6.3. Chestnut Hill, MA: TIMSS & PIRLS International Study Center, Boston College.
Figure 16a. Difference in percentage points of fourth-grade students with teachers ages 29 years or younger and 50 years or older as reported by teachers, by country: 2001 and 2006
Figure 16b. Average number of years of teaching experience (at all grades) as reported by teachers of fourth-grade students, by country: 2001 and 2006
2 37
-5-2 -4 -1
6
-11*
1
12*8 8*
-12*
-50
-40
-30
-20
-10
0
10
20
30
40
50
England1 France Germany Italy Russian Federation
Scotland1 UnitedStates1
Difference in percentage points
Country
50 years or older29 years or younger
Higher in 2006
Lower in 2006
0
5
10
15
20
25
30
35
1412
18
15*
23
20*2222
19
22*
1816 15
12*
England1 France
Number of years
Germany Italy RussianFederation
Scotland1 UnitedStates1
Country
2006 2001

48 INDICATOrS PArT III: CONTExT FOr LEArNING
G-8 Countries Included: England, France, Germany, Italy, Japan, Russian Federation, Scotland, United States
tEACHERS’ wORkInG tIME
Although teachers in the United States were contracted to teach more hours than their peers in the other reporting G-8 countries, they worked less total hours (teaching time plus related nonteaching time) than their peers in Japan and Germany.
This indicator presents two measures of teachers’ average work-ing time per year: (1) teaching hours—the amount of time spent instructing students, and (2) working time—the total amount of time spent teaching and doing other work-related activites (e.g., preparing lessons and correcting assignments and tests). It should be noted that these results are generally based on the amount of time that teachers are contracted to work and do not take into account the possible variation in the number of hours teachers actually work.
In 2006, teachers in the United States at the primary, lower second-ary, and upper secondary levels were contracted to teach an average of 1,080 hours during the school year (figure 17). This was more than in any other G-8 country reporting data at these three levels. Besides the United States, the only other reporting G-8 country with the same number of teaching hours at the three education levels was Scotland (893 hours). In France, Germany, and Italy, primary school teachers were contracted to work more teaching hours than lower and upper secondary teachers; of these three countries,
France reported the greatest differential, with 276 more hours for primary school teachers than for lower secondary school teachers, and 294 more hours for primary school teachers than for upper secondary school teachers. The only reporting G-8 country in which primary school teachers spent fewer contracted hours teaching than lower and upper secondary teachers was the russian Federation, with 290 fewer hours for primary school teachers.
regulations on working time vary across the G-8 countries (see table 5). England and the United States specify the number of hours that teachers are required to be at school. Germany, Japan and Scotland specify statutory working time, which can occur at school or elsewhere. Although teachers in the United States were contracted to teach more hours than their peers in the other reporting G-8 countries, they worked less total hours than their peers in Japan and Germany when working time was defined not only as time spent on teaching but also as time spent on other work-related activities. For all three education levels, the statutory working time for teachers in Japan (1,952 hours per year) and Germany (1,765 hours per year) exceeded U.S. teachers’ working time required at school (primary: 1,332 hours per year; lower and upper secondary: 1,368 hours per year). England required fewer total hours spent on teaching and other work-related activities (1,265 hours per year) than all other reporting G-8 countries and at all three education levels.
Definitions and Methodology
In this indicator, the term “teaching hours” refers to “net teaching hours,” which are calculated as follows: annual number of weeks of instruction multiplied by the minimum/maximum number of periods that a teacher is supposed to spend teaching a class or group multiplied by the length of a period in minutes and divided by 60. Periods of time formally allowed for breaks between lessons or group of lessons, and days when schools are closed for public holidays and festivities, are excluded.
Working time refers to the normal working hours of a full-time teacher. According to the formal policy in a given country, working time can refer either to
the time directly associated with teaching (and other curricular •activities for students such as administering assignments and tests, but excluding annual examinations); orthe time directly associated with teaching as well as the time •devoted to other activities related to teaching (such as lesson preparation, counseling students, correcting assignments and tests, professional development, meetings with parents, staff meetings, and general school tasks).
Working time does not include paid overtime.
Working time required at school refers to the working time teachers are supposed to be at school, including teaching time and nonteaching time.
Statutory working time refers to the normal working hours of a full-time teacher and includes net teaching hours (i.e., the time directly associated with teaching) as well as nonteaching hours devoted to activities related to teaching, such as lesson preparation, counseling students, and correcting assignments and tests. Statutory working time may include nonteaching time not spent at school.
Teaching staff include professional personnel directly involved in teaching students. The classification includes classroom teachers; special education teachers; and other teachers who work with a whole class of students in a classroom, in small groups in a resource room, or in one-to-one teaching situations inside or outside a regu-lar classroom. Teaching staff also includes department chairpersons whose duties include some teaching, but excludes non-professional personnel who support teachers in providing instruction to students, such as teachers’ aides and other paraprofessional personnel.

Indicator
INDICATOrS PArT III: CONTExT FOr LEArNING 49
17
NOTE: Shown are net teaching hours, which refer to the number of teaching hours per year. This excludes break periods between lessons and days when schools are closed for public holidays and festivities. In primary education, however, short breaks that teachers spend with the class are typically included. Data for England and Japan are not available. Education levels are defined according to the International Standard Classification of Education (ISCED97). Primary education refers to ISCED97 level 1, lower secondary to ISCED97 level 2, and upper secondary to ISCED97 level 3. For more information on the ISCED97 levels, see appendix A in this report. SOURCE: Organization for Economic Cooperation and Development (OECD). (2008). Education at a Glance: OECD Indicators 2008, table D4.1. Paris: Author.
Figure 17. Average number of teaching hours over the school year, by level of education and country: 2006
0
200
400
600
800
1,000
1,200
910
634 616
810758
714 735
601 601656
946 946893 893 893
1,080 1,080 1,080
France
Number of hours
Germany Italy RussianFederation
Scotland UnitedStates
Country
Upper secondary educationLower secondary educationPrimary education
Table 5. Teacher working time required at school and statutory working time in hours over the school year, by level of education and country: 2006
Country
Working time required at school in hours Statutory working time required in hours
Primary education
Lower secondary education
Upper secondary education
Primary education
Lower secondary education
Upper secondary education
England 1,265 1,265 1,265 1,265 1,265 1,265France † † † † † †Germany † † † 1,765 1,765 1,765Italy † † † † † †Japan † † † 1,952 1,952 1,952Scotland † † † 1,365 1,365 1,365United States1 1,332 1,368 1,368 † † †
† Not applicable. Not specified by legislation. 1 Teachers’ working time not collected through administrative records but from individual teachers’ reports of number of hours required to be at school. NOTE: Working time required at school refers to the working time teachers are supposed to be at school, including teaching time and nonteaching time. Nonteaching time refers to activities related to teaching, such as lesson preparation, counseling students, and correcting assignments and tests. Statutory working time refers to the normal working hours of a full-time teacher, and includes net teaching hours (i.e., the time directly associated with teaching) as well as nonteaching hours devoted to activities related to teaching. Statutory working time may include nonteaching time not spent at school. Data for the Russian Federation are not available. Education levels are defined according to the International Standard Classification of Education (ISCED97). Primary education refers to ISCED97 level 1, lower secondary to ISCED97 level 2, and upper secondary to ISCED97 level 3. For more information on the ISCED97 levels, see appendix A in this report. SOURCE: Organization for Economic Cooperation and Development (OECD). (2008). Education at a Glance: OECD Indicators 2008, table D4.1. Paris: Author.

50 INDICATOrS PArT III: CONTExT FOr LEArNING
G-8 Countries Included: England, Germany,21 Italy, Japan, Russian Federation, Scotland, United States
tEACHER pROfESSIOnAL DEvELOpMEnt In MAtHEMAtICS
In 2007, about 60 percent of U.S. fourth-graders and 81 percent of U.S. eighth-graders had teachers who reported participating in professional development in mathematics content.
The 2007 Trends in International Mathematics and Science Study (TIMSS 2007) asked teachers of fourth- and eighth-graders to report on their participation in several areas of professional development in mathematics in the 2 years before the assessment. This indicator discusses the results for teachers of fourth- and eighth-graders in four areas of mathematics: content, pedagogy/instruction, improving students’ critical thinking or problem-solving skills, and assessment.
In 2007, the percentage of fourth-graders whose teachers reported participating in professional development in mathematics content in the previous 2 years ranged from 22 percent in Italy to 66 percent in the russian Federation (figure 18). A greater percentage of U.S. fourth-graders had teachers who reported participating in profes-sional development in mathematics content (60 percent) than in any of the other professional development areas. The United States had a greater percentage of fourth-graders whose teachers reported participating in this area of professional development than in Italy, Scotland, Germany, and Japan. At eighth grade, the percentage of students whose teachers reported participating in professional development in mathematics content ranged from 16 percent in Italy to 84 percent in the russian Federation. Eighty-one percent of U.S. eighth-graders had mathematics teachers who reported participating in this area of professional development, which was higher than in England and Italy.
The percentage of students whose teachers reported participating in professional development in mathematics pedagogy/instruction ranged from 25 percent in Italy to 70 percent in England at fourth grade and 34 percent in Italy to 93 percent in Scotland at eighth grade. About half of fourth-graders and three-quarters of eighth-graders in the United States had teachers who reported participat-ing in this area of professional development. A greater percentage of fourth-graders in England, the russian Federation, and Scotland than in the United States had teachers who reported participating in professional development in mathematics pedagogy/instruction (70, 67, and 62 percent vs. 50 percent). At eighth grade, Scotland
had a greater percentage of students whose mathematics teachers reported participating in this area of professional development than in the United States (93 vs. 76 percent).
The percentage of students whose teachers reported participating in professional development in mathematics on improving students’ critical thinking or problem-solving skills ranged from 22 percent in Italy to 59 percent in England at fourth grade and 9 percent in Italy to 65 percent in the United States at eighth grade. A greater percentage of fourth-graders in the United States than in Germany, Japan, and Italy had teachers who reported participating in this area of professional development (51 percent vs. 28, 27, and 22 percent). At eighth grade, the United States had a greater percentage of students whose mathematics teachers reported participating in this area than in England, Japan, and Italy (65 percent vs. 40, 39, and 9 percent).
The percentage of students whose teachers reported participating in professional development in mathematics assessment ranged from 14 percent in Italy to 55 percent in the russian Federation at fourth grade and 17 percent in Italy to 71 percent in Scotland at eighth grade. A greater percentage of fourth-graders in the United States than in Scotland, Germany, Japan, and Italy had teachers who reported participating in this area of professional development (47 percent vs. 33, 27, 21, and 14 percent). At eighth grade, the United States had a greater percentage of students whose mathematics teachers reported participating in this area than in the russian Federation, England, Japan, and Italy (69 percent vs. 60, 58, 39, and 17 percent).
The russian Federation was the only participating G-8 country where at least half of both fourth- and eighth-graders had teach-ers who reported participating in all four areas of professional development in mathematics. This level of participation was also found in the United States, except in assessment at grade 4, where 47 percent of students had teachers who reported participating. In several G-8 countries, there was often more reported participation at eighth grade than at fourth grade. In Japan and the United States, this was the case in all four professional development areas. Only in England and Italy for professional development in improving students’ critical thinking or problem-solving skills was participa-tion measurably higher at fourth grade than at eighth grade.
Definitions and Methodology
Data for this indicator are from the TIMSS 2007 teacher question-naire, which was designed to obtain information about the class-room contexts for the teaching and learning of mathematics and science and about the implemented curriculum in these subjects. For each participating school, one teacher questionnaire that addressed both mathematics and science was administered to the classroom teacher of the sampled fourth-grade class, and separate versions of the questionnaire were administered to the mathematics teacher and the science teacher of the sampled eighth-grade class. It should be noted that the TIMSS 2007 teachers do not constitute representative samples of teachers. rather, they are the teachers for nationally representative samples of fourth-grade and eighth-grade
students. Thus, the teacher data presented in this indicator were analyzed at the student level.
In TIMSS 2007 at fourth grade, countries were required to sample students in the grade that corresponded to the end of 4 years of formal schooling (the end of primary school), providing that the mean age at the time of testing was at least 9.5 years. At eighth grade, countries were required to sample students in the grade that corresponded to the end of 8 years of formal schooling (the end of lower secondary education), providing that the mean age at the time of testing was at least 13.5 years.
21 Data for Germany are only available at the fourth grade, as Germany did not participate in TIMSS 2007 at the eighth grade.

Indicator
INDICATOrS PArT III: CONTExT FOr LEArNING 51
18
— Not available. Data for Germany are only available at the fourth grade, as Germany did not participate in TIMSS 2007 at the eighth grade.1 Met international guidelines for participation rates only after substitute schools were included. That is, to avoid sample size losses resulting from sampled schools not participating, a mechanism was instituted to identify, a priori, substitute schools that have similar characteristics to the sampled schools that they may replace. For England, this applies to eighth grade only.2 National Defined Population covers 90 percent to 95 percent of National Target Population.SOURCE: Mullis, I.V.S., Martin, M.O., and Foy, P. (2008). TIMSS 2007 International Mathematics Report: Findings From IEA’s Trends in International Mathematics and Science Study at the Fourth and Eighth Grades, exhibit 6.4. Chestnut Hill, MA: TIMSS & PIRLS International Study Center, Boston College.
Figure 18. Percentage of fourth-grade and eighth-grade students whose teachers reported that they participated in various professional development activities in mathematics in the 2 years prior to assessment, by country: 2007
Assessment
0 20 40 60 80 100Percent
Improving students’ critical thinking or problem-solving skills
0 20 40 60 80 100Percent
Pedagogy/Instruction
0 20 40 60 80 100Percent
United States1,2
Scotland1
England1
Germany
Italy
Japan
RussianFederation
United States1,2
Scotland1
England1
Germany
Italy
Japan
RussianFederation
Country Content
0 20 40 60 80 100Percent
6066
44
22
—— —
1648
74
6684
4480
6081
7079
37
2534
5576
6773
6293
5076
Country
— —
5940
28
229
2739
5862
5756
5165
4358
27
1417
2139
5560
3371
4769
Eighth gradeFourth grade

52 INDICATOrS PArT III: CONTExT FOr LEArNING
G-8 Countries Included: England, Germany,22 Italy, Japan, Russian Federation, Scotland, United States
tEACHER pROfESSIOnAL DEvELOpMEnt In SCIEnCE
Compared to other participating G-8 countries in 2007, the United States had a greater percentage of eighth-graders whose science teachers reported participating in professional development in improving students’ critical thinking or prob-lem-solving skills (73 percent) and content (82 percent).
The 2007 Trends in International Mathematics and Science Study (TIMSS 2007) asked teachers of fourth- and eighth-graders to report on their participation in several areas of professional development in science in the 2 years before the assessment. This indicator discusses the results for teachers of fourth- and eighth-graders in four areas of science: content, pedagogy/instruction, improving students’ critical thinking or problem-solving skills, and assessment.
In 2007, the percentage of fourth-graders whose teachers reported participating in professional development in science content in the previous 2 years ranged from 16 percent in Italy to 58 percent in the russian Federation, with the United States at 42 percent (figure 19). The percentage in the United States was higher than in England and Italy, but lower than in the russian Federation. At eighth grade, the percentage of students whose teachers reported participating in professional development in science content ranged from 24 percent in Italy to 82 percent in the United States. The United States had a greater percentage of students whose science teachers reported participating in this area of professional development than in all other participating G-8 countries. A higher percentage of U.S. eighth-graders had science teachers who reported participating in professional development in science content than in any of the other professional development areas.
The percentage of fourth-graders whose teachers reported participating in professional development in science pedagogy/instruction ranged from 10 percent in Italy to 62 percent in the russian Federation, with the United States at 29 percent. At eighth grade, the percentage of students whose science teachers reported participating in professional development in this area ranged from 28 percent in Italy to 84 percent in Scotland, with the United States at 64 percent. At fourth grade in Japan and at both fourth and eighth grades in England, the russian Federation, and Scotland, a greater percentage of students had teachers who
reported participating in professional development in science pedagogy/instruction than their U.S. peers.
The percentage of students whose teachers reported participating in professional development in science on improving students’ critical thinking or problem-solving skills ranged from 11 percent in Japan to 47 percent in Scotland at fourth grade and 10 percent in Italy to 73 percent in the United States at eighth grade. Thirty-six percent of U.S. fourth-graders had teachers who reported participating in this area of professional development, higher than in Germany, Italy, and Japan, but lower than in Scotland. At eighth grade, the United States had a greater percentage of students whose science teachers reported participating in this area than in all other participating G-8 countries.
The percentage of students whose teachers reported participating in professional development in science assessment ranged from 6 percent in Italy to 52 percent in the russian Federation at fourth grade and 15 percent in Italy to 65 percent in England at eighth grade. About one-quarter of U.S. fourth-graders had teachers who reported participating in professional development in science assessment. The percentage in the United States was higher than in Japan (15 percent), Germany (15 percent), and Italy (6 percent), but lower than in England (36 percent) and the russian Federation (52 percent). At eighth grade, 61 percent of U.S. students had science teachers who reported participating in professional development in science assessment, which was higher than in Japan (40 percent) and Italy (15 percent).
In several G-8 countries, there was often more reported participa-tion in professional development in science at eighth grade than at fourth grade. In Scotland and the United States, this was the case in all four areas of professional development. In all participating G-8 countries, a greater percentage of eighth-graders than fourth-graders had teachers who reported participating in professional development in science pedagogy/instruction. Across all four areas of professional development in science, no participating G-8 country had a greater percentage of fourth-graders than eighth-graders with teachers reporting participation in professional development activities.
Definitions and Methodology
Data for this indicator are from the TIMSS 2007 teacher question-naire, which was designed to obtain information about the class-room contexts for the teaching and learning of mathematics and science and about the implemented curriculum in these subjects. For each participating school, one teacher questionnaire that addressed both mathematics and science was administered to the classroom teacher of the sampled fourth-grade class, and separate versions of the questionnaire were administered to the mathematics teacher and the science teacher of the sampled eighth-grade class. It should be noted that the TIMSS 2007 teachers do not constitute representative samples of teachers. rather, they are the teachers for nationally representative samples of fourth-grade and eighth-grade
students. Thus, the teacher data presented in this indicator were analyzed at the student level.
In TIMSS 2007 at fourth grade, countries were required to sample students in the grade that corresponded to the end of 4 years of formal schooling (the end of primary school), providing that the mean age at the time of testing was at least 9.5 years. At eighth grade, countries were required to sample students in the grade that corresponded to the end of 8 years of formal schooling (the end of lower secondary education), providing that the mean age at the time of testing was at least 13.5 years.
22 Data for Germany are only available at the fourth grade, as Germany did not participate in TIMSS 2007 at the eighth grade.

Indicator
INDICATOrS PArT III: CONTExT FOr LEArNING 53
19
— Not available. Data for Germany are only available at the fourth grade, as Germany did not participate in TIMSS 2007 at the eighth grade.1 Met international guidelines for participation rates only after substitute schools were included. That is, to avoid sample size losses resulting from sampled schools not participating, a mechanism was instituted to identify, a priori, substitute schools that have similar characteristics to the sampled schools that they may replace. For England, this applies to eighth grade only.2 National Defined Population covers 90 percent to 95 percent of National Target Population.SOURCE: Martin, M.O., Mullis, I.V.S., and Foy, P. (2008). TIMSS 2007 International Science Report: Findings From IEA’s Trends in International Mathematics and Science Study at the Fourth and Eighth Grades, exhibit 6.4. Chestnut Hill, MA: TIMSS & PIRLS International Study Center, Boston College.
Figure 19. Percentage of fourth-grade and eighth-grade students whose teachers reported that they participated in various professional development activities in science in the 2 years prior to assessment, by country: 2007
Assessment
0 20 40 60 80 100Percent
Improving students’ critical thinking or problem-solving skills
0 20 40 60 80 100Percent
Pedagogy/Instruction
0 20 40 60 80 100Percent
Country Content
0 20 40 60 80 100Percent
—— —
Country
— —
3266
36
1624
3774
5863
3973
4282
4175
21
1028
4564
6272
4484
2964
4249
25
121011
14
4149
4763
3673
3665
15
615
1540
5254
2357
6124
Eighth gradeFourth grade
United States1,2
Scotland1
England1
Germany
Italy
Japan
RussianFederation
United States1,2
Scotland1
England1
Germany
Italy
Japan
RussianFederation
54 INDICATOrS PArT III: CONTExT FOr LEArNING
G-8 Countries Included: Canada, Germany, Italy, Japan, Russian Federation, United Kingdom, United States
SCHOOL pRInCIpALS’ USES Of SUMMAtIvE ACHIEvEMEnt DAtA
In 2006, at least 90 percent of students in Canada, the United Kingdom, the United States, and the Russian Federation had principals who reported that school achievement data were tracked over time by an administrative authority.
Using data from the 2006 Program for International Student Assessment (PISA 2006), this indicator presents school principals’ reports of ways in which summative achievement data (i.e., not student-level data) were used in their schools. Principals of 15-year-old students were given a list of five possible ways that school achievement data could be used and asked whether each one was used.
In 2006, at least 90 percent of 15-year-old students in the United States and the United Kingdom had principals who reported that school achievement data were posted publicly (e.g., in the media) (figure 20). This compares to 75 percent of students in the russian Federation, 64 percent in Canada, and 33 percent in Italy. In Germany and Japan, 14 and 11 percent of students, respectively, had principals who reported that school achievement data were posted publicly.
About 90 percent of students in the russian Federation and the United Kingdom had principals who reported that school achieve-ment data were used in evaluation of the principal’s performance. The corresponding percentages were lower in all other G-8 countries reporting data,23 with the United States at 57 percent and the other G-8 countries ranging from 10 percent (Japan) to 22 percent (Canada).
The percentage of students with principals who reported that school achievement data were used in evaluation of teachers’ performance
was highest in the russian Federation (100 percent) followed by the United Kingdom (94 percent). The corresponding percentages were lower in all other reporting G-8 countries, with the United States at 42 percent and the other G-8 countries ranging from 19 percent (Canada) to 28 percent (Germany).
A greater percentage of 15-year-olds in the United States than in all other reporting G-8 countries had principals who reported that school achievement data were used in decisions about instructional resource allocation to the school. In the United States, 79 percent of students had principals who reported this use. In four other G-8 countries (Italy, Canada, the United Kingdom, and the russian Federation), the corresponding percentages ranged from 54 to 66 percent. Japan and Germany had 6 and 26 percent of their students, respectively, with principals who reported this use.
At least 90 percent of students in Canada, the United Kingdom, the United States, and the russian Federation had principals who reported that school achievement data were tracked over time by an administrative authority (such as a district, state, or national education agency). Sixteen percent of students in Japan, 22 percent in Italy, and 55 percent in Germany had principals who reported this use.
In the United States, the use for school achievement data most frequently cited was tracking over time by an administrative author-ity (97 percent of students had principals reporting this), followed by posting publicly (91 percent). The use for school achievement data least frequently cited in the United States was the evaluation of teachers’ performance (42 percent).
Definitions and Methodology
Data for this indicator are from the PISA 2006 school question-naire, which was designed to obtain information about a variety of school-related aspects, including school characteristics, the school’s resources, the student body, teachers in the school, pedagogical practices of the school, and administrative structures within the school. At all schools with participating 15-year-old students, a school questionnaire was administered to the principal. It should be noted that the PISA 2006 principals do not constitute representative samples of principals. rather, they are the principals for nationally representative samples of 15-year-old students. Thus,
the school data presented in this indicator were analyzed at the student level.
In PISA, “15-year-olds” refers to students between 15 years and 3 months to 16 years and 2 months old at the time of the assessment and who have completed at least 6 years of formal schooling.
As stated in the school questionnaire, achievement data include aggregated school or grade-level test scores or grades, or graduation rates.
23 Data for France have been withdrawn at the request of the country and thus are not shown in this indicator.

Indicator
INDICATOrS PArT III: CONTExT FOr LEArNING 55
20
1 The United Kingdom includes England, Northern Ireland, Scotland, and Wales.NOTE: Data for France have been withdrawn at the request of the country and thus are not shown here. SOURCE: Organization for Economic Cooperation and Development (OECD). (2007). PISA 2006: Science Competencies for Tomorrow’s World, Volume 2: Data, table 5.8. Paris: Author.
Figure 20. Percentage of 15-year-old students whose principals reported that they used summative achievement data in various ways, by country: 2006
Tracked over time by an administrative authority
0 20 40 60 80 100Percent
Used in decisions about instructional resource allocation to the school
0 20 40 60 80 100Percent
Used in evaluation of teachers’ performance
0 20 40 60 80 100Percent
Used in evaluation of principal’s performance
0 20 40 60 80 100Percent
United States
UnitedKingdom1
Canada
Germany
Italy
JapanRussian
Federation
Country Posted publicly
0 20 40 60 80 100Percent
64
14
33
11
75
93
91
22
19
21
10
89
91
57
United States
UnitedKingdom1
Canada
Germany
Italy
JapanRussian
Federation
Country
100
19
28
25
26
94
42
57
26
54
6
66
63
79
United States
UnitedKingdom1
Canada
Germany
Italy
JapanRussian
Federation
Country
91
55
22
16
100
92
97

56 INDICATOrS PArT III: CONTExT FOr LEArNING
G-8 Countries Included: England, Italy, Japan, Russian Federation, Scotland, United States
fREqUEnCy AnD SEvERIty Of BEHAvIOR pROBLEMS
In 2007, about 39 percent of U.S. eighth-graders had principals who reported at least a weekly occurrence of intimidation or verbal abuse of other students, which is higher than in all other participating G-8 countries.
Using eighth-grade data from the 2007 Trends in International Mathematics and Science Study (TIMSS 2007), this indicator presents school principals’ reports of both the incidence of behaviors that threaten a safe and orderly environment and their perceptions of these behaviors as a “serious” problem. It should be noted that what constitutes a “serious” problem may differ from one country to another. A relatively low number of threatening behaviors may be perceived as a “serious” problem in one country, but not in another, because of cultural differences and other factors.
Of the seven problem behaviors shown in figure 21a, classroom disturbance was the most frequently cited in the United States. Across the participating G-8 countries,24 the percentage of eighth-graders whose principals reported at least a weekly occurrence of a classroom disturbance ranged from 8 percent in Japan to 60 percent in Scotland, with the United States at 55 percent. The U.S. percentage was higher than in the russian Federation and Japan but not measurably different from that in the other participating G-8 countries. The U.S. percentage for classroom disturbance in 2007 was lower than in 1999, when 69 percent of U.S. eighth-graders were in schools whose principals reported at least a weekly occurrence of a classroom disturbance (see indicator 14 in Sherman, Honegger, and McGivern 2003).
In 2007, intimidation or verbal abuse of other students was cited second most frequently in the United States. The percentage of eighth-graders in schools whose principals reported at least a weekly occurrence of intimidation or verbal abuse of other students ranged from 1 percent in the russian Federation to 39 percent in the United States, with the U.S. percentage higher than in all other participating G-8 countries.
In Japan, compared with other participating G-8 countries, relatively low percentages of eighth-graders had principals who reported problem behaviors occurring at least weekly, with a range from 1 percent for both cheating and theft to 8 percent for classroom disturbance. There were lower percentages of students in Japan than in England, Italy, Scotland, and the United States whose principals reported that classroom disturbances and intimidation or verbal abuse of other students occurred at least weekly.
Figure 21b shown principals’ perceptions of these behaviors as a “serious” problem. In the United States in 2007, intimidation or verbal abuse of other students was cited most frequently as a serious prob-lem (26 percent), followed by classroom disturbance (17 percent).25 The percentage of U.S. eighth-graders whose principals reported intimidation or verbal abuse of other students as a serious problem was about 10 percentage points higher in 2007 than in 1999 (see indicator 14 in Sherman, Honegger, and McGivern 2003).
In 2007, the percentages of eighth-graders in Japan whose principals reported the problem behaviors as serious problems ranged from 24 percent for cheating to 39 percent for intimidation or verbal abuse of other students. No particular behavior was cited most frequently as a serious problem in Japan (i.e., no measurable differences at the high end of the range).
In Italy, the percentages of eighth-graders whose principals reported the problem behaviors as serious problems ranged from 8 percent for cheating to 31 percent for classroom disturbance. Classroom disturbance was cited more frequently as a serious problem in Italy than all other behaviors except intimidation or verbal abuse of other students (there was no measurable difference in reports of these two behaviors as serious problems).
In England, the russian Federation, and Scotland, the percentages of eighth-graders whose principals reported the problem behaviors as serious problems were no higher than 8 percent for all of the behaviors.
Definitions and Methodology
Data for this indicator are from the TIMSS 2007 eighth-grade school questionnaire, which asked school principals of the eighth-graders tested to provide information about curricular and instructional arrangements, school resources, and school climate. It should be noted that the TIMSS 2007 school principals do not constitute representative samples of school principals. rather, they are the school principals for nationally representative samples of eighth-grade students. Thus, the school data presented in this indicator were analyzed at the student level. Countries were required to sample students in the grade that corresponded to the end of 8 years of formal schooling (the end of lower secondary education), providing that the mean age at the time of testing was at least 13.5 years.
As the data for this indicator, school principals were asked the following questions on the eighth-grade school questionnaire: “How often does each of the following problem behaviors occur among eighth-grade students in your school? If the behavior occurs,
how severe a problem does it present?” The behaviors specified in the question were as follows: arriving late at school; absenteeism (i.e., unjustified absences); skipping class hours/periods; violating dress code; classroom disturbance; cheating; profanity; vandalism; theft; intimidation or verbal abuse of other students; physical injury to other students; intimidation or verbal abuse of teachers or staff; and physical injury to teachers or staff. The results for seven of these problem behaviors are presented in this indicator. response options for frequency included “never,” “rarely,” “monthly,” “weekly,” and “daily.” For this analysis, the latter two categories were combined. response options for the severity of the problem included “not a problem,” “minor problem,” and “serious problem.” For the reports of a behavior as a serious problem, the denominator for the percentages is students at all schools, not just students at schools whose principals report the occurrence of the behavior at least weekly.
24 Although Germany participated in TIMSS 2007 at the fourth grade, it did not participate at the eighth grade. Therefore, there are no data to report for Germany in this indicator.25 For the reports of a behavior as a serious problem, the percentages are based on students at all schools, not just students at schools whose principals report the occurrence of the behavior at least weekly.

Indicator
INDICATOrS PArT III: CONTExT FOr LEArNING 57
21
# Rounds to zero.1 Met international guidelines for participation rates only after substitute schools were included. That is, to avoid sample size losses resulting from sampled schools not participating, a mechanism was instituted to identify, a priori, substitute schools that have similar characteristics to the sampled schools that they may replace. 2 Data for cheating are available for at least 70 percent, but less than 85 percent, of the students. Missing data have not been explicitly accounted for in the data.3 National Defined Population covers 90 percent to 95 percent of National Target Population.SOURCE: International Association for the Evaluation of Educational Achievement (IEA), Trends in International Mathematics and Science Study (TIMSS), 2007.
# Rounds to zero.1 Met international guidelines for participation rates only after substitute schools were included. That is, to avoid sample size losses resulting from sampled schools not participating, a mechanism was instituted to identify, a priori, substitute schools that have similar characteristics to the sampled schools that they may replace. 2 Data for cheating, vandalism, theft, and intimidation or verbal abuse of teachers or staff are available for at least 70 percent, but less than 85 percent, of the students. Missing data have not been explicitly accounted for in the data.3 Data are available for at least 70 percent, but less than 85 percent, of the students. Missing data have not been explicitly accounted for in the data.4 National Defined Population covers 90 percent to 95 percent of National Target Population.SOURCE: International Association for the Evaluation of Educational Achievement (IEA), Trends in International Mathematics and Science Study (TIMSS), 2007.
Figure 21a. Percentage of eighth-grade students whose principals reported that behavior threatening a safe and orderly environment occurs at least weekly, by selected behavior and country: 2007
Figure 21b. Percentage of eighth-grade students whose principals reported that behavior threatening a safe and orderly environment is a serious problem, by selected behavior and country: 2007
54
#
83 5
23
8
46
20
51
5
20
28
17
1 3 5 4
1419
# # # 1 #
60
25
2 3
23
6
55
107 6 5
39
5
0
20
40
60
80
100
England1
Country
Percent
Italy Japan Russian Federation
Scotland1,2 UnitedStates1,3
Indimidation or verbalabuse of teachers or staff
Intimidation or verbalabuse of other students
Physical injury to other students
TheftVandalismCheatingClassroomdisturbance
8
1 3 2 5 7 4
31
8
1912
1623
10
35
24
3631
37 3933
7 71 2 4 3 #
7
# 1 # # 23
17
3 21 7
26
40
20
40
60
80
100
England1
Country
Percent
Italy Japan Russian Federation
Scotland1,2 UnitedStates1,3,4
Indimidation or verbalabuse of teachers or staff
Intimidation or verbalabuse of other students
Physical injury to other students
TheftVandalismCheatingClassroomdisturbance


indicators part iVindicators part iVExpenditure for Education

60 INDICATOrS PArT IV: ExPENDITUrE FOr EDUCATION
pUBLIC SCHOOL tEACHERS’ StARtInG SALARIES
Of the G-8 countries reporting data in 2006, Germany reported the highest average starting salary of public school teachers at both the primary and upper secondary levels, followed by the United States.
This indicator presents a cross-country comparison of the aver-age annual salaries of full-time public school teachers with the minimum training necessary to be fully qualified at the beginning of their teaching careers. Comparisons are presented across two education levels: primary and upper secondary. The indicator also compares the ratio of these average starting salaries to the gross domestic product (GDP) per capita for each of the reporting countries.
Of the G-8 countries reporting data in 2006, Germany reported the highest average starting salary of public school teachers at both the primary and upper secondary levels (primary: $40,300; upper secondary: $45,200) (figure 22). The United States paid the second highest average starting salary to public school teachers at both levels (primary: $34,900; upper secondary: $33,700). France reported the lowest average starting salary at both levels (primary: $23,300; upper secondary: $26,000). In most G-8 countries in 2006, public school teachers at the beginning of their careers earned less than the average GDP per capita in their respective countries (table 6). For example, in the United States, the GDP per capita was about $43,800, and the average starting salary of such teachers was about 80 percent of the U.S. GDP per capita. In Germany, however, public primary and upper secondary school teachers at the beginning of their careers earned 126 and 141 percent, respectively, of the German GDP per capita.
G-8 Countries Included: England, France, Germany, Italy, Japan, Scotland, United States
Definitions and Methodology
Teacher salary data are from the 2007 OECD Indicators of National Education Systems (INES) Survey on Teachers and the Curriculum and refer to the school year 2005–06. Data for GDP per capita are for calendar year 2006. Dollar figures for teacher salaries and GDP per capita were converted to U.S. equivalent dollars using purchasing power parities (PPPs), which equalize the purchasing power of differ-ent currencies. PPP exchange rate data are from the 2005–06 OECD National Accounts Database (OECD 2008b). Using PPPs to convert all teacher salary data to US equivalent dollars allows for cost of living differences across countries to be taken into account.
Salaries refer to scheduled salaries according to official pay scales, and are defined as before-tax, or gross, salaries (the total sum paid by the employer for the labor supplied), excluding the employer’s contribution to social security and pension (according to existing salary scales). International comparisons of salaries provide simplified illustrations of the compensation received by teachers for their work. They provide a snapshot of the systems of compensation and the welfare inferences that can be made. Differences by country in taxation and social benefit systems as well as the use of financial
incentives (including regional allowances for teaching in remote regions, family allowances, reduced rates on public transport, tax allowances on purchases of cultural goods, and other entitlements that contribute to a teacher’s basic income) make it important to exercise caution in interpreting comparisons of teachers’ salaries.
Countries with centralized systems of education typically have national salary schedules. In countries like the United States, with decentralized education systems, local or regional governments establish their own salary schedules. The national averages shown here do not represent the within-country variation that exists in teacher salaries.
The minimum training necessary to be fully qualified varies by country. In the United States, teacher training is decentralized and varies by state.
As shown in the figure and table, education levels are defined according to the International Standard Classification of Educa-tion (ISCED97). For more information on the ISCED97 levels, see appendix A.

Indicator
INDICATOrS PArT IV: ExPENDITUrE FOr EDUCATION 61
22
NOTE: Average starting salary refers to the average scheduled annual salary of a full-time teacher with the minimum training necessary to be fully qualified at the beginning of the teaching career. Education levels are defined according to the International Standard Classification of Education (ISCED97). Primary education refers to ISCED97 level 1. Upper secondary education refers to ISCED97 level 3. For more information on the ISCED97 levels, see appendix A in this report. Average salaries are gross salaries (i.e., before deductions for income taxes) for school year 2005–06 and are converted to U.S. dollars using 2006 national purchasing power parities (PPPs) exchange rate data. SOURCE: Organization for Economic Cooperation and Development (OECD). (2008). Education at a Glance: OECD Indicators 2008, table D3.1. Paris: Author.
Figure 22. Public school teachers’ average starting salaries in U.S. dollars converted using purchasing power parities (PPPs), by education level and country: 2006
UnitedStates
Scotland
Japan
Italy
Germany
France
England
5,000 10,000 15,000 20,000 25,000 30,000 35,000 40,000 45,000 50,000
34,90033,700
29,50029,500
26,30026,300
24,20026,100
40,30045,200
23,30026,000
29,500$29,500
$0
Country
Average salary
Upper secondary educationPrimary education
Table 6. Public school teachers’ average starting salaries in U.S. dollars converted using purchasing power parities (PPPs) expressed as a ratio of gross domestic product (GDP) per capita in U.S. dollars, by education level and country: 2006
Average starting salary expressed as a ratio of GDP per capita
Country Primary Upper secondary GDP per capita
England1 0.89 0.89 $32,990France 0.75 0.84 31,048Germany 1.26 1.41 31,950Italy 0.84 0.90 28,866Japan 0.82 0.82 31,919Scotland1 0.89 0.89 32,990United States 0.80 0.77 43,801
1 Data on GDP per capita refer to the United Kingdom. NOTE: Average starting salary refers to the average scheduled annual salary of a full-time teacher with the minimum training necessary to be fully qualified at the beginning of the teaching career. Education levels are defined according to the International Standard Classification of Education (ISCED97). Primary education refers to ISCED97 level 1. Upper secondary education refers to ISCED97 level 3. For more information on the ISCED97 levels, see appendix A in this report. Average salaries are gross salaries (i.e., before deductions for income taxes) for school year 2005–06 and are converted to U.S. dollars using 2006 national purchasing power parities (PPPs) exchange rate data. GDP per capita in national currencies (2006) has been calculated from total population and total GDP, and has been converted to U.S. dollars using PPPs for GDP. SOURCE: Organization for Economic Cooperation and Development (OECD). (2008). Education at a Glance: OECD Indicators 2008, table D3.1 and web table X2.3b. Paris: Author. Retrieved September 22, 2008, from http://www.oecd.org/dataoecd/8/24/41271802.pdf.

62 INDICATOrS PArT IV: ExPENDITUrE FOr EDUCATION
G-8 Countries Included: France, Germany, Italy, Japan, United Kingdom, United States
ExpEnDItURE fOR EDUCAtIOn
In 2005, the United States ranked the highest among the reporting G-8 countries in terms of expenditure per student at the combined primary and secondary education levels as well as at the higher education level.
In this indicator, two measures are used to compare countries’ investment in education: (1) expenditure per student (expressed in absolute terms) from both public and private sources and (2) total expenditure as a percentage of gross domestic product (GDP). The latter measure allows a comparison of countries’ expenditure rela-tive to their presumed ability to financially support education.
In 2005, expenditure per student for the United States was about $9,800 at the combined primary and secondary education levels and about $24,400 at the higher education level (figure 23a). Both figures were higher than those in the five other G-8 countries reporting data, which ranged from about $6,900 in Germany and the United Kingdom to $7,500 in France at the combined primary and secondary levels and from about $8,000 in Italy to $13,500 in the United Kingdom at the higher education level.
In 2005, all the countries spent more money (i.e., in total dollars as a percentage of GDP) at the combined primary and secondary educa-tion levels than at the higher education level, where the student enrollment is much lower (figure 23b). France spent 4.0 percent of its GDP on primary and secondary education, higher than the percentage of GDP spent on education at this level than all other reporting G-8 countries. The United States spent 3.8 percent of its GDP on primary and secondary education, higher than the share of GDP spent on education at this level in Italy and Germany (both 3.2 percent) and Japan (2.9 percent). At the higher education level, the United States spent 2.9 percent of its GDP on education. This is higher than the percentage of GDP spent on education at this level than all other reporting G-8 countries, which ranged from 0.9 percent in Italy to 1.4 percent in Japan.
Overall, the United States spent a higher percentage of its GDP on education (6.7 percent) than all other reporting G-8 countries.
Definitions and Methodology
Per student expenditure is based on public and private full-time-equivalent (FTE) enrollment figures for the 2004-05 school year and current expenditure and capital outlays from both public and private sources, where data are available. Data for GDP per capita are for calendar year 2005. Dollar figures for education expenditure and GDP per capita were converted to U.S. equivalent dollars using purchasing power parities (PPPs), which equalize the purchasing power of different currencies. Using PPPs to convert all education expenditure data to US equivalent dollars allows for cost of living differences across countries to be taken into account. Within-
country consumer price indices are used to adjust the PPP indices to account for inflation because the fiscal year has a different starting date in different countries.
The national averages shown here do not represent the within-country variation that may exist in the annual education expenditure per student.
As shown in the figures, education levels are defined according to the International Standard Classification of Education (ISCED97). For more information on the ISCED97 levels, see appendix A.
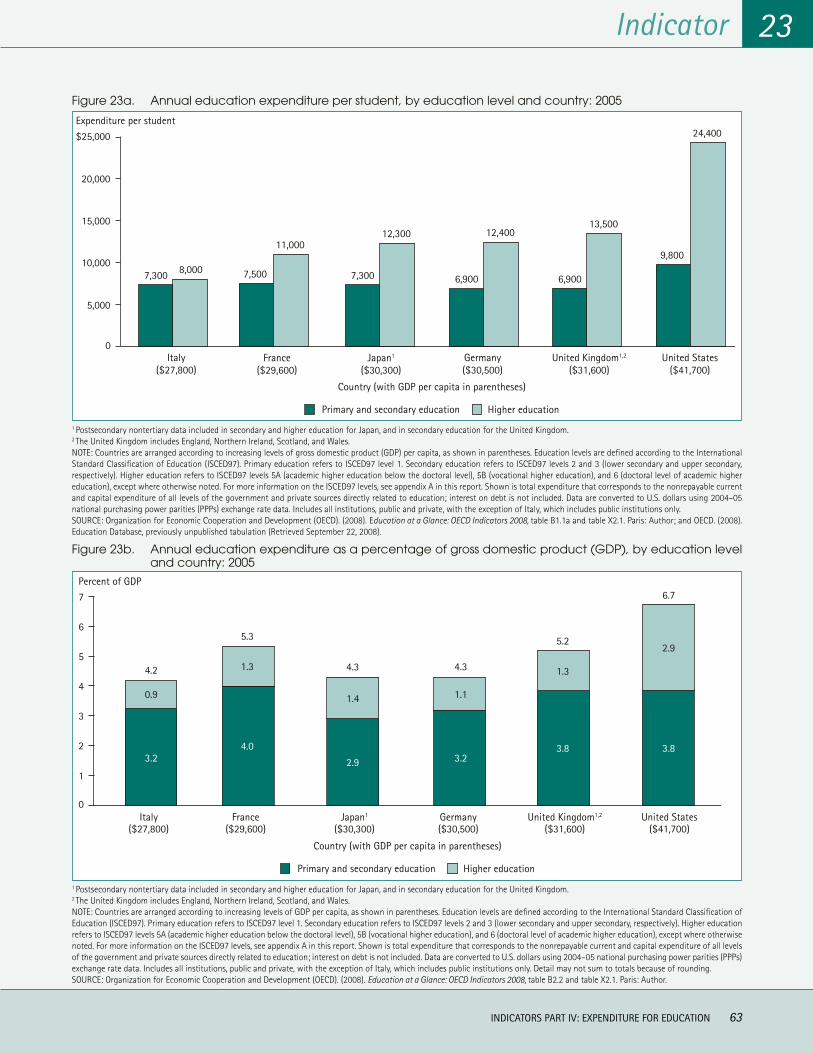
Indicator
INDICATOrS PArT IV: ExPENDITUrE FOr EDUCATION 63
23
1 Postsecondary nontertiary data included in secondary and higher education for Japan, and in secondary education for the United Kingdom.2 The United Kingdom includes England, Northern Ireland, Scotland, and Wales.NOTE: Countries are arranged according to increasing levels of gross domestic product (GDP) per capita, as shown in parentheses. Education levels are defined according to the International Standard Classification of Education (ISCED97). Primary education refers to ISCED97 level 1. Secondary education refers to ISCED97 levels 2 and 3 (lower secondary and upper secondary, respectively). Higher education refers to ISCED97 levels 5A (academic higher education below the doctoral level), 5B (vocational higher education), and 6 (doctoral level of academic higher education), except where otherwise noted. For more information on the ISCED97 levels, see appendix A in this report. Shown is total expenditure that corresponds to the nonrepayable current and capital expenditure of all levels of the government and private sources directly related to education; interest on debt is not included. Data are converted to U.S. dollars using 2004–05 national purchasing power parities (PPPs) exchange rate data. Includes all institutions, public and private, with the exception of Italy, which includes public institutions only.SOURCE: Organization for Economic Cooperation and Development (OECD). (2008). Education at a Glance: OECD Indicators 2008, table B1.1a and table X2.1. Paris: Author; and OECD. (2008). Education Database, previously unpublished tabulation (Retrieved September 22, 2008).
Figure 23a. Annual education expenditure per student, by education level and country: 2005
7,300
12,300
6,900
12,400
6,900
13,500
9,800
24,400
0
5,000
10,000
15,000
20,000
$25,000
Country (with GDP per capita in parentheses)
Expenditure per student
Japan1
($30,300)Germany($30,500)
United Kingdom1,2
($31,600)United States
($41,700)
Higher educationPrimary and secondary education
7,500
11,000
France($29,600)
7,300 8,000
Italy($27,800)
1 Postsecondary nontertiary data included in secondary and higher education for Japan, and in secondary education for the United Kingdom.2 The United Kingdom includes England, Northern Ireland, Scotland, and Wales.NOTE: Countries are arranged according to increasing levels of GDP per capita, as shown in parentheses. Education levels are defined according to the International Standard Classification of Education (ISCED97). Primary education refers to ISCED97 level 1. Secondary education refers to ISCED97 levels 2 and 3 (lower secondary and upper secondary, respectively). Higher education refers to ISCED97 levels 5A (academic higher education below the doctoral level), 5B (vocational higher education), and 6 (doctoral level of academic higher education), except where otherwise noted. For more information on the ISCED97 levels, see appendix A in this report. Shown is total expenditure that corresponds to the nonrepayable current and capital expenditure of all levels of the government and private sources directly related to education; interest on debt is not included. Data are converted to U.S. dollars using 2004–05 national purchasing power parities (PPPs) exchange rate data. Includes all institutions, public and private, with the exception of Italy, which includes public institutions only. Detail may not sum to totals because of rounding.SOURCE: Organization for Economic Cooperation and Development (OECD). (2008). Education at a Glance: OECD Indicators 2008, table B2.2 and table X2.1. Paris: Author.
Figure 23b. Annual education expenditure as a percentage of gross domestic product (GDP), by education level and country: 2005
0
1
2
3
4
5
6
7
2.9
1.4
4.3
3.8
1.3
5.2
3.8
2.9
6.7
Country (with GDP per capita in parentheses)
Higher educationPrimary and secondary education
Percent of GDP
Japan1
($30,300)Germany($30,500)
United Kingdom1,2
($31,600)United States
($41,700)
3.2
1.1
4.3
4.0
1.3
5.3
France($29,600)
4.2
Italy($27,800)
3.2
0.9


indicators part Vindicators part VEducation Returns:
Educational Attainment and Income
66 INDICATOrS PArT V: EDUCATION rETUrNS: EDUCATIONAL ATTAINMENT AND INCOME
G-8 Countries Included: Canada, France, Germany, Italy, Japan, Russian Federation, United Kingdom, United States
EDUCAtIOnAL AttAInMEnt In tHE ADULt pOpULAtIOn
In 2006, the Russian Federation had the largest percentage of adults ages 25 to 64 who had completed higher education; Italy had the smallest percentage. Among 25- to 34-year-olds, more females than males had completed higher education in every G-8 country except Germany, where there was no difference.
This indicator compares the highest levels of education attained by 25- to 64-year-olds in 2006 and also examines rates of young adult (ages 25 to 34) completion of higher education by sex.
results for 25- to 64-year-olds were analyzed at three levels of educational attainment: lower secondary education or below, upper secondary education,26 and higher education. Italy was the only G-8 country in which the largest percentage (48 percent) of 25- to 64-year-olds had completed lower secondary education or below as their highest level of educational attainment (figure 24a). In half of the G-8 countries (France, Germany, the United Kingdom, and the United States), the largest percentage of 25- to 64-year-olds had completed upper secondary education as their highest level of education. In the russian Federation and Canada, the largest percentage of 25- to 64-year-olds had completed higher education (54 and 47 percent, respectively). In all G-8 countries except the russian Federation, less than half of 25- to 64-year-olds had completed higher education, with percentages ranging from 13 percent in Italy to 47 percent in Canada. In the United States, 39 percent of 25- to 64-year-olds had completed higher education.
Compared to 25- to 64-year-olds, larger percentages of the subgroup of young adults (ages 25 to 34) had completed higher education in most of the G-8 countries. For example, in Canada
and Japan, more than half of 25- to 34-year-olds had completed higher education, compared with 47 and 40 percent, respectively, of 25- to 64-year-olds (figures 24a and 24b). In France, 41 percent of 25- to 34-year-olds had completed higher education, compared with 26 percent of 25- to 64-year-olds. In the United States, both age groups had the same percentage of higher education comple-tion in 2006 (39 percent).
In the United States, more bachelor’s degrees have been awarded to women than to men since about the early 1980s (U.S. Department of Education 2008). Among 25- to 34-year-olds in the United States in 2006, about 36 percent of males and 43 percent of females had completed higher education (figure 24b). More 25- to 34-year-old females than males had completed higher education in every G-8 country except Germany, where there was no measurable differ-ence. The largest differences by sex were reported in Canada, the russian Federation, and France (14, 12, and 10 percentage points, respectively).
Among 25- to 34-year-olds in the G-8 countries, differences favoring females in higher education completion were generally more consistent and pronounced in 2006 compared to 5 years prior. For example, in 2001, slightly more 25- to 34-year-old males than females in the United Kingdom and Germany had completed higher education (a difference of 1 and 3 percentage points, respectively) (OECD 2003). In 2001, higher education completion in Italy, Japan, and France differed in favor of females by 3 to 5 percentage points; in 2006, these differences ranged from 6 to 10 percentage points (figure 24b).
Definitions and Methodology
As shown in the figures, education levels are defined according to the International Standard Classification of Education (ISCED97). For more information on the ISCED97 levels, see appendix A.
Male-female percentage-point differences in higher education completion presented in the text were computed from unrounded numbers; therefore, they may differ from computations made using the rounded whole numbers that appear in figure 24b.
26 In this indicator, the category of “upper secondary education” also includes postsecondary nontertiary programs. See figure 24a and appendix A for more information on education levels.
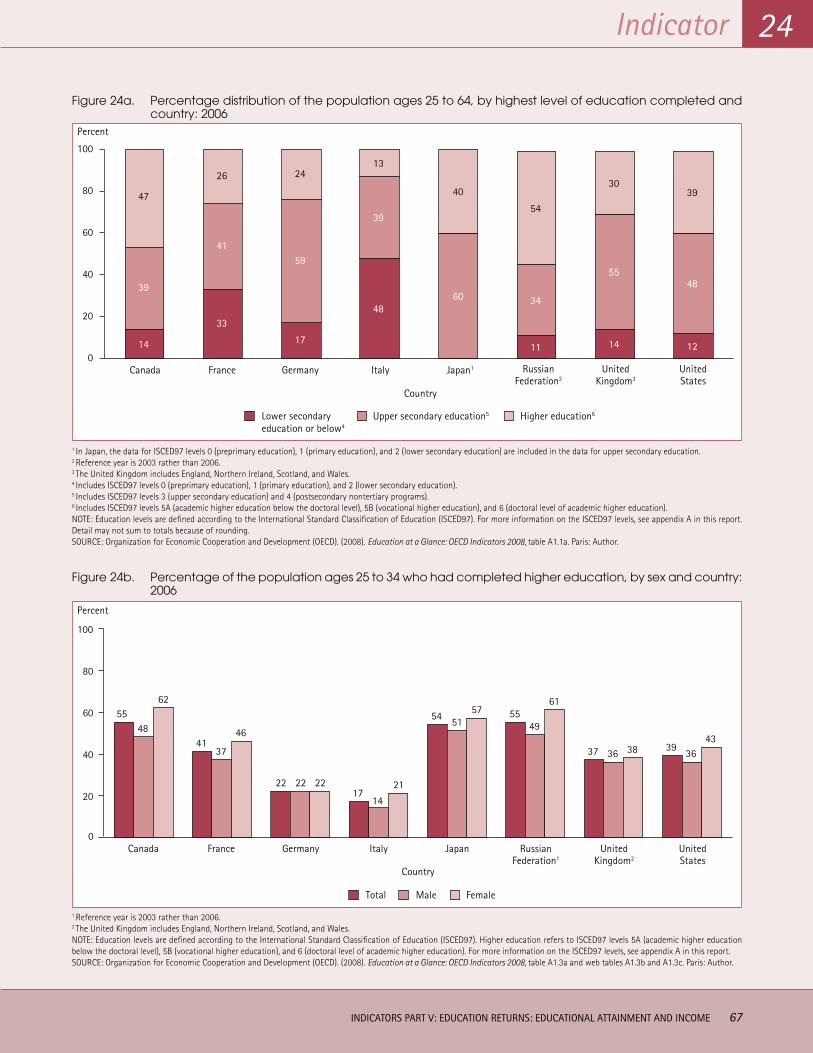
Indicator
INDICATOrS PArT V: EDUCATION rETUrNS: EDUCATIONAL ATTAINMENT AND INCOME 67
24
1 In Japan, the data for ISCED97 levels 0 (preprimary education), 1 (primary education), and 2 (lower secondary education) are included in the data for upper secondary education. 2 Reference year is 2003 rather than 2006. 3 The United Kingdom includes England, Northern Ireland, Scotland, and Wales.4 Includes ISCED97 levels 0 (preprimary education), 1 (primary education), and 2 (lower secondary education). 5 Includes ISCED97 levels 3 (upper secondary education) and 4 (postsecondary nontertiary programs). 6 Includes ISCED97 levels 5A (academic higher education below the doctoral level), 5B (vocational higher education), and 6 (doctoral level of academic higher education).NOTE: Education levels are defined according to the International Standard Classification of Education (ISCED97). For more information on the ISCED97 levels, see appendix A in this report. Detail may not sum to totals because of rounding. SOURCE: Organization for Economic Cooperation and Development (OECD). (2008). Education at a Glance: OECD Indicators 2008, table A1.1a. Paris: Author.
Figure 24a. Percentage distribution of the population ages 25 to 64, by highest level of education completed and country: 2006
14
39
47
33
41
26
17
59
24
48
39
13
60
40
11
34
54
14
55
30
12
48
39
0
20
40
60
80
100
Canada France
Country
Percent
Germany Italy Japan1 RussianFederation2
UnitedKingdom3
UnitedStates
Higher education6Upper secondary education5Lower secondaryeducation or below4
1 Reference year is 2003 rather than 2006. 2 The United Kingdom includes England, Northern Ireland, Scotland, and Wales. NOTE: Education levels are defined according to the International Standard Classification of Education (ISCED97). Higher education refers to ISCED97 levels 5A (academic higher education below the doctoral level), 5B (vocational higher education), and 6 (doctoral level of academic higher education). For more information on the ISCED97 levels, see appendix A in this report. SOURCE: Organization for Economic Cooperation and Development (OECD). (2008). Education at a Glance: OECD Indicators 2008, table A1.3a and web tables A1.3b and A1.3c. Paris: Author.
Figure 24b. Percentage of the population ages 25 to 34 who had completed higher education, by sex and country: 2006
0
20
40
60
80
100
5548
62
4137
46
22 22 2217
14
21
54 5157 55
49
61
37 36 38 3936
43
Canada France
Percent
Germany Italy Japan RussianFederation1
UnitedKingdom2
UnitedStates
Country
FemaleMaleTotal

68 INDICATOrS PArT V: EDUCATION rETUrNS: EDUCATIONAL ATTAINMENT AND INCOME
G-8 Countries Included: Canada, France, Germany, Italy, Japan, Russian Federation, United Kingdom, United States
fIRSt UnIvERSIty DEGREES By fIELD Of StUDy
In 2006, the United States awarded among the lowest percent-ages of first university degrees in science, mathematics, and engineering-related fields of all the G-8 countries.
Programs that prepare students for advanced research and highly qualified professions are called first university degree programs. First university degree programs vary in duration in different countries in different programs of study. In the United States, this corresponds to a bachelor’s degree but excludes associate’s degrees. This indicator compares the percentage of first degrees awarded in four major fields of study: social sciences, business, and law; science, mathematics, and engineering; the arts and humanities; and education.
In 2006, a greater percentage of first university degrees were awarded in the field of social sciences, business, and law than in any other field in all G-8 countries (figure 25). The russian Federation awarded the highest percentage of first university degrees in this combined field (50 percent), which exceeded that awarded in the other major fields in total—arts and humanities; science, mathemat-ics, and engineering; and education (41 percent). In the other G-8 countries, the percentage of first university degrees awarded in the combined field of social sciences, business, and law ranged from 28 percent in Germany to 42 percent in the United States.
In science, mathematics, and engineering-related fields, the United States awarded among the lowest percentages of first university
degrees of all the G-8 countries. Sixteen percent of first university degrees in the United States and 17 percent of first university degrees in Canada were awarded in science, mathematics, and engineering-related fields. In the other G-8 countries, the percent-ages ranged from 20 percent in Japan to 27 percent in Germany.
The United States was the only G-8 country to award more first university degrees in the arts and humanities than in science, mathematics, and engineering. In 2006, about 19 percent of first university degrees were awarded to U.S. graduates in arts and humanities (compared to 16 percent in science, mathematics, and engineering). The russian Federation awarded the lowest percent-age of first university degrees in the arts and humanities (4 percent); in the other G-8 countries, the percentages ranged from 15 percent in Canada and Italy to 22 percent in Germany.
The smallest percentage of first university degrees was awarded in the field of education in all G-8 countries except the russian Federation. The russian Federation was the only G-8 country to award more first university degrees in education than in the arts and humanities (12 vs. 4 percent). Canada awarded the highest percentage of first university degrees in education (13 percent), while France and the United Kingdom awarded the lowest percentages in this field (both at 4 percent). The United States fell within this range, awarding 7 percent of first university degrees in education.
Definitions and Methodology
The percentage of first university degrees awarded in each of the fields shown is the share of these degrees awarded in each field relative to all first university degrees awarded in all fields for a given year.
The fields of study shown follow the 1997 revision of the Interna-tional Standard Classification of Education Major Field of Study (ISCED97 MFS) (UNESCO 1997). The social sciences, business, and law combined field of study includes social and behavioral sciences (ISCED97 31), journalism and information (ISCED97 32), business and administration (ISCED97 34), and law (ISCED97 38). The science, mathematics, and engineering combined field of study includes life sciences (ISCED97 42), physical sciences (ISCED97 44), mathematics and statistics (ISCED97 46), computing (ISCED97 48), engineering and engineering trades (ISCED97 52), manufacturing and processing
(ISCED97 54), and architecture and building (ISCED97 58). The arts and humanities combined field of study includes arts (ISCED97 21) and humanities (ISCED97 22). The education combined field of study includes teacher training (ISCED97 141) and education science (ISCED97 142). “Other” fields of study include agriculture, forestry, and fishery (ISCED97 62); veterinary (ISCED97 64); health (ISCED97 72); social services (ISCED97 76); personal services (ISCED97 81); transport services (ISCED97 84); environmental protection (ISCED97 85); security services (ISCED97 86); and fields of study not known or unspecified. For more information on the ISCED97 levels, see appendix A in this report.
The summations presented in the text were carried out using unrounded numbers; therefore, they may differ from summations made using the rounded numbers that appear in figure 25.

Indicator
INDICATOrS PArT V: EDUCATION rETUrNS: EDUCATIONAL ATTAINMENT AND INCOME 69
25
1 The United Kingdom includes England, Northern Ireland, Scotland, and Wales.2 Includes social and behavioral sciences (ISCED97 31), journalism and information (ISCED97 32), business and administration (ISCED97 34), and law (ISCED97 38).3 Includes life sciences (ISCED97 42), physical sciences (ISCED97 44), mathematics and statistics (ISCED97 46), computing (ISCED97 48), engineering and engineering trades (ISCED97 52), manufacturing and processing (ISCED97 54), and architecture and building (ISCED97 58).4 Includes arts (ISCED97 21) and humanities (ISCED97 22).5 Includes teacher training (ISCED97 141) and education science (ISCED97 142).6 Includes agriculture, forestry, and fishery (ISCED97 62); veterinary (ISCED97 64); health (ISCED97 72); social services (ISCED97 76); personal services (ISCED97 81); transport services (ISCED97 84); environmental protection (ISCED97 85); security services (ISCED97 86); and fields of study not known or unspecified.NOTE: The fields of education shown follow the 1997 revision of the International Standard Classification of Education Major Field of Study (ISCED97 MFS) (UNESCO 1997). Programs that prepare students for advanced research and highly qualified professions are classified as first university degree programs, which correspond to ISCED97 level 5A. For more information on the ISCED97 levels, see appendix A in this report. Detail may not sum to totals because of rounding.SOURCE: Organization for Economic Cooperation and Development. (2008). Education Database. Retrieved September 26, 2008, from http://stats.oecd.org/wbos/default.aspx?DatasetCode=RGRADSTY and U.S. Department of Education, National Center for Education Statistics, previously unpublished tabulations (September 2008).
Figure 25. Percentage distribution of first university degrees awarded, by field of study and country: 2006
42 16 19 15
32 25 21 18
50 24 4 9
39 20 19 16
40 23 15 17
28 27 22 12
37 26 17 16
36 17 15 13 19
United States
United Kingdom1
Japan
RussianFederation
Italy
Germany
France
Canada
1000 20 40 60 80
Country
4
5
12
6
4
7
11
Percent
Arts and humanities4 Education5 Other6Science, mathematics,and engineering3
Social sciences,business, and law2
Table 7. Number of first university degree recipients, by field of study and country: 2006
Country
Field of study
Total
Social sciences, business, and law1
Science, mathematics,
and engineering2Arts and
humanities3 Education4 Other5
Canada 64,125 30,072 26,763 22,635 33,315 176,910 France 105,725 75,006 47,592 11,036 45,879 285,238 Germany 75,736 72,815 59,650 28,130 31,266 267,597 Italy 108,047 63,539 41,513 13,589 46,763 273,451 Japan 224,327 116,480 108,553 32,646 90,846 572,852 russian Federation 572,734 281,965 49,386 138,354 109,206 1,151,645 United Kingdom6 100,387 79,734 67,329 12,292 56,192 315,934 United States 623,414 242,926 288,399 107,238 223,265 1,485,242
1 Includes social and behavioral sciences (ISCED97 31), journalism and information (ISCED97 32), business and administration (ISCED97 34), and law (ISCED97 38).2 Includes life sciences (ISCED97 42), physical sciences (ISCED97 44), mathematics and statistics (ISCED97 46), computing (ISCED97 48), engineering and engineering trades (ISCED97 52), manufacturing and processing (ISCED97 54), and architecture and building (ISCED97 58).3 Includes arts (ISCED97 21) and humanities (ISCED97 22).4 Includes teacher training (ISCED97 141) and education science (ISCED97 142).5 Includes agriculture, forestry, and fishery (ISCED97 62); veterinary (ISCED97 64); health (ISCED97 72); social services (ISCED97 76); personal services (ISCED97 81); transport services (ISCED97 84); environmental protection (ISCED97 85); security services (ISCED97 86); and fields of study not known or unspecified.6 The United Kingdom includes England, Northern Ireland, Scotland, and Wales.NOTE: The fields of education shown follow the 1997 revision of the International Standard Classification of Education Major Field of Study (ISCED97 MFS) (UNESCO 1997). Programs that prepare students for advanced research and highly qualified professions are classified as first university degree programs, which correspond to ISCED97 level 5A. For more information on the ISCED97 levels, see appendix A in this report. Detail may not sum to totals because of rounding.SOURCE: Organization for Economic Cooperation and Development. (2008). Education Database. Retrieved September 26, 2008, from http://stats.oecd.org/wbos/default.aspx?DatasetCode=RGRADSTY and U.S. Department of Education, National Center for Education Statistics, previously unpublished tabulations (September 2008).

70 INDICATOrS PArT V: EDUCATION rETUrNS: EDUCATIONAL ATTAINMENT AND INCOME
G-8 Countries Included: Canada, France, Germany, Italy, Japan, United Kingdom, United States
EMpLOyMEnt RAtES
In 2006, the United Kingdom had higher employment rates than all other reporting G-8 countries at three main levels of educational attainment. The gap in employment rates between adults whose highest educational attainment was lower secondary education or below and those who had completed academic higher education ranged from 23 percentage points in the United Kingdom and France to 31 percentage points in Germany.
In the United States and all other G-8 countries reporting data, higher employment rates were associated with higher levels of educational attainment. In all reporting countries except the United Kingdom, between 52 and 58 percent of adults ages 25 to 64 whose highest educational attainment was lower secondary education or below were employed in 2006 (figure 26a). This compares to a range from 73 to 76 percent for adults whose highest educational attain-ment was upper secondary education27 and from 81 to 86 percent for adults who had completed academic higher education, excluding the United Kingdom. For example, among U.S. adults in 2006, about 58 percent of those whose highest educational attainment was lower secondary education or below were employed, compared with 73 percent of those whose highest educational attainment was upper secondary education and 83 percent of those who had completed academic higher education. The United Kingdom had higher employment rates than all other reporting G-8 countries at all three levels of educational attainment (66, 81, and 89 percent, respectively).
The gaps in employment rates for 25- to 64-year-olds at the highest and lowest levels of educational attainment (i.e., the difference in the employment rates for academic higher education and lower secondary education or below), ranged from 23 percentage points in the United Kingdom and France to 31 percentage points in Germany (figure 26a). In the United States, the gap was 25 percentage points.
Figure 26b shows employment rates separately for males and females. In all reporting G-8 countries, males who had completed lower secondary education or below, upper secondary education, or academic higher education had higher employment rates than did
females with a comparable amount of education. For males whose highest educational attainment was lower secondary education or below, employment rates ranged from 65 percent (Germany) to 72 percent (the United Kingdom). For females, the corresponding range was 33 percent (Italy) to 61 percent (the United Kingdom). In the United States, 70 percent of males and 44 percent of females whose highest educational attainment was lower secondary education or below were employed in 2006.
For males whose highest educational attainment was upper secondary education, employment rates ranged from 78 percent (Germany) to 87 percent (Japan). For females, the corresponding range was 60 percent (Japan) to 76 percent (United Kingdom). In the United States, 80 percent of males and 67 percent of females whose highest educational attainment was upper secondary education were employed in 2006.
In all reporting G-8 countries, at least 85 percent of males who had completed academic higher education were employed in 2006. For females who had completed academic higher education, employ-ment rates ranged from 68 percent (Japan) to 87 percent (United Kingdom). In the United States, 88 percent of males and 78 percent of females who had completed academic higher education were employed in 2006.
In most of the reporting G-8 countries, the gap in employment rates between males and females was largest among adults whose highest educational attainment was lower secondary education or below and smallest among adults who had completed academic higher education. In all reporting G-8 countries except Japan, the male-female gap for lower secondary education or below was approximately two to four times the size of the gap for academic higher education. Italy had the largest male-female gap at the level of lower secondary education or below (38 percentage points). In Japan, the male-female gap was 28 percentage points among adults who had completed upper secondary education and 27 percentage points among adults who had completed academic higher educa-tion; these gaps were larger than those in all other reporting G-8 countries at these levels. In the United States, the male-female gap was 27, 13, and 10 percentage points among adults who had completed lower secondary education or below, upper secondary education, and academic higher education, respectively.
Definitions and Methodology
The employment rate of adults at a particular level of educational attainment is calculated as the number of individuals ages 25 to 64 with the particular level of educational attainment who are in employment divided by the number of individuals ages 25 to 64 with the same level of educational attainment.
As shown in the figures, education levels are defined according to the International Standard Classification of Education (ISCED97). For more information on the ISCED97 levels, see appendix A. Individuals whose highest level of education is academic higher education have completed at least a first university degree program,
which prepares students for advanced research and highly qualified professions. First university degree programs vary in duration in different countries in different programs of study. In the United States, the first university degree corresponds to a bachelor’s degree; it excludes associate’s degrees.
Percentage-point differences presented in the text were computed from unrounded numbers; therefore, they may differ from compu-tations made using the rounded whole numbers that appear in the figures.
27 In this indicator, the category of “upper secondary education” also includes postsecondary nontertiary programs. See figure 26a and appendix A for more information on education levels.

Indicator
INDICATOrS PArT V: EDUCATION rETUrNS: EDUCATIONAL ATTAINMENT AND INCOME 71
26
1 In Japan, the data for ISCED97 levels 0 (preprimary education), 1 (primary education), and 2 (lower secondary education) are included in the data for upper secondary education. 2 The United Kingdom includes England, Northern Ireland, Scotland, and Wales. 3 Includes ISCED97 levels 0 (preprimary education), 1 (primary education), and 2 (lower secondary education). 4 Includes ISCED97 levels 3 (upper secondary education) and 4 (postsecondary nontertiary programs). 5 Includes ISCED97 levels 5A (academic higher education below the doctoral level) and 6 (doctoral level of academic higher education). NOTE: Education levels are defined according to the International Standard Classification of Education (ISCED97). For more information on the ISCED97 levels, see appendix A in this report.SOURCE: Organization for Economic Cooperation and Development (OECD). (2008). Education at a Glance: OECD Indicators 2008, table A8.3a and web table A8.1b. Paris: Author (Retrieved September 22, 2008).
Figure 26a. Employment rates of adults ages 25 to 64, by highest level of education and country: 2006
0
20
40
60
80
100
57
7683
58
7681
54
73
85
52
7481
73
86
66
81
89
58
73
83
Canada France
Percent
Germany Italy Japan1 UnitedKingdom2
UnitedStates
Academic higher education5 Upper secondary education4Lower secondaryeducation or below3
Country
1 In Japan, the data for ISCED97 levels 0 (preprimary education), 1 (primary education), and 2 (lower secondary education) are included in the data for upper secondary education. 2 The United Kingdom includes England, Northern Ireland, Scotland, and Wales. 3 Includes ISCED97 levels 5A (academic higher education below the doctoral level) and 6 (doctoral level of academic higher education). 4 Includes ISCED97 levels 3 (upper secondary education) and 4 (postsecondary nontertiary programs). 5 Includes ISCED97 levels 0 (preprimary education), 1 (primary education), and 2 (lower secondary education). NOTE: Education levels are defined according to the International Standard Classification of Education (ISCED97). For more information on the ISCED97 levels, see appendix A in this report. SOURCE: Organization for Economic Cooperation and Development (OECD). (2008). Education at a Glance: OECD Indicators 2008, A8.1a and web tables A8.3b and A8.3c. Paris: Author (Retrieved September 22, 2008).
Figure 26b. Employment rates of adults ages 25 to 64, by sex, highest level of education, and country: 2006
80 78 8076
68
87
78
70 7067 65
60
76
67
4651
46
33
61
44
Canada France Germany Italy Japan1 UnitedKingdom2
UnitedStates
0
20
40
60
80
100
��
�
�
�
�
���
���� �
� ��
�
�
���
��
��
��
�
��
��
�
�
�
�
Academic higher education3
�
�
�
�
�
�
Female participation rate Male participation rate
Country
Percent
�
��
Upper secondary education4
Lower secondary education or below5
Academic higher education3
Upper secondary education4
Lower secondary education or below5
87 8589 86
9390 88
82 8178
8487 85
80
67 66 6571 72 70

72 INDICATOrS PArT V: EDUCATION rETUrNS: EDUCATIONAL ATTAINMENT AND INCOME
G-8 Countries Included: Canada, France, Germany, Italy, United Kingdom, United States
DIStRIBUtIOn Of pOpULAtIOn By EDUCAtIOn AnD InCOME
Among U.S. 25- to 64-year-olds whose highest level of at-tainment was lower secondary education or below, 42 percent earned at or below half of the country’s median income in 2006. This percentage was higher than in all other reporting G-8 countries.
This indicator compares the 2006 income distributions of adults ages 25- to 64-years-old at three different levels of educational attainment: lower secondary education or below, upper secondary education,28 and academic higher education. Income comparisons are made relative to each country’s respective median income. For instance, in 2006, the median annual income for people ages 15 and older in the United States was about $26,000 (U.S. Census Bureau 2008). A subgroup of people in the United States earning more than two times the U.S. median income would have had an average annual income of over $52,000; a subgroup earning at or below half of the U.S. median income would have had an average annual income of $13,000 or less. As shown in this indicator, in all reporting G-8 countries, adults with a high level of education tended to earn more income than those with a relatively low level of education (i.e., those whose educational attainment was lower secondary education or below).
Among U.S. 25- to 64-year-olds whose highest level of educational attainment was lower secondary education or below, 16 percent earned more than the country’s median income in 2006 (figure 27). This percentage was lower than in all other reporting G-8 countries, which ranged from 20 percent in the United Kingdom to 38 percent in Germany. Two percent of U.S. 25- to 64-year-olds with this level of education earned more than two times the country’s median income (table 8). The corresponding percentages in the other G-8 countries ranged from 2 percent in the United Kingdom and Germany to 7 percent in Italy. In contrast, 42 percent of such U.S. adults earned at or below half of the country’s median
income. This percentage was higher than in all other reporting G-8 countries, which ranged from 17 percent in France to 39 percent in the United Kingdom.
Among U.S. 25- to 64-year-olds whose highest level of educational attainment was upper secondary education, 38 percent earned more than the country’s median income in 2006 (figure 27). This percentage was lower than in all other reporting G-8 countries, which ranged from 42 percent in the United Kingdom and Germany to 56 percent in Italy. Italy was the only reporting G-8 country where more than half of adults with this level of education earned more than the country’s median income. Seven percent of U.S. 25- to 64-year-olds with this level of education earned more than two times the country’s median income (table 8). The corresponding percentages in the other G-8 countries ranged from 4 percent in Germany to 14 percent in Italy (table 8). In contrast, 24 percent of such U.S. adults earned at or below half of the country’s median income; in the other G-8 countries this ranged from 10 percent in Italy to 28 percent in Canada.
Among U.S. 25-to 64-year-olds who had completed academic higher education, 68 percent earned more than the country’s median income in 2006 (figure 27). The corresponding percentages in the other G-8 countries ranged from 66 percent in Canada to 75 percent in the United Kingdom. Twenty-eight percent of U.S. 25- to 64-year-olds with this level of education earned more than two times the country’s median income (table 8). The corresponding percentages in the other G-8 countries ranged from 27 percent in France and Germany to 32 percent in Italy. In contrast, 12 percent of such U.S. adults earned at or below half of the country’s median income; in the other G-8 countries this ranged from 7 percent in France to 18 percent in Canada.
Definitions and Methodology
Income refers to pretax income.
As shown in the table and figure, education levels are defined according to the International Standard Classification of Educa-tion (ISCED97). For more information on the ISCED97 levels, see appendix A. Individuals whose highest level of education is academic higher education have completed at least a first university
degree program, which prepares students for advanced research and highly qualified professions. First university degree programs vary in duration in different countries in different programs of study. In the United States, the first university degree corresponds to a bachelor’s degree; it excludes associate’s degrees.
28 In this indicator, the category of “upper secondary education” also includes postsecondary nontertiary programs. See figure 27 and appendix A for more information on education levels.

Indicator
INDICATOrS PArT V: EDUCATION rETUrNS: EDUCATIONAL ATTAINMENT AND INCOME 73
27
1 Reference year is 2005 rather than 2006. 2 Reference year is 2004 rather than 2006. 3 The United Kingdom includes England, Northern Ireland, Scotland, and Wales. 4 Includes ISCED97 levels 0 (preprimary education), 1 (primary education), and 2 (lower secondary education). 5 Includes ISCED97 levels 3 (upper secondary education) and 4 (postsecondary nontertiary programs). 6 Includes ISCED97 levels 5A (academic higher education below the doctoral level) and 6 (doctoral level of academic higher education). NOTE: Education levels are defined according to the International Standard Classification of Education (ISCED97). For more information on the ISCED97 levels, see appendix A in this report. SOURCE: Organization for Economic Cooperation and Development (OECD). (2008). Education at a Glance: OECD Indicators 2008, table A9.4a. Paris: Author.
Figure 27. Percentage of the population ages 25 to 64 who earned more than the median income, by highest level of education and country: 2006
31
44
66
32
45
74
3842
71
36
56
74
20
42
75
16
38
68
0
20
40
60
80
100
Canada1 France
Percent
Germany Italy2 UnitedKingdom3
UnitedStates
Country
Academic highereducation6
Upper secondaryeducation5
Lower secondaryeducation or below4
Table 8. Percentage of the population ages 25 to 64, by highest level of education, income, and country: 2006
Education level and income Canada1 France Germany Italy2United
Kingdom3United States
Lower secondary level or below4
At or below half of the median income 37.8 17.4 30.7 19.5 38.6 42.2More than two times the median income 5.8 2.9 1.9 7.4 1.9 1.9
Upper secondary education5
At or below half of the median income 28.2 10.6 23.5 10.3 25.7 23.8More than two times the median income 11.5 5.1 4.3 14.1 6.8 7.0
Academic high education6
At or below half of the median income 18.3 7.0 11.1 7.8 11.8 11.6More than two times the median income 31.2 26.6 27.1 31.9 30.9 28.0
1 Reference year is 2005 rather than 2006. 2 Reference year is 2004 rather than 2006. 3 The United Kingdom includes England, Northern Ireland, Scotland, and Wales. 4 Includes ISCED97 levels 0 (preprimary education), 1 (primary education), and 2 (lower secondary education). 5 Includes ISCED97 levels 3 (upper secondary education) and 4 (postsecondary nontertiary programs). 6 Includes ISCED97 levels 5A (academic higher education below the doctoral level) and 6 (doctoral level of academic higher education). NOTE: Education levels are defined according to the International Standard Classification of Education (ISCED97). For more information on the ISCED97 levels, see appendix A in this report. SOURCE: Organization for Economic Cooperation and Development (OECD). (2008). Education at a Glance: OECD Indicators 2008, table A9.4a. Paris: Author.


rEFErENCES 75
REfEREnCESOrganization for Economic Cooperation and Development (OECD).
(2004). Learning for Tomorrow’s World: First Results From PISA 2003. Paris: Author.
Organization for Economic Cooperation and Development (OECD). (2006). Assessing Scientific, Reading, and Mathematical Literacy: A Framework for PISA 2006. Paris: Author.
Organization for Economic Cooperation and Development (OECD). (2007a). PISA 2006: Science Competencies for Tomorrow’s World, Volume 1: Analysis. Paris: Author.
Organization for Economic Cooperation and Development (OECD). (2007b). PISA 2006: Science Competencies for Tomorrow’s World, Volume 2: Data. Paris: Author.
Organization for Economic Cooperation and Development (OECD). (2008a). Education at a Glance: OECD Indicators 2008. Paris: Author.
Organization for Economic Cooperation and Development (OECD). (2008b). National Accounts of OECD Countries: Main Aggre-gates, Volume 1, 1995–2006 (2008 ed.). Paris: Author.
Organization for Economic Cooperation and Development (OECD). (2009). PISA 2006 Technical Report. Paris: Author.
Sherman, J.D., Honegger, S.D., and McGivern, J.L. (2003). Compara-tive Indicators of Education in the United States and Other G8 Countries: 2002 (NCES 2003-026). National Center for Education Statistics, Institute of Education Sciences, U.S. Department of Education. Washington, DC.
Snyder, T.D., Dillow, S.A., and Hoffman, C.M. (2008). Digest of Educa-tion Statistics, 2007 (NCES 2008-022), table 258. National Center for Education Statistics, Institute of Education Sciences, U.S. Department of Education. Washington, DC.
United Nations Educational, Scientific and Cultural Organization. (1997). International Standard Classification of Education, ISCED97 1997. Montreal, Canada: Author.
U.S. Census Bureau, Current Population Survey. (2008). Annual Social and Economic Supplements. retrieved January 14, 2009, from http://www.census.gov/hhes/www/income/histinc/p07Ar.html.
Baldi, S., Jin, Y., Skemer, M., Green, P.J., and Herget, D. (2007). Highlights From PISA 2006: Performance of U.S. 15-Year-Old Students in Science and Mathematics Literacy in an International Context (NCES 2008-016). National Center for Education Statistics, Institute of Education Sciences, U.S. Department of Education. Washington, DC.
Ganzeboom, H.B.G., De Graaf, P.M., and Treiman, D.J. (1992). A Stan-dard International Socio-economic Index of Occupational Status. Social Science Research, 21(1): 1–56.
Gonzales, P., Williams, T., Jocelyn, L., roey, S., Kastberg, D., and Brenwald, S. (2008). Highlights From TIMSS 2007: Mathematics and Science Achievement of U.S. Fourth- and Eighth-Grade Students in an International Context (NCES 2009-001). National Center for Education Statistics, Institute of Education Sciences, U.S. Department of Education. Washington, DC.
International Labor Organization. (1988). International Standard Classification of Occupations (ISCO-88). Geneva: Author.
Martin, M.O., Mullis, I.V.S., and Foy, P. (2008). TIMSS 2007 International Science Report: Findings From IEA’s Trends in International Mathematics and Science Study at the Fourth and Eighth Grades. Chestnut Hill, MA: TIMSS & PIrLS International Study Center, Boston College.
Martin, M.O., Mullis, I.V.S., and Kennedy, A.M. (Eds.). (2007). PIRLS 2006 Technical Report. Chestnut Hill, MA: TIMSS & PIrLS International Study Center, Boston College.
Mullis, I.V.S., Martin, M.O., and Foy, P. (2008). TIMSS 2007 International Mathematics Report: Findings From IEA’s Trends in International Mathematics and Science Study at the Fourth and Eighth Grades. Chestnut Hill, MA: TIMSS & PIrLS International Study Center, Boston College.
Olson, J.F., Martin, M.O., & Mullis, I.V.S. (Eds.). (2008). TIMSS 2007 Technical Report. Chestnut Hill, MA: TIMSS & PIrLS International Study Center, Boston College.
Organization for Economic Cooperation and Development (OECD). (2003). Education at a Glance: OECD Indicators 2003. Paris: Author.


Appendix AThe Education Systems of
the G-8 Countries
Appendix A


APPENDIx A: THE EDUCATION SYSTEMS OF THE G-8 COUNTrIES 79
tHE EDUCAtIOn SyStEMS Of tHE G-8 COUntRIESrepresents the range of ages at which enrollment is compulsory, or required by law. (See also indicator 2 for information on the age range at which more than 90 percent of the population is enrolled in formal education and the ending age of compulsory education.) The expected duration of a first university degree program, a bachelor’s degree program in the United States, is listed in the note below each chart. On the right side of each chart are the years of schooling (“grade,” in the United States) corresponding to each level of education. The first year of schooling corresponds to the first year of compulsory education. The ages and years listed assume normal progress through the education system.
ISCED97 levels
The ISCED97 is a classification framework that allows for the alignment of the content of education systems using multiple classification criteria. The ISCED97 levels address the intent (e.g., to study basic subjects or prepare students for university) of each year of a particular education system, but do not indicate the depth or rigor of study in that year. Thus, the ISCED97 is useful when comparing the age range of students in upper secondary schools across nations; however, it does not indicate whether the curriculum and standards are equivalent within the same year of schooling across nations. The ISCED97 allows researchers to compile statistics on education internationally. The ISCED97 levels are as follows:
ISCED97 level 0 is classified as preprimary education. This is •defined as the initial stage of organized instruction, designed primarily to introduce very young children to a school-type environment. ISCED97 level 0 programs can either be center or school based. Preschool and kindergarten programs in the United States fall into the level 0 category, although kindergarten is typically considered an elementary grade in the United States.ISCED97 level 1 consists of primary education, which usually •lasts 4 to 6 years. ISCED97 level 1 typically begins between ages 5 and 7, and is the stage where students begin to study basic subjects, such as reading, writing, and mathematics. In the United States, elementary school (grades 1 through 6) is classified as level 1.At ISCED97 level 2, or lower secondary education, students •continue to learn the basic subjects taught in level 1, but this level is typically more subject specific than level 1 and may be taught by specialized teachers. ISCED97 level 2 usually lasts between 2 and 6 years, and begins around the age of 11. Middle school and junior high (grades 7 through 9) in the United States are classified as level 2.At ISCED97 level 3, or upper secondary education, student •coursework is generally subject specific and often taught by specialized teachers. Students often enter upper secondary education at the age of 15 or 16 and attend anywhere from 2 to 5 years. ISCED97 level 3 can prepare students for university,
Reader’s Guide: Education System ChartsDifferences in the structure of countries’ education systems often make international comparisons difficult. To improve the comparability of education indicators, the United Nations Educational, Scientific and Cultural Organization (UNESCO) created an internationally comparable method for describing levels of education across countries called the International Standard Classification of Education (ISCED97). Using the ISCED97 classifications as a starting point, NCES worked with education professionals in the G-8 countries to create an overview of each country’s education system.
There are differences within the education systems of some G-8 countries because responsibilities and oversight for education take place at the regional or local level. However, the charts and accompanying text in this appendix are intended to give the reader a general overview of the education system of each G-8 country, from the preprimary to the doctoral level.
As indicated in the source note for each country chart, the informa-tion summarizing each country’s education system comes largely from the previous Comparative Indicators report (2006). However, some modifications were made based on updated online resources and comments received from international reviewers.
The reader is encouraged to seek out additional resources to gain a fuller and deeper understanding of each country’s education system. A list of websites with additional information is provided at the end of this reader’s Guide, and additional sources are cited after each country’s education system is presented.
How to read the charts
Each of the charts on the following pages is a broad representation of the education system of a G-8 country. The charts are not intended to show all possible pathways that a student can take or the many configurations of grades that may be found within the same school. rather, each chart is intended to provide a general description that is useful for comparison across the G-8 countries.
The colors on each chart correspond to ISCED97 levels (see next section). The ISCED97 term for each level of education is written within each block. The terms in italics in each block are a country’s designation for that particular level (e.g., high school for upper secondary school). The left side of each chart is labeled with the typical ages corresponding to each level of education. The age labels represent the typical age at which a student begins the corresponding year of schooling; often, students are 1 year older at the end of the school year. Ages in bold text are the ages at which enrollment is universal, defined here as an enrollment rate of more than 90 percent. The rectangular box encasing some ages

80 APPENDIx A: THE EDUCATION SYSTEMS OF THE G-8 COUNTrIES
further schooling, or the labor force. Senior high school (grades 10 through 12) is considered level 3 in the United States.ISCED97 level 4 programs consist of postsecondary nontertiary •programs. Postsecondary nontertiary programs are primarily vocational and are taken after the completion of secondary school, though the content is not more advanced than the content of secondary school courses. Although not included in the charts, postsecondary nontertiary programs are described in the text. ISCED97 level 4 programs in the United States are often in the form of 1-year certificate programs.Tertiary programs• 29 are divided into ISCED97 levels 5A, 5B, and 6. ISCED97 level 5A refers to academic higher education below the doctoral level. Level 5A programs are intended to provide sufficient qualifications to gain entry into advanced research programs and professions with high skill requirements. The international classification includes programs of medium length that last less than 5 years and long programs that last 5 to 7 years. In the United States, bachelor’s, master’s, and first professional degree programs are classified as ISCED97 level 5A. ISCED97 level 5B refers to vocational higher education. Level 5B programs provide a higher level of career and technical education and are designed to prepare students for the labor market. In the international classification, these programs last 2 to 4 years. In the United States, associate’s degree programs are classified at this level. ISCED97 level 6 refers to the doctoral level of academic higher education. Level 6 programs usually require the completion of a research thesis or dissertation.
Text format
The text accompanying each chart is meant to give the reader more detail on each country’s education system. The bulleted format is designed to make quick comparisons more convenient, and the text is divided into sections corresponding to the ISCED97 levels. The “NOTE” heading in each section presents information that is important, but that may not be included in either the chart or the
bulleted text, including within-country variations or features of the education system that are unique to a particular country.
Websites with additional information
Canada: http://www.statcan.ca/english/freepub/81-582-xIE/free.htm (see appendix 1)
France: http://www.eurydice.org
Germany: http://www.eurydice.org
Italy: http://www.eurydice.org
Japan: http://www.mext.go.jp/english/statist/05101901.htm
russian Federation: http://www.euroeducation.net/prof/russco.htm
United Kingdom:
England, Wales, and Northern Ireland: http://www.eurydice.org
Scotland: http://www.eurydice.org
United States: www.ed.gov/international/edus
29 In the international classification, more advanced postsecondary education (such as attending a 4-year college or university) is referred to as “tertiary education.” In the current report, the term “higher education” is used because this term is more familiar to American readers.
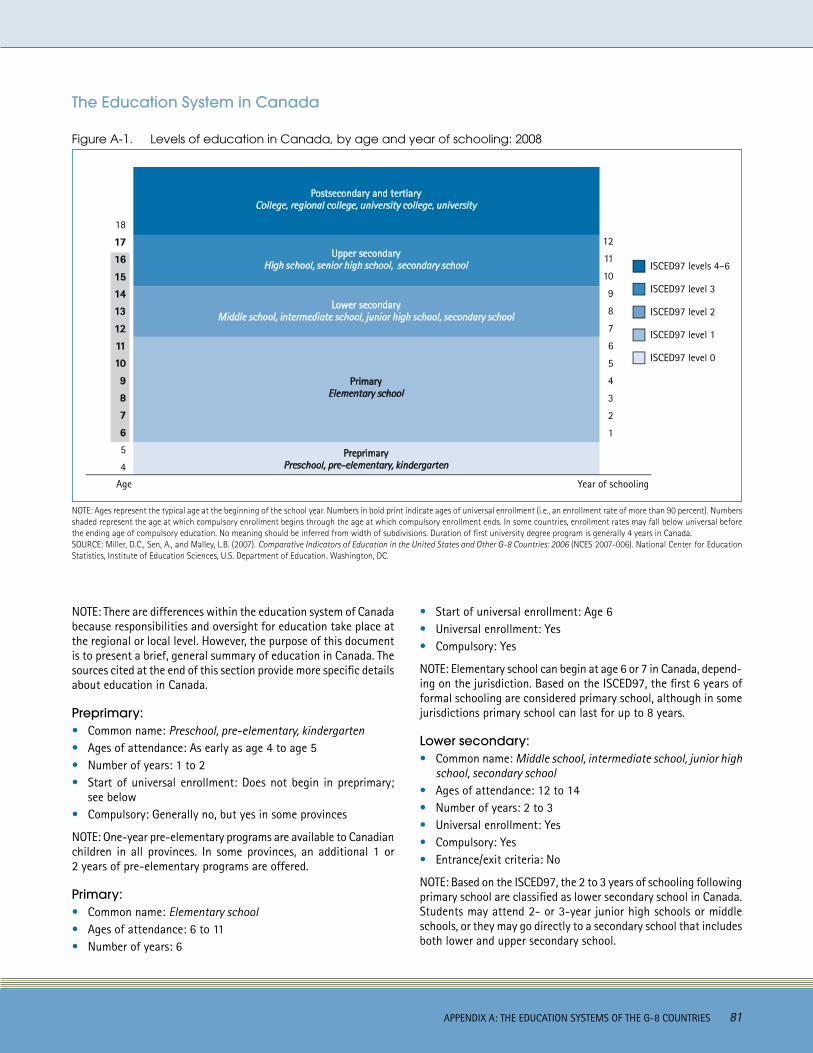
APPENDIx A: THE EDUCATION SYSTEMS OF THE G-8 COUNTrIES 81
The Education System in Canada
NOTE: There are differences within the education system of Canada because responsibilities and oversight for education take place at the regional or local level. However, the purpose of this document is to present a brief, general summary of education in Canada. The sources cited at the end of this section provide more specific details about education in Canada.
Preprimary:Common name: • Preschool, pre-elementary, kindergarten Ages of attendance: As early as age 4 to age 5 •Number of years: 1 to 2•Start of universal enrollment: Does not begin in preprimary; •see below Compulsory: Generally no, but yes in some provinces•
NOTE: One-year pre-elementary programs are available to Canadian children in all provinces. In some provinces, an additional 1 or 2 years of pre-elementary programs are offered.
Primary: Common name: • Elementary schoolAges of attendance: 6 to 11•Number of years: 6•
Start of universal enrollment: Age 6•Universal enrollment: Yes•Compulsory: Yes•
NOTE: Elementary school can begin at age 6 or 7 in Canada, depend-ing on the jurisdiction. Based on the ISCED97, the first 6 years of formal schooling are considered primary school, although in some jurisdictions primary school can last for up to 8 years.
Lower secondary:Common name: • Middle school, intermediate school, junior high school, secondary schoolAges of attendance: 12 to 14•Number of years: 2 to 3•Universal enrollment: Yes•Compulsory: Yes•Entrance/exit criteria: No•
NOTE: Based on the ISCED97, the 2 to 3 years of schooling following primary school are classified as lower secondary school in Canada. Students may attend 2- or 3-year junior high schools or middle schools, or they may go directly to a secondary school that includes both lower and upper secondary school.
Figure A-1. Levels of education in Canada, by age and year of schooling: 2008
NOTE: Ages represent the typical age at the beginning of the school year. Numbers in bold print indicate ages of universal enrollment (i.e., an enrollment rate of more than 90 percent). Numbers shaded represent the age at which compulsory enrollment begins through the age at which compulsory enrollment ends. In some countries, enrollment rates may fall below universal before the ending age of compulsory education. No meaning should be inferred from width of subdivisions. Duration of first university degree program is generally 4 years in Canada. SOURCE: Miller, D.C., Sen, A., and Malley, L.B. (2007). Comparative Indicators of Education in the United States and Other G-8 Countries: 2006 (NCES 2007-006). National Center for Education Statistics, Institute of Education Sciences, U.S. Department of Education. Washington, DC.
PreprimaryPreschool, pre-elementary, kindergarten
Postsecondary and tertiaryCollege, regional college, university college, university
PrimaryElementary school
Lower secondaryMiddle school, intermediate school, junior high school, secondary school
ISCED97 levels 4–6
ISCED97 level 0
ISCED97 level 1
ISCED97 level 2
ISCED97 level 3
Upper secondaryHigh school, senior high school, secondary school
Year of schoolingAge
18
17
16
15
14
13
12
11
10
9
8
6
7
5
4
12
11
10
9
8
6
7
5
4
3
2
1

82 APPENDIx A: THE EDUCATION SYSTEMS OF THE G-8 COUNTrIES
Upper secondary:Common name: • High school, senior high school, secondary schoolAges of attendance: 15 to 17 (graduation generally at age 18)•Number of years: 3•Universal enrollment: Through age 17•Compulsory: Until age 16 in most jurisdictions; until 18 or •graduation in New BrunswickEntrance/exit criteria: Some provinces have what could be •considered an exit exam (e.g., Ontario administers a grade 10 literacy test, and Quebec requires that students take core subject exams, which are a significant part of the graduation requirements).
NOTE: Based on the ISCED97, the last 3 years of schooling prior to receiving a high school diploma are classified as upper secondary school in Canada. Senior high schools may be up to 4 years in length, and many students attend secondary schools that include both lower and upper secondary school programs.
Postsecondary and tertiary:Common name: • College, regional college, university college, universityAges of attendance: Varies•Number of years: Varies according to degree•Universal enrollment: No •Entrance criteria: Graduation from a secondary school academic •or university preparatory program—or, in the case of Quebec, completion of a 2-year pre-university program—is typically the minimum requirement to be eligible for admission to undergraduate degree programs. However, most institutions and/or departments set their own admissions standards, often with more rigorous requirements.
Common degree programs:Pre-university programs: • 2-year programs that students in Quebec are generally required to complete before they are eligible to attend university.
Certificate: • 1-year programs offered at colleges, regional colleges, community colleges, institutes, and colleges of applied arts and technology (the name depends on the jurisdiction). These programs are vocational and are oriented toward preparing students for the labor force in semiprofessional and technical fields.Diploma:• 2- to 3-year programs offered at community colleges, regional colleges, etc. These programs are vocational and are oriented toward preparing students for the labor force in semiprofessional and technical fields.Bachelor’s degree: • 3- to 4-year academic programs at a university college or university. (University bachelor’s degree programs are usually 4 years, while university college programs can be 3 or 4 years.)Master’s degree: • Graduate programs at a university requiring 1 to 2 years beyond the bachelor’s degree. This degree is designed to prepare students for professional careers.Doctorate:• Academic graduate programs at a university requir-ing 3 to 5 years after the bachelor’s degree. Doctoral programs prepare students for careers in research.
Sources:
Canadian Education Statistics Council. (2003). Report of the Pan-Canadian Education Indicators Program, appendix 1. Ontario, Canada: Statistics Canada. retrieved October 31, 2006, from http://www.cesc.ca/pceip/PCEIP2003en.pdf.
Marlow-Ferguson, r. (Ed.) (2002). World Education Encyclopedia: A Survey of Educational Systems Worldwide, Vol. 1 (2nd ed.). Farmington Hills, MI: Gale Group.
Organization for Economic Cooperation and Development. (1996). Education at a Glance: OECD Indicators. Paris: Author.
robitaille, D.F. (1997). National Contexts for Mathematics and Science Education: An Encyclopedia of the Education Systems Participating in TIMSS. Vancouver, Canada: Pacific Educational Press.

APPENDIx A: THE EDUCATION SYSTEMS OF THE G-8 COUNTrIES 83
The Education System in France
Figure A-2. Levels of education in France, by age and year of schooling: 2008
Preprimary:Common name: • École maternelleAges of attendance: As early as age 2 to age 5•Number of years: 1 to 4•Start of universal enrollment: Age 3•Compulsory: No•
Primary:Common name: • École élémentaireAges of attendance: 6 to 10•Number of years: 5•Universal enrollment: Yes•Compulsory: Yes•
Lower secondary: Common name: • CollègeAges of attendance: 11 to 14•Number of years: 4•Universal enrollment: Yes•Compulsory: Yes•
NOTE: Ages represent the typical age at the beginning of the school year. Numbers in bold print indicate ages of universal enrollment (i.e., an enrollment rate of more than 90 percent). Numbers shaded represent the age at which compulsory enrollment begins through the age at which compulsory enrollment ends. In some countries, enrollment rates may fall below universal before the ending age of compulsory education. No meaning should be inferred from width of subdivisions. Duration of first university degree program is generally 4 years in France. SOURCE: Miller, D.C., Sen, A., and Malley, L.B. (2007). Comparative Indicators of Education in the United States and Other G-8 Countries: 2006 (NCES 2007-006). National Center for Education Statistics, Institute of Education Sciences, U.S. Department of Education. Washington, DC.
Entrance/exit criteria: Yes; • brevet des collèges is the exit exam for lower secondary. It is a national examination, which determines whether or not students will be able to attend lycée.
Upper secondary:Common name: • Lycée
Enseignement professional ◗ —Vocational upper secondary schoolEnseignement technologique ◗ —Technological upper second-ary schoolEnseignement général ◗ —Academic upper secondary school
Ages: 15 to 17 (graduation generally at age 18)•Number of years: 3•Universal enrollment: Through age 17 (most students turn 18 •during the last year of upper secondary school) Compulsory: Until age 16•Entrance/exit criteria: In order to enter upper secondary educa-•tion, students must pass the brevet des collèges. Students take a national examination, the baccalauréat, during the last year of secondary school, which determines entrance to university.
NOTE: All three types of upper secondary school (enseignement professional, technologique, and général) qualify a student to
ISCED97 levels 4–6
ISCED97 level 0
ISCED97 level 1
ISCED97 level 2
ISCED97 level 3
Year of schoolingAge
PreprimaryÉcole maternelle
Postsecondary and tertiaryIUT, STS, université, grande école
PrimaryÉcole élémentaire
Lower secondaryCollège
VocationalEnseignement professional
AcademicEnseignement général
TechnologicalEnseignement technologique
18
17
1615141312111098
67
5432
12
111098
67
54321
Upper secondary/Lycée

84 APPENDIx A: THE EDUCATION SYSTEMS OF THE G-8 COUNTrIES
enter university, although certain tracks are more likely to lead to university: the academic branch (enseignement général) typically leads to university and other forms of higher education; the technological branch (enseignement technologique) may also lead to specialized technological or professional forms of higher education; and the vocational branch (enseignement professional) more often leads to the labor force and/or job training.
Postsecondary and tertiary:Common name: • IUT, STS, université, grande école Ages of attendance: Varies•Number of years: Varies according to degree or program•Universal enrollment: No•Entrance criteria: In order to enter into higher education •programs in France, students are required to have passed the baccalauréat or an equivalent. Entrance to the university is nonselective, meaning that students who have passed the baccalauréat are entitled to enter. There are, however, competi-tive entrance exams for the grandes écoles.
Common programs (short fields):DUT• (University degree in technology): Taken at the University Institute of Technology (IUT). Two-year program in mostly vocational subjects. Student may choose to continue on toward a license (see section below). BTS• (Higher technical diploma): Two-year program taken in higher education departments of lycées (STS, Institute for Higher Technical Studies); more specialized than degrees from IUT, but also in mostly vocational subjects.DEUG• (General university studies degree): Academic degree received after completion of 2 years of university.
Common degree programs (long fields):License: • DEUG (see above) plus 1 additional year at university.Maîtrise: • Degree following the license. requires 1 additional year at university.
DESS• (Diploma of specialized higher studies): Follows the maîtrise; 1-year professional course involving a required internship.DEA • (Diploma of advanced studies): Follows the maîtrise; 1-year program designed to prepare students for doctoral research. Involves the preparation of a research project.Medical doctor/dental/pharmacy:• Degree programs taken at the university. Length of program varies and can lead to degrees such as the doctorat de médecine specializé, doctorat de médecine generale, and doctorat pharmacie.Doctorat: • research-based graduate degree program at a university, leading to a doctorate. Usually requires 5 years of study beyond the maîtrise.Diplôme grande école: • Competitive degree programs (students must pass a selective entrance exam) in academic subjects, science, commerce, management, engineering, business, and architecture. These are typically 5-year programs and are taken at the grandes écoles.
Sources:
Eurybase. (2008). The Information Database on Education Systems in Europe: The Education System in France, 2007/2008. Brussels: Eurydice. retrieved December 15, 2008, from http://eacea.ec.europa.eu/ressources/eurydice/eurybase/pdf/0_integral/Fr_EN.pdf.
Marlow-Ferguson, r. (Ed.) (2002). World Education Encyclopedia: A Survey of Educational Systems Worldwide, Vol. 1 (2nd ed.). Farmington Hills, MI: Gale Group.
Organization for Economic Cooperation and Development. (1996). Education at a Glance: OECD Indicators. Paris: Author.
robitaille, D.F. (1997). National Contexts for Mathematics and Science Education: An Encyclopedia of the Education Systems Participating in TIMSS. Vancouver, Canada: Pacific Educational Press.

APPENDIx A: THE EDUCATION SYSTEMS OF THE G-8 COUNTrIES 85
The Education System in Germany
Figure A-3. Levels of education in Germany, by age and year of schooling: 2008
NOTE: There are differences within the education system of Germany because responsibilities and oversight for education take place at the regional or local level. However, the purpose of this document is to present a brief, general summary of education in Germany. The sources cited at the end of this section provide more specific details about education in Germany.
Preprimary:Common name: • KindergartenAges of attendance: As early as age 3 to age 5•Number of years: 1 to 3•Start of universal enrollment: Does not begin in preprimary; •see belowCompulsory: No•
NOTE: Students may attend preprimary programs in a few schools at age 2.
Primary:Common name:• GrundschuleAges of attendance: 6 to 9•Number of years: 4•
Start of universal enrollment: Age 6•Compulsory: Yes•
NOTE: In some Länder (the German equivalent of states), Grund-schule lasts 6 years.
Lower secondary: Common name: •
Hauptschule ◗ —General secondary schoolRealschule ◗ —Enhanced general education secondary schoolGymnasium ◗ —Academic secondary schoolGesamtschule ◗ —Integrated secondary school, meaning that students are not split into separate general education and academic tracks
Ages of attendance: 10 to 15•Number of years: 5 to 6•Universal enrollment: Yes•Compulsory: Yes•Entrance/exit criteria: In some • Länder, admissions tests deter-mine if a student can take the education tracks of Realschule or Gymnasium.
NOTE: Ages represent the typical age at the beginning of the school year. Numbers in bold print indicate ages of universal enrollment (i.e., an enrollment rate of more than 90 percent). Numbers shaded represent the age at which compulsory enrollment begins through the age at which compulsory enrollment ends. In some countries, enrollment rates may fall below universal before the ending age of compulsory education. No meaning should be inferred from width of subdivisions. Duration of first university degree program is generally 4 years in Germany. SOURCE: Miller, D.C., Sen, A., and Malley, L.B. (2007). Comparative Indicators of Education in the United States and Other G-8 Countries: 2006 (NCES 2007-006). National Center for Education Statistics, Institute of Education Sciences, U.S. Department of Education. Washington, DC.
ISCED97 levels 4–6
ISCED97 level 0
ISCED97 level 1
ISCED97 level 2
ISCED97 level 3
Year of schoolingAge
1819
17
1615141312111098
67
543
1213
111098
67
54321
PreprimaryKindergarten
Lower secondary— general
Hauptschule
Lower secondary— enhanced general
Realschule
Lower secondary— academic
Gymnasium
Lower secondary— integrated
Gesamtschule
Upper secondary— academic
Gymnasium/Gymnasiale Oberstufe
Upper secondary—full-time basic vocational
Berufsfachschule
Upper secondary— advanced vocational
Fachoberschule
Upper secondary— vocational
(often part-time)Berufsschule
PrimaryGrundschule
Postsecondary and tertiaryBerufsakademie, Fachhochschule, Universität

86 APPENDIx A: THE EDUCATION SYSTEMS OF THE G-8 COUNTrIES
NOTE: There are different types of secondary schools, some combin-ing Hauptschule and Realschule. The secondary school a student in Germany attends is determined by a combination of factors, depending on the Länder: admissions tests, previous grade point average, teacher recommendations, and parents’ wishes. The degree of flexibility that parents have in choosing which educational track their child enters also varies between regions.
However, the type of school a student attends is sometimes less important than the chosen track: at the end of lower secondary, all students who meet the requirements receive a leaving certificate. At the Hauptschule it is generally the Hauptschulabschluss, but students who excel may receive a Realschulabschluss (called the Mittlere Schulabschluss in some Länder). At the Realschule, students typically receive the Realschulabschluss; at the Gesamtschule, both types of diplomas are offered. All students attending Gymnasium who advance to the upper secondary level automatically receive the Realschulabschluss.
Some Länder also have an orientation phase during the first 2 years of lower secondary school, which gives parents and teachers 2 more years to decide a child’s educational path. In Länder with a 6-year primary school, lower secondary school is 2 years shorter.
Upper secondary:Common name: •
Berufsschule— ◗ 3- to 4- year vocational school, which often includes an apprenticeship; many students at this school attend part time while also doing an apprenticeship.Berufsfachschule ◗ —1- to 3-year full-time basic vocational schoolFachoberschule ◗ —2-year advanced vocational schoolGymnasium/Gymnasiale Oberstufe ◗ —Academic upper sec-ondary school. Gymnasium continues from lower secondary school. Gymnasiale Oberstufe follows the same curriculum as the Gymnasium, but comes after Gesamtschule.
Ages: Generally 16 to 18 (graduation generally at 19 for •academic programs; 18 or 19 for others)Number of years: 1 to 4•Universal enrollment: Through age 17 (most students in long •programs turn 19 during the last year of upper secondary school)Compulsory: Until age 18 •Entrance/exit criteria: Students must pass the • Abitur in order to enter university and other forms of higher education.
NOTE: Gymnasium and Gesamtschule are generally combined lower and upper secondary schools, although students concentrate their studies on fewer subjects during the last years of Gymnasium. Some Länder offer fast tracks, where students can graduate from Gymnasium a year early. Additionally, a few Länder offer the Berufsoberschule, a vocational upper secondary school for those who have completed vocational training or have 5 years of work experience.
Postsecondary and tertiary:Common name: • Berufsakademie, Fachhochschule, UniversitätAges of attendance: Varies•Number of years: Varies according to degree•Universal enrollment: No•Entrance criteria: Students must pass the • Abitur in order to enter university. Students must have at a minimum a Fach-hochschulreife (vocational upper secondary diploma) in order to enter the tertiary sector.
Common degree programs:Diplom Fachhochschule—FH: • 4-year degree program in applied fields such as engineering, administration, social services, and design. Admission to a Fachhochschule is competitive because of restricted numbers of available spaces. Diplom Berufsakademie—BA:• 3-year program of academic training combined with work experience. Offered at a Berufsakademie.Diplom: • Master’s degree equivalent usually requiring a minimum of 4 years of study. Universität offers this degree in academic fields as well as scientific, technical, and engineering fields.Magister: • Usually requires 2 years beyond the Diplom, taken at Universität.Doktorgrad:• Doctoral degree program, focused on research and taken at Universität. Normally requires at least 2 years beyond the Magister, but some students attend after receiving a Diplom.
Sources:
Eurybase. (2007). The Information Database on Education Systems in Europe: The Education System in Germany, 2006/2007. Brussels: Eurydice. retrieved December 15, 2008, from http://eacea.ec.europa.eu/ressources/eurydice/eurybase/pdf/0_integral/DE_EN.pdf.
German Education Server (Deutscher Bildungs Server). (2006). Glossary for the Education System in the Federal republic of Germany. Chiefly compiled by the Standing Conference of the State Ministers of Education and the Arts in the Federal republic of Germany (KMK). retrieved October 31, 2006, from http://www.eduserver.de/glossare.html?sp=1.
Marlow-Ferguson, r. (Ed.) (2002). World Education Encyclopedia: A Survey of Educational Systems Worldwide, Vol. 1 (2nd ed.). Farmington Hills, MI: Gale Group.
Organization for Economic Cooperation and Development. (1996). Education at a Glance: OECD Indicators. Paris: Author.
Organization for Economic Cooperation and Development. (1999). INES Network A Newsletter, Issue 10. Paris: Author.
robitaille, D.F. (1997). National Contexts for Mathematics and Science Education: An Encyclopedia of the Education Systems Participating in TIMSS. Vancouver, Canada: Pacific Educational Press.

APPENDIx A: THE EDUCATION SYSTEMS OF THE G-8 COUNTrIES 87
The Education System in Italy
Figure A-4. Levels of education in Italy, by age and year of schooling: 2008
Preprimary:Common name: • Scuola dell’infanziaAges of attendance: As early as age 3 to age 5•Number of years: 1 to 3•Start of universal enrollment: Age 3•Compulsory: No•
Primary: Common name: • Scuola primariaAges of attendance: 6 to 10•Number of years: 5•Universal enrollment: Yes•Compulsory: Yes•
Lower secondary:Common name: • Scuola secondaria di primo gradoAges of attendance: 11 to 14•Number of years: 3•Universal enrollment: Yes•Compulsory: Yes•
Entrance/exit criteria: Yes, there is a national exit examination, •which students must pass to obtain the diploma di esame di stato conclusivo del primo ciclo di istruzione and enter into upper secondary school.
Upper secondary:Common name: • Scuola secondaria di secondo grado
Istituti d’arte, liceo artistico ◗ —Fine arts schools and institutesIstituti professionali ◗ —Vocational schoolsIstituti tecnici—Specialized technical schools ◗
Liceo classico, scientifico, linguistico, socio-psico-pedagog- ◗
ico—Academic upper secondary schoolsAges of attendance: 14 to 18 (graduation generally at age 19)•Number of years: 5•Universal enrollment: Through age 15•Compulsory: Beginning in the 2004–05 school year, upper •secondary education was classified as a “right and a duty.” This terminology is used to indicate that completing upper secondary education is expected, although not required by law.
NOTE: Ages represent the typical age at the beginning of the school year. Numbers in bold print indicate ages of universal enrollment (i.e., an enrollment rate of more than 90 percent). Numbers shaded represent the age at which compulsory enrollment begins through the age at which compulsory enrollment ends. In some countries, enrollment rates may fall below universal before the ending age of compulsory education. No meaning should be inferred from width of subdivisions. Duration of first university degree program is generally 5 years in Italy. SOURCE: Miller, D.C., Sen, A., and Malley, L.B. (2007). Comparative Indicators of Education in the United States and Other G-8 Countries: 2006 (NCES 2007-006). National Center for Education Statistics, Institute of Education Sciences, U.S. Department of Education. Washington, DC.
PreprimaryScuola dell’infanzia
Postsecondary and tertiaryAccademia, scuola diretta a fini speciali, università
Fine artsIstituti d’arte
VocationalIstituti professionali
TechnicalIstituti tecnici
AcademicLiceo
PrimaryScuola primaria
Lower secondaryScuola secondaria di primo grado
Upper secondaryScuola secondaria di secondo grado
ISCED97 levels 4–6
ISCED97 level 0
ISCED97 level 1
ISCED97 level 2
ISCED97 level 3
Year of schoolingAge
18
19
17
16
15141312111098
67
543
12
13
11
10
9
8
6
7
5
4
3
2
1

88 APPENDIx A: THE EDUCATION SYSTEMS OF THE G-8 COUNTrIES
Entrance/exit criteria: Students must possess the • diploma di esame di stato conclusivo del primo ciclo di istruzione from lower secondary school to enter upper secondary school. At the end of 5 years of instruction, students must pass a national examination in order to obtain a diploma di superamento dell’esame di stato.
NOTE: Every student who has completed 5 years of upper secondary school and has obtained a diploma di superamento dell’esame di stato may attend university and other forms of higher education. Students are tracked in academic as well as technical and vocational schools in Italy. Students in Italy may attend specialized art schools, such as istituti d’arte and liceo artistico at the upper secondary level. Students attending vocational schools may attend 3- or 5-year training or apprenticeship programs in applied fields, after which they often enter the labor force. Liceo linguistico focuses on modern foreign languages and cultures. The liceo classico and scientifico prepare students for university studies. Liceo classico focuses on literature, philosophy, and Latin and Greek languages. Liceo scientifico focuses on mathematics and science. Liceo socio-psico-pedagogico has a sociological, psychological, and pedagogical orientation.
Postsecondary and tertiary:Common name: • Accademia, scuola diretta a fini speciali, università
Alta formazione artistica e musicale ◗ —Arts and music Scuole superiori per la mediazione linguistica ◗ —School for interpretersIstruzione e formazione tecnica superiore ◗ —Technical educa-tion and trainingLaurea, laurea specialistica, dottorato di ricerca, diploma di ◗
specializzione—Academic higher education, universityAges of attendance: Varies •Number of years: Varies according to degree program•Universal enrollment: No•Entrance criteria: In order to enter university, students must •possess a diploma di superamento dell’esame di stato, a second-ary school diploma obtained after passing a national exam. Some students may also enter university with a regional certificate, which is issued on the basis of professional experience in a vocational field.
NOTE: The higher education system in Italy underwent a reform process in order to make it more compatible with the higher education systems of other European countries. Universities are now based on two main cycles (the 3-year foundation degree, or laurea, followed by a 2 year specialist degree, or laurea specialistica/magistrale), with third-cycle degree options (dottorato di ricerca, diploma di specializzazione) that are similar to a doctorate in the United States. These changes were made to increase educational exchange between Italy and other European Union countries.
Common degree programs:Accademia • degrees: Fine arts, restoration, and music degrees. Accademia degrees have been divided into two cycles according to the recent reforms, the first one taking 3 years to complete and the second one taking 2 years to complete. The diploma accademico di primo livello is awarded after the first cycle, and the diploma accademico di secondo livello is awarded after the second cycle.Laurea: • A first-level university degree taking 3 years from university entry to complete. It is characterized by both theoretical and applied studies, similar to a bachelor’s degree in the United States.Laurea specialistica/magistrale: • Graduate specialized degree requiring 2 years of university study after a first-level degree, similar to a master’s degree in the United States. Master universitario di primo livello:• A professional graduate program requiring at least 1 year of study after obtaining a laurea.Master universitario di secondo livello: • A professional graduate program requiring at least 1 year of study after obtaining a laurea specialistica/magistrale.Dottorato di ricerca: • Doctoral degree program focusing on research and taken at a university. Typically requires 3 years of instruction after the laurea specialistica/magistrale.Diploma di specializzazione:• Doctoral degree program for a specialized professional degree, such as medicine or law. Typically requires 2–6 years after the laurea specialistica/magistrale.
Sources:
Eurybase. (2007). The Information Database on Education Systems in Europe: The Education System in Italy, 2006/2007. Brussels: Eurydice. retrieved December 15, 2008, from http://eacea.ec.europa.eu/ressources/eurydice/eurybase/pdf/0_integral/IT_EN.pdf.
Marlow-Ferguson, r. (Ed.) (2002). World Education Encyclopedia: A Survey of Educational Systems Worldwide, Vol. 1 (2nd ed.). Farmington Hills, MI: Gale Group.
Organization for Economic Cooperation and Development. (1996). Education at a Glance: OECD Indicators. Paris: Author.
robitaille, D.F. (1997). National Contexts for Mathematics and Science Education: An Encyclopedia of the Education Systems Participating in TIMSS. Vancouver, Canada: Pacific Educational Press.

APPENDIx A: THE EDUCATION SYSTEMS OF THE G-8 COUNTrIES 89
The Education System in Japan
Figure A-5. Levels of education in Japan, by age and year of schooling: 2008
Preprimary:Common name: • Hoikuen, yochienAges of attendance: As early as age 3 to age 5•Number of years: 1 to 3•Start of universal enrollment: Age 4•Compulsory: No•
NOTE: Around 60 percent of 5-year-old students attend yochien (kindergarten), while others attend hoikuen (child care centers).
Primary: Common name: • ShogakkouAges of attendance: 6 to 11•Number of years: 6•Universal enrollment: Yes•Compulsory: Yes•
Lower secondary:Common name: • ChugakkouAges of attendance: 12 to 14•Number of years: 3•Universal enrollment: Yes•
Compulsory: Yes•Entrance/exit criteria: No•
NOTE: recently, unified lower and upper secondary schools (chutoukyoikugakkou) have been introduced in Japan.
Upper secondary:Common name: • KoutougakkouAges of attendance: 15 to 17 (graduation generally at age 18)•Number of years: 3•Universal enrollment: Through age 17•Compulsory: No•Entrance/exit criteria: Yes, students in Japan are placed into •upper secondary schools based on test scores and school report cards from lower secondary school. Scoring well influences students’ chances of attending the most prestigious upper secondary schools in their area.
NOTE: Juku refers to “cram school” or night school, which prepares students for upper secondary school entrance exams. Students may also choose to attend vocational/technical institutes (kout-ousenmongakkou), which combine upper secondary school with vocational higher education leading to the associate’s degree. See below for details on koutousenmongakkou.
NOTE: Ages represent the typical age at the beginning of the school year. Numbers in bold print indicate ages of universal enrollment (i.e., an enrollment rate of more than 90 percent). Numbers shaded represent the age at which compulsory enrollment begins through the age at which compulsory enrollment ends. In some countries, enrollment rates may fall below universal before the ending age of compulsory education. No meaning should be inferred from width of subdivisions. Duration of first university degree program is generally 4 years in Japan. SOURCE: Miller, D.C., Sen, A., and Malley, L.B. (2007). Comparative Indicators of Education in the United States and Other G-8 Countries: 2006 (NCES 2007-006). National Center for Education Statistics, Institute of Education Sciences, U.S. Department of Education. Washington, DC.
PreprimaryHoikuen, yochien
Postsecondary and tertiaryTankidaigaku, koutousenmongakkou, daigaku
PrimaryShogakkou
Lower secondaryChugakkou
Upper secondaryKoutougakkou
Year of schoolingAge
18
17
16
15
14
13
12
11
10
9
8
6
7
5
4
3
12
11
10
9
8
6
7
5
4
3
2
1
ISCED97 levels 4–6
ISCED97 level 0
ISCED97 level 1
ISCED97 level 2
ISCED97 level 3

90 APPENDIx A: THE EDUCATION SYSTEMS OF THE G-8 COUNTrIES
Postsecondary and tertiary:Common name: • Tankidaigaku, koutousenmongakkou, daigaku Ages of attendance: Varies•Number of years: 2 (• tankidaigaku), 3 (koutousenmongakkou), 4 (daigaku, excluding medical and dental degrees), 6 (daigaku, medical and dental degrees) Universal enrollment: No•Entrance criteria: To enter national universities, most of the •students take an entrance examination offered by the National Center for University Entrance Examinations and an examina-tion conducted by the university itself. For some universities, entrance examinations are very competitive, while others are not so competitive.
Common degree programs:Jun-gakushi• (at vocational and technical institutes): 5-year programs for students to combine upper secondary school with vocational training. The first 3 years of these programs are spent at the upper secondary level and the last 2 earning a jun-gakushi (associate’s degree). These programs are given at koutousenmongakkou, in subjects like public works, mechanical engineering, and information technology.Jun-gakushi• (at junior college): Programs normally requiring 2 years of study, taken at junior colleges (tankidaigaku), that prepare students for a career in fields like home economics, humanities, education, and social science. Junior colleges have traditionally enrolled mostly women.Gakushi: • Academic degree normally requiring 4 years of study that is similar to a bachelor’s degree. Given at a daigaku (college
or university). Preprofessional programs in medicine, dentistry, and veterinary medicine take 6 years.Shushi:• Graduate program taken at a daigaku that normally requires 2 years of study beyond the bachelor’s degree. Equivalent to a master’s degree in the United States.Professional degree programs: • Medical, dental, and veterinary graduate programs taken at daigaku that last 4 years beyond the bachelor’s degree.Hakushi:• Academic graduate program at a daigaku requiring at least 5 years beyond the bachelor’s degree. This degree is the equivalent of a doctorate in the United States.
Sources:
Marlow-Ferguson, r. (Ed.) (2002). World Education Encyclopedia: A Survey of Educational Systems Worldwide, Vol. 1 (2nd ed.). Farmington Hills, MI: Gale Group.
Ministry of Education, Culture, Sports, Science and Technology (MExT). Japan’s Education at a Glance 2005. Tokyo: Author. retrieved October 31, 2006, from http://www.mext.go.jp/english/statist/05101901.htm.
Organization for Economic Cooperation and Development. (1996). Education at a Glance: OECD Indicators. Paris: Author.
robitaille, D.F. (1997). National Contexts for Mathematics and Science Education: An Encyclopedia of the Education Systems Participating in TIMSS. Vancouver, Canada: Pacific Educational Press.

APPENDIx A: THE EDUCATION SYSTEMS OF THE G-8 COUNTrIES 91
The Education System in the Russian Federation
Figure A-6. Levels of education in the Russian Federation, by age and year of schooling: 2008
NOTE: Ages represent the typical age at the beginning of the school year. Numbers in bold print indicate ages of universal enrollment (i.e., an enrollment rate of more than 90 percent). Numbers shaded represent the age at which compulsory enrollment begins through the age at which compulsory enrollment ends. In some countries, enrollment rates may fall below universal before the ending age of compulsory education. No meaning should be inferred from width of subdivisions. Duration of first university degree program is generally 4 years in the Russian Federation. SOURCE: Miller, D.C., Sen, A., and Malley, L.B. (2007). Comparative Indicators of Education in the United States and Other G-8 Countries: 2006 (NCES 2007-006). National Center for Education Statistics, Institute of Education Sciences, U.S. Department of Education. Washington, DC.
Preprimary:Common name: • Doshkolnoe obrazovanieAges of attendance: As early as age 3 to age 6•Number of years: 1 to 4•Start of universal enrollment: Does not begin in preprimary; •see belowCompulsory: No•
Primary: Common name: • Nachal’noje obshchee obrazovanieAges of attendance: 7 to 10•Number of years: 4•Start of universal enrollment: Age 7•Compulsory: Yes•
NOTE: There are no formal divisions between primary, lower secondary, and upper secondary schools in the russian Federation. Primary, lower secondary, and upper secondary schools are generally located in the same buildings except in rural areas.
Lower secondary:Common name: • Osnovnoe obshchee obrazovanie (Basic school)Ages of attendance: 11 to 15•Number of years: 5•Universal enrollment: Yes, through age 14 (most students turn •16 during the last year of lower secondary school) Compulsory: Yes, until age 15•Entrance/exit criteria: Yes, in order to graduate from basic •school, students must pass four written examinations: one in russian language, one in algebra, and two in other subjects chosen by the student.
NOTE: Basic general education includes primary and lower secondary school. Graduates of lower secondary school may either continue their education at upper secondary school to receive secondary complete general education, go to vocational schools to receive professional training, or go to secondary vocational schools to receive a combination of academic and vocational education.
PreprimaryDoshkolnoe obrazovanie
ProfessionalProfessional’no-technicheskoe uchilische
AcademicSrednee (polnoe) obshchee obrasovanie
PrimaryNachal’noje obshchee obrazovanie
Lower secondaryOsnovnoe obshchee obrazovanie
Upper secondary
Postsecondary and tertiaryKolledž, technikum, universitet
Combined professional/academicKolledž, professional’ny litsei,
technikum
Year of schoolingAge
18
171615141312111098
67
543
11
10
9
8
6
7
5
4
3
2
1
ISCED97 levels 4–6
ISCED97 level 0
ISCED97 level 1
ISCED97 level 2
ISCED97 level 3

92 APPENDIx A: THE EDUCATION SYSTEMS OF THE G-8 COUNTrIES
Upper secondary:Common name: • Professional’no-technicheskoe uchilische; kolledž, professional’ny litsei, or technikum; srednee (polnoe) obshchee obrasovanie Ages of attendance: 16 to 17 (graduation generally at age 18)•Number of years: 2•Universal enrollment: No •Compulsory: No•Entrance/exit criteria: Students in the russian Federation •must pass five written exams at the end of secondary school in order to obtain the Certificate of Secondary Complete General Education. These exams include Algebra and Calculus, Literature, and three other subjects chosen by the student.
NOTE: Students who have graduated from lower secondary school have the option to continue in three types of upper secondary schools:
Professional’no-technicheskoe uchilische: • These schools provide professional education only in a program that usually lasts 2 years. Srednee (polnoe) obshchee obrasovanie: • Students who wish to continue their academic training enter these upper secondary schools, which last for 2 years and provide students with a Certificate of Secondary Complete General Education. This certificate qualifies students to apply for entrance into higher education. Graduates may also continue their study in initial and secondary vocational schools.Kolledž, professional’ny litsei, or technikum:• These schools provide combined professional and academic programs that lead to a diploma (Certificate of Secondary Complete General Education). The programs are usually 3 or 4 years.
Postsecondary and tertiary:Common name: • Kolledž, technikum, universitet Ages of attendance: Varies•Number of years: Varies according to degree•Universal enrollment: No•Entrance criteria: There are entrance exams, called • vstupitelnoe ispytanie, to be accepted into university. The number of exams and the subject varies according to the department a student wishes to attend, although all students must take an exam in russian language.
Common degree programs:Nonuniversity-level diploma: • Obtained from kolledž (colleges) and technikum (technical colleges). These diplomas are in applied or vocational fields and require 2 years of study after
secondary school. Students may be able to enter university-level institutions after completing this degree and transfer some or all credits toward a bakalavr.Diploma o nepolnom vysshem obrazovanii• (diploma of incomplete higher education): If students leave university after at least 2 years of study, they may ask for this diploma, which allows them to work in certain jobs that require some university experience but not a degree.Bakalavr• (bachelor’s degree): Program requiring 4 years of university study.Magistr • (master’s degree): Competitive 2-year program for students who have completed their bakalavr’s degree. Most require a year of research and a thesis.Diplom: • This specialized diploma can be obtained either by completing 1 year of study beyond the bakalavr or by complet-ing 5 to 6 years of continuous study after upper secondary school.Kandidat nauk: • Students who hold a diplom or magistr are eligible to apply for these programs, which typically last for 3 years and require students to carry out independent research and defend a dissertation in public. Equivalent of a doctorate in the United States.Doktor nauk:• This is the highest possible academic degree in the russian Federation, for which there is no U.S. equivalent. This degree requires that a kandidat nauk gain reputation in his or her field of study, publish independent research, and have experience supervising undergraduates. A 3-year sabbatical is often taken to prepare research for the degree, although there is no specified length of time required to obtain it. The doktor nauk requires a public dissertation defense (in addition to the defense completed to obtain a kandidat nauk).
Sources:
EuroEducation Net (2006). Education Systems in Europe: russia. London: EuroEducation. retrieved December 12, 2008, from http://www.euroeducation.net/prof/russco.htm.
Marlow-Ferguson, r. (Ed.) (2002). World Education Encyclopedia: A Survey of Educational Systems Worldwide, Vol. 2 (2nd ed.). Farmington Hills, MI: Gale Group.
Organization for Economic Cooperation and Development. (1996). Education at a Glance: OECD Indicators. Paris: Author.
robitaille, D.F. (1997). National Contexts for Mathematics and Science Education: An Encyclopedia of the Education Systems Participating in TIMSS. Vancouver, Canada: Pacific Educational Press.

APPENDIx A: THE EDUCATION SYSTEMS OF THE G-8 COUNTrIES 93
The Education System in the United Kingdom: The Education System in England, Northern Ireland, and Wales
Figure A-7. Levels of education in England, Northern Ireland, and Wales, by age and year of schooling: 2008
NOTE: There are differences within the education system of the United Kingdom because responsibilities and oversight for education take place at the regional or local level. However, the purpose of this document is to present a brief, general summary of education in the United Kingdom. The sources cited at the end of this section provide more specific details about education in the United Kingdom.
Preprimary:Common name: • Foundation stage/phase, nursery school/class, reception class, day nurseryAges of attendance: 3 to 4•Number of years: 1 to 2•Start of universal enrollment: Age 4•Compulsory: No•
NOTE: Within the foundation stage/phase, some students attend a “reception class” in primary school. This is comparable to kindergarten in the United States, with academic activities, and
provides a “bridge” between nursery school and key stage 1 for students who will achieve compulsory school age later in that academic year.
Primary: Common name: • Key stages 1 and 2, infant school, junior school Ages of attendance: 5 to 10 (England and Wales), 4 to 10 •(Northern Ireland)Number of years: 6 (England and Wales), 7 (Northern Ireland)•Universal enrollment: Yes•Compulsory: Yes•
NOTE: The primary school years are divided into stages. In England, these are key stage 1 and key stage 2. In Wales, from 2008, they will be known as the foundation phase and key stage 2. In Northern Ireland, from 2008, they will be known as the foundation stage, key stage 1 and key stage 2.
1 In Northern Ireland, however, compulsory enrollment begins at age 4. 2 In Northern Ireland, however, there are 14 years of schooling, with year 1 beginning at the preprimary level (age 4). NOTE: Ages represent the typical age at the beginning of the school year. Numbers in bold print indicate ages of universal enrollment (i.e., an enrollment rate of more than 90 percent). Numbers shaded represent the age at which compulsory enrollment begins through the age at which compulsory enrollment ends. In some countries, enrollment rates may fall below universal before the ending age of compulsory education. No meaning should be inferred from width of subdivisions. Duration of first university degree program is generally 3 years in England, Northern Ireland, and Wales. SOURCE: Miller, D.C., Sen, A., and Malley, L.B. (2007). Comparative Indicators of Education in the United States and Other G-8 Countries: 2006 (NCES 2007-006). National Center for Education Statistics, Institute of Education Sciences, U.S. Department of Education. Washington, DC.
PreprimaryFoundation stage, nursery school, reception class, day nursery
Postsecondary and tertiaryHigher education (HE), college, university
Further education (FE) college School sixth form, sixth form college
PrimaryKey stages 1 and 2, infant school, junior school
Lower secondaryKey stage 3, comprehensive school, grammar school, secondary modern school,
secondary school, high school, post-primary, academy
Upper secondaryKey stage 4, comprehensive school, grammar school, secondary modern school,
secondary school, high school, post-primary, academy
Year of schooling2Age1
18
17
16
15
14
13
12
11
10
9
8
6
7
5
4
3
12
13
11
10
9
8
6
7
5
4
3
2
1
ISCED97 levels 4–6
ISCED97 level 0
ISCED97 level 1
ISCED97 level 2
ISCED97 level 3

94 APPENDIx A: THE EDUCATION SYSTEMS OF THE G-8 COUNTrIES
Lower secondary:Common name: • Key stage 3, comprehensive school, grammar school, secondary modern school, secondary school, high school, post-primary, academyAges of attendance: 11 to 13•Number of years: 3•Universal enrollment: Yes•Compulsory: Yes•Entrance/exit criteria: No (except for grammar schools in •England and Northern Ireland, which set entrance criteria)
NOTE: Although lower and upper secondary school are typically combined in the United Kingdom, the first 3 years of secondary school are classified as lower secondary under the ISCED and are commonly referred to as “key stage 3.” Some areas have grammar schools and secondary modern schools, which enroll children with higher and lower achievement, respectively.
Upper secondary:Common name: • Key stage 4, key stage 5, comprehensive school, grammar school, secondary modern school, secondary school, high school, post-primary, academy, school sixth form, sixth form college, further education college Ages of attendance: 14 to 17 (graduation generally at age 18)•Number of years: 4•Universal enrollment: Through age 16•Compulsory: Until age 16•Entrance/exit criteria: In order to obtain the General Certificate •of Secondary Education (GCSE), students take a series of single-subject examinations after the first 2 years of upper secondary school (at age 15/16). The General Certificate of Education (GCE) Advanced levels (A levels) and the GCE Advanced Subsidiary examinations (AS levels) are similar tests taken in the sixth form (described below).
NOTE: After the first 2 years of upper secondary school, students take General Certificate of Secondary Education qualifications (GCSEs), typically at age 16. They then have the option of continuing school for 2 years, often called the sixth form. Some schools do not offer the sixth form, in which case students can transfer to a sixth form college (which is similar but in a separate school) or go to a further education college. Sixth forms usually offer General Certificate of Education Advanced Subsidiary qualifications (GCE AS levels) at age 17 and General Certificate of Education Advanced level examinations (GCE A levels) at age 18. GCE A levels are usually required for entry to higher education. An increasing range of GCSEs, A levels, and AS levels in applied (vocational) subjects is also being offered, along with a developing range of 14-19 Diplomas. Such 14-19 Diplomas involve part-time or full-time programs that combine vocational and academic studies in broad subject areas. They are suitable for 16- to 19-year-old adult learners or upper secondary students. Students are increasingly able to enter higher education with these parallel GCSE, A level, AS level, and 14-19 Diploma vocational qualifications. If students choose not to enter sixth form, their options are the labor force (often through apprenticeships or youth training courses) or a further education sector college. Further education sector colleges
have traditionally offered vocational courses, but increasingly have academic programs.
Postsecondary and tertiary:Common name: • Higher education (HE), college, university Ages of attendance: Varies•Number of years: Varies according to degree•Universal enrollment: No•Entrance criteria: GCE Advanced levels (A level) or equivalent, •such as A levels in applied subjects or the new 14-19 Diplomas, are required for admittance into the tertiary sector.
Common degree programs:Certificates of higher education:• 1-year vocational courses.Diploma: • Short undergraduate programs, which vary in length, offered at colleges and universities. (Not to be confused with the 14-19 Diplomas which are being introduced at the upper secondary level).Foundation degree: • Employment-related higher education qualification taking 2 years to complete and offered at colleges and universities.Bachelor’s degree: • 3- to 4-year academic programs at colleges or universities. Most students opt for an honors degree, the requirements of which are specific to schools and departments. Honors degrees are an entrance requirement for most graduate programs.Advanced short degree: • Short programs, which vary in length, for students who have already acquired a bachelor’s degree, for example, the postgraduate certificate of education. Courses offered are often professional development-oriented.Master’s degree:• A taught or research postgraduate degree offered at colleges and universities. One year or more beyond an honors bachelor’s degree.Professional degrees:• Advanced or extended programs in professional fields such as engineering, accounting, medicine, and information science. Number of years required to complete varies. Doctorate: • research-oriented postgraduate degree. Minimum of 3 years in duration.
Sources:
Eurybase. (2008). The Information Database on Education Systems in Europe: The Education System in the United Kingdom (England, Wales, and Northern Ireland), 2007/08 . Brussels: Eurydice. retrieved December 15, 2008, from http://eacea.ec.europa.eu/ressources/eurydice/eurybase/pdf/0_integral/UN_EN.pdf.
Marlow-Ferguson, r. (Ed.) (2002). World Education Encyclopedia: A Survey of Educational Systems Worldwide, Vol. 1 (2nd ed.). Farmington Hills, MI: Gale Group.
Organization for Economic Cooperation and Development. (1996). Education at a Glance: OECD Indicators. Paris: Author.
robitaille, D.F. (1997). National Contexts for Mathematics and Science Education: An Encyclopedia of the Education Systems Participating in TIMSS. Vancouver, Canada: Pacific Educational Press.

APPENDIx A: THE EDUCATION SYSTEMS OF THE G-8 COUNTrIES 95
NOTE: The education system in Scotland is different from that which exists in the rest of the United Kingdom. The Scottish Parliament is responsible for the overall supervision and development of the education system, while Scottish Government Education and Training has day-to-day responsibility for education, training, and life-long learning.
Preprimary:Common name: • Day nurseries, nursery classes, nursery schoolAges of attendance: As early as age 3 to age 4•Number of years: 1 to 2•Start of universal enrollment: Age 4•Compulsory: No•
Primary: Common name: • Primary schoolAges of attendance: 5 to 11•Number of years: 7•Universal enrollment: Yes•Compulsory: Yes•
Lower secondary:Common name: • Secondary schoolAges of attendance: 12 to 13 •Number of years: 2 •Universal enrollment: Through age 14 (most students turn 14 •during the last year of lower secondary school)Compulsory: Yes•Entrance/exit criteria: No •
Upper secondary:Common name: • Secondary school, community education center, further education college Ages of attendance: 14 to 17 (graduation generally at age 18)•Number of years: 4 •Universal enrollment: Through age 16•Compulsory: No•Entrance/exit criteria: A unified system of National Qualifica-•tions exams has been introduced for students in secondary schools, further education colleges, and training centers. At the end of upper secondary education, students generally take the
Figure A-8. Levels of education in Scotland, by age and year of schooling: 2008
NOTE: Ages represent the typical age at the beginning of the school year. Numbers in bold print indicate ages of universal enrollment (i.e., an enrollment rate of more than 90 percent). Numbers shaded represent the age at which compulsory enrollment begins through the age at which compulsory enrollment ends. In some countries, enrollment rates may fall below universal before the ending age of compulsory education. No meaning should be inferred from width of subdivisions. Duration of first university degree program is generally 3 or 4 years in Scotland. SOURCE: Miller, D.C., Sen, A., and Malley, L.B. (2007). Comparative Indicators of Education in the United States and Other G-8 Countries: 2006 (NCES 2007-006). National Center for Education Statistics, Institute of Education Sciences, U.S. Department of Education. Washington, DC.
The Education System in the United Kingdom: The Education System in Scotland
PreprimaryDay nurseries, nursery classes, nursery school
Postsecondary and tertiaryFurther education college, university
PrimaryPrimary school
Lower secondarySecondary school
Upper secondarySecondary school, community education centre, further education college
Year of schoolingAge
18
17
16
15
14
13
12
11
10
9
8
6
7
5
4
3
12
13
11
10
9
8
6
7
5
4
3
2
1
ISCED97 levels 4–6
ISCED97 level 0
ISCED97 level 1
ISCED97 level 2
ISCED97 level 3

96 APPENDIx A: THE EDUCATION SYSTEMS OF THE G-8 COUNTrIES
examinations for the Scottish Qualifications Certificate (SQC) at Standard Grade or National Qualifications courses/units. These examinations are intended to be taken by the whole school population. Students who plan to go into higher education take the higher level examinations of the SQC.
NOTE: During upper secondary school, students in Scotland have the option to continue in a traditional secondary school or to attend further education colleges. There are also nationally funded training and apprenticeship programs in which students can participate if they choose not to attend upper secondary school.
Postsecondary and tertiary:Common name:• Further education college, university Ages of attendance: Varies•Number of years: Varies according to course/degree•Universal enrollment: No•Entrance criteria: The usual entry requirements for university •are the higher or advanced higher level examinations of the SQC (see above). Further education colleges admit students who have just left school at age 16, students who have left school at age 17 or 18 with and without formal certification, and are now admitting an increasing number of older students. Admission requirements at further education colleges are decided by the institution.
Common degree programs:Certificates of higher education:• 1-year vocational courses.Diploma:• Short undergraduate programs, which vary in length, offered at colleges and universities.Bachelor’s degree: • Courses leading to an ordinary bachelor’s degree last 3 years, while courses leading to a degree with honors are typically 4 years. There are also some courses where the first award is a master’s degree.
Advanced short d• egree: Short programs, which vary in length, for students who have already acquired a bachelor’s degree; for example, the postgraduate diploma of education. Courses offered are often professional development-oriented.Master’s degree: • Taught master’s degrees are typically 1-year programs, but research master’s degrees are generally longer. Entrance into a master’s program generally requires a bachelor’s degree.Professional degree programs:• Advanced or extended programs leading to professional registration as a doctor, dentist, etc. that typically require 5 years beyond the bachelor’s degree. Doctorate:• A doctorate generally requires 3 years of full-time study or 4 to 6 years if part time.
Sources:
Eurybase. (2008). The Information Database on Education Systems in Europe: The Education System in the United Kingdom (Scotland), 2007/08. Brussels: Eurydice. retrieved December 15, 2008, from http://eacea.ec.europa.eu/ressources/eurydice/eurybase/pdf/0_integral/SC_EN.pdf.
Eurydice. (2007). Focus on the Structure of Higher Education in Europe 2006/07: National Trends in the Bologna Process. Brussels: Eurydice. retrieved January 15, 2009, from http://eacea.ec.europa.eu/ressources/eurydice/pdf/0_integral/086EN.pdf.
Marlow-Ferguson, r. (Ed.) (2002). World Education Encyclopedia: A Survey of Educational Systems Worldwide, Vol. 3 (2nd ed.). Farmington Hills, MI: Gale Group.
Organization for Economic Cooperation and Development. (1996). Education at a Glance: OECD Indicators. Paris: Author.
robitaille, D.F. (1997). National Contexts for Mathematics and Science Education: An Encyclopedia of the Education Systems Participating in TIMSS. Vancouver, Canada: Pacific Educational Press.

APPENDIx A: THE EDUCATION SYSTEMS OF THE G-8 COUNTrIES 97
The Education System in the United States
Figure A-9. Levels of education in the United States, by age and year of schooling: 2008
NOTE: Ages represent the typical age at the beginning of the school year. Numbers in bold print indicate ages of universal enrollment (i.e., an enrollment rate of more than 90 percent). Numbers shaded represent the age at which compulsory enrollment begins through the age at which compulsory enrollment ends. In some countries, enrollment rates may fall below universal before the ending age of compulsory education. No meaning should be inferred from width of subdivisions. Duration of first university degree program is generally 4 years in the United States. SOURCE: Miller, D.C., Sen, A., and Malley, L.B. (2007). Comparative Indicators of Education in the United States and Other G-8 Countries: 2006 (NCES 2007-006). National Center for Education Statistics, Institute of Education Sciences, U.S. Department of Education. Washington, DC.
NOTE: There are differences within the education system of the United States because responsibilities and oversight for education take place at the regional or local level. However, the purpose of this document is to present a brief, general summary of education in the United States. The sources cited at the end of this section provide more specific details about education in the United States.
Preprimary:Common name: • Nursery school, prekindergarten, kindergarten Ages of attendance: As early as age 3 to age 5•Number of years: 1 to 3•Start of universal enrollment: Does not begin in preprimary; •see below Compulsory: Generally no, but yes in some states•
Primary: Common name: • Elementary school, grade schoolAges of attendance: 6 to 11•Number of years: 6•Start of universal enrollment: Age 6•Compulsory: Yes•
NOTE: Based on the ISCED97, the first 6 years of schooling are classified as primary in the United States. Students may attend 5- or 6-year elementary schools. Some students also attend elementary schools that include eight grades.
Lower secondary:Common name: • Middle school, junior high school Ages of attendance: 12 to 14•Number of years: 3•Universal enrollment: Yes •Compulsory: Yes•Entrance/exit criteria: No•
NOTE: Based on the ISCED97, the 3 years of schooling following primary school are classified as lower secondary in the United States. Students may attend 2- or 3-year junior high schools or middle schools. Some students also attend combined junior-senior high schools.
Upper secondary:Common name: • High school, senior high schoolAges of attendance: 15 to 17 (graduation generally in the year of •
PreprimaryNursery school, prekindergarten, kindergarten
Postsecondary and tertiaryCommunity college, college, university
PrimaryElementary school, grade school
Lower secondaryMiddle school, junior high school
Upper secondaryHigh school, senior high school
Year of schoolingAge
18
17
1615141312111098
67
5
4
3
12
11
10
9
8
6
7
5
4
3
2
1
ISCED97 levels 4–6
ISCED97 level 0
ISCED97 level 1
ISCED97 level 2
ISCED97 level 3

98 APPENDIx A: THE EDUCATION SYSTEMS OF THE G-8 COUNTrIES
the student’s 18th birthday, though this can vary depending on a student’s birth date and the state’s kindergarten cut-off date)Number of years: 3•Universal enrollment: Through age 16 (most students turn 18 •during the last year of upper secondary school) Compulsory: The average ending age of compulsory education •in the United States is 17. This age varies across states, ranging from 16 to 18; the modal age is 16 Entrance/exit criteria: There are not generally entrance exams, •although some states have begun instituting exit examinations that are required to receive a diploma. College-bound students usually take the Scholastic Aptitude Test (SAT) or ACT Assess-ment (ACT), privately administered standardized tests that partly determine college admittance. Admittance is also affected by previous grades, coursework, and other factors such as teacher recommendations and extracurricular participation.
NOTE: Based on the ISCED97, the last 3 years of schooling prior to receiving a high school diploma are classified as upper secondary in the United States. Senior high schools may be 3 or 4 years in length. Some students attend combined junior-senior high schools.
Postsecondary and tertiary:Common name: • Community college, college, universityAges of attenda• nce: VariesNumber of years: Varies according to degree•Universal enrollment: No•Entrance criteria: Varies according to degree. Students in •the United States usually take the SAT or ACT (see above) as part of the entrance requirements for higher education. Most colleges and universities set their own admissions standards, so the requirements vary substantially from institution to institution.
Common degree programs:Certificate programs:• Vocational programs of 6 months to 1 year offered in public community colleges and private for-profit trade schools.Associate’s degrees: • 2-year programs offered in fields of study that prepare students for the labor force or entry into a 4-year college or university. Granted at vocational and technical institutes as well as community colleges.
Bachelor’s degrees: • 4-year academic programs at a college or university that prepare students for the labor force or graduate study.Master’s degrees:• Graduate program at a university that requires 2 years of study beyond the bachelor’s degree and leads to a master’s degree.Professional degrees:• Graduate programs such as medicine or law taken at a university medical or law school. Typically require 3 or more years beyond the bachelor’s degree and result in specialized degrees such as the Medical Doctorate (M.D.) or Juris Doctor (J.D.).Doctorate:• Academic graduate program at a university typically requiring a minimum of 3 or 4 years of study and research beyond the bachelor’s degree.
Sources:
Marlow-Ferguson, r. (Ed.) (2002). World Education Encyclopedia: A Survey of Educational Systems Worldwide, Vol. 1 (2nd ed.). Farmington Hills, MI: Gale Group.
Organization for Economic Cooperation and Development. (1996). Education at a Glance: OECD Indicators. Paris: Author.
robitaille, D.F. (1997). National Contexts for Mathematics and Science Education: An Encyclopedia of the Education Systems Participating in TIMSS. Vancouver, Canada: Pacific Educational Press.
Sen, A., Partelow, L.A., and Miller, D.C. (2005). Comparative Indica-tors of Education in the United States and Other G8 Countries: 2004 (NCES 2005-021). National Center for Education Statistics, Institute of Education Sciences, U.S. Department of Education. Washington, DC.
Sherman, J.D., Honneger, S.D., and McGivern, J.L. (2003). Compara-tive Indicators of Education in the United States and Other G8 Countries: 2002 (NCES 2003-026). National Center for Education Statistics, Institute of Education Sciences, U.S. Department of Education. Washington, DC.
Snyder, T.D. (2008). Mini-Digest of Education Statistics, 2007 (NCES 2008-023). National Center for Education Statistics, Institute of Education Sciences, U.S. Department of Education. Washington, DC.

Appendix BPIRLS 2006 Indicator Tables
Including Canadian Provincial Data
Appendix B

100 APPENDIx B: PIrLS 2006 INDICATOr TABLES INCLUDING CANADIAN PrOVINCIAL DATA
Table B1. Average scale scores of fourth-grade students in reading literacy, by jurisdiction: 2006
Jurisdiction Score
Canada, Alberta 560Canada, British Columbia 558Canada, Nova Scotia 542Canada, Ontario 555Canada, Quebec 533England 539France 522Germany 548Italy 551russian Federation 565Scotland1 527United States1 540
1 Met international guidelines for participation rates only after substitute schools were included. That is, to avoid sample size losses resulting from sampled schools not participating, a mechanism was instituted to identify, a priori, substitute schools that have similar characteristics to the sampled schools that they may replace.SOURCE: Mullis, I.V.S., Martin, M.O., Kennedy, A.M., and Foy, P. (2007). PIRLS 2006 International Report: IEA’s Progress in International Reading Literacy Study in Primary Schools in 40 Countries, exhibit 1.1. Chestnut Hill, MA: TIMSS & PIRLS International Study Center, Boston College.
Table B2. Percentage of fourth-grade students reaching PIRLS international benchmarks in reading literacy, by jurisdiction: 2006
Jurisdiction Low Intermediate High Advanced
Canada, Alberta 99 89 57 17Canada, British Columbia 98 88 56 16Canada, Nova Scotia 96 82 48 13Canada, Ontario 98 87 54 16Canada, Quebec 97 83 41 6England 93 78 48 15France 96 76 35 5Germany 97 87 52 11Italy 98 87 52 14russian Federation 98 90 61 19Scotland1 93 77 40 10United States1 96 82 47 12
1 Met international guidelines for participation rates only after substitute schools were included. That is, to avoid sample size losses resulting from sampled schools not participating, a mechanism was instituted to identify, a priori, substitute schools that have similar characteristics to the sampled schools that they may replace.SOURCE: Mullis, I.V.S., Martin, M.O., Kennedy, A.M., and Foy, P. (2007). PIRLS 2006 International Report: IEA’s Progress in International Reading Literacy Study in Primary Schools in 40 Countries, exhibit 2.1. Chestnut Hill, MA: TIMSS & PIRLS International Study Center, Boston College.

APPENDIx B: PIrLS 2006 INDICATOr TABLES INCLUDING CANADIAN PrOVINCIAL DATA 101
Table B3. Average scale scores of fourth-grade males and females in reading literacy, by jurisdiction: 2006
Jurisdiction Males Females Difference
Canada, Alberta 556 564 -8Canada, British Columbia 554 562 -9Canada, Nova Scotia 531 553 -21Canada, Ontario 549 562 -13Canada, Quebec 527 539 -13England 530 549 -19France 516 527 -11Germany 544 551 -7Italy 548 555 -7russian Federation 557 572 -15Scotland1 516 538 -22United States1 535 545 -10
1 Met international guidelines for participation rates only after substitute schools were included. That is, to avoid sample size losses resulting from sampled schools not participating, a mechanism was instituted to identify, a priori, substitute schools that have similar characteristics to the sampled schools that they may replace.SOURCE: Mullis, I.V.S., Martin, M.O., Kennedy, A.M., and Foy, P. (2007). PIRLS 2006 International Report: IEA’s Progress in International Reading Literacy Study in Primary Schools in 40 Countries, exhibit 1.4. Chestnut Hill, MA: TIMSS & PIRLS International Study Center, Boston College.
Table B4. Percentage distribution of fourth-grade students receiving reading instruction each week, by teacher reports of average number of hours spent on reading instruction each week and jurisdiction: 2006
Jurisdiction 3 hours or lessMore than 3 and up to and including 6 hours More than 6 hours
Canada, Alberta 30 40 30Canada, British Columbia1 24 36 40Canada, Nova Scotia 24 34 42Canada, Ontario 27 34 39Canada, Quebec 37 43 20England 67 25 8France 23 48 29Germany1 71 23 6Italy 51 30 19russian Federation 12 60 28Scotland1,2 45 43 12United States2 10 22 68
1 Data are available for at least 70 percent, but less than 85 percent, of the students. Missing data have not been explicitly accounted for in the data. 2 Met international guidelines for participation rates only after substitute schools were included. That is, to avoid sample size losses resulting from sampled schools not participating, a mechanism was instituted to identify, a priori, substitute schools that have similar characteristics to the sampled schools that they may replace.NOTE: Detail may not sum to totals because of rounding.SOURCE: Mullis, I.V.S., Martin, M.O., Kennedy, A.M., and Foy, P. (2007). PIRLS 2006 International Report: IEA’s Progress in International Reading Literacy Study in Primary Schools in 40 Countries, exhibit 5.11. Chestnut Hill, MA: TIMSS & PIRLS International Study Center, Boston College.

102 APPENDIx B: PIrLS 2006 INDICATOr TABLES INCLUDING CANADIAN PrOVINCIAL DATA
Table B5. Percentage of fourth-graders whose teachers reported employing specific strategies for assisting students having difficulty reading, by jurisdiction: 2006
Jurisdiction
Wait to see if performance
improves with maturation
Work with student
individually
Have other students
work with student
Assign homework to help student
catch up
Ask parents to help
student with reading
Have student work
in regular classroom
with teacher aide
Have student work in regular
classroom with reading
specialist
Have student work in
remedial classroom
with reading specialist
Canada, Alberta 31 90 77 54 98 53 16 39Canada, British Columbia 36 89 67 40 96 47 26 65Canada, Nova Scotia 27 95 74 52 96 40 22 65Canada, Ontario 23 94 76 56 94 36 15 37Canada, Quebec 44 70 75 38 97 24 46 34England 34 78 53 39 99 72 28 50France 41 82 58 23 84 11 14 23Germany 25 80 69 63 98 8 5 33Italy 48 92 83 72 93 22 1 4russian Federation 65 89 67 94 99 26 5 27Scotland1 17 92 45 68 96 67 18 51United States1 32 89 80 45 97 31 15 50
1 Met international guidelines for participation rates only after substitute schools were included. That is, to avoid sample size losses resulting from sampled schools not participating, a mechanism was instituted to identify, a priori, substitute schools that have similar characteristics to the sampled schools that they may replace. SOURCE: International Association for the Evaluation of Educational Achievement, Progress in International Reading Literacy Study (PIRLS), 2006.
Table B6. Percentage distribution of fourth-graders, by teacher reports of availability of remedial reading specialist and jurisdiction: 2006
Jurisdiction Always Sometimes Never
Canada, Alberta 13 44 42Canada, British Columbia1 23 58 19Canada, Nova Scotia 25 61 14Canada, Ontario 17 41 42Canada, Quebec 5 40 56England 24 60 16France 6 33 61Germany 5 35 59Italy # 5 95russian Federation 15 22 63Scotland2 18 36 46United States2 34 37 29
# Rounds to zero.1 Data are available for at least 70 percent, but less than 85 percent, of the students. Missing data have not been explicitly accounted for in the data.2 Met international guidelines for participation rates only after substitute schools were included. That is, to avoid sample size losses resulting from sampled schools not participating, a mechanism was instituted to identify, a priori, substitute schools that have similar characteristics to the sampled schools that they may replace.NOTE: Availability of remedial reading specialist indicates that a specialist was available either in the classroom or in a remedial reading classroom. Detail may not sum to totals because of rounding. SOURCE: Mullis, I.V.S., Martin, M.O., Kennedy, A.M., Foy, P. (2007). PIRLS 2006 International Report: IEA’s Study of Reading Literacy Achievement in Primary Schools in 40 Countries, exhibit 5.18. Chestnut Hill, MA: TIMSS & PIRLS International Study Center, Boston College.

APPENDIx B: PIrLS 2006 INDICATOr TABLES INCLUDING CANADIAN PrOVINCIAL DATA 103
Table B7. Difference in percentage points of fourth-grade students with teachers ages 29 years or younger and 50 years or older as reported by teachers, by jurisdiction: 2001 and 2006
Jurisdiction 29 years or younger 50 years or older
Canada, Alberta1 — —Canada, British Columbia1 — —Canada, Nova Scotia1 — —Canada, Ontario2 — —Canada, Quebec2 — —England3 2 3France 7 -5Germany -2 -4Italy -1 6russian Federation -11 1Scotland3 12 8United States3 8 -12
— Not available. 1 Did not participate in Progress in International Reading Literacy Study (PIRLS) in 2001. 2 Ontario and Quebec reported data from PIRLS 2001 as a combined jurisdiction. 3 Met international guidelines for participation rates only after substitute schools were included. That is, to avoid sample size losses resulting from sampled schools not participating, a mechanism was instituted to identify, a priori, substitute schools that have similar characteristics to the sampled schools that they may replace. For England, this applies to 2001 only.SOURCE: Mullis, I.V.S., Martin, M.O., Gonzalez, E.J., and Kennedy, A.M. (2003). PIRLS 2001 International Report: IEA’s Study of Reading Literacy Achievement in Primary Schools in 35 Countries, exhibit 6.1. Chestnut Hill, MA: TIMSS & PIRLS International Study Center, Boston College; Mullis, I.V.S., Martin, M.O., Kennedy, A.M., and Foy, P. (2007). PIRLS 2006 International Report: IEA’s Progress in International Reading Literacy Study in Primary Schools in 40 Countries, exhibit 6.3. Chestnut Hill, MA: TIMSS & PIRLS International Study Center, Boston College.
Table B8. Average number of years of teaching experience (at all grades) as reported by teachers of fourth-grade students, by jurisdiction: 2001 and 2006
Jurisdiction 2006 2001
Canada, Alberta1 15 —Canada, British Columbia1 17 —Canada, Nova Scotia1 18 —Canada, Ontario2 12 —Canada, Quebec2 17 —England3 12 14France 15 18Germany 20 23Italy 22 22russian Federation 22 19Scotland3 16 18United States3 12 15
— Not available. 1 Did not participate in Progress in International Reading Literacy Study (PIRLS) in 2001. 2 Ontario and Quebec reported data from PIRLS 2001 as a combined jurisdiction. 3 Met international guidelines for participation rates only after substitute schools were included. That is, to avoid sample size losses resulting from sampled schools not participating, a mechanism was instituted to identify, a priori, substitute schools that have similar characteristics to the sampled schools that they may replace. For England, this applies to 2001 only.SOURCE: Mullis, I.V.S., Martin, M.O., Gonzalez, E.J., and Kennedy, A.M. (2003). PIRLS 2001 International Report: IEA’s Study of Reading Literacy Achievement in Primary Schools in 35 Countries, exhibit 6.1. Chestnut Hill, MA: TIMSS & PIRLS International Study Center, Boston College; Mullis, I.V.S., Martin, M.O., Kennedy, A.M., and Foy, P. (2007). PIRLS 2006 International Report: IEA’s Progress in International Reading Literacy Study in Primary Schools in 40 Countries, exhibit 6.3. Chestnut Hill, MA: TIMSS & PIRLS International Study Center, Boston College.