Embed Size (px)
Citation preview

M.L. DavissonT.P. Rose
September 1997
This is an informal report intended primarily for internal or limited externaldistribution. The opinions and conclusions stated are those of the author and mayor may not be those of the Laboratory.
Work performed under the auspices of the U.S. Department of Energy by theLawrence Livermore National Laboratory under Contract W-7405-Eng-48.
Lawre
nce
Liverm
ore
National
Labora
tory
UCRL-ID-128423
Comparative Isotope Hydrology Study of GroundwaterSources and Transport in the Three Cascade Volcanoes of
Northern California

DISCLAIMER
This document was prepared as an account of work sponsored by an agency of the United States Government. Neither the United States Governmentnor the University of California nor any of their employees, makes any warranty, express or implied, or assumes any legal liability orresponsibility for the accuracy, completeness, or usefulness of any information, apparatus, product, or process disclosed, or represents that its usewould not infringe privately owned rights. Reference herein to any specific commercial product, process, or service by trade name, trademark,manufacturer, or otherwise, does not necessarily constitute or imply its endorsement, recommendation, or favoring by the United StatesGovernment or the University of California. The views and opinions of authors expressed herein do not necessarily state or reflect those of theUnited States Government or the University of California, and shall not be used for advertising or product endorsement purposes.
This report has been reproduceddirectly from the best available copy.
Available to DOE and DOE contractors from theOffice of Scientific and Technical Information
P.O. Box 62, Oak Ridge, TN 37831Prices available from (423) 576-8401
Available to the public from theNational Technical Information Service
U.S. Department of Commerce5285 Port Royal Rd.,
Springfield, VA 22161
1
Comparative Isotope Hydrology Study of Groundwater Sources and
Transport in the Three Cascade Volcanoes of Northern California
M.L. Davisson and T.P. Rose
Isotope Sciences Division
Lawrence Livermore National Laboratory
P.O. Box 808 L-231
Livermore, CA 94550
ABSTRACT
Quaternary-age volcanic peaks of Mt. Lassen, Mt. Shasta, and Medicine Lake Volcano
preferentially recharge and transport large volumes of annual precipitation into mega-scale
channels hosted in underlying volcanic layers. At the terminus of laterally extensive lava
flows, or in deep incisions of these layers, groundwater emerges as large volume cold
springs. The combined discharge of these springs contributes half the annual storage
capacity of Shasta Reservoir, and is utilized to generate 2000 gigawatts of hydroelectric
power each year. Moreover, the springs provide a natural habitat for many rare and
endangered species. In the Hat Creek Valley, located north of Mt. Lassen, Rose et al.
(1996) showed that the low δ18O discharge of large volume springs at Rising River and
Crystal Lake originates from snow melt in the high elevation, high precipitation region
surrounding Lassen Peak. Groundwater transport in this basin is enhanced by the
occurrence of the Quaternary Hat Creek basalt flow, which extends nearly the entire length
of Hat Creek Valley. In contrast, the δ18O values of large-volume springs that discharge in
the Mt. Shasta region indicate a larger percentage of local recharge at lower elevations since
the high elevation snow melt on the volcano is depleted by >1 per mil relative to the largest
springs. The δ18O value of the Fall River Springs (FRS) system is similar to small springs
that occur at high elevations on Medicine Lake Volcano. The large volume of the FRS
discharge coupled with a lack of surficial drainages in this area indicates that a large
percentage of the annual precipitation over an ~750 mi2 area of the Medicine Lake volcanic
plateau goes to recharge the FRS aquifer system. Groundwater transport to the FRS is
enhanced by the occurrence of the 10 kyr Giant Crater lava flow, a single geologic unit that
extends from the base of Medicine Lake Volcano to the FRS.
2
Dissolved magmatic CO2 derived from the Quaternary volcanic centers is observed in
many of the large volume springs in the southern Cascade Range. For example, the
radiocarbon concentration in Rising River Springs is 80 pmc, which indicates at least 20%
of its dissolved inorganic carbon is derived from a magmatic source in the Lassen region.
The radiocarbon activity in the FRS is as low as 73 pmc, indicating a minimum
contribution of 27% magmatic CO2 from Medicine Lake volcano. Magmatic CO2 fluxes in
the Shasta region are highest around the base of the volcano, where low-volume, CO2-rich,14C-absent soda springs occur. Relatively large quantities of magmatic CO2 are observed
in the Big Springs of the McCloud River, which have a δ18O signature consistent with low
elevation recharge in the Shasta region.
Differences in the isotopic characteristics of the major spring systems at Mt. Shasta
relative to Mt. Lassen and Medicine Lake Volcano reflect significant differences in the
geomorphology of the volcanoes. In particular, the composite nature of the Shasta
stratocone tends to limit the depth of groundwater recharge, confining the majority of
groundwater flow to the shallowest layers, which tend to be of more local extent. The
lower permeability of the composite cone also acts as a trap for magmatic CO2 emissions,
generally limiting the gas discharge to localized fracture zones at lower elevations. At Mt.
Lassen and Medicine Lake Volcano, groundwater recharge occurs primarily at high
elevations, along vertical fracture systems with high permeabilities. These features,
combined with laterally extensive basalt flows, act to focus groundwater transport deeper
and over longer lateral distances. The magmatic CO2 dissolution process probably occurs
in close proximity to the geothermal systems at Lassen and Medicine Lake, where CO2 gas
escaping along deep fractures encounters downward percolating groundwater.
INTRODUCTION
The landscape of northeastern California is dominated by the three Quaternary-age
volcanic centers of Mt. Lassen, Mt. Shasta, and Medicine Lake Volcano (Fig. 1). Dotting
the landscape around these volcanic centers are some of the largest volume springs in the
United States (Meinzer, 1927). These springs, whose combined flow nearly equals 3000
cubic feet per second (cfs), provide virtually all of the base flow component to the Upper
Sacramento, McCloud, and Pit Rivers. In addition, the spring flow supplies nearly half of
the 4.6 million acre-ft storage capacity of Lake Shasta each year, and is utilized in
hydroelectric power generators along the Pit River and Hat Creek to produce >2000
3
gigawatts of power annually (Bowers, personal communication). The discharge areas of
these springs have created a unique natural wetland habitat for several rare aquatic species,
some of which are listed as endangered or threatened species (Ellis, 1997).
The large volume springs characteristically discharge at the terminus of Quaternary lava
flows, or along deep erosional incisions in these flows. The large discharge rates and cold
temperatures (<12°C) of the springs, coupled with observed seasonal fluctuations in their
flow rates, requires relatively shallow aquifer systems (generally <1000 feet deep) that are
annually recharged by high elevation snow melt (Rose et al., 1996; Manga, 1997). In
addition, the dissolved inorganic carbon in many of these springs shows isotopic evidence
for the incorporation of significant amounts of magmatic CO2 derived from nearby volcanic
centers (Rose and Davisson, 1996).
This report presents new isotopic data for spring waters and surface runoff originating
from recharge areas in the Cascade Range of northern California. These data provide
insight into the recharge and flow characteristics of the groundwater systems that supply
the large volume springs. Comparison of the flow systems around the three main volcanic
centers (Shasta, Lassen and Medicine Lake) provides strong evidence that the groundwater
flow system in the Medicine Lake area is remarkably similar to that of the Hat Creek Basin
system described by Rose et al. (1996). Moreover, isotopic data for groundwaters in the
Fall River-Medicine Lake region reveals a strong connection between recharge areas on
Medicine Lake volcano and the discharge at the Fall River Springs.
HYDROGEOLOGIC SETTING
Although the Mt. Lassen, Mt. Shasta, and Medicine Lake volcanoes are all associated
with the same volcanic arc complex (e.g. Christiansen, 1982), their surface expressions are
highly distinct from one another. These morphological differences play a significant role in
in determining how groundwater is transported in each system. Mt. Shasta is an andesite-
dacite stratovolcano that was constructed in four brief eruptive episodes over the past 450
4
ka, with extended pauses dominated by erosion. As a result, the surficial geologic
landscape of Shasta is characterized by numerous fragmented volcanic deposits
(Christiansen, 1982) wherein continuous volcanic layers are limited in aerial extent (Fig.
1). The largest springs in the Mt. Shasta region occur at Big Springs (>700 cfs), which
discharge in the canyon of the upper McCloud River. Several large springs also occur
along the upper Sacramento River canyon. In each case, these springs emanate from lava
flows that were exposed by deep erosional incision along river channels. In addition,
numerous smaller springs dot the lower reaches of Mt. Shasta, emerging from the erosional
remnants of the dissected lava flows that comprise the stratocone.
The Lassen Volcanic Center contains hundreds of small- to intermediate-volume eruptive
centers of mostly mafic composition that surround a few larger volume intermediate- to
silicic-volcanic centers (e.g. Clynne, 1990). Lassen Peak itself is a large dacitic dome that
rests on the erosional remnants of an older stratocone. Just north of Lassen Peak is the Hat
Creek Valley, a graben-like feature bounded by northwest-trending normal faults (Muffler
et. al., 1994). The floor of Hat Creek Valley is covered by the 15 kyr Hat Creek Basalt
flow, which extends from an eruptive center near the base of Mt. Lassen northward for a
distance of ~30 km. This unit is in turn underlain by a thick sequence of older basaltic and
andesitic deposits that are locally exposed along the fault scarp of the Hat Creek Rim.
Rising River Springs emerge at the terminus of the Hat Creek Basalt flow with a historical
average flow rate of 300 cfs. Crystal Lake, a spring-fed lake located a few kilometers NW
of Rising River, discharges an additional 100 cfs from the older lava flows underlying the
Hat Creek basalt.
Medicine Lake Volcano is a broad shield volcano with a shallow caldera located near its
crest. It comprises mostly basaltic to andesitic deposits, with more recent silicic volcanic
deposits limited to high elevations on the volcano (Christiansen, 1982). The summit area is
underlain by a young rhyolitic intrusion. The Giant Crater lava field consists of a series of
laterally extensive 10.5 kyr basalt flows (Donnelly-Nolan et. al., 1991) that stretch from

5
the southern flank of the volcano southward for a distance of 40 km (Fig. 1). Both
Medicine Lake Volcano and the Giant Crater lava field have virtually no surface water
drainages, even during the springtime melting of the snowcap. As a result, the largest
spring group in California emerges along a 10 km wide belt at the terminus of the Giant
Crater lava field. This series of springs combine to form the ~1200 cfs flow of the Fall
River.
It is notable that both the Lassen Volcanic Center and Medicine Lake Volcano are
underlain by relatively shallow geothermal systems (Muffler et al., 1982; Evans and Zucca,
1988). However, whereas the Lassen geothermal system has numerous surface
expressions of geothermal activity, the Medicine Lake geothermal system is relatively
tightly sealed.
Regional Precipitation Patterns and their Influence on Spring Discharge
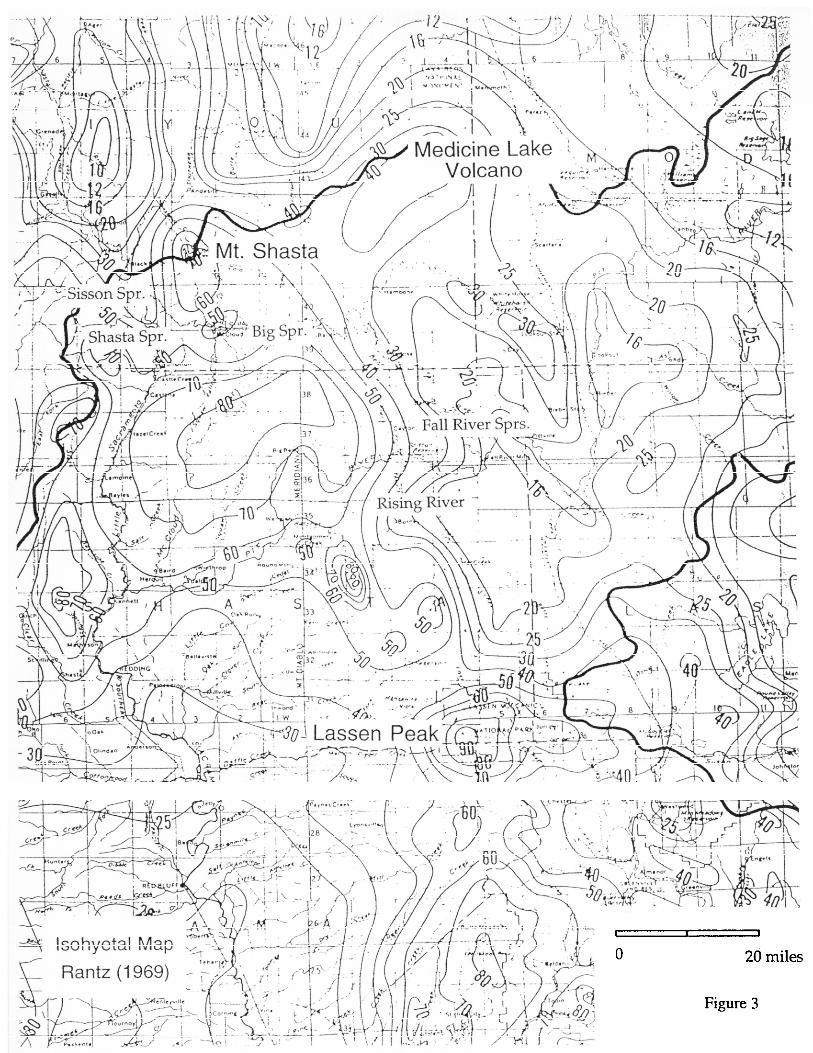
Precipitation rates are highest at high elevation peaks in northern California (see Fig. 3;
data from Rantz, 1969). Lassen Peak averages around 90 inches of rainfall equivalent per
year, mostly as accumulated snow. Mt. Shasta and Medicine Lake Volcano also have local
maximums that average 70 and 40 inches per year, respectively. In the Shasta area, annual
precipitation rates of up to 80 inches per year occur at lower elevations south of Shasta
Peak. Likewise, local maximums also occur in the Clover Mtn. area (90 inches) on the
west side of Hat Creek Valley. Rain shadows occur on the back side of each of the
volcanic peaks, where annual precipitation rates can drop as low as 15 inches per year.
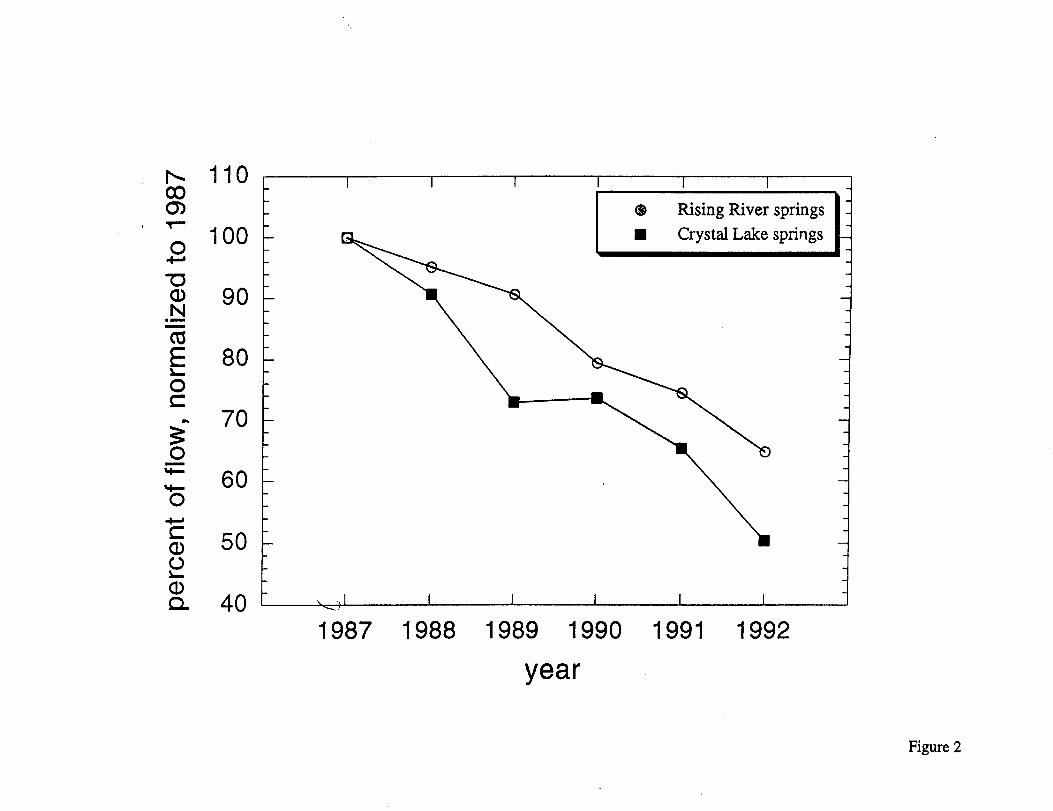
Large volume spring discharge rates in the Hat Creek Valley are variable in time and
have been shown to have direct and near-immediate links to precipitation rates in their
recharge areas (see Manga, 1997). For example, Rose et al. (1996) showed that Rising
River and Crystal Lake springs decreased in flow as much as ~50% during the drought of
1987 to 1992, which was approximately equivalent to the decrease in the annual snow pack
during that time (Fig. 2). A 50% decrease in flow from the Fall River Springs is also
6
reported to have occurred in response to the 1987-1992 drought (Bowers, personal
communication).
METHODS
The δ18O and δD values of groundwater provide useful indicators of recharge and flow
patterns in the Sierra Nevada and southern Cascade Ranges. The isotopic composition of
precipitation varies as a function of elevation and distance from the ocean (Dansgaard,
1964; Smith et. al., 1979). In regions where topographic variations are large, such as the
southern Cascades, groundwater that originates from high elevation recharge is readily
distinguishable from lower elevation recharge, and regional groundwater flow systems can
be distinguished from localized systems (e.g. Rose et al., 1996).
Water samples were collected throughout the study area in small glass bottles with air-
tight caps to prevent evaporation. The samples were analyzed for their 18O/16O and
deuterium/hydrogen (D/H) ratios, respectively, using the water equilibration method
(Epstein and Mayeda, 1953) and the zinc reduction technique (Coleman et. al., 1982).
Isotopic analyses were performed on a VG Prism isotope ratio mass spectrometer. The
results of all stable isotope analyses are reported in the usual delta notation where
δ = RsaRstd
− 1
1000 ,
Rsa is the isotopic ratio of the sample, and Rstd is the isotopic ratio of a standard, which in
this case is either Standard Mean Ocean Water for the δD and δ18O (Craig, 1961a), or Pee
Dee Belemnite for the δ13C. Reproducibility is ±0.1 per mil for δ18O and ±1.0 per mil for
δD.
Radiocarbon has been used as a groundwater dating tool for decades (see Fontes, 1994).
In the Cascade groundwater systems, however, aquifer residence times are too short to

7
incur any significant decay (half life = 5730 years) in radiocarbon concentrations (see Rose
et al., 1996 and Rose and Davisson, 1996). Nevertheless, radiocarbon concentrations
have been used effectively to trace the interaction of regional groundwater with
radiocarbon-depleted magmatic CO2 (Rose and Davisson, 1996). Furthermore, dual
analyses of the stable 13C and radiocarbon of dissolved inorganic carbon in these waters
provides a means to graphically distinguish different sources of carbon.
Carbon isotope samples were collected in 125 or 250 ml amber glass bottles with a 1/8"
septa cap, poisoned with a few drops of saturated HgCl2 solution, and stored refrigerated
no more than one month. The dissolved inorganic carbon is converted to CO2 gas by
acidification with orthophosphoric acid, liberated under vacuum using an ultrapure carrier
gas, and trapped cryogenically (McNichol et. al., 1994; Davisson and Velsko, 1994). The
CO2 sample is then split, and one aliquot is measured for its δ13C value on the VG Prism
while the other is converted to graphite at 570°C under closed conditions using H2 gas in
the presence of a cobalt catalyst. The graphite is loaded into an aluminum target and
analyzed for its radiocarbon content on the accelerator mass spectrometer at LLNL. The
results are reported in percent modern carbon (pmc), that results from a normalization to a
pre-1950 atmospheric radiocarbon standard. Analytical reproducibility is ±0.2 per mil for
δ13C and ±1.0 pmc for radiocarbon.
RESULTS
Mt. Lassen and the Hat Creek Valley
Stable isotope and radiocarbon values were measured for large and small volume spring
discharges, thermal springs, and surface water samples collected throughout the Lassen-
Hat Creek region (see Table 1). Rose et al. (1996) showed that the large volume spring
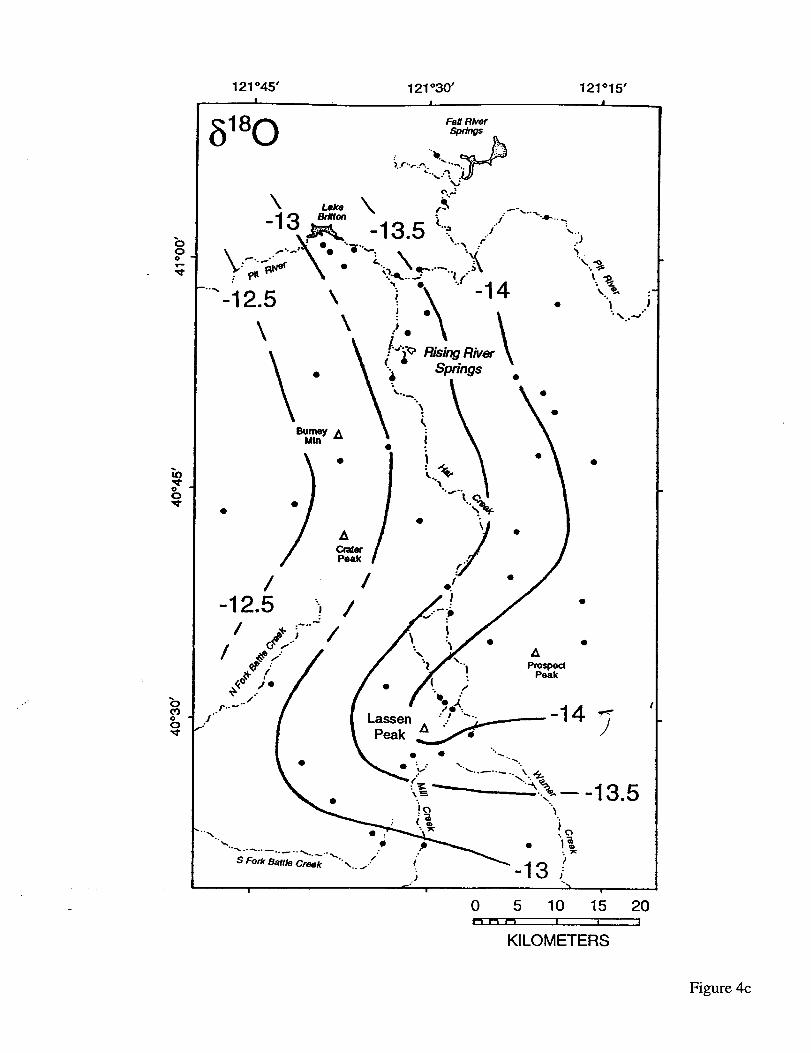
discharges at Rising River and Crystal Lake (Fig. 4a) had distinctly lower δ18O values
(Fig. 4b) than low volume springs from the same area (Fig. 4c). The low volume springs
8
throughout the Lassen-Hat Creek region reflect regional δ18O variations in precipitation that
result from rain-out effects during storm track migration from west to east across the Sierra
Nevada Range (e.g. Smith et. al., 1979; Ingraham and Taylor, 1991). Since the δ18O
values for Rising River and Crystal Lake were inconsistent with this regional isotopic
pattern, it was determined that the only possible recharge area for these springs was the
Lassen volcanic highlands (Fig. 4c). Specifically, the Lassen highlands were the only
nearby location where the precipitation rates were high enough, and the δ18O values were
low enough to provide a viable recharge area. The long-range (45 km) transport of
groundwater from the Lassen region is structurally controlled by the Hat Creek Fault and
the Hat Creek basalt flow, where the latter acts as a cap and shallow conduit for
groundwater transport. The large volume springs emerge from the terminus of the Hat
Creek basalt.
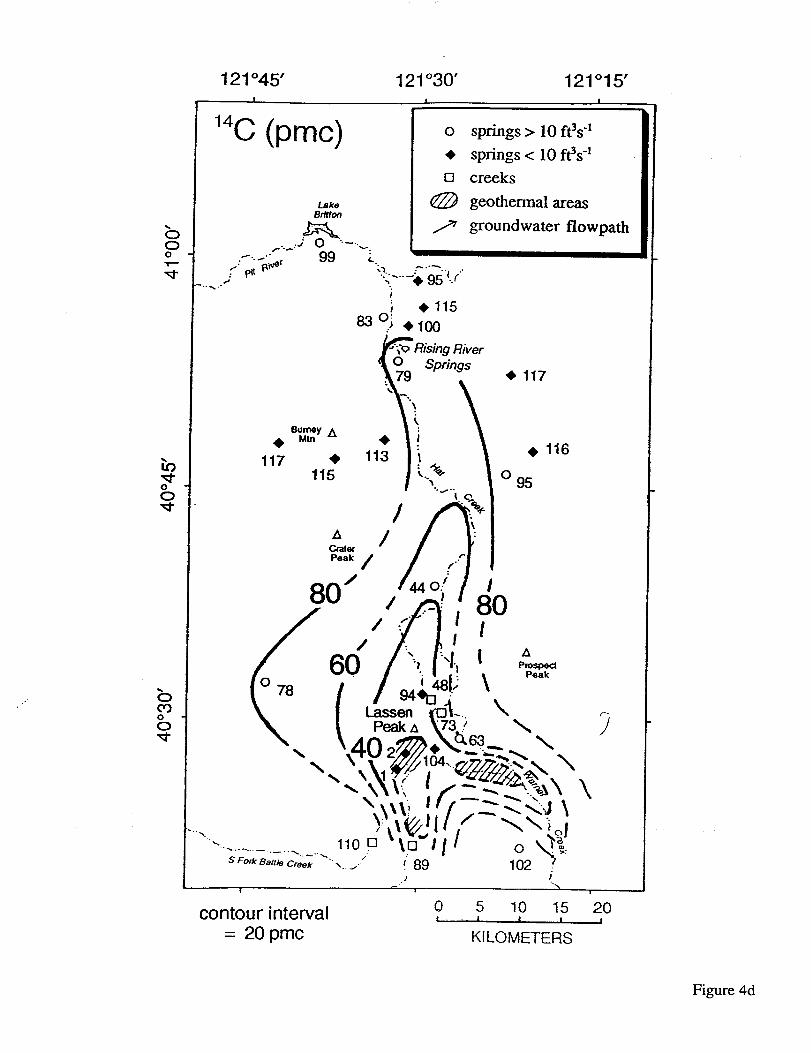
Radiocarbon measurements of groundwaters from this region are also useful for
elucidating the regional flow pattern (Fig. 4d; see Rose et al., 1996; Rose and Davisson,
1996). Radiocarbon-absent magmatic CO2 emanating from the Lassen geothermal system
is dissolved in groundwater and surface water in the Lassen Peak area, forming distinctive
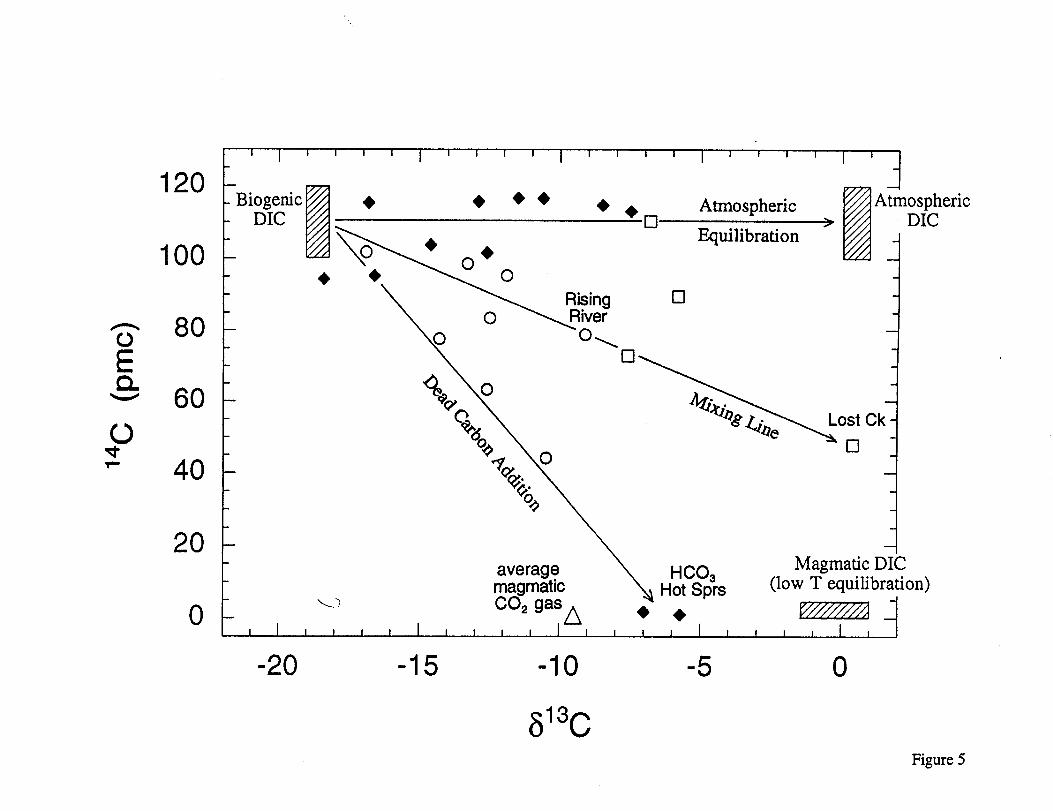
low-14C waters. Subsequent mixing with waters that contain dissolved inorganic carbon of
biogenic or atmospheric origin yields distinctive mixing trends on a plot of 14C versus δ13C
(Fig. 5). The biogenic carbon end-member is fortuitously uniform due to 1) the common
metabolic pathway of northern California vegetation, 2) high precipitation rates, and 3) the
lack of carbonate minerals in the soil and rocks from this region. The carbon isotope data
therefore provides a diagnostic tool for quantifying the amount of magmatic carbon that is
dissolved in regional groundwaters. Estimates of dissolved magmatic CO2 fluxes in
springs from the Lassen region are given in Rose and Davisson (1996).

9
Mt. Shasta Area
Springs and surface waters were sampled at selected locations on the south and east
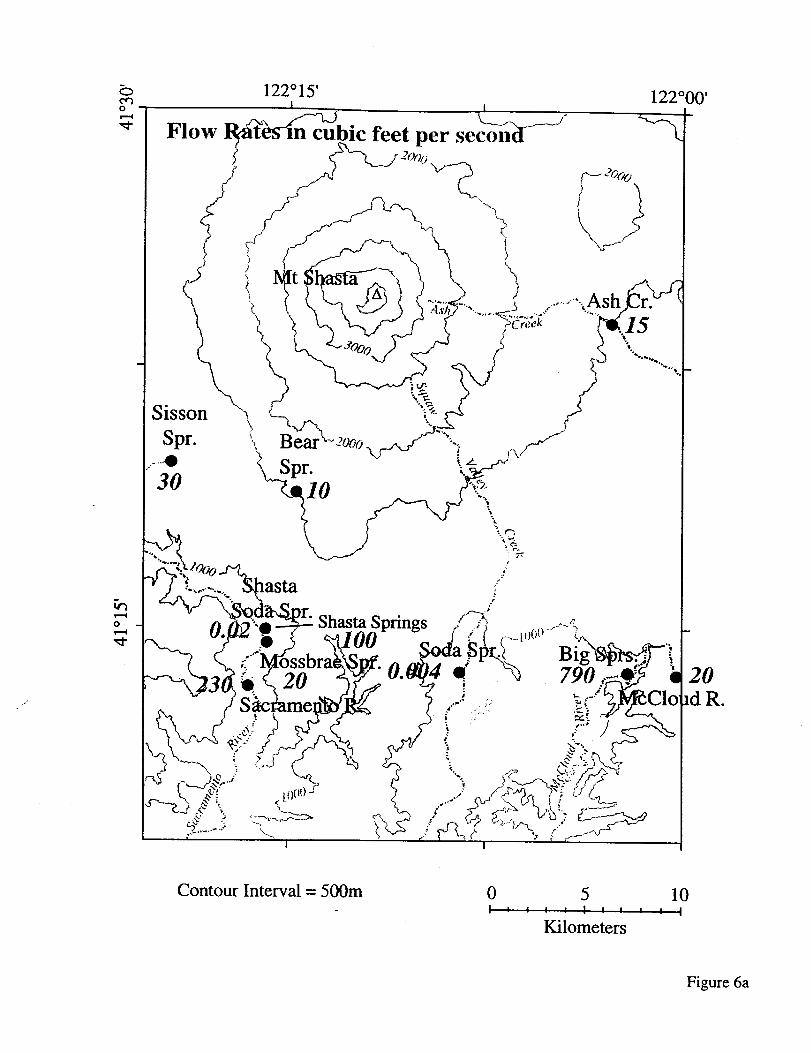
sides of Mt. Shasta. Estimated discharge rates (in cfs) are given in Figure 6a, and
analytical results are presented in Table 1. The largest springs in this region are the Big
Springs (>700 cfs) which emanate from a deeply eroded escarpment in the upper McCloud
River canyon, increasing the river flow a factor of 40 during baseflow. Shasta and
Mossbrae Springs discharge under similar conditions in the upper Sacramento River valley,
and combined with smaller spring flows such as Sisson Spring result in a river baseflow in
excess of 200 cfs.
The δ18O values of springs and surface waters in the Mt. Shasta region range from
-12.4 to -14.7 per mil (Fig. 6b). Surface runoff in Ash Creek has the lowest observed
δ18O value (-14.7‰) reflecting a source area at high elevations on the eastern side of Mt.
Shasta. Sisson Spring, located on the southwest side of the volcano, also has a δ18O value
of -14.7‰, indicating a similar high elevation source. The δ18O values of Big Springs
(-13.2‰) and Shasta Springs (-13.3‰) indicate significant recharge contributions from
lower elevations. In the case of Big Springs, the voluminous discharge (>700 cfs) requires
a minimum of 55 inches (140 cm) of annual recharge over a 500 km2 area. The large
volume of these springs probably requires contributions from both high and low elevation
regions. The δ18O value of Big Springs may therefore represent a composite of high and
low elevation recharge, suggesting the presence of both long and short range transport
paths to the spring discharge point.
Using equations from Rose et al. (1996) that describe regional variations in δ18O as a
function of elevation, we can estimate the recharge elevations and transport distances for
some of the springs in the Shasta region. In the case of Sisson Spring, these equations
predict a recharge elevation between 8300-9500 feet. This is close to the altitude where
Ash Creek originates (Fig. 6b). Therefore, the groundwater emerging from Sisson Spring
probably migrated ~10 km down a permeable layer that is essentially closed to interaction
10
with lower elevation recharge. At Bear Spring, the recharge elevation is estimated to be
~8200 feet, suggesting a groundwater flowpath that is on the order of only ~5 km in
length. For the lower elevation, larger volume springs, the likelihood of integrated
groundwater recharge at different elevations makes it difficult to estimate recharge
elevations and transport distances. In the case of Big Spring, if a component of its
recharge is derived from similar elevations as Sisson Spring, then a maximum transport
distance of ~20 km is possible. This length is still only half the distance determined for
groundwater transport to Rising River and Crystal Lake in the Lassen-Hat Creek system.
Mt. Shasta is unique in comparison to the other two volcanic centers in that CO2-rich
cold springs with low discharge rates occur along the base of the volcano (Fig. 6a). These
CO2-rich springs include Shasta Soda Spring, which discharges low conductivity, low pH
(4.5) water saturated with CO2 gas, and Warmcastle Soda Spring, which has a high
conductivity, but is also charged with CO2 gas. The 14C values of these soda springs are
around 1 pmc, indicating a magmatic CO2 source. CO2-rich waters in the Lassen Region
are limited to a few thermal springs associated with the high elevation, vapor-dominated
portion of the Lassen geothermal system (Muffler et al., 1982). CO2-rich springs have not
been reported in the Medicine Lake Volcanic area.
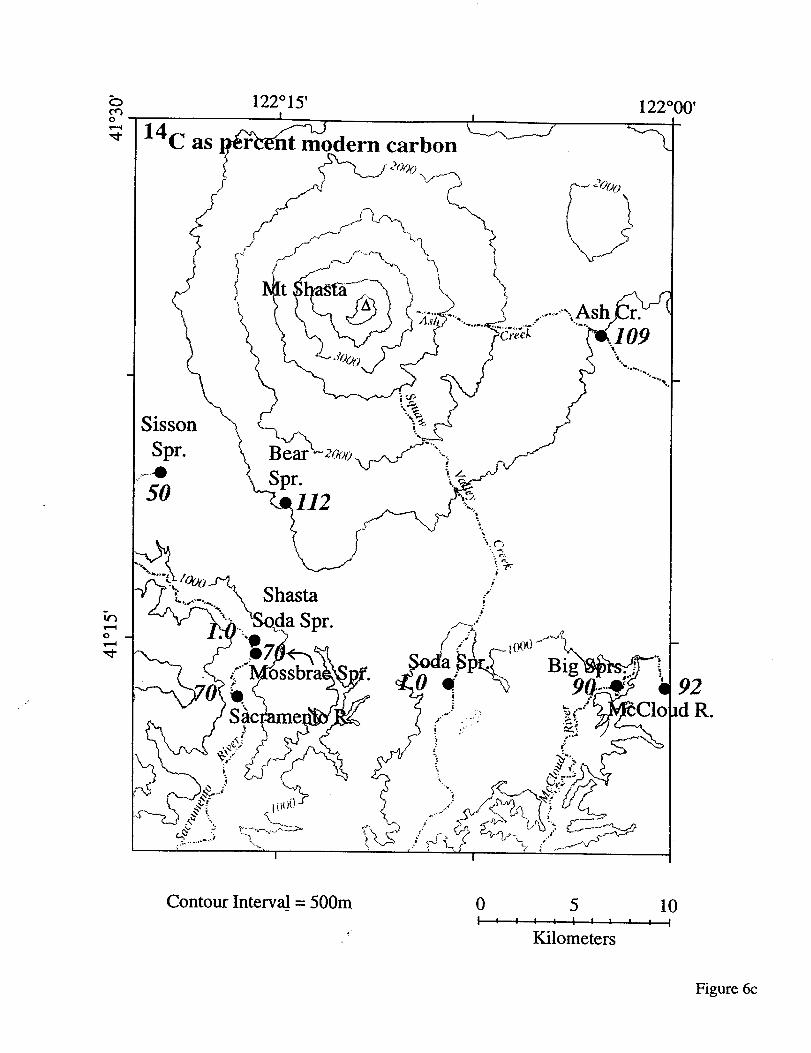
Radiocarbon concentrations of dissolved inorganic carbon in springs and surface waters
from the Shasta region are heterogeneously distributed. Ash Creek and Bear Spring both
have radiocarbon contents similar to modern atmosphere, while Sisson Spring and
Mossbrae Spring have much lower 14C values that reflect mixing with waters containing
magmatic CO2. The relatively close proximity of Shasta Soda Spring to Mossbrae Spring
undoubtedly influences the radiocarbon content of the latter spring. Big Spring has a
radiocarbon concentration that suggests perhaps 10-20% of its dissolved inorganic carbon
is derived from a magmatic source.
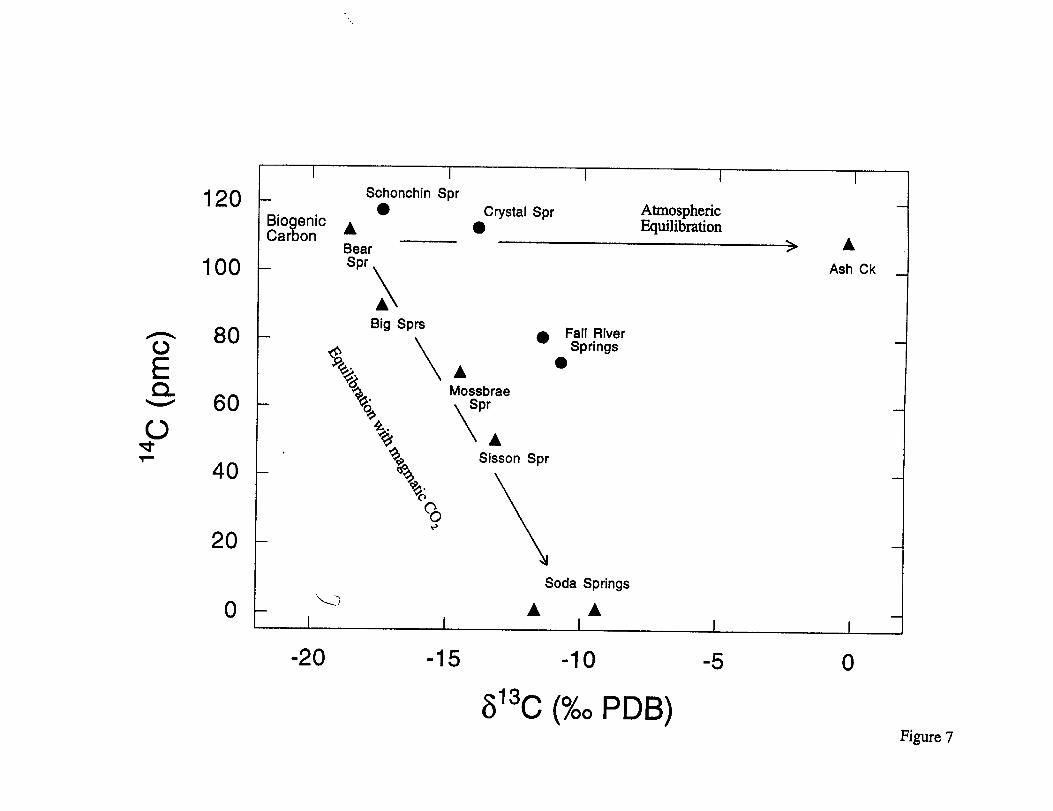
Rose and Davisson (1996) compared the carbon isotope values for springs and surface
waters in the Shasta area to those in the Lassen region. In the Lassen highlands, the carbon

11
isotopic composition of groundwater in the shallow subsurface is dominated by magmatic
CO2 from the Lassen geothermal system. Two distinct magmatic carbon isotope end-
members are recognized, associated with two distinct processes: (1) the direct dissolution
of magmatic CO2 gas, and (2) the equilibration of magmatic CO2 gas with dissolved
inorganic carbon in the water to form a low-14C bicarbonate water. Subsequent mixing
with atmospheric CO2 gas or biogenically-derived dissolved inorganic carbon yields the
mixing arrays shown in Figure 5. At Mt. Shasta, magmatic CO2 in the shallow subsurface
is observed only at lower elevations. This observation, coupled with the lack of
geothermal activity at Shasta, indicates a significant difference in the way gases escape
from these two volcanoes. Magmatic CO2 is incorporated into groundwater at Shasta only
by the direct dissolution of gas escaping along fractures at low elevations, forming a single
magmatic CO2 end-member in groundwater mixing processes (Figure 7). This implies that
the majority of the magmatic CO2 beneath Shasta resides at depth, limiting the possibilities
for interaction with shallow groundwaters.
Medicine Lake Volcano Area
Large volume spring flow in the Medicine Lake region is limited to the Fall River
Springs, located ~40 km south of Medicine Lake Volcano. Between these features lies the
Giant Crater lava field, which has virtually no springs or surface water features. The δ18O
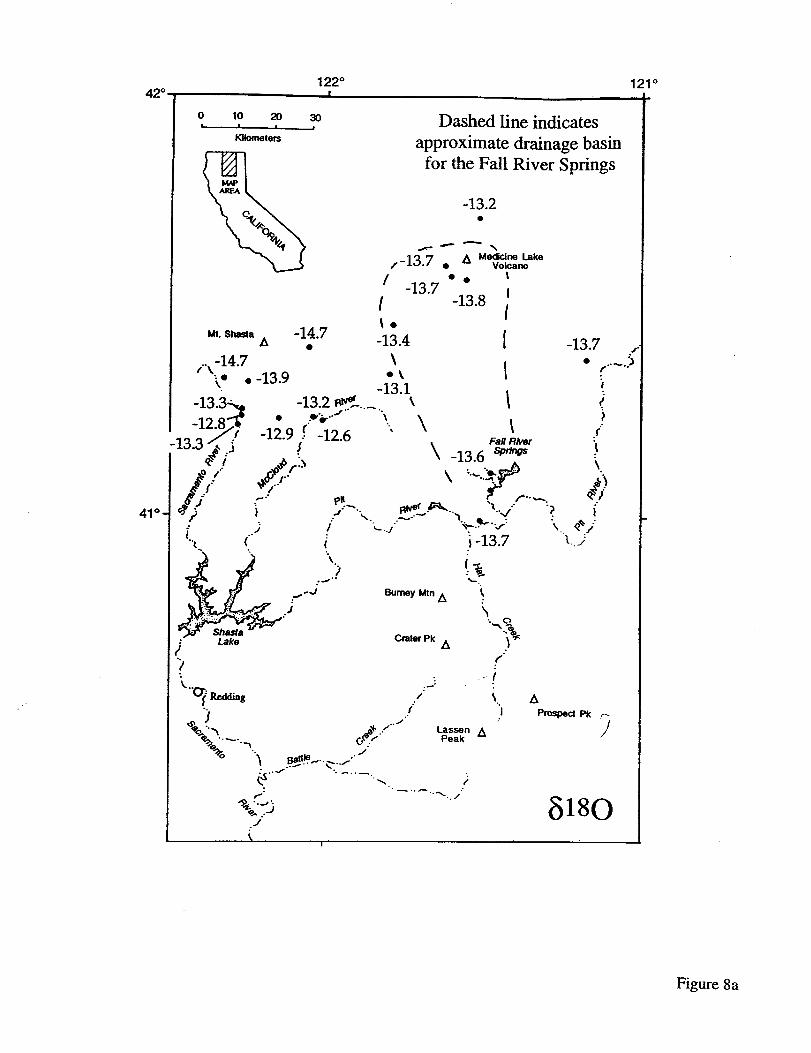
values of the Fall River Springs range from -13.3 to -13.6 per mil (Table 1 and Fig. 8a).
Matching δD measurements for two of these samples indicate that the spring waters
conform to the Global Meteoric Water Line (GMWL) of Craig (1961b), with no indication
of significant evaporation. The δ18O values were also measured for several small volume
springs located on Medicine Lake Volcano and in the surrounding Modoc Plateau region
(see Table 1).
Small springs from the Medicine Lake highlands (Crystal, Schonchin and Paynes
Springs) have δ18O values similar to the Fall River Springs. The small springs represent
12
local groundwater recharge that follows shallow, localized flowpaths. Available δD data
(Table 1) indicates that these springs also conform to the GMWL. The δ18O values for the
small springs are consistent with the values predicted for recharge at an elevation of ~7000
feet using the δ18O-elevation equations from Rose et al. (1996). Therefore, the δ18O
values of water emerging from the Fall River Springs are consistent with recharge at a
similar elevation.
However, closer inspection of the δ18O values for low volume springs located
throughout the Medicine Lake region reveals that the δ18O values and spring elevations in
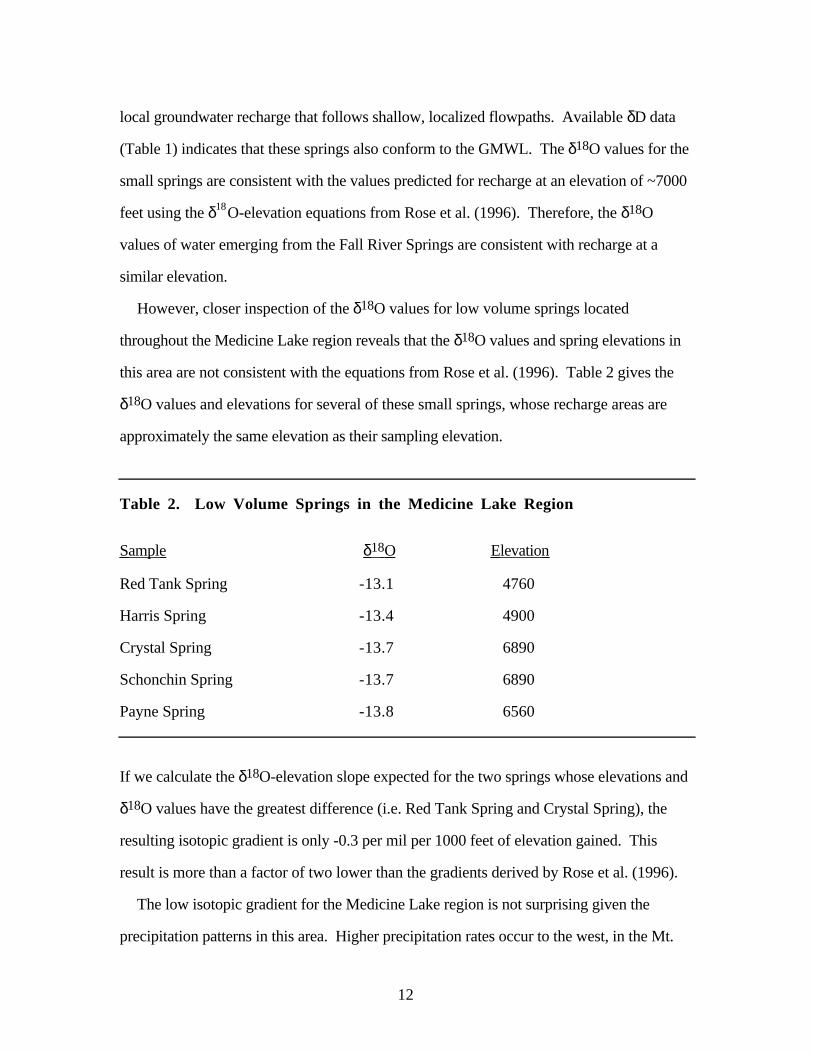
this area are not consistent with the equations from Rose et al. (1996). Table 2 gives the
δ18O values and elevations for several of these small springs, whose recharge areas are
approximately the same elevation as their sampling elevation.
Table 2. Low Volume Springs in the Medicine Lake Region
Sample δ 18 O Elevation
Red Tank Spring -13.1 4760
Harris Spring -13.4 4900
Crystal Spring -13.7 6890
Schonchin Spring -13.7 6890
Payne Spring -13.8 6560
If we calculate the δ18O-elevation slope expected for the two springs whose elevations and
δ18O values have the greatest difference (i.e. Red Tank Spring and Crystal Spring), the
resulting isotopic gradient is only -0.3 per mil per 1000 feet of elevation gained. This
result is more than a factor of two lower than the gradients derived by Rose et al. (1996).
The low isotopic gradient for the Medicine Lake region is not surprising given the
precipitation patterns in this area. Higher precipitation rates occur to the west, in the Mt.
13
Shasta region, and to the south (Fig. 3). However, the Medicine Lake region lies in the
rain-shadow of Mt. Shasta. Under these circumstances, most of the moisture carried by
storm systems moving through this region is lost in elevation gains before it reaches the
Medicine Lake area. This accounts for the relatively low mean annual precipitation rates
(40 in/yr) at high elevations on Medicine Lake Volcano (Fig. 3).
We have highlighted the probability of reduced elevation effects on the δ18O values of
precipitation in the Medicine Lake area in order to justify mass balance calculations reported
in Rose et al. (1996). They suggested that in order to maintain the historical ~1400 cfs
flow of the Fall River Springs, a mean annual recharge rate of 25 inches per year must
occur over the 750 mi2 volcanic plateau formed by Medicine Lake Volcano and the Giant
Crater lava flow. If elevation effects dominated the δ18O variations in precipitation in this
region, then the permissible recharge area for the Fall River Springs would be limited to a
geographic area of only ~250 mi2. This would limit groundwater recharge to the highest
elevation regions of Medicine Lake Volcano. However, the volcano does not receive a
sufficient amount of annual precipitation to sustain all the Fall River Springs flow. It is
likely, therefore, that δ18O variations in precipitation for the entire geographic area
encompassing Medicine Lake Volcano and the Giant Crater lava field is no more than ~1.0
per mil. This entire area must have enhanced permeability (fractures and lava tubes) that
promotes the recharge of most of the annual precipitation and focuses groundwater
transport south to the Fall River Springs. The paucity of springs and surface runoff in this
region support this interpretation. Furthermore, if most of the annual precipitation on
Medicine Lake Volcano goes to groundwater recharge, then approximately half the flow of
the Fall River Springs is probably derived from the volcanic edifice.
Radiocarbon and δ13C measurements of low volume springs on Medicine Lake Volcano
indicate that their dissolved inorganic carbon is derived from a modern biogenic source
(Fig. 8b). However, radiocarbon measurements of the Fall River Springs indicate that at
least 27% of its dissolved inorganic carbon is derived from a magmatic CO2 source. Given
14
the known discharge rate, dissolved carbon concentration, and 14C activity for the Fall
River Springs, we are able to estimate the dissolved magmatic carbon flux carried by the
springs. Assuming the fraction of dissolved magmatic carbon is 27% (a minimum value),
we obtain a dissolved flux of 25 x 106 kg/yr for the Fall River Springs. This is more than
double the fluxes previously calculated for Lassen and Shasta volcanoes (Rose and
Davisson, 1996). Such a large magmatic CO2 flux requires that the groundwater supplying
flow to the Fall River Springs system must originate from a volcano where magmatic
degassing is actively occurring. Given the hydrogeologic configuration of the Fall River
aquifer system, it is clear that Medicine Lake Volcano is the only possible source of the
magmatic CO2. Hence, the radiocarbon data independently confirms the Medicine Lake
highlands as a significant recharge source for the Fall River Springs. Moreover, these data
indicate that much of the annual recharge occurring on Medicine Lake Volcano must interact
with a CO2 volatile phase derived from the geothermal system beneath the volcano.
DISCUSSION
The groundwater recharge and flow characteristics of the Fall River Springs system has
many similarities to that of Rising River and Crystal Lake Springs in the Lassen region.
Both spring flow systems have unusually high discharge rates that emerge from the toe of
large Quaternary basalt flows. In both cases, recharge is derived from high elevation snow
melt ~40 km upgradient, and the dissolved inorganic carbon in these springs shows a
significant magmatic CO2 component derived from volcanic emissions in the recharge area.
In the Mt. Shasta area, the large volume springs are not associated with broad, laterally
continuous lava sheets, but rather they emerge in areas where erosion has cut into volcanic
layers along the base of the stratocone. Groundwater transport distances are typically less
than half that of the spring systems at Medicine Lake and Lassen. Magmatic CO2
emissions at Shasta appear to be limited to lower elevations, where low volume, CO2-rich
soda springs are observed (Figure 9a).

15
The nature of groundwater transport in these various systems is determined to a large
extent by the geomorphology of the volcanic edifice, and by the continuity of the major lava
flows that provide groundwater conduits. Recharge is greatly enhanced by the highly
permeable nature of the volcanic rock, and by the presence of major fracture systems and
lithologic discontinuities. The occurrence of silicic domes in all three volcanic centers
provides an avenue of enhanced fracture permeability that may permit relatively deep
transmission of groundwater recharge. At Medicine Lake volcano, vertical permeability
may also be enhanced by the ring fracture system associated with the caldera.
At Lassen and Medicine Lake, lateral transport out of the volcanic highlands is greatly
enhanced by the high permeability, laterally continuous Hat Creek and Giant Crater basaltic
flows. These young lava beds contain large fractures and lava tubes (e.g. Evans, 1963)
that promote the rapid lateral transport of groundwater. In the Lassen-Hat Creek system,
groundwater flowing out of the Lassen highlands must drop in elevation around 3000 feet
over a 9 mile lateral distance before it intersects the upper end of the Hat Creek basalt flow
(Fig. 9b). A small portion of this flow actually arrives back at the surface as small volume
spring flow on the volcanic highlands, forming the headwaters of Hat Creek. Given the
volume of annual recharge, such a hydraulic gradient can only be maintained by rapid flow
into hydraulic conduits with extremely high permeabilities, such as those found in the Hat
Creek basalt flow.
Groundwater recharge on Medicine Lake volcano must be transported over a ~5 mile
distance and a ~1500 feet drop in elevation before it reaches the Giant Crater lava field.
However, in this case, almost none of the annual recharge arrives back to the surface as
spring flow. Additional recharge into the Giant Crater lava field must also occur south of
the Medicine Lake volcano in order to maintain the flow rates in Fall River Springs.
It should be emphasized that groundwater emerging from the large volume springs does
not show evidence for deep transport (>1000 ft). The low temperatures and high flow
rates for the large volume springs imply relatively shallow transport paths and short aquifer
16
residence times. It is likely that less permeable layers located below the volcanic peaks may
be important in terms of focusing groundwater flow toward a localized discharge area. For
example, hydrothermally altered lavas and pyroclastic deposits can contain secondary
minerals (e.g. clays and silicification) that greatly reduce the permeability of the altered
layers. Altered rocks are expected to occur at depth beneath all three volcanoes. In
addition, outside of the volcanic highlands, both the Hat Creek and the Giant Crater lava
flows are underlain by older Plio-Pleistocene basalts and diatomaceous lake-bed deposits
(Macdonald, 1966). The lake-bed deposits in particular may provide a barrier to the
downward percolation of groundwater, enhancing lateral transport in the overlying basaltic
layers.
CONCLUSIONS
The Lassen-Hat Creek and the Medicine Lake-Fall River Springs groundwater systems
share a number of common characteristics. Key similarities include:
• Laterally extensive, high permeability Quaternary basalt flows that extend from the base of the volcanoes, providing major conduits for groundwater transport away from high precipitation areas on the volcanoes.
• Large volume springs occurring at the terminus of these basalt flows.
• δ18O values for the large volume springs that indicate groundwater recharge at high elevations on the volcanic edifice.
• Radiocarbon and δ13C values for the large volume springs that indicate large quantitiesof dissolved magmatic CO2 derived from shallow, active geothermal systems underlying these volcanoes.
The groundwater system at Mt. Shasta contrasts the Lassen and Medicine Lake systems
in several ways. Large volume spring flows at Mt. Shasta emerge mostly from deep
erosional incisions in the canyons of the McCloud and Upper Sacramento Rivers. The
17
δ18O values of the largest spring flows indicate that the majority of recharge did not occur
at high elevations on Mt. Shasta, but rather at lower elevations along its flanks. Magmatic
CO2 emerging from Mt. Shasta occurs predominantly at low elevations on the south and
southwestern side of the volcano. Because Shasta lacks a shallow geothermal system such
as that at Lassen and Medicine Lake, magmatic CO2 is largely absent in high elevation
recharge, and is only seen in waters that discharge at low elevations along the flank of the
volcano.
Isotopic evidence presented in this report indicates that groundwater emerging from Fall
River Springs contains large amounts of magmatic CO2 gas derived from Medicine Lake
volcano. Although this does not in itself indicate a direct physical connection between the
geothermal system and the Fall River Springs recharge system, it does clearly imply that
the Fall River Springs recharge system directly overlies the geothermal system, and that
CO2 gas leaks upward from the geothermal system. Moreover, the large quantity of
magmatic CO2 in the Fall River Springs system is a strong indicator that the area of
geographical overlap between the cold spring recharge zone and the underlying geothermal
reservoir is quite large.
Studies aimed at determining the potential environmental impact of geothermal energy
development in the Medicine Lake highlands must consider these facts. The connectivity
between the spring water recharge system and the underlying geothermal reservoir needs to
be considered before and during geothermal energy development. Of possible concern is a
scenario whereby the removal of heat and water from the geothermal system may enhance
vertical transport of the fresh groundwater and cause a head reduction at the Fall River
Springs discharge point. Alternatively, if the buoyancy of the geothermal water is great
enough, its utilization may cause it to migrate into the fresh groundwater, possibly resulting
in temperature and salinity increases in the Fall River Springs. The evidence in this report
cannot support or refute either of these scenarios or any other possible occurrences. The
evidence does however show that much of the Fall River Springs is recharged on the

18
Medicine Lake Volcano and that recharge has interacted with magmatic CO2 whose source
must be the large geothermal system.

19
REFERENCES
Bowers, D., 1997, personal communication, Pacific, Gas, and Electric Company.
Christiansen, R.L., 1982, Volcanic hazard potential in the California Cascades. Calif.Div. Mines Geol. Special Pub. 63: 41-59.
Clynne, M.A., 1990, Stratigraphic, lithologic, and major element geochemical constraints of magmatic evolution of the Lassen Volcanic Center, California, Jour. Geophys. Res., 95: 19651-19669.
Coleman, M.L., Sheperd, T.J., Durham, J.J., Rouse, J.E., and Moore, G.R., 1982. Reduction of water with zinc for hydrogen isotope analysis. Anal. Chem., 54:993-995.
Craig, H., 1961a, Standard for reporting concentrations of deuterium and oxygen-18 in natural waters. Science, 133: 1833-1834.
Craig, H., 1961b, Isotopic variations in meteoric waters. Science, 133: pp. 1702-1703.
Dansgaard, W., 1964, Stable isotopes in precipitation. Tellus, 16: 436-468.
Davisson, M.L. and Velsko, C.A., 1994, Vacuum technique for stripping of CO2 from natural waters for 14C determination by accelerator mass spectrometry. Lawrence Livermore National Lab Report UCRL-JC-119176, 18 p.
Donnelly-Nolan, J.M., Champion, D.E., Grove, T.L., Baker, M.B., Taggert, J.E., and Bruggman, P.E., 1991, The Giant Crater lava field: geology and geochemistry of a compositionally zoned, high-alumina basalt to basaltic andesite eruption at Medicine Lake volcano, California. Jour. Geophys. Res., 96: 21843-21863.
Ellis, M.J., 1997, Shasta crayfish: A threatened California native. Outdoor California,58 (2): 4-6.
Epstein, S. and Mayeda T., 1953, Variation of 18O content of waters from natural sources.Geochim. Cosmochim. Acta 4: 213-224.
Evans, J.R., 1963, Geology of some lava tubes, Shasta County. Calif. Div. Mines Geol.Mineral Information Service, 16 (3): 1-7.
Evans, J.R. and Zucca, J.J., 1988, Active high-resolution seismic tomography of compressional wave velocity and attenuation structure at Medicine Lake volcano, northern California Cascade Range. Jour. Geophys. Res., 93: 15016-15036.
20
Fontes, J.Ch., 1992, Chemical and isotopic constraints on the 14C dating of groundwater. in Taylor, R.E., Long, A., Kra, R.S. (eds), Radiocarbon After Four Decades, pp. 242-261.
Ingraham, N.L. and Taylor, B.E., 1991, Light stable isotope systematics of large-scalehydrologic regimes in California and Nevada. Water Resour. Res. 27: 77-90.
Macdonald, G.A., 1966, Geology of the Cascade Range and Modoc Plateau. In: Bailey, E.H. (ed.), Geology of Northern California, Calif. Div. Mines Geol. Bull. 190,pp. 65-96.
Manga, M., 1997, A model for discharge in spring-dominated streams and implications for the transmissivity and recharge of quaternary volcanics in the Oregon Cascades.Water Resour. Res., 33: 1813-1822
McNichol, A.P., Jones, G.A., Hutton, D.L., Gagnon, A.R., and others, 1994, The rapidpreparation of seawater sigma-CO2 for radiocarbon analysis at the National Ocean Sciences AMS Facility. Radiocarbon, 36, 237-246.
Meinzer, O.E., 1927, Large springs in the United States. U.S. Geol. Survey Water-Supply Paper 557, 94 p.
Muffler, L.J.P., Nehring, N.L., Truesdell, A.H., Janik, C.J., Clynne, M.A. and Thompson, J.M., 1982, The Lassen geothermal system. U.S. Geol. Survey Open-FileReport 82-926, 8 p.
Muffler, L.J.P., Clynne M.A., Champion, D.E., 1994, Late Quaternary normal faulting of the Hat Creek Basalt, northern California. Geol. Soc. Amer. Bull., 106: 195-200.
Rantz, S.E., 1969, Mean annual precipitation in the California region. U.S. Geol. Surv.Basic Data Compilation, Isohyetal Map, scale 1:1,000,000.
Rose, T.P. and Davisson, M.L., 1996, Radiocarbon in hydrologic systems containingdissolved magmatic carbon dioxide. Science, 273: 1367-1370.
Rose, T.P., Davisson, M.L., and Criss, R.E., 1996, Isotope hydrology of voluminouscold springs in fractured rock from an active volcanic region, northeastern California.Jour. Hydrol., 179: 207-236.
Smith, G.I., Friedman, I., Klieforth, H.E., and Hardcastle, K., 1979, Aerial distribution of deuterium in eastern California precipitation, 1968-1969. Jour. Appl. Meteor., 18: 172-188.
21
FIGURE CAPTIONS
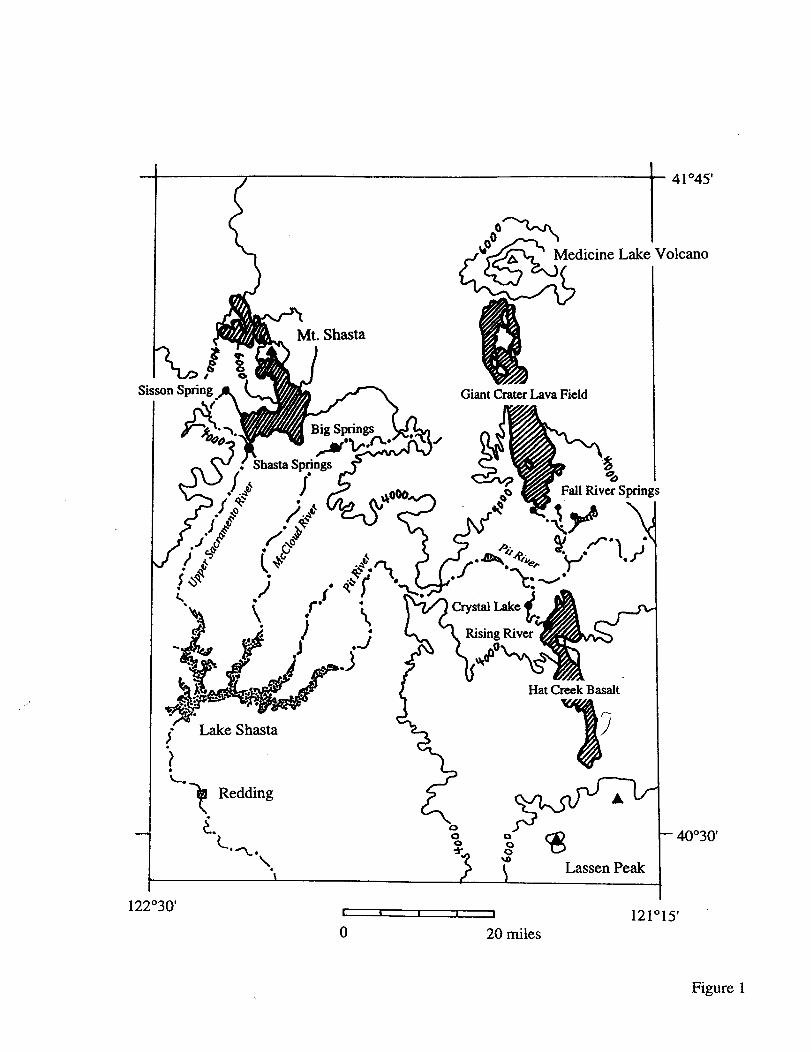
Figure 1: Regional map of northern California volcanic centers showing Quaternary age
lava flows (hatched areas). The Giant Crater lava field and the Hat Creek basalt both
extend from the base of volcanic peaks and terminate near the Pit River where large volume
springs emerge. Volcanic flows associated with Mt. Shasta are fragmentary, and large
volume springs instead emerge in areas of deep erosion.
Figure 2: Mean annual discharge for Rising River and Crystal Lake springs for the years
1987-1992, corresponding to a period of drought in California. The data are normalized to
the 1987 discharge at each spring to show the percent decrease in flow as the drought
progresses. Discharge rates were determined from the difference in flow along Hat Creek
measured at gauging stations located upstream and downstream of the springs. The data
show that the springs respond rapidly to decreases in precipitation rate in the recharge area.
Figure 3: Isohyetal map shows that precipitation in inches per year is regionally high in the
three volcanic edifices, but much lower in the areas where large volume springs emerge.
Figure 4a: Moderate to large volume springs emerge throughout the Lassen-Hat Creek
Valley area, but the most significant flows are Rising River, Crystal Lake, Burney Falls,
and Big Spring. Lassen peak also host thermal springs that are surface expressions of an
large and shallow geothermal system below its summit.
Figure 4b: The distinctive variation in δ18O values of the large volume springs in the
Lassen-Hat Creek Valley area indicate that recharge occurs at different geographic locations
and elevations. Figure is from Rose et. al. (1996).
Figure 4c: Small volume spring flows whose recharge areas are near their sampling
locations show an expected west to east decrease in δ18O that is accentuated by steep
elevation gains on Lassen Peak. Since Lassen Peak and the highlands to the east have a
high annual precipitation rate and low δ18O values, recharge to Rising River and Crystal
Lake must be derived from this area.
Figure 4d: A large and active geothermal system below Lassen Peak discharges ~107 kg/yr
of magmatic CO2, which at least 20% dissolves in groundwater as dissolved inorganic
carbon. The magmatic CO2 is radiocarbon-absent and its mixture in regional groundwater
22
delineates a distinct flow path from the Lassen area to the Rising River. Figure is from
Rose and Davisson (1996).
Figure 5: The comparison of δ13C and radiocarbon (14C) of dissolved inorganic carbon
(DIC) in the Lassen-Hat Creek Valley waters distinguish four different carbon end-
members all influencing regional groundwater. These include 1) a biogenic DIC from plant
respiration dissolved in recharging groundwater, 2) a DIC isotopically equilibrated with the
atmosphere usually observed in evaporated surface water or high elevation runoff, 3) a
mixture of magmatic DIC and DIC equilibrated with atmospheric CO2 that occurs as
recharge beneath Lassen Peak, and 4) DIC from hot springs dissolved in regional
groundwater.
Figure 6a: Large volume spring flows around Mt. Shasta are limited to Big Spring and
Shasta Springs. Both occur in deep erosional incisions into volcanic flow deposits. Cold
temperature soda springs are observed in low elevation areas on the south and
southwestern sides of Mt. Shasta.
Figure 6b: The δ18O value of Ash Creek represents high elevation snow melt
compositions. Only Sisson Spring has the same value, while the large volume springs
have much higher values that indicate recharge is predominantly at lower elevations.
Figure 6c: Significant levels of magmatic CO2 dissolved in spring waters around Mt.
Shasta are limited to areas on the south and southwest side. In particular, half the
dissolved carbon in Sisson Spring is magmatically derived. The radiocarbon content of
Ash Creek indicates that no magmatic CO2 emerges from high elevations on the east side
and is consistent with the general lack of a large geothermal system below the summit of
Shasta.
Figure 7: The comparison of δ13C and 14C in groundwater of the Shasta area indicates that
only biogenic DIC, atmospherically equilibrated DIC, and magmatic CO2 are the end-
members influencing regional groundwater. The lack of a magmatic DIC end-member as
seen in the case of Lassen (see Fig. 5) indicates that magmatic CO2 dissolution into Shasta
groundwater occurs in a closed system. The Fall River isotopic values fall in a field that
suggest that in the Medicine Lake area, magmatic CO2 dissolution likely occurs in a
partially open system similar to Lassen.

23
Figure 8a: The δ18O value for Fall River springs is consistent with the δ18O values
observed in the Medicine Lake Highlands area and differ from that of the Mt. Shasta
region. The annual discharge from Fall River Springs require an ~750 mi2 recharge area
with 25 inches of annual recharge. Medicine Lake Volcano likely comprises half this
recharge with the remainder probably occurring along the surface of Giant Crater lava field.
The lack of surface drainage in these areas suggest that almost all the annual precipitation is
recharge into the groundwater.
Figure 8b: Radiocarbon in two local spring flows on Medicine Lake Volcano have
atmospheric contents. Radiocarbon in Fall River Springs has been diluted with magmatic
CO2 at a minimum of 27%. This requires a magmatic CO2 flux on the order of 2.5 x10⁷
kg/yr as DIC, which can only be derived from a large active geothermal system such as
found beneath Medicine Lake Volcano.
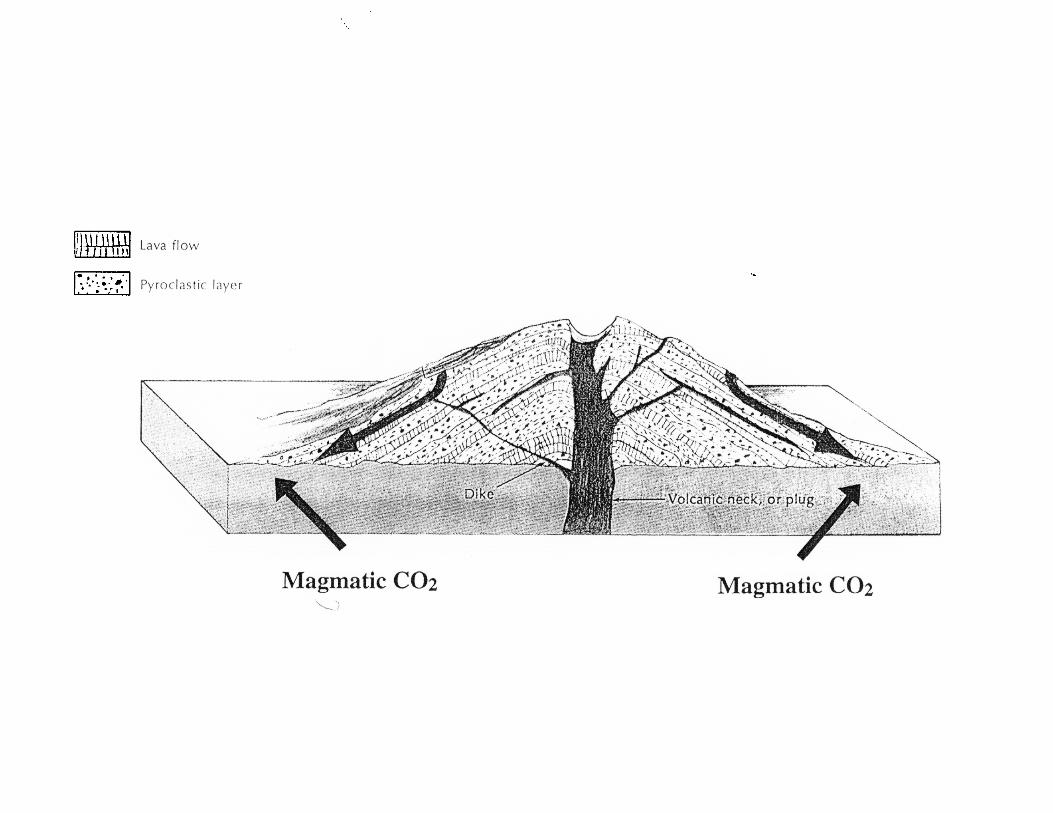
Figure 9a: Idealized cross-section of a stratocone volcano illustrates conceptually
groundwater recharge and flow in the Mt. Shasta region. Recharge of annual snow melt is
limited by vertical permeability of the layered volcanic deposits. In Mt. Shasta, recharge is
likely limited to shallow permeable layers at lower elevations. Likewise, the layered
volcanics and lack of a large geothermal system at Shasta limited magmatic CO2 discharge
to low elevations areas. Most dissolution of magmatic CO2 in regional groundwater is
limited to these low elevation areas.
Figure 9b: Conceptualization of groundwater flow in the Lassen-Hat Creek Valley and the
Medicine Lake-Fall River Springs systems. Fractures created by volcanic domes, or
possible ring fractures in the case of Medicine Lake, enhance vertical recharge of annual
snow melt. The very high permeability of the Hat Creek basalt flow and the Giant Crater
lava field provide conduits for rapid groundwater transport over long lateral distances to
lower elevations. In the case of Medicine Lake, the permeability of the lava field must be
high enough that all recharge remains beneath the ground.
41°45’
~
‘Olcano
-40°30’
122°30 t 5 1 1 I 121°15’ “o 20 miles
Figure 1
1I
ii
1d
II
II
II
II
II
I1
I1
II
tI
II
II
II
II
J1
II
II
II
II
1I
II
1I
II
II
II
II
II
II
1I
II
0000:000
Om
cocD
u3d-
ml
0mcoa)m*coa)
t t
o 20 miles
Figure 3

121°45’ 121 °?0’ 121°15’-— -- . -—_. -I
I I
Flow rates as cubic feet per SWOIM.I
2{)() g .L,%b<iii
.$Fall River1400 d“ Springs
Britton,.,. ,, -,. ....
$’%,.,,,. -.,
.,, ...- , w..‘B~ey - ~
:.!+.
;“. ‘$;-M “..~%. ...-,, jpt Falls “’‘ - ‘: “‘
‘,$L---- ,-4
,.,
BurneyMtn A “~
.’ Lost Cr. #2
●6O“ ,*
‘“;QA “...;
CraterPeak
Big ,,.
‘.’ Spr.e~150x .,,,,.’,/.~. :.,....~+e:
‘&: AProspect
*$,.?’ Jo Lost cJ=,#l .: Peak.~:.-- “’Mt. Home 50 ●.,..;;
,?.’Spr.
:@,,.,,%~ ’12U .’ Cascade Spr.
=0~e~a,l ● . 2.! ,,,,““,,,,
● #“Sprs. ~~.~ z “ ~,$,,-+:
q ‘,%=Domingo ‘n-. Nanny Cr. ~~: -“’..,. *:
‘7.5spr. ● -. ...........“
10S. Fork Bati[e cr. . 100
..-, .’.
06 10 16 20I 1 1 1Kilometers
Figure 4a

121°45’ 121°30’ 121°15’
6’80
..I:, -14.0
---
‘\
1)
i“------
A CmterPeak
{Big Spring
J-j -13.4/ I‘\ (‘\.> { A Prospect
\ “.- Peaki i‘\ J“-“>~/“’ ~>..
Lassen A)
Peakf’
o 5 10& ,KILOMETERS
121045’ 121030’ 121”15’
.,
0 5 10 15 20m=ij I 1 1
KILOMETERS
Figure 4C
. .
121045’ 121030’ 121°15’
“C (pmc)’ 0 Spfigs >10 ft3s-1+ springs< 10 ft3s-1
II creeks
Lake @ geothermal areas&’iiYOrl
,;+ # groundwater flowpati... ..P“.--.. = 99 -i. \
‘“ pit ;~@f \:, .\. -_;-.”-.. .,/: > +95 ‘..f,..
1+115
83:; +100
\\
4-WRising RiverSprings
, ?9 + 117L
““\ifblWYA
+ Mln i
117 11: i + 116
11::+.. +
\ 3<““---”(Q.Q
/n: I
>%\
A 1
\o.5
..-,\ .-.. ti
~“hwk Bank cr~k ““>. /.” ! 89 102 ?.; )
1 r \ r
contour intervalo 5 10 15 20
J= 20 pmc KILOMETERS
Figure 4d
120
100
80
60
40
20
0
I I I I I I I I I I I 1 I I I I I 1 I II
I
Biogenic
[u
● + ++ 4+DIC
++
%%
%60+
average Magmatic DICmagmatic (low T equilibration)
>> C02 gas
I I,A ++
I 1 I I I I t I 1 I I I I I I 1 I I 1
-20 -15 -lo -5 0
8’3CFigure 5
122°15’ 122°00”
20d R.
Contour Interval = 500m o 5 10,Kilometers
Figure 6a

-~,. 122°15’ 122°00’I I
8
{
\
Shson Spr.o
-14.7
‘B%?3:T
.?OOO
)
Spr./
Contour interval = 500 m o 5 10
oud R.
.4
KILOMETERS
Figure 6b
o 122°15’ 122°00’1 I
derncarb~n—
Sissonf
J...=~..rAshr.,..’..109*.’s.%..-.’,%..*
30 %112 .
ci’-tl p~
a a’Q.
;
Contour Interv@ = 500m o 5 10
Kilometers
Figure tic
120
100
+40
20
0
I I I I
Bio enic\Car on
Schonchin Spr●
ABearSpr,
\ABig Sprs
\ A
Crystal Spr Atmospheric● Equilibration
> AI
‘+
MossbraeSpr
\ ASisson Spr
-20 -15 -lo
513C(%. PDB)
-5 0
I
Figure 7
122° 121”42’
41°
I o 10 20 ~ Dashed line indicates# *Kllometets approximate drainage basin
for the Fall River Springs
-13.2●
4-—\,-13.7 ●
A Me$iclclmake
I
1 -13.7 ● ●
1 -13.8 ;
-14.7\.
Mt.ShastaA. -13.4
,..,-14.7 \:0
● -13.9 I\ -;3;1-13.3+ -13.2 fq?L._ f I
\
\ q3fj ‘$%
1. ~.* #““o. ““..-Y . .
f
-i.-./“ f
../ I*)% .“> ~sfv””’Lassen
%.. . .. Peak
‘=*0 7’.1 Sal??+.. e..”-”
1...-
.. _. ._.+“”-’-
“’.. _,,_ ~
‘“-.. /’+* .<J ..
@* -.J
,/-
A
/j180
Figure 8a

42
41”
122° 121”
Mt. ShaaiaA.
/“”\: .\*
Radiocarbon(percent modem carbon)
●
\o
\● ❉
. ... ... ..
?
@’!?-.._.. \● p-w-’
1 ( ‘“. \
/
● 5..---/-I
.i-
i‘-q ~.g ..-.
/ {..
~(’ I
../.-
‘%;;---- c??/ ial:;krl A/-”
0 “’lJ2!w-”-+ ‘..-..—(&’ ‘.\ ~“.- ..-,.
9*:4 .. -.. /:%..>
AProapad Pk ,.
)
Figure 8b
EK
l..n●-.-...*..
.......

Lassen Peak
... .-.. -----
-...-
-..—
...—
‘- 0000 ~Not to Scale
--++
C02
Figure 9b
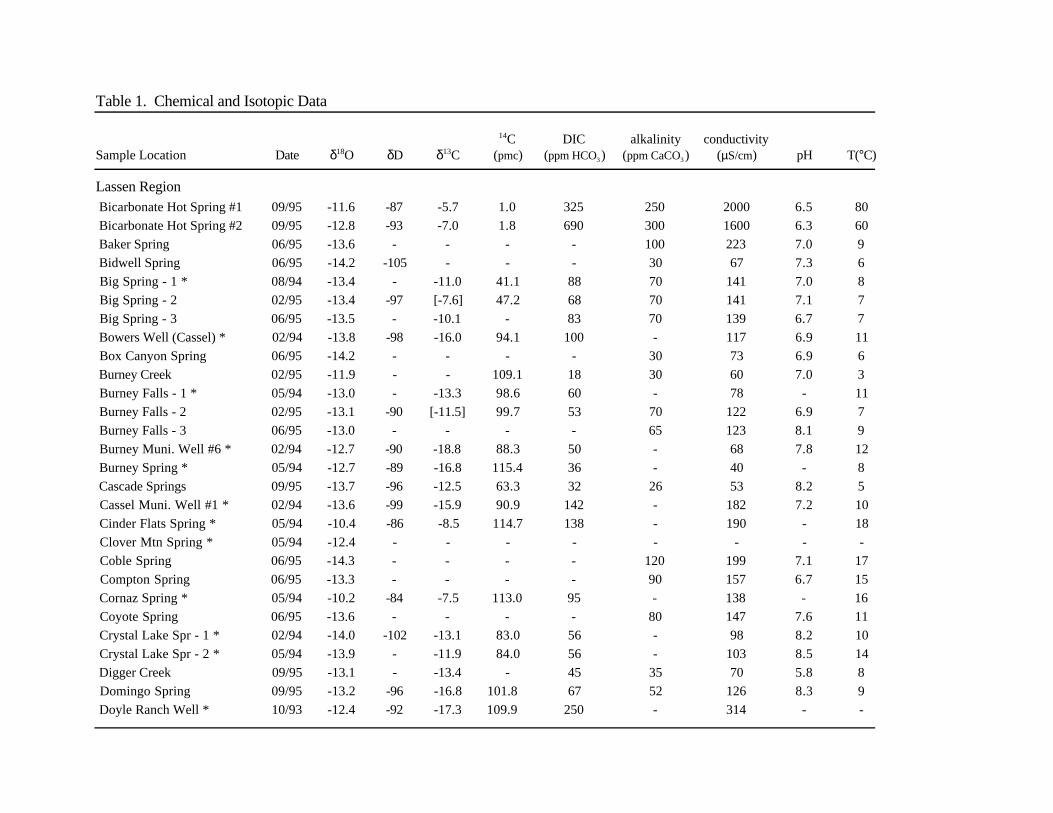
Table 1. Chemical and Isotopic Data
14C DIC alkalinity conductivitySample Location Date δ18O δD δ13C (pmc) (ppm HCO3) (ppm CaCO3) (µS/cm) pH T(°C)
Lassen Region Bicarbonate Hot Spring #1 09/95 -11.6 -87 -5.7 1.0 325 250 2000 6.5 80
Bicarbonate Hot Spring #2 09/95 -12.8 -93 -7.0 1.8 690 300 1600 6.3 60
Baker Spring 06/95 -13.6 - - - - 100 223 7.0 9
Bidwell Spring 06/95 -14.2 -105 - - - 30 67 7.3 6
Big Spring - 1 * 08/94 -13.4 - -11.0 41.1 88 70 141 7.0 8
Big Spring - 2 02/95 -13.4 -97 [-7.6] 47.2 68 70 141 7.1 7
Big Spring - 3 06/95 -13.5 - -10.1 - 83 70 139 6.7 7
Bowers Well (Cassel) * 02/94 -13.8 -98 -16.0 94.1 100 - 117 6.9 11
Box Canyon Spring 06/95 -14.2 - - - - 30 73 6.9 6
Burney Creek 02/95 -11.9 - - 109.1 18 30 60 7.0 3
Burney Falls - 1 * 05/94 -13.0 - -13.3 98.6 60 - 78 - 11
Burney Falls - 2 02/95 -13.1 -90 [-11.5] 99.7 53 70 122 6.9 7
Burney Falls - 3 06/95 -13.0 - - - - 65 123 8.1 9
Burney Muni. Well #6 * 02/94 -12.7 -90 -18.8 88.3 50 - 68 7.8 12
Burney Spring * 05/94 -12.7 -89 -16.8 115.4 36 - 40 - 8
Cascade Springs 09/95 -13.7 -96 -12.5 63.3 32 26 53 8.2 5
Cassel Muni. Well #1 * 02/94 -13.6 -99 -15.9 90.9 142 - 182 7.2 10
Cinder Flats Spring * 05/94 -10.4 -86 -8.5 114.7 138 - 190 - 18
Clover Mtn Spring * 05/94 -12.4 - - - - - - - -
Coble Spring 06/95 -14.3 - - - - 120 199 7.1 17
Compton Spring 06/95 -13.3 - - - - 90 157 6.7 15
Cornaz Spring * 05/94 -10.2 -84 -7.5 113.0 95 - 138 - 16
Coyote Spring 06/95 -13.6 - - - - 80 147 7.6 11
Crystal Lake Spr - 1 * 02/94 -14.0 -102 -13.1 83.0 56 - 98 8.2 10
Crystal Lake Spr - 2 * 05/94 -13.9 - -11.9 84.0 56 - 103 8.5 14
Digger Creek 09/95 -13.1 - -13.4 - 45 35 70 5.8 8
Domingo Spring 09/95 -13.2 -96 -16.8 101.8 67 52 126 8.3 9
Doyle Ranch Well * 10/93 -12.4 -92 -17.3 109.9 250 - 314 - -

Table 1. Chemical and Isotopic Data14C DIC alkalinity conductivity
Sample Location Date δ18O δD δ13C (pmc) (ppm HCO3) (ppm CaCO3) (µS/cm) pH T(°C)
Lassen Region Government Well * 05/94 -11.0 -92 -12.9 115.7 188 - 290 - 19
Hat Creek @ Emigrant Pass 06/95 -14.1 -106 -7.6 72.8 25 24 44 7.3 4
Hat Creek @ Twin Bridges 06/95 -14.0 - -3.5 - 14 18 29 7.3 7
Hat Creek nr. Doyles Corner 06/95 -13.8 - -5.9 - 40 45 84 7.8 12
Jelly Spring * 08/94 -13.8 - - 111.0 154 110 197 6.8 12
Kings Creek Spring 09/95 -13.8 -101 -14.5 103.7 19 14 26 8.0 6
Lost Creek (lower) 06/95 -14.1 -101 -10.8 79.7 37 32 66 7.1 5
Lost Creek (upper) * 08/94 -14.0 - +0.4 47.8 41 40 93 8.0 14
Lost Ck. Spring - 1 * 10/93 -14.3 -106 -11.5 94.8 59 - 102 - -
Lost Ck. Spring - 2 * 02/94 -14.4 -103 -12.3 95.8 59 - 75 7.8 12
Manzanita Creek 06/95 -14.1 - - - - - 85 7.2 5
Manzanita Lake Spring 06/95 -13.7 - -12.5 - 80 45 83 7.0 5
Mill Creek - Hwy 36 07/95 -12.9 -92 -5.8 89.5 15 16 117 5.7 12
Moon Springs * 05/94 -13.1 -101 -11.5 116.6 51 - 82 - 18
Mountain Home Spring 09/95 -12.9 -96 -14.2 77.6 125 52 102 6.2 8
Nanny Creek 07/95 -13.2 -93 -6.8 110.2 25 25 40 6.2 12
Negro Camp Spring 06/95 -14.1 - - - - 60 92 8.5 17
Old Boundary Spring - 1 06/95 -14.0 - -18.1 - 93 55 106 7.2 6
Old Boundary Spring - 2 07/95 -14.0 -99 -18.7 94.3 82 50 102 6.5 6
Paulson’s Well 10/93 -13.2 -94 -13.4 91.1 90 - 148 - -
Pole Spring 06/95 -14.2 - - - - 50 91 7.3 7
Radio Ast. Obsv. Well * 02/94 -14.3 -104 -15.4 107.0 73 - 90 6.7 7
Rimrock Well 09/95 -13.3 - -15.2 100.1 75 70 142 8.5 11
Rising River Sprs - 1 * 10/93 -13.7 -101 -13.6 82.6 69 - 111 - -
Rising River Sprs - 2 * 02/94 -14.0 -100 -12.1 88.3 61 - 92 8.0 14
Rising River Sprs - 3 02/95 -13.9 -100 -9.1 78.8 52 70 125 7.3 8
Rock Spring - 1 * 02/94 -14.2 -104 -12.7 103.0 68 - 105 7.7 9

Table 1. Chemical and Isotopic Data14C DIC alkalinity conductivity
Sample Location Date δ18O δD δ13C (pmc) (ppm HCO3) (ppm CaCO3) (µS/cm) pH T(°C)
Lassen Region Rock Spring - 2 * 08/94 -14.1 - -12.5 100.0 72 - 140 7.7 9
Rock Spring - 3 02/95 -13.5 - [-10.2] 103.3 61 80 132 7.1 8
Salmon Springs 06/95 -13.6 - - - - 60 124 7.7 10
Sam Wolfin Spring * 05/94 -13.4 -99 -16.6 95.2 152 - 198 - 14
Sulphur Creek 07/95 -12.3 - -7.2 - 6 <10 181 4.8 9
Ward Spring 06/95 -13.8 - - - - 85 162 7.6 11
Wilcox Spring 06/95 -13.2 - - - - <10 14 7.8 9
Willow Spring 09/95 -13.1 - - - - 12 31 5.7 8
Wilson Meadow Spring 09/95 -12.9 - - - - - 81 6.3 9
Medicine Lake Region Crank Spring 05/95 -13.7 - - - - 70 134 - 10
Crystal Spring 09/95 -13.7 -98 -13.9 112.6 31 20 37 8.2 7
Fall River - 1 * 06/94 -13.6 - -11.8 80.5 62 75 138 7.9 12
Fall River - 2 06/95 -13.3 -94 -11.2 - 69 75 147 8.3 14
Lava Creek - 1 * 06/94 -13.6 - - 73.1 78 75 155 8.6 14
Lava Creek - 2 06/95 -13.6 -98 -10.8 - 78 75 157 8.0 12
Harris Spring 09/95 -13.4 - - - - 45 78 7.6 9
Hopkins Cave - Lava Beds 05/95 -13.2 -99 - - - - - - -
Paynes Spring 09/95 -13.8 - -19.0 - 53 30 59 7.6 8
Pit River @ Hwy 299 - 1 * 06/94 -13.0 - -9.2 83.7 65 - 166 8.6 19
Pit River @ Hwy 299 - 2 05/95 -13.0 - -10.3 102.3 61 90 145 7.2 13
Pit River @ Hwy 299 - 3 06/95 -13.1 - -11.2 91.7 78 95 153 7.8 14
Pit River @ Pittville 06/95 -12.9 - -10.8 - 76 100 173 6.4 17
Schonchin Spring 09/95 -13.7 -97 -17.4 117.7 61 45 90 7.9 6
Sucker Spring 06/95 -13.7 - - - - 70 155 7.7 13
* Data previously reported in Rose et al. (1995)
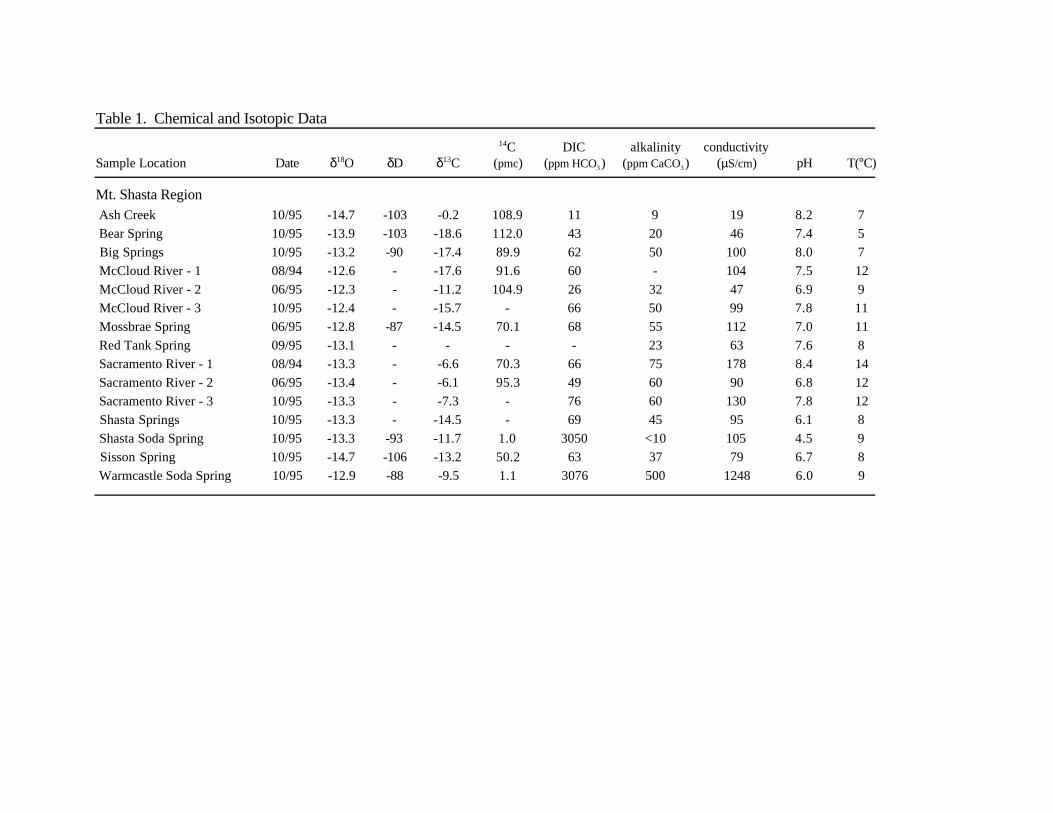
Table 1. Chemical and Isotopic Data
14C DIC alkalinity conductivitySample Location Date δ18O δD δ13C (pmc) (ppm HCO3) (ppm CaCO3) (µS/cm) pH T(°C)
Mt. Shasta Region Ash Creek 10/95 -14.7 -103 -0.2 108.9 11 9 19 8.2 7
Bear Spring 10/95 -13.9 -103 -18.6 112.0 43 20 46 7.4 5
Big Springs 10/95 -13.2 -90 -17.4 89.9 62 50 100 8.0 7
McCloud River - 1 08/94 -12.6 - -17.6 91.6 60 - 104 7.5 12
McCloud River - 2 06/95 -12.3 - -11.2 104.9 26 32 47 6.9 9
McCloud River - 3 10/95 -12.4 - -15.7 - 66 50 99 7.8 11
Mossbrae Spring 06/95 -12.8 -87 -14.5 70.1 68 55 112 7.0 11
Red Tank Spring 09/95 -13.1 - - - - 23 63 7.6 8
Sacramento River - 1 08/94 -13.3 - -6.6 70.3 66 75 178 8.4 14
Sacramento River - 2 06/95 -13.4 - -6.1 95.3 49 60 90 6.8 12
Sacramento River - 3 10/95 -13.3 - -7.3 - 76 60 130 7.8 12
Shasta Springs 10/95 -13.3 - -14.5 - 69 45 95 6.1 8
Shasta Soda Spring 10/95 -13.3 -93 -11.7 1.0 3050 <10 105 4.5 9
Sisson Spring 10/95 -14.7 -106 -13.2 50.2 63 37 79 6.7 8
Warmcastle Soda Spring 10/95 -12.9 -88 -9.5 1.1 3076 500 1248 6.0 9

Technical Inform
ation Departm
ent . Law
rence Liverm
ore National L
aboratoryU
niversity of California . L
ivermore, C
alifornia 94551


![[hydrology] groundwater hydrology - david k. todd (2005).pdf](https://img.pdfslide.net/doc/110x75/577c77961a28abe0548cb0b1/hydrology-groundwater-hydrology-david-k-todd-2005pdf.jpg)


![[Hydrology] groundwater hydrology david k. todd (2005)](https://img.pdfslide.net/doc/110x75/55a8e6001a28ab6c2f8b4687/hydrology-groundwater-hydrology-david-k-todd-2005-55b0d9a792c06.jpg)


![[Hydrology] Groundwater Hydrology - David K. Todd (2005)](https://img.pdfslide.net/doc/110x75/548ce7beb47959e2288b45f9/hydrology-groundwater-hydrology-david-k-todd-2005.jpg)
