Embed Size (px)
Citation preview

RESEARCH ARTICLE
Comparative locomotor costs of domestic dogs reveal energeticeconomy of wolf-like breedsCaleb M. Bryce* and Terrie M. Williams
ABSTRACTThe broad diversity inmorphologyand geographic distribution of the 35free-rangingmembers of the familyCanidae is only rivaledby that of thedomesticated dog, Canis lupus familiaris. Considered to be amongnature’s most elite endurance athletes, both domestic and wild canidsprovide a unique opportunity to examine the variability in mammalianaerobic exercise performance and energy expenditure. To determinethe potential effects of domestication and selective breeding onlocomotor gait and economy in canids, we measured the kinematicsandmass-specificmetabolismof three large (>20 kg) dogbreedgroups(northern breeds, retrievers and hounds) of varying morphological andgenomic relatedness to their shared progenitor, the gray wolf. Bymeasuring all individualsmoving in preferred steady-state gaits along alevel transect and on a treadmill, we found distinct biomechanical,kinematic and energetic patterns for eachbreed group.While all groupsexhibited reduced total cost of transport (COT)at faster speeds, the totalCOT and net COT during trotting and galloping were significantly lowerfor northernbreeddogs (3.0and2.1 J kg−1m−1, respectively) relative tohound (4.2and3.4 J kg−1m−1, respectively)and retrieverdogs (3.8and3.0 J kg−1 m−1, respectively) of comparable mass. Similarly, northernbreeds expended less energy per stride (3.5 J kg−1 stride−1) thanhounds or retrievers (5.0 and 4.0 J kg−1 stride−1, respectively). Theseresults suggest that, in addition to their close genetic andmorphologicalties to gray wolves, northern breed dogs have retained highly cursorialkinematic and physiological traits that promote economical movementacross the landscape.
KEY WORDS: Canids, Gait, Kinematics, Locomotion, Metabolism
INTRODUCTIONAll domestic dogs (Canis lupus familiaris) are recent and exclusivedecedents of gray wolves, Canis lupus Linnaeus 1758, having beendomesticated in the last 15,000–30,000 years (Freedman et al.,2014; Skoglund et al., 2015; Wang et al., 2016). However, amongthe nearly 400 breeds representing modern dogs (Kleiman et al.,2003), unique artificial selection trajectories (Galibert et al., 2011;Jimenez, 2016) have resulted in extreme morphological diversitythat exceeds that for the remainder of the family Canidae (Clutton-Brock, 1999; Lindblad-Toh et al., 2005; Vaysse et al., 2011;Wayne, 1986, 2001; Wilcox and Walkowicz, 1995). In recentyears, much emphasis has been placed on elucidating the origins ofdog domestication from genomic (e.g. Freedman et al., 2014;Parker, 2012; Skoglund et al., 2015; Vonholdt et al., 2010) to
zooarcheological (Perri, 2016; Pionnier-Capitan et al., 2011),morphometric (Drake et al., 2015) and biogeographical evidence(Larson et al., 2012). By comparison, little is known about theeffects of extensive artificial selection on physiologicalperformance and metabolic demands of the different breeds ofdog (but see Bermingham et al., 2014; Careau et al., 2010;Speakman et al., 2003).
With the highest sustained metabolic rates on record(approximately 4400 J kg−1 day−1 while racing 490 km in 3 daysat approximately −20°C; Hinchcliff et al., 1997), canids areconsidered among the most elite endurance athletes in the naturalworld (Miller et al., 2015; Poole and Erickson, 2011; Snow, 1985).This compares with approximately 3900 J kg−1 day−1 for lactatingmice raising artificially large litters (14 pups) in a cold environment(5°C; Hammond et al., 1994), 2000 J kg−1 day−1 for thoroughbredhorses during heavy training (Lewis, 1995; Pagan and Hintz, 1986)and 1400 J kg−1 day−1 for Tour de France cyclists (Westerterp et al.,1986). Dogs, coyotes, wolves and foxes exhibit aerobicperformance capacities roughly three times greater than those ofequivalently sized terrestrial mammals (Seeherman et al., 1981;Taylor et al., 1987a; Weibel and Hoppeler, 2005; Weibel et al.,1983, 2004). Dogs, for example, have aerobic scopes [the ratio ofmaximum oxygen uptake (VO2,max) to basal metabolic rate] of20–30, compared with aerobic scopes of about 10 for goats of equalbody mass (Weibel et al., 1987). To facilitate this greater oxygencapacity, dogs possess structural and functional adaptations at eachstep in the pathway for oxygen, including in the musclemitochondria, muscle microvasculature, heart and lungs (reviewedin Taylor et al., 1987b). Together, the wide aerobic scopes exhibitedby canids are consistent with an ability to run for extended periods atsustained speeds without becoming anaerobic (Koteja, 1987;Okarma and Koteja, 1987).
Given these physiological and morphological characteristics,both domestic and wild canids provide a unique opportunity toinvestigate mammalian exercise performance and energyexpenditure. The expectation is that aerobic capacity provides aselective advantage for wild canids (Okarma and Koteja, 1987). Inthe wild, the rates at which individuals acquire, transform andexpend energy (i.e. their metabolic rates) are integrative measures oforganism function that have fundamental consequences for survivaland reproductive success (Brown et al., 2004; Halsey, 2011). Formany highly mobile species such as canids, the energetic costsassociated with activity and movement form a substantial portion ofdaily energy expenditure (Boisclair and Leggett, 1989; Garland,1983; Girard, 2001; Gorman et al., 1998; Karasov, 1992; Rezendeet al., 2009; Scantlebury et al., 2014; Tatner and Bryant, 1986;Weibel et al., 2004). In wolves and dogs, movement costs aresuperimposed on elevated energy demands associated with largebody size (Peters, 1983), endothermy (Bennett and Ruben, 1979)and carnivory (Carbone et al., 2007, 2011), suggesting a keyselective advantage for minimizing locomotor costs.Received 3 June 2016; Accepted 28 October 2016
Department of Ecology and Evolutionary Biology, University of California, SantaCruz, CA 95060, USA.
*Author for correspondence ([email protected])
C.M.B., 0000-0002-6789-9538
312
© 2017. Published by The Company of Biologists Ltd | Journal of Experimental Biology (2017) 220, 312-321 doi:10.1242/jeb.144188
Journal
ofEx
perim
entalB
iology

Here, we examined how selective breeding and domesticationmay have disrupted the optimization of these locomotor costs andaltered the economy of movement in domestic dogs. This wasaccomplished by comparing the locomotor kinematics andenergetics of three large (>20 kg) breed groups along acontinuum of relative genetic and morphological proximity togray wolves. Northern breed individuals included Siberianhuskies, Alaskan malamutes and Samoyeds. These ‘sled dogs’are among the oldest domestic dog breeds (Huson et al., 2010;Parker, 2012; Wang et al., 2013) and possess the most lupine traits(i.e. bear the greatest morphological and genomic resemblance totheir wild progenitor, the gray wolf; Mech, 1970; Parker et al.,2004; Skoglund et al., 2015; Udell et al., 2010; Vonholdt et al.,2010). Northern breeds have been traditionally used to assisthumans with long-distance activities including arctic huntingexpeditions and sledge pulling (Rennick, 1987). Scent hounds,such as the Plott hounds measured in the present study, wereprimarily bred to aid hunters by tracking the scent of wild game(American Kennel Club, 2006), an activity that requires speed butonly intermediate levels of aerobic endurance relative to northernbreeds. Retrievers (e.g. golden, labrador, flat-coated) were alsobred to assist in hunting, but typically require shorter, largelyanaerobic bouts of activity to retrieve killed or injured game(American Kennel Club, 2006). Because the genomic andmorphological effects of dog domestication have been described(e.g. Drake et al., 2015; Freedman et al., 2014; Parker, 2012;Skoglund et al., 2015), our goal was to assess the coincidentenergetic consequences of human-induced selective pressures forvarious physical traits (e.g. limb length, body mass) and desiredtasks (e.g. guarding, hunting, pulling loads). We found thatworking breeds of dogs most similar to wolves (i.e. northernbreeds) have lower metabolic transport costs than hounds andretrievers, which have undergone divergent artificial selectiontrajectories from this wild canid progenitor.
MATERIALS AND METHODSStudy designWe quantified the overground stride mechanics, kinematics andpreferred speeds of steady-state walking, trotting and galloping inthree breed groups of domestic dogs differing in genomicrelatedness to the gray wolf. These data were then paired to thegait-specific metabolic demands of level exercise for theseanimals measured by open-flow respirometry. Metabolic ratesacross each gait, total and net cost of transport, as well as the costper stride were used to compare overall locomotor energyeconomy across the dog breeds. Assuming that the geneticdistance from wolves approximates the relative extent ofdomestication (Parker, 2012), we then used the breed-specificdata to assess the potential effect of increased domestication onthe economy of movement in dogs.
AnimalsThe study consisted of 23 healthy, adult dogs (2–11 years old) inthree breed categories: northern breeds (N=9), hounds (N=7) andretrievers (N=7; Table 1).
All dogs were deemed healthy, active and without any knownimpairments that might influence locomotion. To ensure adequateconditioning and mitigate training effects associated with the studyprotocol, all subjects participated in routine outdoor exercise andwere physically trained for at least 1 month prior to and throughoutdata collection. Informed written consent, animal age and healthhistory were obtained from all dog owners, and the study protocolwas approved by the UC Santa Cruz Institutional Animal Care andUse Committee.
Gait mechanics and kinematic dataTo determine the physiological basis of gait selection and preferredperformance parameters (Kar et al., 2003; Nanua and Waldron,1995; Perry et al., 1988), we analyzed the natural, unrestrainedlocomotor gaits of each dog with repeated outdoor kinematic trials.During each trial, dogs walked, trotted and galloped at steady-statespeed along a 10 m transect of level ground while being filmed byhigh-speed (Casio EX-F1, 300 frames s−1) and high-definition(Sony HDR-CX290/B, 1080 HD, 60p) video cameras mountedperpendicular to the test course and in the dog’s cranial–caudalsagittal plane.
Videos were analyzed (Corel VideoStudio ProX5, Ottawa, ON,Canada) for animal speed and basic stride mechanics (stride length,stride frequency). Given the dynamic and geometric similarity ofthe subjects (Alexander, 1984, 2005; Alexander and Jayes, 1983),dimensionless Froude numbers (speed2/limb length×gravitationalacceleration) were computed for gait transitions to compare breedsafter accounting for limb length. We excluded from analysis allpasses in which the dog visibly changed gait or speed mid-transect,turned its head, or otherwise deviated from a straight-line path. Thepreferred range of speeds for each gait was then calculated for eachanimal and used to ensure that subsequent metabolic treadmill trialsapproximated the preferred walking, trotting and galloping speedsof the individual dog.
Previous studies report that, overall, dog sagittal-plane gaitpatterns on a level treadmill do not differ from those of overgroundlocomotion (Torres et al., 2013), although the stance phase isslightly longer (Fischer and Lilje, 2011). We tested these findings,and closely examined gait kinematic differences across breeds,using a random subset of at least four dogs within each breed group.Anatomical landmarks on the limb joints were determined viamanual palpation while flexing and extending each joint, thendigitized and tracked at 300 Hz from high-speed videos (TrackerVideo Analysis and Modeling Tool, http://physlets.org/tracker/) tomeasure 24 biomechanical and kinematic parameters (Table 2;Table S1) from the subjects moving overground and on the treadmillat the same gait and speed (±10%).
Table 1. Summary of morphological characteristics for the dogsexamined in this study
BreedSample(N: m,f)
Mass(kg)
Age(years)
Forelimblength (m)
Hindlimblength (m)
Northern 9: 4,5 33.1±3.8 5.9±1.1 0.59±0.03 0.56±0.03Hound 7: 6,1 24.2±0.9 6.0±1.2 0.49±0.02 0.5±0.02Retriever 7: 5,2 33.2±2.3 5.4±1.2 0.6±0.04 0.61±0.05
Data are means±s.e.m. No characteristics differed significantly (P<0.05)across breeds.
List of symbols and abbreviationsCoM center of massCOT cost of transport (J kg−1 m−1)COTnet net cost of transport (J kg−1 m−1)COTtot total cost of transport (J kg−1 m−1)RMR resting metabolic rate (ml O2 kg−1 min−1)tc foot contact time (s)VO2 rate of oxygen consumption (ml O2 kg−1 min−1)
313
RESEARCH ARTICLE Journal of Experimental Biology (2017) 220, 312-321 doi:10.1242/jeb.144188
Journal
ofEx
perim
entalB
iology
Metabolic measurements and energetic costsBecause animals change gaits to achieve stability and minimizeenergetic costs of movement (Biewener, 1990; Cavagna and Kaneko,1977; Hoyt and Taylor, 1981; Hoyt et al., 2006), we compared gait-specific metabolic demands across breed groups. We tooksimultaneous kinematic and metabolic measurements during leveltreadmill running for a subset of dogs according to Williams et al.(2002). For each dog, the rate of oxygen consumption (VO2
, mlO2 kg−1 min−1) during rest and each gait was measured by anintegrated open-flow respirometry system (TurboFOX-RM, SableSystems International, Las Vegas, NV, USA). Following an overnightfast to ensure post-absorptive state, each animalwas conditioned to rest(standing stationaryor lying still in sternal recumbency),walk, trot andgallop inside a reinforced Plexiglas metabolic chamber(1.6 m×0.5 m×1 m) mounted on the surface of a variable-speedtreadmill (Q65, Quinton Instrument Co., Bothell, WA, USA). Thechamber was equipped with a fan to facilitate rapid mixing of expiredgas andprevent overheatingof exercising dogs.Eachdogwasweighed(Aryln 320D, East Rockaway, NY, USA) prior to every exercise trial,and air temperatures averaged 23.4°C (range 22–25°C) within thechamber during measurements. These temperatures fell within thethermoneutral zones of these breeds (National Research Council,2006; Speakman et al., 2003). To ensure that the animals reached aphysiologically stable state, each randomized exercise trial lasted aminimum of 12 min; sessions that included a pre-exercise restingmetabolic rate (RMR) measurement lasted approximately 25 min.Chamber air was drawn through the system with an integrated
vacuum pump at a flow rate of 230 l min−1. At this flow rate, thefractional concentration of oxygen in the chamber remainedabove 0.2040 to avoid hypoxic conditions. Sub-samples of air fromthe exhaust port of the chamber were drawn through a series ofsix columns, alternatingly filled with desiccant (Drierite,W. A. Hammond Drierite, Xenia, OH, USA) and CO2 scrubber(Sodasorb, W.R. Grace & Co, Chicago, IL, USA) before entering anoxygen analyzer. The main flow rate through the chamber,percentage of oxygen in the expired air, humidity of the gas sampleand barometric pressure were monitored continuously and recorded
once per second on a computer using Expedata software (SableSystems International). All values were corrected to standardtemperature and pressure, dry (STPD), and the entire system wascalibrated daily with ambient air (20.95%O2 at sea level where trialsoccurred) and with dry N2 gas to test for chamber mixing and leaksaccording to Fedak et al. (1981).
For each trial, average VO2was calculated using eqn 4b from
Withers (1977) and an assumed respiratory quotient of 0.82 for dogsconsuming a conventional, mixed diet (Raab et al., 1976; Speakmanet al., 2003). Physiological measurements, including energetic costper kilogram per unit distance (cost of transport, COT; J kg−1 m−1)and cost per stride (J kg−1 stride−1), were derived from speed andstride frequency, respectively, using an energy conversion of20.1 J ml−1 O2, assuming a negligible contribution from anaerobicglycolysis (Schmidt-Nielsen, 1997; Taylor et al., 1982). Total costof transport (COTtot) was derived from the slope of the energyexpenditure–speed relationship for each breed, i.e. COTtot wascalculated for each trial measurement by dividing mass-specificmetabolic cost by the trial speed. Net cost of transport (COTnet) wascalculated by subtracting the mean RMRof each individual from theenergetic cost of the trial, then dividing by trial speed. Both COTtot
and COTnet include any postural costs during locomotion (thedifference between mean RMR and the y-intercept in the energyexpenditure–speed relationship; Halsey, 2013, 2016).
During the metabolic measurements on the treadmill, werecorded stride length and stride frequency using high-speed andhigh-definition cameras (described above) mounted in the sagittalplane on the right side of each dog at a distance of 1.65 m. Thetiming intervals for sequential cycles of the right forelimb wereaveraged from the video sequences, and the number of strides takenper second was calculated for each gait (Williams et al., 2002).
Statistical analysisStatistical analyses and figures were produced using JMP Pro12(SAS Institute Inc., Cary, NC, USA) and R (v. 3.1.1, https://www.r-project.org/). We used principle components analysis (PCA) andlinear discriminant analysis (LDA) in tandem to compare kinematic
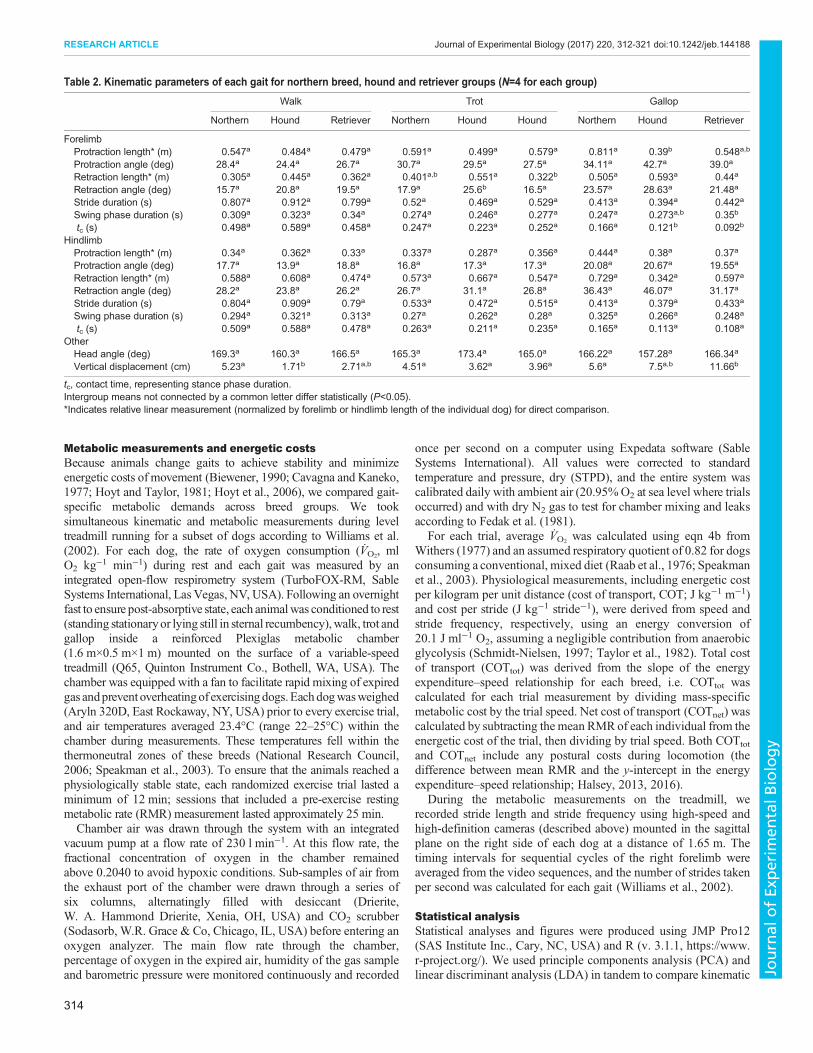
Table 2. Kinematic parameters of each gait for northern breed, hound and retriever groups (N=4 for each group)
Walk Trot Gallop
Northern Hound Retriever Northern Hound Hound Northern Hound Retriever
ForelimbProtraction length* (m) 0.547a 0.484a 0.479a 0.591a 0.499a 0.579a 0.811a 0.39b 0.548a,b
Protraction angle (deg) 28.4a 24.4a 26.7a 30.7a 29.5a 27.5a 34.11a 42.7a 39.0a
Retraction length* (m) 0.305a 0.445a 0.362a 0.401a,b 0.551a 0.322b 0.505a 0.593a 0.44a
Retraction angle (deg) 15.7a 20.8a 19.5a 17.9a 25.6b 16.5a 23.57a 28.63a 21.48a
Stride duration (s) 0.807a 0.912a 0.799a 0.52a 0.469a 0.529a 0.413a 0.394a 0.442a
Swing phase duration (s) 0.309a 0.323a 0.34a 0.274a 0.246a 0.277a 0.247a 0.273a,b 0.35b
tc (s) 0.498a 0.589a 0.458a 0.247a 0.223a 0.252a 0.166a 0.121b 0.092b
HindlimbProtraction length* (m) 0.34a 0.362a 0.33a 0.337a 0.287a 0.356a 0.444a 0.38a 0.37a
Protraction angle (deg) 17.7a 13.9a 18.8a 16.8a 17.3a 17.3a 20.08a 20.67a 19.55a
Retraction length* (m) 0.588a 0.608a 0.474a 0.573a 0.667a 0.547a 0.729a 0.342a 0.597a
Retraction angle (deg) 28.2a 23.8a 26.2a 26.7a 31.1a 26.8a 36.43a 46.07a 31.17a
Stride duration (s) 0.804a 0.909a 0.79a 0.533a 0.472a 0.515a 0.413a 0.379a 0.433a
Swing phase duration (s) 0.294a 0.321a 0.313a 0.27a 0.262a 0.28a 0.325a 0.266a 0.248a
tc (s) 0.509a 0.588a 0.478a 0.263a 0.211a 0.235a 0.165a 0.113a 0.108a
OtherHead angle (deg) 169.3a 160.3a 166.5a 165.3a 173.4a 165.0a 166.22a 157.28a 166.34a
Vertical displacement (cm) 5.23a 1.71b 2.71a,b 4.51a 3.62a 3.96a 5.6a 7.5a,b 11.66b
tc, contact time, representing stance phase duration.Intergroup means not connected by a common letter differ statistically (P<0.05).*Indicates relative linear measurement (normalized by forelimb or hindlimb length of the individual dog) for direct comparison.
314
RESEARCH ARTICLE Journal of Experimental Biology (2017) 220, 312-321 doi:10.1242/jeb.144188
Journal
ofEx
perim
entalB
iology

parameters across breed groups while controlling for locomotor gait.To determine the potential effect of the treadmill on kinematics, weperformed paired Student’s t-tests (two-tailed) comparing the stridefrequency and stride length for treadmill and overgroundlocomotion within the same individual and breed group.Differences in age (years), body mass (kg) and limb length (m)between groups were determined by one-way analysis of variance(ANOVA) followed by Tukey–Kramer honest significant difference(HSD) tests. We also used ANOVA with HDS to compare mass-specific VO2
and stride mechanics by gait across groups. Predicted(Heglund and Taylor, 1988) and measured preferred speeds for eachgait, and transitions between gaits, were compared using pairedStudent’s t-tests. We used analysis of covariance (ANCOVA) andleast square linear regressions to determine the relationshipsbetween running speed and mass-specific metabolic rate, stridefrequency and stride length for each individual and breed group. Forall linear models, we checked the assumptions of linearity,normality and homoscedasticity by visual inspection of plottedresiduals. To examine differences in metabolic COT across breeds,we fitted a three-parameter exponential decaymodel and determinedwhether 95% confidence intervals for each breed group overlappedwith the estimates of the other two groups. All model combinationswere fitted with best model fits based on the lowest Akaikeinformation criteria corrected for small sample size (AICc), andstudy results are expressed as the mean±s.e.m. (α=0.05, a priori).
RESULTSGait mechanicsDog breed groups did not differ significantly from one another in age(F2,20=0.07,P=0.93), bodymass (F2,20=3.0,P=0.07), forelimb length(i.e. withers or shoulder height above ground; F2,17=3.18, P=0.07) orhindlimb length (hip height above ground; F2,17=2.81, P=0.09;Table 1). However, dog breed groups differed significantly in severalof the basic overground stride mechanics measured (Table S2). Forexample, there was wide variation in the range of speeds selected foreach gait (walk, trot and gallop) across breed groups (Fig. 1; TableS2).Relative to hounds, northern breeds walked, trotted and galloped overa broader range of speeds. Retrievers showed a contracted speed rangefor trotting but the largest breadth of galloping speeds. According tothe average travel speed for each gait, the three breed groups did notdiffer from one another while walking (F2,134=0.28, P=0.76), but didfor faster gaits (Table S2). Retrievers trotted at significantly faster
speeds than hounds (t119=1.97, P=0.01) but not northern breeds(t168=1.97, P=0.13). Furthermore, mean galloping speed was fasterfor retrievers than for both hounds and northern breeds (F2,211=17.83,P<0.001; Table S2). Across groups, walk–trot transition speeds(F2,20=0.22,P=0.81) and Froudenumbers (F2,18=1.1,P=0.36) did notdiffer across groups, indicating locomotor similarity at slow speeds.However, at the physiologically equivalent transition from trotting togalloping (Taylor et al., 1982), retrievers ran at faster speeds(F2,20=4.19, P=0.03) and with higher Froude numbers (F2,17=5.27,P=0.02) than did northern breeds or hounds.
Hounds (t6=5.02,P<0.01) and retrievers (t6=2.56,P=0.04), but notnorthern breeds (t8=1.4, P=0.2), trotted at speeds significantly fasterthan predicted for quadrupeds of similar body mass (Heglund andTaylor, 1988). Hounds and retrievers also transitioned from trot togallop at speeds that were faster than predicted by body mass(18–26% faster, P<0.01; Fig. 2). Only retrievers exhibited preferred
Northern
Hound
Retriever
0 1 2 3 4 5Speed (m s–1)
6 7 8 9
Fig. 1. Variation in the range of speeds selected for walking, trotting andgalloping by northern breed, hound and retriever dogs. Box-and-whiskerplots depict group-wide speed ranges (walking, white; trotting, gray; galloping,black), with the median denoted as the vertical line within each gait rangequartile box. Outliers are depicted as individual points beyond the associatedquartiles.
0
0.5
1
1.5
2
2.5
3
3.5
4
Predicted
Measured
Speed (m s–1)
00.5
11.5
22.5
33.5
4
Stri
de fr
eque
ncy
(stri
des
s–1 )
00 1 2 3 4 5 6 7 8 9 10
0.51
1.52
2.53
3.54
B
A
C
Fig. 2. Comparison of predicted andmeasured physiologically equivalenttrot–gallop transition speeds. (A) Northern breed, (B) hound and(C) retriever dogs. The figure shows stride frequency in relation to locomotorspeed while moving on a level outdoor transect. Each data point is a singlemeasurement for a test run by an individual dog. Dash–dot lines represent theminimum and maximum range of the data across speeds. The gray boxdenotes the difference between measured (dashed vertical line) and predicted(dotted vertical line) (Heglund and Taylor, 1988) trot–gallop transition speedsfor each breed. Pseudo-linearity of data within each group is caused by limitedvariation of speed–stride frequency measurements resulting from the 10 moutdoor transect length used during data collection.
315
RESEARCH ARTICLE Journal of Experimental Biology (2017) 220, 312-321 doi:10.1242/jeb.144188
Journal
ofEx
perim
entalB
iology
galloping speeds faster than those predicted by Heglund and Taylor(1988) (t6=2.83, P=0.03).
KinematicsAfter controlling for individual, gait and speed,we found no consistenteffect of the treadmill relative to overground locomotion on sagittalplane joint flexion and extension (Torres et al., 2013) and thereforeassumed treadmill trials were representative of free-ranging doglocomotion. While not significantly different (P=0.07–0.09 range),limb lengths were generally shorter in hounds than in other breeds(Table 1). To account for this, we used relative limb protraction andretraction length values (dividing by limb length of each dog) insubsequent analyses (Table 2). After using PCA and LDA to condensethe initial set of 24 measured kinematic parameters down to 18variables loaded onto 5 factors as determined by eigenvalues >1, wedetected group-wide differences in trotting (Wilk’s λ=0.002,P=0.038), but not walking (Wilk’s λ=0.042, P=0.88) or galloping(Wilk’s λ=0.002, P=0.35). Upon closer analysis of each gait withANOVA, we found that, relative to hounds and retrievers, northernbreeds had the greatest vertical displacement while walking (5.2±1.4 cm,F2,17=5.0,P=0.02), and that this displacement exceeded that oftheir trot (4.5±0.9 cm; Table 2). While trotting, forelimb retractionlength was greater in hounds than in retrievers (t13=2.1, P<0.01), andforelimb retraction angle was greatest in hounds relative to both othergroups (F2,18=10.54,P<0.01; Table 2). During gallop, northern breedsshowed longer forelimb stance durations (F2,10=17.27, P<0.001) andprotraction lengths (F2,10=5.94, P=0.02) than hounds and retrievers(Table 2). In contrast, the duration of the forelimb galloping swingphase was significantly longer for retrievers than for northern breeds(t10=2.23, P<0.01; Table 2).
EnergeticsBecause bodymass differences between groups can biasmass-specificcomparisons of oxygen consumption (Packard and Boardman, 1999),we first tested for a possible effect of mass. We used ANCOVAwithresting oxygen consumption as the dependent variable, breed group asthemain factor and bodymass as a covariate. The general linear modelwas highly significant (GLM:F5,183=8.2,P<0.01), but bodymasswasnot a significant covariate (mass: d.f.=1, F=2.5, P=0.12), nor was itsinteraction with breed group significant (breed×mass interaction:d.f.=2, F=2.9, P=0.08). We therefore assumed that mass-specificoxygen consumption rates appropriately account for the effect of bodymass within the comparatively small mass range of the dogs in ourstudy. We used these rates for all subsequent analyses to compareenergy demand of the dogs with data from other studies typicallyreporting VO2
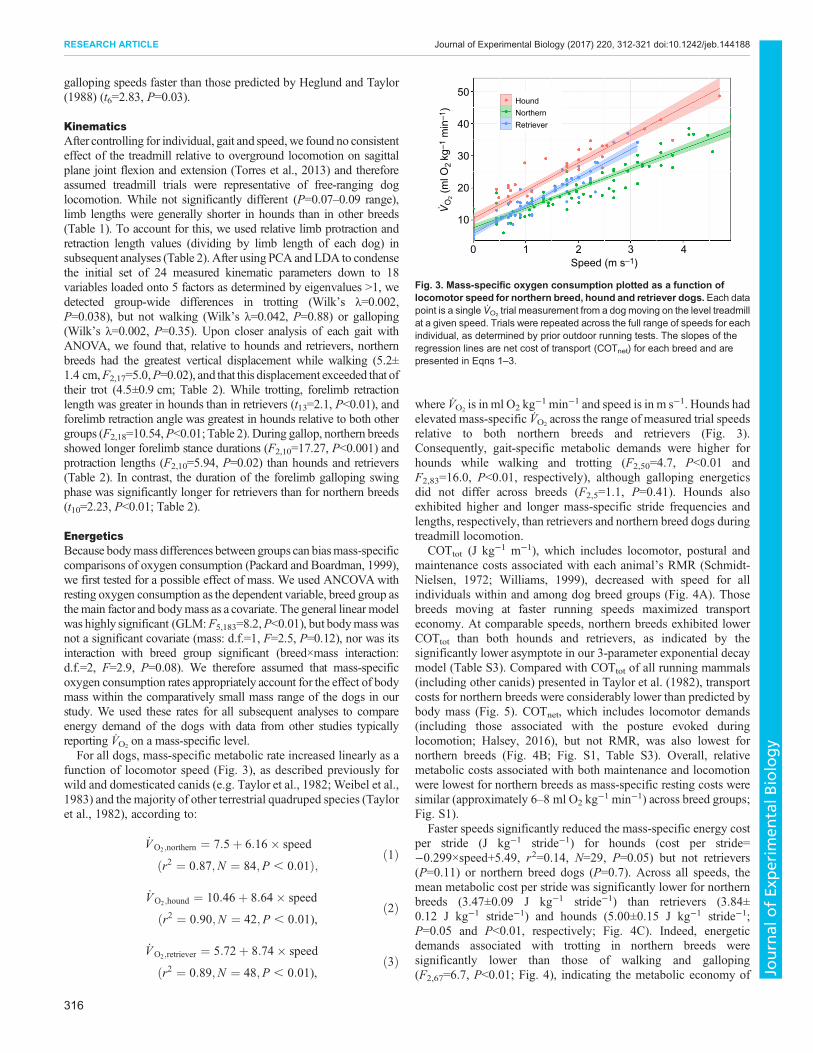
on a mass-specific level.For all dogs, mass-specific metabolic rate increased linearly as a
function of locomotor speed (Fig. 3), as described previously forwild and domesticated canids (e.g. Taylor et al., 1982; Weibel et al.,1983) and the majority of other terrestrial quadruped species (Tayloret al., 1982), according to:
_VO2;northern ¼ 7:5þ 6:16� speed
ðr2 ¼ 0:87;N ¼ 84;P , 0:01Þ;ð1Þ
_VO2;hound ¼ 10:46þ 8:64� speed
ðr2 ¼ 0:90;N ¼ 42;P , 0:01),ð2Þ
_VO2;retriever ¼ 5:72þ 8:74� speed
ðr2 ¼ 0:89;N ¼ 48;P , 0:01),ð3Þ
where VO2is in ml O2 kg
−1 min−1 and speed is in m s−1. Hounds hadelevated mass-specific VO2
across the range of measured trial speedsrelative to both northern breeds and retrievers (Fig. 3).Consequently, gait-specific metabolic demands were higher forhounds while walking and trotting (F2,50=4.7, P<0.01 andF2,83=16.0, P<0.01, respectively), although galloping energeticsdid not differ across breeds (F2,5=1.1, P=0.41). Hounds alsoexhibited higher and longer mass-specific stride frequencies andlengths, respectively, than retrievers and northern breed dogs duringtreadmill locomotion.
COTtot (J kg−1 m−1), which includes locomotor, postural andmaintenance costs associated with each animal’s RMR (Schmidt-Nielsen, 1972; Williams, 1999), decreased with speed for allindividuals within and among dog breed groups (Fig. 4A). Thosebreeds moving at faster running speeds maximized transporteconomy. At comparable speeds, northern breeds exhibited lowerCOTtot than both hounds and retrievers, as indicated by thesignificantly lower asymptote in our 3-parameter exponential decaymodel (Table S3). Compared with COTtot of all running mammals(including other canids) presented in Taylor et al. (1982), transportcosts for northern breeds were considerably lower than predicted bybody mass (Fig. 5). COTnet, which includes locomotor demands(including those associated with the posture evoked duringlocomotion; Halsey, 2016), but not RMR, was also lowest fornorthern breeds (Fig. 4B; Fig. S1, Table S3). Overall, relativemetabolic costs associated with both maintenance and locomotionwere lowest for northern breeds as mass-specific resting costs weresimilar (approximately 6–8 ml O2 kg
−1 min−1) across breed groups;Fig. S1).
Faster speeds significantly reduced the mass-specific energy costper stride (J kg−1 stride−1) for hounds (cost per stride=−0.299×speed+5.49, r2=0.14, N=29, P=0.05) but not retrievers(P=0.11) or northern breed dogs (P=0.7). Across all speeds, themean metabolic cost per stride was significantly lower for northernbreeds (3.47±0.09 J kg−1 stride−1) than retrievers (3.84±0.12 J kg−1 stride−1) and hounds (5.00±0.15 J kg−1 stride−1;P=0.05 and P<0.01, respectively; Fig. 4C). Indeed, energeticdemands associated with trotting in northern breeds weresignificantly lower than those of walking and galloping(F2,67=6.7, P<0.01; Fig. 4), indicating the metabolic economy of
50HoundNorthernRetriever40
30
20
10
0 1 2 3 4
VO
2 (m
l O2
kg–1
min
–1)
·
Speed (m s–1)
Fig. 3. Mass-specific oxygen consumption plotted as a function oflocomotor speed for northern breed, hound and retriever dogs. Each datapoint is a single VO2 trial measurement from a dog moving on the level treadmillat a given speed. Trials were repeated across the full range of speeds for eachindividual, as determined by prior outdoor running tests. The slopes of theregression lines are net cost of transport (COTnet) for each breed and arepresented in Eqns 1–3.
316
RESEARCH ARTICLE Journal of Experimental Biology (2017) 220, 312-321 doi:10.1242/jeb.144188
Journal
ofEx
perim
entalB
iology

trotting relative to both slower and faster gaits in this group.Forelimb and hindlimb foot contact times (tc) were positively relatedto these costs per stride in hounds (cost per stride=3.13+4.64tc,r2=0.84, P<0.01; cost per stride=3.17+4.5tc, r2=0.89, P<0.01,respectively), but had no effect on retriever and northern breed dogs(P=0.67–0.82 range).
DISCUSSIONAlthough dogs in general possess a suite of adaptations for aerobiclocomotion (reviewed in Taylor et al., 1987b), the between-groupdifferences we observed in the present study reflect a physiologicalsignature of artificial selection in the economy of running bydifferent dog breeds. We found that that this was manifested asbreed-specific differences in both overground stride mechanics andtreadmill-derived movement energetics among northern breed,hound and retriever groups. Thus, faster speeds promoted maximumeconomy for all dogs, but northern breeds had the lowest COTtot,COTnet and cost per stride levels relative to hounds and retrieverswhen trotting and galloping (Fig. 4).Our hypothesis, that dog breeds more closely related to their gray
wolf progenitor have relatively lower COT, was empiricallysupported (Fig. 4; Fig. S1, Table S3). Hounds and retrievers areboth relatively modern breeds compared with the ancient lineagethat includes northern breed dogs (Huson et al., 2010; Parker et al.,
2004; Vonholdt et al., 2010; Wang et al., 2013). Genetically, theancient breeds cluster together closest to gray wolves, but the groupis surprisingly diverse in morphology and origin. This groupincludes the akita and chow chow of Asian origin, the saluki andAfghan hounds from the Middle East, the African basenji, and thenorthern breeds we assessed (Parker, 2012). Our study suggests thatover the last ≥15,000 years of domestication, selective breeding hasaltered the aerobic locomotor economy of dogs, with the northernbreeds retaining an economical physiological foundation thatoriginated with gray wolves. To date, the limited existing data onthe metabolic cost of running in wolves (Taylor et al., 1982; Weibelet al., 1983) does not indicate superior locomotor energy economyin wolves. However, comparisons with the current study may bemisleading as a result of the adult ages of our dogs and the immatureage of the wolves in the previous studies. Consequently, additionalstudies that measure ecologically relevant metabolic rates of adultwolves at endurance speeds are needed to determine the similaritiesor differences in locomotor energetics of wolves and domesticateddogs of comparable morphology and age.
To determine whether interbreed differences in energetic costsper stride were related to variation in gait patterns, we compared theFroude numbers for each breed at the walk–trot and trot–galloptransition speeds. Previous work has shown that animals of differentmasses but moving at the same Froude number are dynamicallysimilar, and hence use the same gait, have comparable foot phaserelationships, relative stride lengths and duty factors, and exertsimilar ground reaction forces (Alexander, 1984, 2005; Alexanderand Jayes, 1983). At the walk–trot gait transition, our resultsreflected those of prior studies (e.g. Jayes and Alexander, 1978;Maes et al., 2008) where dogs began trotting at Froude numbers≤0.5. However, dogs in our study began galloping at Froudenumbers around 1 (mean=0.93±0.07), much lower than thepredicted Froude numbers (≥3) reported in the previous studies.Both lower sample sizes and space constraints of the previousstudies (Jayes and Alexander, 1978; Maes et al., 2008) may have
0
2
4
6
8
10
12
CO
T net
(J k
g–1
m–1
)
012345678
Walk Trot Gallop
Ste
p co
st (J
kg–
1 st
ride–
1 )
02468
10121416
CO
T tot
(J k
g–1
m–1
) Northern
Hound
Retriever
B
C
A
Fig. 4. Mass-specific energetic costs associated with the cost oftransport and cost per stride. (A) Total cost of transport (COTtot), (B) COTnetand (C) cost per stride for running dogs. Three locomotor gaits for northernbreeds, hounds and retrievers were compared. Boxes not connected by adashed line differ significantly (P<0.05). Total COT was lowest while gallopingfor all groups, and northern breeds had significantly lower COTnet and stepcosts than hounds and retrievers, particularly while trotting.
Mass (kg)
CO
T tot
(J k
g–1
m–1
)
11
Dog 1
Dog 2
Dog 3
Dog 4
Dog 5
Hound
Northern
RetrieverWild dog
10 1002
2
3
4
5
6
7
8
910
3 4 5 6 7 8 20 30 40 50 60 70 80
Fig. 5. COTtot for various canids in relation to the allometric regression ofTaylor et al. (1982) for running mammals: COTtot=10.7×mass−0.32
(dashed line). Filled triangles are data from the present study; open symbolsrepresent data from dogs (breeds not specified) and African wild dogs runningon a level treadmill as presented in Taylor et al. (1982). All dogs measured inthe present study had lower transport costs than predicted by body mass, andthis was particularly true for the northern breed dogs.
317
RESEARCH ARTICLE Journal of Experimental Biology (2017) 220, 312-321 doi:10.1242/jeb.144188
Journal
ofEx
perim
entalB
iology
contributed to these differences in Froude numbers when comparingour trials of 23 individual dogs running off-leash along an outdoorcourse.When compared with the gait mechanics predictions of Heglund
and Taylor (1988), we found that hounds and retrievers, but notnorthern breeds, trotted and transitioned from trot to gallop at speedssignificantly faster than expected based on body mass (Fig. 2). Theoriginal study by Heglund and Taylor (1988) developed allometricequations concerning the effects of body size on stride mechanicsfrom 16 species of wild and domestic quadrupeds ranging in massfrom 30 g mice to 680 kg horses. Domestic dogs represented theonly carnivore species in their analysis. It is noteworthy that in thepresent study, the two breed groups that differed significantly fromthe predicted mechanics, the hounds and retrievers, also showedsignificantly higher mass-specific COT and stride costs for thesegaits than northern breed dogs (Fig. 4). In contrast, the stridemechanics of the northern breeds were as predicted. Overall,centuries of selective breeding for hunting performance in houndsand retrievers may have increased the preferred speed range forthese breeds (Fig. 1; Table S2), with ensuing reduced locomotoreconomy (Fig. 4; Table S3).Despite differences in basic stride mechanics across breeds,
detailed kinematic analyses revealed limited distinctions betweengroups. Based on 24 kinematic parameters, we found largerforelimb retraction lengths and angles while trotting for houndscompared with northern breeds and retrievers (Table 2). This widerforelimb swing resulted in longer stride lengths and faster stridefrequencies for hounds, which may have contributed to their higherCOT and stride costs while trotting (Fig. 4). In contrast, northernbreeds were the only group in which the mass-specific stride costsassociated with trotting were significantly lower than those of bothwalking and galloping (Fig. 4C), resulting in relative energyeconomy for this intermediate-speed gait. This group also exhibitedreduced vertical displacement while trotting compared with walking(Table 2). Such ‘spring dampening’ while loading the Achillestendon at speed reduces damaging vibrations and enhances forwardpropulsion with subsequent energy savings (Alexander, 2001;Hermanson, 1997; Reilly et al., 2007; Wilson et al., 2000, 2001),which is consistent with our metabolic measurements (Fig. 3).More generally, most terrestrial quadrupeds exhibit two unique
mechanisms for reducing muscular work, and hence energyexpenditure, during locomotion: pendular and mass-springdynamics (Biewener, 2006; Cavagna and Kaneko, 1977; Cavagnaet al., 1977; Hoyt et al., 2006). At walking speeds, animalsexchange kinetic energy with potential energy of their center ofmass (CoM) through an inverted pendulum mechanism (Cavagnaet al., 1977; Griffin et al., 2004). Pendular energy savings persisteven for loaded and incline locomotion (Gomeñuka et al., 2014;Pontzer, 2016), although the benefits of this mechanism diminish atfaster speeds (Gomeñuka et al., 2016). For running gaits, a spring–mass mechanism predominates, where stretched elastic structures(ligaments and tendons) store and recover mechanical energy(Alexander, 1988; Blickhan, 1989; Cavagna et al., 1977, 1988). Inthe present study, the economical trotting gait of northern breeddogs likely suggests optimized spring–mass energy savingscompared with other breeds. This is consistent with observationsof these animals during endurance activities and races. For example,Greenland sled dogs are capable of trotting at 2.5 m s−1 for 8–10 heach day for 2–3 days, covering 60–80 km daily (Gerth et al., 2010).Similarly, wolves routinely travel in the trotting gait at the samespeed (2.4 m s−1; Mech, 1994) and can cover 76 km in 12 h (Mechand Cluff, 2011).
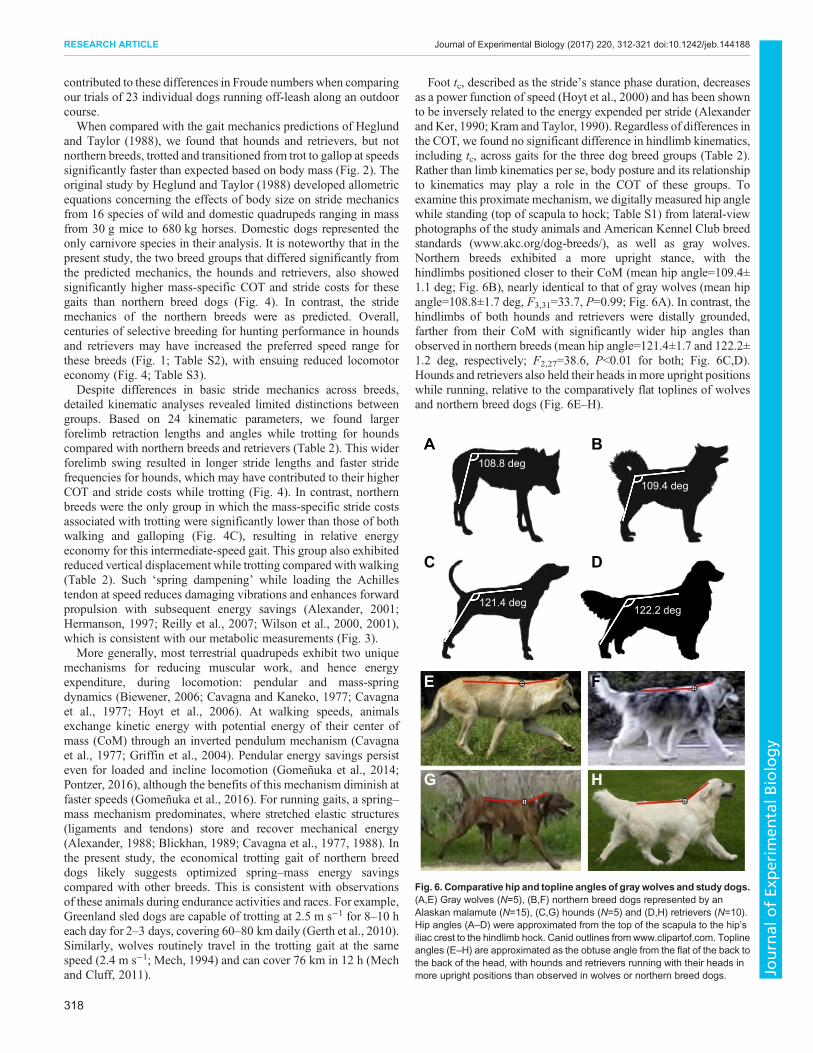
Foot tc, described as the stride’s stance phase duration, decreasesas a power function of speed (Hoyt et al., 2000) and has been shownto be inversely related to the energy expended per stride (Alexanderand Ker, 1990; Kram and Taylor, 1990). Regardless of differences inthe COT, we found no significant difference in hindlimb kinematics,including tc, across gaits for the three dog breed groups (Table 2).Rather than limb kinematics per se, body posture and its relationshipto kinematics may play a role in the COT of these groups. Toexamine this proximate mechanism, we digitally measured hip anglewhile standing (top of scapula to hock; Table S1) from lateral-viewphotographs of the study animals and American Kennel Club breedstandards (www.akc.org/dog-breeds/), as well as gray wolves.Northern breeds exhibited a more upright stance, with thehindlimbs positioned closer to their CoM (mean hip angle=109.4±1.1 deg; Fig. 6B), nearly identical to that of gray wolves (mean hipangle=108.8±1.7 deg, F3,31=33.7, P=0.99; Fig. 6A). In contrast, thehindlimbs of both hounds and retrievers were distally grounded,farther from their CoM with significantly wider hip angles thanobserved in northern breeds (mean hip angle=121.4±1.7 and 122.2±1.2 deg, respectively; F2,27=38.6, P<0.01 for both; Fig. 6C,D).Hounds and retrievers also held their heads in more upright positionswhile running, relative to the comparatively flat toplines of wolvesand northern breed dogs (Fig. 6E–H).
108.8 deg
109.4 deg
121.4 deg122.2 deg
A B
C D
E F
G H
Fig. 6. Comparative hip and topline angles of graywolves and study dogs.(A,E) Gray wolves (N=5), (B,F) northern breed dogs represented by anAlaskan malamute (N=15), (C,G) hounds (N=5) and (D,H) retrievers (N=10).Hip angles (A–D) were approximated from the top of the scapula to the hip’siliac crest to the hindlimb hock. Canid outlines from www.clipartof.com. Toplineangles (E–H) are approximated as the obtuse angle from the flat of the back tothe back of the head, with hounds and retrievers running with their heads inmore upright positions than observed in wolves or northern breed dogs.
318
RESEARCH ARTICLE Journal of Experimental Biology (2017) 220, 312-321 doi:10.1242/jeb.144188
Journal
ofEx
perim
entalB
iology

Although this is a preliminary assessment, there are severalmechanical advantages of the upright stance and flat topline ofnorthern breed dogs and wolves that could impact the energeticcosts of running. By aligning the joints and segments of thehindlimbs more closely with the ground reaction force vectorexerted at the foot (Gray, 1968), the more proximal and erectorientation of northern breed hindlimbs reduces excessive bone andmuscle stress (Biewener, 1989). It also provides an effectivemechanical advantage for loading the tendons of the leg musclesand ligaments of the foot (Alexander and Ker, 1990; Biewener,1989, 1998; Reilly et al., 2007), likely contributing to the relativelocomotor economy observed in northern breeds. These connectivetissues function like ‘springy struts’ (Wentink, 1979) or pogo sticksto temporarily store, then return, the elastic strain energy necessaryto move the limb and body (reviewed in Alexander, 1990, 2002;Blickhan, 1989; Ker, 1981; Taylor, 1994) and are especiallyimportant during trotting (Cavagna et al., 1977; Gregersen et al.,1998).Several studies have investigated the muscle–tendon architecture
of the canid hindlimb (Shahar and Milgram, 2001) and its effect onspeed and power generation (Kemp et al., 2005; Pasi and Carrier,2003; Williams et al., 2008), but the role of comparative functionalanatomy in promoting locomotor economy across dog breeds andcanids in general remains largely unexplored. Here, we speculate thatspecialized tendon loading and energy recoverymay provide a naturalmechanism enabling wolves and other large canids to track prey overlong distances (e.g.Mech et al., 2015; Sheldon, 1992).When retainedthrough domestication, such a mechanism may help explain theexceptional physiological performance of northern breed dogs duringextreme distance events such as the 1600 km Iditarod Trail race andother endurance trials (Gerth et al., 2010; Hinchcliff et al., 1997;Miller et al., 2014; Van Citters and Franklin, 1969).
AcknowledgementsWe thank J. Estes, C. C. Wilmers, P. Raimondi and members of the T. M. Williamslab for their editorial support, all dog owners, as well as D. Sur, C. Hill, C. Casey,C. Reichmuth, T. Kendall and B. Richter for dog handling and training assistance.
Competing interestsThe authors declare no competing or financial interests.
Author contributionsC.M.B. and T.M.W. conceived and designed the study. C.M.B. and T.M.W.conducted all experiments. C.M.B. analyzed the data and wrote the manuscript witheditorial advice provided by T.M.W.
FundingSupport was provided by the National Science Foundation (DBI 0963022, DBI1255913, GK-12 DGE-0947923), with additional support from several small grantsto C.M.B. from the Science Internship Program (SIP) and the Ecology andEvolutionary Biology (EEB) Department at University of California, Santa Cruz.
Supplementary informationSupplementary information available online athttp://jeb.biologists.org/lookup/doi/10.1242/jeb.144188.supplemental
ReferencesAlexander, R. M. N. (1984). The gaits of bipedal and quadrupedal animals.Int. J. Rob. Res. 3, 49-59.
Alexander, R. M. N. (1988). Elastic Mechanisms in Animal Movement. Cambridge,England: Cambridge University Press.
Alexander, R. M. N. (1990). Three uses for springs in legged locomotion. Int. J. Rob.Res. 9, 53-61.
Alexander, R. M. N. (2001). Damper for bad vibrations. Nature 414, 855-857.Alexander, R. M. N. (2002). Tendon elasticity andmuscle function.Comp. Biochem.Physiol. A Mol. Integr. Physiol. 133, 1001-1011.
Alexander, R. M. N. (2005). Models and the scaling of energy costs for locomotion.J. Exp. Biol. 208, 1645-1652.
Alexander, R. M. N. and Jayes, A. S. (1983). A dynamic similarity hypothesis for thegaits of quadrupedal mammals. J. Zool. 201, 135-152.
Alexander, R. M. N. and Ker, R. F. (1990). Running is priced by the step. Nature346, 220-221.
American Kennel Club (2006). The Complete Dog Book, 20th edn. New York:Ballantine Books.
Bennett, A. F. and Ruben, J. A. (1979). Endothermy and activity in vertebrates.Science 206, 649-654.
Bermingham, E. N., Thomas, D. G., Cave, N. J., Morris, P. J., Butterwick, R. F.and German, A. J. (2014). Energy requirements of adult dogs: a meta-analysis.PLoS ONE 9, e109681.
Biewener, A. A. (1989). Scaling body support in mammals: limb posture andmusclemechanics. Science 245, 45-48.
Biewener, A. A. (1990). Biomechanics of mammalian terrestrial locomotion.Science 250, 1097-1103.
Biewener, A. A. (1998). Muscle-tendon stresses and elastic energy storage duringlocomotion in the horse. Comp. Biochem. Physiol. B Biochem. Mol. Biol. 120,73-87.
Biewener, A. A. (2006). Patterns of mechanical energy change in tetrapod gait:pendula, springs and work. J. Exp. Zool. A Comp. Exp. Biol. 305A, 899-911.
Blickhan, R. (1989). The spring-mass model for running and hopping. J. Biomech.22, 1217-1227.
Boisclair, D. and Leggett, W. C. (1989). The importance of activity in bioenergeticsmodels applied to actively foraging fishes. Can. J. Fish. Aquat. Sci. 46,1859-1867.
Brown, J. H., Gillooly, J. F., Allen, A. P., Savage, V. M. and West, G. B. (2004).Toward a metabolic theory of ecology. Ecology 85, 1771-1789.
Carbone, C., Teacher, A. andRowcliffe, J. M. (2007). The costs of carnivory.PLoSBiol. 5, 363-368.
Carbone, C., Pettorelli, N. and Stephens, P. A. (2011). The bigger they come, theharder they fall: body size and prey abundance influence predator-prey ratios.Biol. Lett. 7, 312-315.
Careau, V., Reale, D., Humphries, M. M. and Thomas, D. W. (2010). The pace oflife under artificial selection: personality, energy expenditure, and longevity arecorrelated in domestic dogs. Am. Nat. 175, 753-758.
Cavagna, G. A. and Kaneko, M. (1977). Mechanical work and efficiency in levelwalking and running. J. Physiol. 268, 467-481.
Cavagna, G. A., Heglund, N. C. and Taylor, C. R. (1977). Mechanical work interrestrial locomotion: two basic mechanisms for minimizing energy expenditure.Am. J. Physiol. 233, R2430-RR261.
Cavagna, G. A., Franzetti, P., Heglund, N. C. and Willems, P. (1988). Thedeterminants of the step frequency in running, trotting and hopping in man andother vertebrates. J. Physiol. 81-92.
Clutton-Brock, J. (1999). A Natural History of Domesticated Mammals, 2nd edn.Cambridge: Cambridge University Press.
Drake, A. G., Coquerelle, M. and Colombeau, G. (2015). 3D morphometricanalysis of fossil canid skulls contradicts the suggested domestication of dogsduring the late Paleolithic. Nat. Sci. Rep. 5, 1-8.
Fedak, M. A., Rome, L. and Seeherman, H. J. (1981). One-step N2-dilutiontechnique for calibrating open-circuit VO2 measuring systems. J. Appl. Physiol.51, 772-776.
Fischer, M. S. and Lilje, K. E. (2011). Dogs in Motion. London: The Pet BookPublishing Company.
Freedman, A. H., Gronau, I., Schweizer, R. M., Ortega-Del Vecchyo, D., Han, E.,Silva, P. M., Galaverni, M., Fan, Z., Marx, P., Lorente-Galdos, B. et al. (2014).Genome sequencing highlights the dynamic early history of dogs. PLoS Genet.10, e1004016.
Galibert, F., Quignon, P., Hitte, C. and Andre, C. (2011). Toward understandingdog evolutionary and domestication history.Comptes Rendus Biol. 334, 190-196.
Garland, T. J. (1983). Scaling the ecological cost of transport to body mass interrestrial mammals. Am. Nat. 121, 571-587.
Gerth, N., Redman, P., Speakman, J., Jackson, S. and Starck, J. M. (2010).Energy metabolism of Inuit sled dogs. J. Comp. Physiol. B Biochem. Syst.Environ. Physiol. 180, 577-589.
Girard, I. (2001). Field cost of activity in the kit fox, Vulpes macrotis. Physiol.Biochem. Zool. 74, 191-202.
Gomen uka, N. A., Bona, R. L., da Rosa, R. G. and Peyre-Tartaruga, L. A. (2014).Adaptations to changing speed, load, and gradient in human walking: cost oftransport, optimal speed, and pendulum. Scand. J. Med. Sci. Sports 24,e165-e173.
Gomen uka, N. A., Bona, R. L., da Rosa, R. G. and Peyre-Tartaruga, L. A. (2016).The pendular mechanism does not determine the optimal speed of loadedwalkingon gradients. Hum. Mov. Sci. 47, 175-185.
Gorman,M. L., Mills, M. G., Raath, J. P. and Speakman, J. R. (1998). High huntingcosts make African wild dogs vulnerable to kleptoparasitism by hyaenas. Nature391, 479-481.
Gray, J. (1968). Animal Locomotion. New York: W.W. Norton & Company, Inc.Gregersen, C. S., Silverton, N. A. and Carrier, D. R. (1998). External work and
potential for elastic storage at the limb joints of running dogs. J. Exp. Biol. 201,3197-3210.
319
RESEARCH ARTICLE Journal of Experimental Biology (2017) 220, 312-321 doi:10.1242/jeb.144188
Journal
ofEx
perim
entalB
iology

Griffin, T. M., Main, R. P. and Farley, C. T. (2004). Biomechanics of quadrupedalwalking: how do four-legged animals achieve inverted pendulum-likemovements? J. Exp. Biol. 207, 3545-3558.
Halsey, L. G. (2011). The challenge of measuring energy expenditure: current fieldand laboratory methods. Comp. Biochem. Physiol. A Mol. Integr. Physiol. 158,247-251.
Halsey, L. G. (2013). The relationship between energy expenditure and speedduring pedestrian locomotion in birds: a morphological basis for the elevated y-intercept? Comp. Biochem. Physiol. A Mol. Integr. Physiol. 165, 295-298.
Halsey, L. G. (2016). Terrestrial movement energetics: current knowledge and itsapplication to the optimising animal. J. Exp. Biol. 219, 1424-1431.
Hammond, K. A., Konarzewski, M., Torres, R. M. and Diamond, J. (1994).Metabolic ceilings under a combination of peak energy demands. Physiol. Zool.67, 1479-1506.
Heglund, N. C. and Taylor, C. R. (1988). Speed, stride frequency and energy costper stride: how do they changewith body size and gait? J. Exp. Biol. 138, 301-318.
Hermanson, J.W. (1997). Architecture and the division of labor in the extensor carpiradialis muscle of horses. Acta Anat. 159, 127-135.
Hinchcliff, K. W., Reinhart, G. A., Burr, J. R., Schreier, C. J. and Swenson, R. A.(1997). Metabolizable energy intake and sustained energy expenditure of Alaskansled dogs during heavy exertion in the cold. Am. J. Vet. Res. 58, 1457-1462.
Hoyt, D. F. and Taylor, C. R. (1981). Gait and the energetics of locomotion inhorses. Nature 292, 239-240.
Hoyt, D. F., Wickler, S. J. and Cogger, E. A. (2000). Time of contact and steplength: the effect of limb length, running speed, load carrying and incline. J. Exp.Biol. 203, 221-227.
Hoyt, D. F., Wickler, S. J., Dutto, D. J., Catterfeld, G. E. and Johnsen, D. (2006).What are the relations between mechanics, gait parameters, and energetics interrestrial locomotion? J. Exp. Zool. A Comp. Exp. Biol. 305A, 912-922.
Huson, H. J., Parker, H. G., Runstadler, J. and Ostrander, E. A. (2010). A geneticdissection of breed composition and performance enhancement in the Alaskansled dog. BMC Genet. 11, 71.
Jayes, A. S. and Alexander, R. M. N. (1978). Mechanics of locomotion of dogs(Canis familiaris) and sheep (Ovis aries). J. Zool. 185, 289-308.
Jimenez, A. G. (2016). Physiological underpinnings in life-history trade-offs inman’s most popular selection experiment: the dog. J. Comp. Physiol. B Biochem.Syst. Environ. Physiol. 186, 813-827.
Kar, D. C., Kurien Issac, K. and Jayarajan, K. (2003). Gaits and energetics interrestrial legged locomotion. Mech. Mach. Theory 38, 355-366.
Karasov, W. H. (1992). Daily energy expenditure and the cost of activity inmammals. Am. Zool. 32, 238-248.
Kemp, T. J., Bachus, K. N., Nairn, J. A. andCarrier, D. R. (2005). Functional trade-offs in the limb bones of dogs selected for running versus fighting. J. Exp. Biol.208, 3475-3482.
Ker, R. F. (1981). Dynamic tensile properties of the plantaris tendon of sheep (Ovisaries). J. Exp. Biol. 93, 283-302.
Kleiman, D. G., Geist, V. and McDade, M. C. eds. (2003). Grzimek’s Animal LifeEncyclopedia: Mammals. 2nd edn. Gale.
Koteja, P. (1987). On the relation between basal and maximum metabolic rate inmammals. Comp. Biochem. Physiol. A. Comp. Physiol. 87, 205-208.
Kram, R. and Taylor, C. R. (1990). Energetics of running: a new perspective.Nature346, 265-267.
Larson, G., Karlsson, E. K., Perri, A., Webster, M. T., Ho, S. Y. W., Peters, J.,Stahl, P. W., Piper, P. J., Lingaas, F., Fredholm, M. et al. (2012). Rethinking dogdomestication by integrating genetics, archeology, and biogeography. Proc. Natl.Acad. Sci. USA 109, 8878-8883.
Lewis, L. D. (1995). Equine Clinical Nutrition: Feeding and Care. Oxford: Wiley-Blackwell.
Lindblad-Toh, K., Wade, C. M., Mikkelsen, T. S., Karlsson, E. K., Jaffe, D. B.,Kamal, M., Clamp, M., Chang, J. L., Kulbokas, E. J., Zody, M. C. et al. (2005).Genome sequence, comparative analysis and haplotype structure of the domesticdog. Nature 438, 803-819.
Maes, L. D., Herbin, M., Hackert, R., Bels, V. L. and Abourachid, A. (2008).Steady locomotion in dogs: temporal and associated spatial coordination patternsand the effect of speed. J. Exp. Biol. 211, 138-149.
Mech, L. D. (1970). TheWolf: TheBehavior and Ecology of an Endangered Species.New York: Natural History Press.
Mech, L. D. (1994). Regular and homeward travel speeds of Arctic wolves.J. Mammal. 75, 741-742.
Mech, L. D. andCluff, H. D. (2011). Movements of wolves at the northern extreme ofthe species’ range, including during four months of darkness. PLoS ONE 6, 2-6.
Mech, L. D., Smith, D. W. and MacNulty, D. R. (2015). Introduction: the wolf as akilling machine. In Wolves On the Hunt: The Behavior of Wolves Hunting WildPrey. Chicago: University of Chicago Press.
Miller, B. F., Drake, J. C., Peelor, F. F., Biela, L. M., Geor, R. J., Hinchcliff, K. W.,Davis, M. and Hamilton, K. L. (2014). Participation in a 1000-mile race increasesthe oxidation of carbohydrate in Alaskan sled dogs. J. Appl. Physiol. 118,1502-1509.
Miller, B. F., Ehrlicher, S. E., Drake, J. C., Peelor, F. F., Biela, L. M., Pratt-Phillips,S., Davis, M., Hamilton, K. L., Frederick, F., Biela, L. M. et al. (2015).
Assessment of protein synthesis in highly aerobic canine species at the onset andduring exercise training. J. Appl. Physiol. 118, 811-817.
Nanua, P. andWaldron, K. J. (1995). Energy comparison between trot, bound, andgallop using a simple model. J. Biomech. Eng. 117, 466-473.
National Research Council (2006). Nutrient Requirements of Dogs and Cats.Washington, DC: National Academies Press.
Okarma, H. and Koteja, P. (1987). Metabolic rate in the gray wolf in Poland. J. Wildl.Manage. 51, 800-801.
Packard, G. C. and Boardman, T. J. (1999). The use of percentages and size-specific indices to normalize physiological data for variation in body size: wastedtime, wasted effort? Comp. Biochem. Physiol. A Mol. Integr. Physiol. 122, 37-44.
Pagan, J. D. and Hintz, H. F. (1986). Energy expenditure in horses duringsubmaximal exercise. J. Anim. Sci. 63, 822-830.
Parker, H. G. (2012). Genomic analyses of modern dog breeds. Mamm. Genome23, 19-27.
Parker, H. G., Kim, L. V., Sutter, N. B., Carlson, S., Lorentzen, T. D., Malek, T. B.,Johnson, G. S., DeFrance, H. B., Ostrander, E. A. and Kruglyak, L. (2004).Genetic structure of the purebred domestic dog. Science 304, 1160-1164.
Pasi, B. M. and Carrier, D. R. (2003). Functional trade-offs in the limb muscles ofdogs selected for running vs. fighting. J. Evol. Biol. 16, 324-332.
Perri, A. (2016). A wolf in dog’s clothing: initial dog domestication and Pleistocenewolf variation. J. Archaeol. Sci. 68, 1-4.
Perry, A. K., Blickhan, R., Biewener, A. A., Heglund, N. C. and Taylor, C. R.(1988). Preferred speeds in terrestrial vertebrates: are they equivalent? J. Exp.Biol. 137, 207-219.
Peters, R. H. (1983). The Ecological Implications of Body Size. Cambridge:Cambridge University Press.
Pionnier-Capitan, M., Bemilli, C., Bodu, P., Celerier, G., Ferrie, J.-G., Fosse, P.,Garcia, M. and Vigne, J.-D. (2011). New evidence for Upper Palaeolithic smalldomestic dogs in South-Western Europe. J. Archaeol. Sci. 38, 2123-2140.
Pontzer, H. (2016). A unified theory for the energy cost of legged locomotion. Biol.Lett. 12, 20150935.
Poole, D. C. andErickson, H. H. (2011). Highly athletic terrestrial mammals: horsesand dogs. Compr. Physiol. 1, 1-37.
Raab, J. L., Eng, P. andWaschler, R. A. (1976). Metabolic cost of grade running indogs. J. Appl. Physiol. 41, 532-535.
Reilly, S. M., McElroy, E. J. and Biknevicius, A. R. (2007). Posture, gait and theecological relevance of locomotor costs and energy-saving mechanisms intetrapods. Zoology 110, 271-289.
Rennick, P. ed. (1987). Dogs of the North. Anchorage, AK: Alaska GeographicSociety.
Rezende, E. L., Gomes, F. R., Chappell, M. A. and Garland, T., Jr. (2009).Running behavior and its energy cost in mice selectively bred for high voluntarylocomotor activity. Physiol. Biochem. Zool. 82, 662-679.
Scantlebury, D. M., Mills, M. G. L., Wilson, R. P., Wilson, J. W., Mills, M. E. J.,Durant, S. M., Bennett, N. C., Bradford, P., Marks, N. J. and Speakman, J. R.(2014). Flexible energetics of cheetah hunting strategies provide resistanceagainst kleptoparasitism. Science 346, 79-81.
Schmidt-Nielsen, K. (1972). Locomotion: energy cost of swimming, flying, andrunning. Science 177, 222-228.
Schmidt-Nielsen, K. (1997). Animal Physiology: Adaptation and Environment, 5thedn. New York: Cambridge University Press.
Seeherman, H. J., Taylor, C. R., Maloiy, G. M. O. and Armstrong, R. B. (1981).Design of the mammalian respiratory system. II. Measuring maximum aerobiccapacity. Respir. Physiol. 44, 11-23.
Shahar, R. and Milgram, J. (2001). Morphometric and anatomic study of the hindlimb of a dog. Am. J. Vet. Res. 62, 928-933.
Sheldon, J. W. (1992). Wild Dogs: The Natural History of the NondomesticatedCanidae. San Diego: Academic Press.
Skoglund, P., Ersmark, E., Palkopoulou, E. and Dalen, L. (2015). Ancient wolfgenome reveals an early divergence of domestic dog ancestors and admixtureinto high-latitude breeds. Curr. Biol. 25, 1515-1519.
Snow, D. H. (1985). The horse and dog, elite athletes—why and how? Proc. Nutr.Soc. 44, 267-272.
Speakman, J. R., Van Acker, A. and Harper, E. J. (2003). Age-related changes inthemetabolism and body composition of three dog breeds and their relationship tolife expectancy. Aging Cell 2, 265-275.
Tatner, P. and Bryant, D. M. (1986). Flight cost of a small passerine measuredusing doubly labeled water: implications for energetics studies. Auk 103, 169-180.
Taylor, C. R. (1994). Relating mechanics and energetics during exercise. Adv. Vet.Sci. Comp. Med. 38A, 181-215.
Taylor, C. R., Heglund, N. C. and Maloiy, G. M. (1982). Energetics and mechanicsof terrestrial locomotion 1. Metabolic energy consumption as a function of speedand body size in birds and mammals. J. Exp. Biol. 97, 1-21.
Taylor, C. R., Karas, R. H., Weibel, E. R. and Hoppeler, H. (1987a). Adaptivevariation in the mammalian respiratory system in relation to energetic demand: II.Reaching the limits to oxygen flow. Respir. Physiol. 69, 7-26.
Taylor, C. R., Weibel, E. R., Karas, R. H. and Hoppeler, H. (1987b). Adaptivevariation in the mammalian respiratory system in relation to energetic demand:
320
RESEARCH ARTICLE Journal of Experimental Biology (2017) 220, 312-321 doi:10.1242/jeb.144188
Journal
ofEx
perim
entalB
iology
VIII. Structural and functional design principles determining the limits to oxidativemetabolism. Respir. Physiol. 69, 117-127.
Torres, B. T., Moens, N. M. M., Al-Nadaf, S., Reynolds, L. R., Fu, Y.-C. andBudsberg, S. C. (2013). Comparison of overground and treadmill based gaits ofdogs. Am. J. Vet. Res. 74, 535-541.
Udell, M. A. R., Dorey, N. R. and Wynne, C. D. L. (2010). What did domesticationdo to dogs? A new account of dogs’ sensitivity to human actions. Biol. Rev. 85,327-345.
Van Citters, R. L. and Franklin, D. L. (1969). Cardiovascular performance ofAlaska sled dogs during exercise. Circ. Res. 24, 33-42.
Vaysse, A., Ratnakumar, A., Derrien, T., Axelsson, E., Rosengren Pielberg, G.,Sigurdsson, S., Fall, T., Seppala, E. H., Hansen, M. S. T., Lawley, C. T. et al.(2011). Identification of genomic regions associated with phenotypic variationbetween dog breeds using selection mapping. PLoS Genet. 7, e1002316.
VonHoldt, B. M., Pollinger, J. P., Lohmueller, K. E., Han, E., Parker, H. G.,Quignon, P., Degenhardt, J. D., Boyko, A. R., Earl, D. A., Auton, A. et al.(2010). Genome-wide SNP and haplotype analyses reveal a rich historyunderlying dog domestication. Nature 464, 898-902.
Wang, G.-D., Zhai, W., Yang, H.-C., Fan, R.-X., Cao, X., Zhong, L., Wang, L., Liu,F., Wu, H., Cheng, L.-G. et al. (2013). The genomics of selection in dogs and theparallel evolution between dogs and humans. Nat. Commun. 4, 1860.
Wang, G.-D., Zhai, W., Yang, H.-C., Wang, L., Zhong, L., Liu, Y.-H., Fan, R.-X.,Yin, T.-T., Zhu, C.-L., Poyarkov, A. D. et al. (2016). Out of southern East Asia: thenatural history of domestic dogs across the world. Cell Res. 26, 21-33.
Wayne, R. K. (1986). Limb morphology of domestic and wild canids: the influence ofdevelopment on morphologic change. J. Morphol. 187, 301-319.
Wayne, R. K. (2001). Consequences of domestication: morphological diversity ofthe dog. In TheGenetics of the Dog (ed. A. Ruvinksy and J. Sampson.), pp. 43-60.Oxon, UK: CABI Publishing.
Weibel, E. R. and Hoppeler, H. (2005). Exercise-induced maximal metabolic ratescales with muscle aerobic capacity. J. Exp. Biol. 208, 1635-1644.
Weibel, E. R., Taylor, C. R., Neil, J. J. O., Leith, D. E., Gehr, P., Hoppeler, H.,Langman, V. and Baudinette, R. V. (1983). Maximal oxygen consumption and
pulmonary diffusing capacity: a direct comparison of physiologic andmorphometric measurements in canids. Respir. Physiol. 54, 173-188.
Weibel, E. R., Taylor, C. R., Hoppeler, H. and Karas, R. H. (1987). Adaptivevariation in the mammalian respiratory system in relation to energetic demand: I:introduction to problem and strategy. Respir. Physiol. 69, 1-6.
Weibel, E. R., Bacigalupe, L. D., Schmitt, B. and Hoppeler, H. (2004). Allometricscaling of maximal metabolic rate in mammals: muscle aerobic capacity asdeterminant factor. Respir. Physiol. Neurobiol. 140, 115-132.
Wentink, G. H. (1979). Dynamics of the hind limb at walk in horse and dog. Anat.Embryol. 155, 179-190.
Westerterp, K., Saris, W., Van Es, M. and ten Hoor, F. (1986). Use of the doublylabeled water technique in humans during heavy sustained exercise. J. Appl.Physiol. 61, 2161-2167.
Wilcox, B. and Walkowicz, C. (1995). Atlas of Dog Breeds of the World, 5th edn.Neptune City, NJ: T.F.H. Publications.
Williams, T. M. (1999). The evolution of cost efficient swimming inmarinemammals:limits to energetic optimization. Philos. Trans. R. Soc. Lond. B. Biol. Sci. 354,193-201.
Williams, T. M., Ben-David, M., Noren, S., Rutishauser, M., McDonald, K. andHeyward, W. (2002). Running energetics of the North American river otter: doshort legs necessarily reduce efficiency on land?Comp. Biochem. Physiol. A. Mol.Integr. Physiol. 133, 203-212.
Williams, S. B., Wilson, A. M., Rhodes, L., Andrews, J. and Payne, R. C. (2008).Functional anatomy and muscle moment arms of the pelvic limb of an elitesprinting athlete: the racing greyhound (Canis familiaris). J. Anat. 213, 361-372.
Wilson, A. M., van den Borget, A. J. and McGuigan, M. P. (2000). Optimization ofthe muscle-tendon unit for economical locomotion in cursorial animals. InSkeletalMuscle Mechanics: From Mechanisms to Function (ed. W. Herzog), pp. 517-547.New York: Wiley.
Wilson, A. M., McGuigan, M. P., Su, A. and van Den Bogert, A. J. (2001). Horsesdamp the spring in their step. Nature 414, 895-899.
Withers, C. (1977). Measurement of VO2, VCO2, and evaporative water loss with aflow-through mask. J. Appl. Physiol. 42, 120-123.
321
RESEARCH ARTICLE Journal of Experimental Biology (2017) 220, 312-321 doi:10.1242/jeb.144188
Journal
ofEx
perim
entalB
iology

SUPPLEMENTARY MATERIALS
Table S1. Kinematic parameter definitions. Measurement units are enclosed in parentheses.
Protraction length* (m) The paw’s maximum forward excursion distance, measured from the ground directly beneath the top of the
scapula (withers)
Protraction angle (deg) The angle from the paw at maximum forward excursion to the ground directly beneath the withers
Retraction length* (m) The paw’s maximum backward excursion distance, measured from the ground directly beneath the hip
Retraction angle (deg) The angle from the paw at maximum backward excursion to the ground directly beneath the hip
Stride duration (s) The length of time between two consecutive touchdowns of the same limb
Swing phase duration (s) The length of time between the limb lifting off and touching down again
Stance phase duration
(i.e. contact time, tc) (s)
The length of time that the limb is in contact with the ground
Head angle (deg) The obtuse angle of the dog’s head relative to its back topline (hip to withers)
Hip angle (deg) The obtuse angle from dog’s withers to the hip’s iliac crest to the hindlimb hock
Vertical displacement (cm) The maximum vertical distance covered by the dog’s back, as measured from the withers
* indicates linear measurement normalized by fore or hindlimb length of individual dog for direct comparison
Jour
nal o
f Exp
erim
enta
l Bio
logy
• S
uppl
emen
tary
info
rmat
ion
Journal of Experimental Biology 220: doi:10.1242/jeb.144188: Supplementary information

Table S2. Overground stride mechanics for all breeds examined across three distinct gaits.
Walk Trot Gallop
Northern Hound Retriever Northern Hound Retriever Northern Hound Retriever
Speed (m·s-1) 1.27±0.04A 1.28±0.05A 1.23±0.05A 2.7±0.06AB 2.51±0.09B 2.8±0.07A 4.96±0.11A 4.9±0.2A 5.94±0.14B
Stride frequency
(strides·s-1) 1.5±0.04AB 1.57±0.05A 1.38±0.05B
2.1±0.03 AB 2.2±0.04A 2.07±0.03B
2.61±0.03A 2.6±0.06A 2.64±0.04A
Stride length (m) 0.84±0.02AB 0.82±0.02B 0.9±0.02A 1.26±0.02A 1.13±0.03B 1.36±0.02C 1.91±0.04A 1.91±0.1A 2.26±0.04B
Data are mean ± s.e.m. Intergroup means not connected by a common letter differ statistically (p<0.05).
Jour
nal o
f Exp
erim
enta
l Bio
logy
• S
uppl
emen
tary
info
rmat
ion
Journal of Experimental Biology 220: doi:10.1242/jeb.144188: Supplementary information
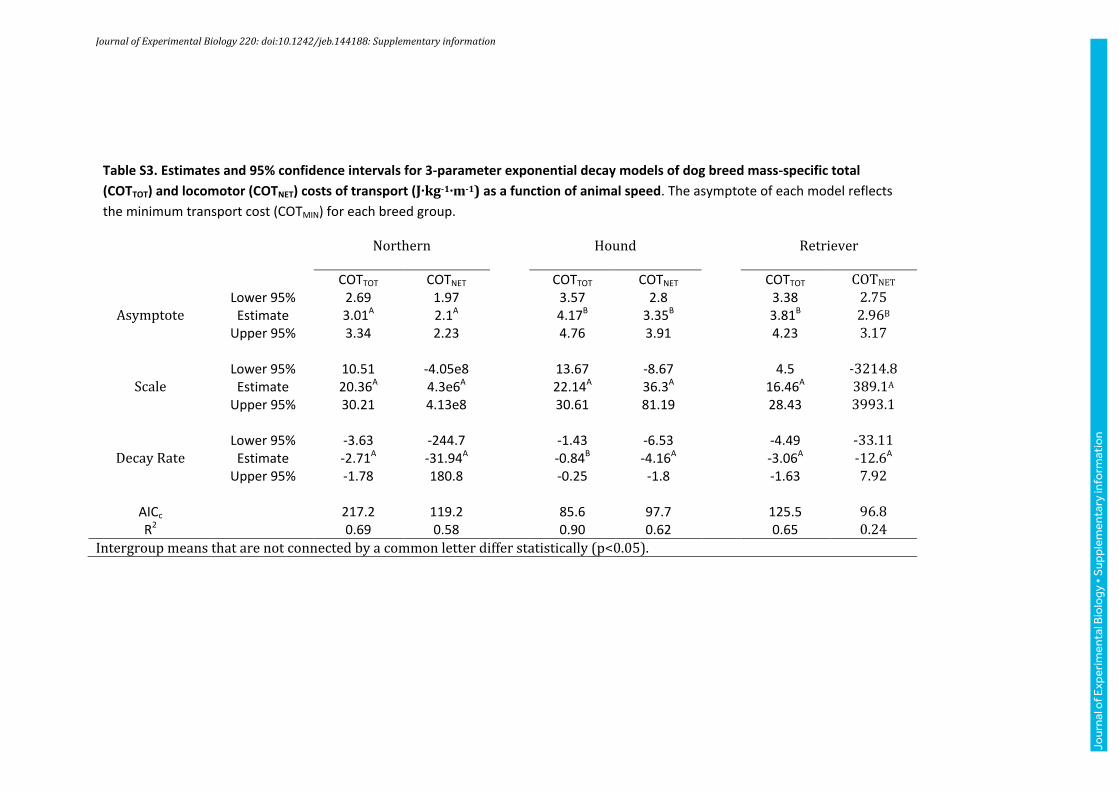
Table S3. Estimates and 95% confidence intervals for 3-parameter exponential decay models of dog breed mass-specific total
(COTTOT) and locomotor (COTNET) costs of transport (J∙kg-1∙m-1) as a function of animal speed. The asymptote of each model reflects
the minimum transport cost (COTMIN) for each breed group.
Northern Hound Retriever
COTTOT COTNET COTTOT COTNET COTTOT COTNET
Lower 95% 2.69 1.97 3.57 2.8 3.38 2.75 Asymptote Estimate 3.01A 2.1A 4.17B 3.35B 3.81B 2.96B
Upper 95% 3.34 2.23 4.76 3.91 4.23 3.17 Lower 95% 10.51 -4.05e8 13.67 -8.67 4.5 -3214.8
Scale Estimate 20.36A 4.3e6A 22.14A 36.3A 16.46A 389.1A
Upper 95% 30.21 4.13e8 30.61 81.19 28.43 3993.1 Lower 95% -3.63 -244.7 -1.43 -6.53 -4.49 -33.11
Decay Rate Estimate -2.71A -31.94A -0.84B -4.16A -3.06A -12.6A Upper 95% -1.78 180.8 -0.25 -1.8 -1.63 7.92
AICc 217.2 119.2 85.6 97.7 125.5 96.8 R2 0.69 0.58 0.90 0.62 0.65 0.24
Intergroup means that are not connected by a common letter differ statistically (p<0.05).
Jour
nal o
f Exp
erim
enta
l Bio
logy
• S
uppl
emen
tary
info
rmat
ion
Journal of Experimental Biology 220: doi:10.1242/jeb.144188: Supplementary information

Figure S1. Relative mass-specific energetic demands (mean ± s.e.m. error bars) associated with locomotion (scaled from COTNET, J∙kg-
1∙m-1) and maintenance costs (scaled from RMR, ml O2·kg-1·min-1) for northern breed (n = 9), hound (n = 7), and retriever (n = 7) dogs.
Overall relative metabolic costs associated with both maintenance and locomotion were lowest for northern breeds as mass-specific
resting costs were similar (approx. 6-8 ml O2·kg-1·min-1) across breed groups.
Jour
nal o
f Exp
erim
enta
l Bio
logy
• S
uppl
emen
tary
info
rmat
ion
Journal of Experimental Biology 220: doi:10.1242/jeb.144188: Supplementary information