Embed Size (px)
Citation preview
1
COMPARATIVE MAINTENANCE OF PASPALUM AND BERMUDA GRASSES
By
IVAN M. VARGAS ALTAMIRANO
A THESIS PRESENTED TO THE GRADUATE SCHOOL OF THE UNIVERSITY OF FLORIDA IN PARTIAL FULFILLMENT
OF THE REQUIREMENTS FOR THE DEGREE OF MASTER OF SCIENCE
UNIVERSITY OF FLORIDA
2010
2
© 2010 Ivan M. Vargas Altamirano

3
To my parents who taught me the importance of intense dedication
4
ACKNOWLEDGMENTS
First, I must thank GOD for his love, guidance and help. Next, I wish to express my
appreciation to Dr. Jerry B. Sartain, chairman of my supervisory committee, for his
support, strong ethic, and encouragement throughout my degree program. I would also
like to thank my committee members Dr. Obreza and Dr. Kruse for their support.
I want to give a sincere thank you to the lab and field people Nahid Varshovi,
Martin Sandquest, Dawn Lucas, Ronald Gonzalez, Carolina Medina, and Mark Kann for
their assistance. Also, I would like to thank Florida Turfgrass Association (FTGA) for
generously supporting my research and to Soil and Water Science Department and the
College of Agricultural and Life Sciences for providing my research assistantship.
Finally, I want to thank my family and friends. I thank my father Rosendo Vargas
and my mother Sandra Altamirano who provide me with the best examples of honesty,
love, and hard work. Thank go out to my brothers and sisters. I want to thank “La
Familia” of Gainesville for their support during the period of my degree; moreover, I
want to give special recognition to Jena Chojnowski for her invaluable help, patience,
and love.
5
TABLE OF CONTENTS page
ACKNOWLEDGMENTS ...................................................................................................... 4
LIST OF TABLES ................................................................................................................ 6
LIST OF FIGURES .............................................................................................................. 7
ABSTRACT.......................................................................................................................... 9
CHAPTER
1 INTRODUCTION ........................................................................................................ 11
Golf Course Economical Impact................................................................................. 11 Bermudagrass............................................................................................................. 12 Seashore Paspalum ................................................................................................... 14 Maintenance Practices ............................................................................................... 18 Hypothesis and Research Objectives ........................................................................ 20
2 MATERIAL AND METHODS ...................................................................................... 21
Field Study Design...................................................................................................... 21 Data Collection............................................................................................................ 22 Data Analysis .............................................................................................................. 23
3 RESULTS AND DISCUSSION COMPARATIVE MAINTENANCE OF PASPALUM AND BERMUDA GRASSES ................................................................. 25
Study Description ........................................................................................................ 25 Introduction and Material and Methods ............................................................... 25
2008 and 2009 Results and Discussion .................................................................... 26 Turf Visual Quality ................................................................................................ 26 Ball Roll ................................................................................................................ 32 Growth Rate ......................................................................................................... 36 Nitrogen Uptake ................................................................................................... 38 Thatch Depth ........................................................................................................ 40 Root Dry Matter .................................................................................................... 42 Loss on Ignition .................................................................................................... 44 Economic Analysis ............................................................................................... 45
4 SUMMARY AND CONCLUSSIONS .......................................................................... 47
REFERENCES .................................................................................................................. 74
BIOGRAPHICAL SKETCH................................................................................................ 78
6
LIST OF TABLES
Table page 3-1 Ball roll distance of paspalum cultivars in response to management practices
and N rate 2008 and 2009. .................................................................................... 57
3-2 Growth rate of bermuda cultivars in response to management practices and N rate in 2009. ........................................................................................................ 60
3-3 Nitrogen uptake of paspalum cultivars and bermuda cultivars in respond to management practices and N rate in 2008. .......................................................... 63
3-4 Percent weight loss on ignition of bermuda cultivars in respond to management practices and N rate in 2008. .......................................................... 71
3-5 Cultural practices and total maintenance cost of two paspalum cultivars (Sea Dwarf and Sea Isle Supreme) grown in putting greens of 125.4 m2. ................... 72
3-6 Cultural practices and total maintenance cost of two bermuda cultivars (Mini Verde and Jones Dwarf) grown in putting greens of 125.4 m2. ............................ 73
7
LIST OF FIGURES
Figure page 2-1 Individual plot plan split-block design with three nitrogen rates and three
replications arranged in a randomized complete block design (RCBD) with two topdressing as the sub-plot factor. .................................................................. 49
3-1 Effect of nitrogen rate on the overall mean visual quality in 2008 for A) Paspalum cultivars, B) Bermuda cultivars, and in 2009 for C) Paspalum cultivars, D) Bermuda cultivars.. ............................................................................ 50
3-2 Effect of nitrogen rate on visual quality in the 2nd evaluation period for paspalum grasses in 2008. .................................................................................... 52
3-3 Effect of nitrogen rate on Mini Verde bermuda grass visual quality 2nd
evaluation period in 2008. ...................................................................................... 52
3-4 Effect of nitrogen rate on Jones Dwarf bermuda grass visual quality 4th evaluation period in 2008. ...................................................................................... 53
3-5 Effect of nitrogen rate on the overall mean Mini Verde bermuda grass visual quality in 2009. ....................................................................................................... 53
3-6 Effect of nitrogen rate on the overall mean Jones Dwarf Bermuda grass visual quality evaluation period in 2009................................................................. 54
3-7 Effect of nitrogen rate on the overall mean ball roll distance in 2008 for A) Paspalum cultivars, B) Bermuda cultivars, and in 2009 for C) Paspalum cultivars, D) Bermuda cultivars.. ............................................................................ 55
3-8 Effect of nitrogen rate on the overall mean growth rate in 2008 for A) Paspalum cultivars, B) Bermuda cultivars, and in 2009 for C) Paspalum cultivars, D) Bermuda cultivars Paspalum cultivars.. ............................................ 58
3-9 Effect of nitrogen rate on Mini Verde overall mean growth rate in 2008. ............. 60
3-10 Effect of nitrogen rate on the overall nitrogen uptake in 2008 for A) Paspalum cultivars, B) Bermuda cultivars, and in 2009 for C) Paspalum cultivars, D) Bermuda cultivars................................................................................................... 61
3-11 Effect of nitrogen rate on Mini Verde bermudagrass nitrogen uptake 2nd evaluation period in 2008. ...................................................................................... 64
3-12 Effect of nitrogen rate on the overall nitrogen uptake for Mini Verde in 2009 ...... 64
8
3-13 Effect of nitrogen rate on the overall thatch depth in 2008 for A) Paspalum cultivars, B) Bermuda cultivars, and in 2009 for C) Paspalum cultivars, D) Bermuda cultivars................................................................................................... 65
3-14 Effect of nitrogen rate on the overall roots dry matter in 2008 for A) Paspalum cultivars, B) Bermuda cultivars, and in 2009 for C) Paspalum cultivars, D) Bermuda cultivars Paspalum cultivars.. ................................................................ 67
3-15 Effect of nitrogen rate on the overall loss on ignition in 2008 for A) Paspalum cultivars, B) Bermuda cultivars, and in 2009 for C) Paspalum cultivars, D) Bermuda cultivars................................................................................................... 69
9
Abstract of Thesis Presented to the Graduate School of the University of Florida in Partial Fulfillment of the Requirements for the Degree of Master of Science
COMPARATIVE MAINTENANCE OF PASPALUM AND BERMUDA GRASSES
By
Ivan M. Vargas Altamirano
May 2010
Chair: Jerry B Sartain Major: Soil and Water Science
Paspalum grasses have been adopted by golf courses in the southeast U.S.
because they appear to have a low nitrogen (N) requirement and a high tolerance to
high salinity irrigation water. However, adequate management practices and their
economical implications that permit acceptable playability for paspalum grasses are
mostly unknown and undocumented compared with the commonly used bermuda
grasses. This study (run in 2008 and 2009) evaluated two Paspalum cultivars Paspalum
vaginatum Swarz (Sea Dwarf and Sea Isle Supreme) and two bermuda cultivars C.
dactylon (L). Pers. X C. transvaalensis Burtt Davy (Jones Dwarf and Mini Verde) grown
on putting greens relative to their playability, N nutrition, and maintenance costs. In
2008, two factors such as: three N rates (49, 98 and 196 kg N ha-1 yr-1) and two
topdressing frequencies (twice and every month) were studied. In 2009, the N rates
were reduced for paspalum grasses (12, 24, and 49 kg N ha-1 yr-1) and increased for
bermuda grasses (122, 244, and 488 kg N ha-1 yr-1). Also in 2009, the topdressing
frequency was changed to a verticutting frequency factor (every 2 weeks and every 4
weeks). The effect of the treatments was determined for multiple parameters including
visual quality, golf ball roll, growth rate, nitrogen uptake, thatch depth, root dry matter,
and thatch accumulation (weight loss on ignition). The principal results from (i) turfgrass
10
cultivar, (ii) N nutrition requirements, and (iii) total maintenance cost are as follow. (i)
Jones Dwarf produced the highest growth rate. Paspalum grasses produced more root
dry matter than Bermuda grasses, which was reflected in higher N uptake and greater
thatch depth. Different topdressing applications did not influence visual quality.
However, Jones Dwarf beneficed from monthly topdressing with 1.6 mm of sand.
Verticutting every 2 weeks should be included as a management practice for the
Paspalum cultivar (Sea Isle Supreme) in order to achieve acceptable golf playability
conditions. Maintenance requirements for both bermuda cultivars and one Paspalum
cultivar (Sea Dwarf) when grown on push-up native soil greens should include
verticutting once a month in order to obtain acceptable ball roll distance. (ii) Paspalum
cultivars should be fertilized four times (from May to August) with an N application rate
of 49 kg N ha-1 yr-1 in order to obtain an acceptable visual quality. In comparison
bermuda cultivars should be fertilized throughout all the active growth period (from May
to September) at the rate of 488 kg N ha-1 yr-1 to maintain acceptable quality. (iii)
Paspalum grass fertilization cost ($138) was lower than bermuda grasses ($806) per
year basis growing in putting greens of 125.4 m2. Paspalum grasses had a higher
verticutting cost ($560) than bermuda grasses ($280). Paspalum grasses total
maintenance cost was lower ($4811) than bermuda grasses total maintenance ($5199).
Therefore, this study found that Paspalum cultivars differed with bermuda grasses in
terms of turfgrass cultivar, N nutrition requirements, and total maintenance cost.
11
CHAPTER 1 INTRODUCTION
Golf Course Economical Impact
In the United States, golf is a popular recreational activity. In 2007, there were
29.5 million golfers in the United States aged 6 and above (National Golf Foundation,
2008). Moreover, in the same year there was an estimated total of 15,970 facilities. Of
those, 11,555 were open to the public. A facility is defined as a complex that contains at
least one 18 holes golf course. Popular Golfers travel destinations for golf include:
Florida, South Carolina, North Carolina, California, and Arizona (National Golf
Foundation, 2008).
In 2007, Florida reported the most golf facilities with around 1,060 followed by
California, Michigan, Texas, and New York containing 927, 836, 832, and 818,
respectively (National Golf Foundation, 2008). In 2000, the economic impact of the
Florida golf industry was estimated to have total annual revenue of $4.44 billion. At the
same time the golf industry in Florida represented direct employment for 73,000 people.
According to Haydu and Hodges (2002), the area owned by Florida golf courses was
82,961 hectares with 56,656 hectares irrigated and 59,489 hectares in maintained turf.
Golf courses represent an important economic component of Florida. For
example, the estimated travel expense in Florida is $22.9 billion by golf player visitors.
These expenditures had an impact of 226,000 jobs and $9.2 billion in personal and
business net income on the Florida economy (Haydu and Hodges, 2002).
The predominant type of turfgrass on typical putting greens and fairways in
Florida is some cultivar of bermudagrass representing 93% of maintained turf areas.
Accounting for the water used, it was estimated that 173 billion gallons were used for
12
irrigation, of which 49% came for recycled water, with lesser amounts of 29% and 21%
from surface waters and wells, respectively (Haydu and Hodges, 2002).
Bermudagrass
Bermudagrass originated in Africa and was introduced into the United States in
the mid-1700s (Hanson et al., 1969). It is the primary warm-season turfgrass for golf
and is tolerant of low mowing heights; therefore, some cultivars are used on golf course
greens. Taliaferro (1995) suggested that there are nine species in the genus Cynodon,
with Cynodon dactylon [l.] Pers. most widely used. This species is known in the United
States as common bermudagrass and in other parts of the world by a variety of names
including Couch, Doob, and Kweek (Taliaferro, 1995).
In most cases, some variant of hybrid bermudagrass [C. dactylon (L). Pers. X C.
transvaalensis Burtt Davy] has been used in the southern parts of USA for putting
greens. Some of the best known of these C. dactylon x C. transvaalensis hybrid
cultivars are ‘Champion’, ‘FloraDwarf’, ‘Midiron’, ‘Midlawn’, ‘Midfield’, ‘Tiffine’, ‘Tifgreen’,
‘Tifdwarf’, ‘TifEagle’ (TW-72), ‘Tiflawn’, ‘Tifway’, and ‘Tifsport’ (Beard and Sifers, 1996;
Taliaferro and McMaugh, 1993).The prefix “Tif” comes from Tifton, GA, home of the
Coastal Plain Experiment Station, where these cultivars were developed in the breeding
program of Dr. G.W. Burton. The “Mid” cultivars were jointly released from the Kansas
and Oklahoma Agriculture Experiment Stations. These hybrids are sterile, and thus no
seed is available, so they must be established vegetatively.
Produced from a C. transvaalensis and C. dactylon cross, Tifgreen was the first
vegetative cultivar to be sprigged on putting greens (Hein, 1961). In 1966, Tifdwarf (a
vegetative off-type of Tifgreen) was released because of its smaller leaves, reduced
seed head production, and darker green color (Burton, 1966). Since its release for
13
southern putting greens, Tifdwarf has become the standard bermudagrass cultivar.
However, selected off-types have been released as cultivars and are commonly
grouped together under the term ultradwarfs (Hollingsworth et al., 2005).
Ultradwarfs in the past decade have emerged as a favorite for renovated or
newly constructed bermudagrass putting greens. The term “ultradwarf” has come into
common usage in recent years to describe bermudagrass that can be maintained at
very low mowing height on golf course greens. Some examples of the ultradwarfs are:
Champion, FloraDwarf, Mini Verde, Mississippi (MS) Supreme, and TifEagle. Those
grasses can be maintained at 3.04 to 3.56 mm if properly managed (Cowan, 2001,
Hollingsworth et al., 2005).
TifEagle was produced by γ irradiation of ‘Tifway II’ and it is genetically different
from Tifgreen, Tifdwarf, and the previous ultradwarfs (Hanna and Elsner, 1999).
Champion is a vegetative selection from Tifdwarf, with genetically different DNA (Beard
and Sifers, 1996). MS Supreme is an ecotype selection from Tifgreen and is genetically
different from both Tifgreen and Tifdwarf (Krans et al., 1999). FloraDwarf is a vegetative
selection from Tifdwarf and it also differs genetically from Tifdwarf (Dudeck and
Murdoch, 1998).
In general, ultradwarf bermudagrass have better turf quality, shorter internodes,
higher shoot densities, and the ability to withstand lower mowing heights than Tifdwarf;
thus, those cultivars have become popular on putting greens. Although they may offer
improved turf quality, they present new issues in terms of management (Hollingsworth
et al., 2005).
14
Seashore Paspalum
New Paspalum type grasses such as Seashore Paspalum have been adopted by
golf courses in the state as a way to avoid management problems associated with the
use of high salinity water. Seashore paspalum is relatively intolerant of cold
temperatures and is generally limited to the southern part of the transition zone and
south into the tropics (Christians, 2007). This grass usage has increased rapidly in the
United States in recent years on areas where salt levels are too high for bermudagrass
and other warm-season turf grass species (Christians, 2007).
Seashore Paspalum (Paspalum vaginatum Swarz.) is a warm-season native to
subtropical and tropical regions around the world. This species has stolons and
rhizomes, and its texture varies from coarse to very fine. It has pointed leaves and its
blades are narrower than those of bahiagrass. The ligule is a membrane with fine hairs
protruding from its upper edge (Christians, 2007). This grass is often found in brackish
marsh water or in close proximity to ocean water; it grows naturally in coastal
environments. It has been observed that it can grow in areas that receive extended
periods of heavy rain and low light intensity. However, the best growth occurs in
response to warm temperatures and long day lengths (Trenholm, 2000).
Duncan and Carrow (2000) suggested that Seashore Paspalum (Paspalum
vaginatum Swarz.) is known by a number of common names other than Seashore
Paspalum such as siltgrass, saltwater couch, and sand knotgrass. Some cultivars can
be maintained with seawater containing 34,486 mg L-1 salt, so that it is known for its
high salinity tolerance (Duncan et al. 2000).
The University of Georgia turfgrass breeding program has the largest testing
program and collection of paspalum, and has assembled more than 300 ecotypes of
15
this species. The selection of cultivars for sports turf has been limited to the mid and
late 1990s, even though the species has been in existence for hundreds of years.
Seashore paspalum must be planted as plugs, sods, or springs because it does not
produce viable seeds. However once establishment it produce a high-quality, prostrate-
growing, dense turf (Trenholm, 2000).
It has been suggested that Seashore Paspalum produces a high-quality turfgrass
with minimal fertility requirements. Despite the fact that it will exhibit its best quality and
growth under optimal environmental conditions, it can exist under less than optimal
conditions for extended periods of time. Some of the advantages of this turfgrass refer
to the fact that it can tolerate a wide range of stress. For example, Trenholm (2000)
reports that seashore paspalum has excellent tolerance for saline or recycled water,
good drought tolerance under proper management, tolerance of low soil fertility,
tolerance to a wide range of soil pH (from 4-9), minimal pesticide requirements,
excellent wear tolerance, tolerance to extended periods of low light intensity (such as
prolonged cloudy or rainy periods), good insect and disease resistance, and tolerance
to flooding or extended wet periods. However, there are some disadvantages, such as it
produces moderate amounts of thatch during periods of active growth and does not
perform well under tree shade (Trenholm, 2000). Some of the cultivars are ‘Sea Isle 1’,
‘Sea Isle 2000’, ‘Sea Isle Supreme Salam’, ‘Seaway’, ‘Sea Dwarf’, and ‘Sea Spray’
(Christians, 2007).
‘Sea Isle 2000’ was developed by plant geneticist Dr. R.R. Duncan at the
University of Georgia's Griffin Experiment Station from a sample collected at Alden
Pines Country Club in Bokeelia, FL, which is owned and operated by Stewart Bennett. It
16
was suggested that ‘Sea Isle 2000’ is ideal for golf greens and tees, especially in salt-
challenged environments. It is similar to the dwarf bermudas in texture and playability
when maintained at 3.175 mm mowing height (Phillip Jennings Turf Farms, 2009).
Stimpmeter readings of 3.05 m or more can be seen if regular verti-cutting, light
topdressing and periodic rolling are applied. Sea Isle Supreme is a grass that thrives on
salt water, using a seawater blend, or even straight ocean water with the right
management practices. It also grows well when watered with recycled or effluent
sources. The principal characteristics of Sea Isle Supreme 2000 are that it is a very
aggressive creeping type of grass (Phillip Jennings Turf Farms, 2009).
The soil reaction range for Sea Isle Supreme 2000 has been suggested at a pH
above 6.0. Moreover, it has been observed to perform best on a low level of applied
nitrogen, approximately 146 kg N ha-1 per year given a balanced N:P:K program
according to soil tests (Phillip Jennings Turf Farms, 2009).
Another Seashore Paspalum cultivar that has become popular is Sea Dwarf TM
Seashore Paspalum. It was developed and marketed internationally by Environmental
Turf. They market this grass as the Premium Seashore Paspalum turf grass, suggesting
that Sea Dwarf is suited for use on golf courses tee-to-green and on sports fields such
as soccer, baseball, softball and football (Environmental Turf, 2009).
Some of the general characteristics are fine texture, a bright green color,
tolerates a wide range of mowing heights, about 2.54 mm to about 10.16 cm, can be
irrigated with varied water quality and alternative water sources such as effluent,
reclaimed or brackish. Moreover, it also grows well in flow-way applications where the
turf will remain wet or even submerged for periods of time and it is fairly shade tolerant,
17
fairly cold tolerant, and can withstand prolonged wet conditions (Environmental Turf,
2009).
In terms of maintenance characteristics, it has been suggested that Sea Dwarf
has different maintenance requirements than other turfgrasses such as bermudagrass.
For instance, it has been suggested that it takes up to 50% less water and requires up
to 75% less nitrogen fertilizer than bermudagrass. Besides that salt can be used as an
herbicide (Environmental Turf, 2009).
This variety (Sea Dwarf) has become very popular for golf courses; for example,
in the United States it is utilized in Hammock Bay Golf & Country Club, Naples, Florida,
Crown Colony Golf & Country Club, Fort Myers, Florida, Olde Palm Golf & Country
Club, Palm Beach Gardens, Florida, Galveston Country Club, Galveston, Texas, and
Coco Beach Golf & Country Club, Rio Grande, Puerto Rico. In addition, Sea Dwarf is
the grass used in Palma de Mallorca, Mallorca, Spain (Environmental Turf, 2009).
There are several studies referring to Seashore Paspalum that can be found in
the literature. For example, in 1979 Henry et al. showed N fertilization response for
Paspalum, using increasing rates from 8.1 to 33.3 kg ha-1. On a monthly basis, visual
quality was improved on Adalayd and Futurf paspalum. However, scalping injury was
noticed on both cultivars. Another study Beard et al. (1991) noted that cutting height has
a greater effect on visual quality, fall color retention, and spring green- up than did N
application. There was a linear response to mowing height, and they noticed a superior
visual quality with shorter cut turf, spring green-up, and shoot density (Beard et al.,
1991).
18
In 2001, a study was conducted in Georgia using N application of 196 or 392 kg
ha-1 in Paspalum vaginatum mowed at 4 mm during a 4-month period with two ecotypes
(AP10 and AP14). This study showed that application of the higher rate of N did not
affect shoot growth, but improved visual quality, color, density and wear tolerance
(Trenholm et al., 2001).
Kopec et al. (2007) reported a study with Sea Isle Supreme 2000 Seashore
Paspalum (Paspalum vaginatum Sw.) that was maintained as a putting green surface.
They evaluated turf grass response attributes, nutrient content, and ball roll distance
(BRD) as affected by three mowing heights (0.3, 0.4 and 0.5 cm) and four monthly N
application rates (12, 18, 24, and 36 kg ha-1). They found an acceptable visible turf
grass quality of 6.0 (on a scale 1 to 9) or greater for all the treatments. Shoot counts
were greatest at the 0.3-cm height and were not significantly influenced by N rates
(Kopec et al., 2007).
It was suggested that higher levels of applied N with shorter mowing heights
generally increased the clipping dry weight. In terms of leaf tissue, N was found to
increase in response to increasing levels of N application. Ball roll distance was largely
unaffected by N fertilization, but was affected by mowing height and rolling. The
maximum BRD observed was 277 cm; where 234 cm and 214 cm were the mean BRD
on rolled and unrolled turf surfaces mowed at 0.3-cm height (Kopec et al., 2007).
Maintenance Practices
Seashore Paspalum has been suggested to have excellent tolerance to the high
salt levels found in reclaimed water, effluent, salt spray and seawater after it has been
established, and also requires less fertilizer and less irrigation than many other
19
turfgrasses such as bermudagrasses. However, the maintenance requirements for
seashore paspalum compared with bermuda grasses are in most cases unknown.
In the case of bermudagrass, McCarty and Miller (2002) suggested that there are
cultural practices that need to be taken into the account such as mowing,
irrigation/water management, fertilizing, aerification strategies and techniques,
topdressing, and overseeding in order to obtain adequate bermudagrass golf greens.
From those maintenance practices, nutritional requirement is one of the most
essential and nitrogen use efficiency a very important component in terms of quality and
environmental concern. Power and Schepers (1989) suggested that nitrogen
placement, nitrogen timing, and nitrogen source are important factors, but when those
factors are compared with optimizing the nitrogen rate they usually produce smaller
enhancement in terms of nitrogen use efficiency. Moreover, many other authors have
shown in several different studies that nitrogen losses increase rapidly when the
nitrogen inputs are higher than the crop assimilation capacity, suggesting that the rate
of applied nitrogen is the governing factor affecting the nitrogen use efficiency. (e.g.,
Broadbent and Carlton, 1978; Legg and Meisinger, 1982; Vanotti and Bundy, 1994;
Schlegel et al., 1996; Doberman et al., 2006; Meisinger et al., 2008).
Therefore, the present study evaluated the overall maintenance and nutrition
requirements of paspalum and bermuda grasses grown on nature soil push-up putting
greens in order to determine the best management practices related to their playability
and maintenance costs.
20
Hypothesis and Research Objectives
Previous studies have determinated some of the management practices and
nutrition requirements of bermudagrasses growing in putting greens; however,
Seashore Paspalum grasses nutritional requirements and management practices for
Florida golf courses need to be developed.
• Hypothesis: Paspalum grasses and bermuda grasses growing on putting greens will differ overall in terms of maintenance and nutrition requirements.
• Principal Objective: To determine overall maintenance and nitrogen nutrition requirements of paspalum and bermuda grasses grown on putting greens.
• Specific Objectives 1: Determine the influence of topdressing and verticutting on paspalum and bermuda grasses grown on putting greens relative to their playability and maintenance costs.
• Specific Objectives 2: Determine the nitrogen nutrition requirements of paspalum and bermuda grasses grown on putting greens.
21
CHAPTER 2 MATERIAL AND METHODS
Field Study Design
A field experiment was utilized to evaluate overall maintenance and nitrogen
nutrition requirements of paspalum and bermuda grasses grown on push up putting
greens. Two cultivars of Seashore Paspalum (Paspalum vaginatum Swarz.), Sea Dwarf
and Sea Isle Supreme, were evaluated and compared with two cultivars of hybrid
bermudagrasses [C. dactylon (L). Pers. X C. transvaalensis Burtt Davy], Mini Verde and
Jones Dwarf. The four grasses were established under putting green conditions on
native soil push up greens on the UF/IFAS Turfgrass Research Facilities at the Plant
Science Research and Education Unit, near Citra, FL. Research was conducted from
April 17th to September 17th, 2008 and repeated in from April 16th to September 17th
2009. The field plots were established in September 2007.
In 2008, three nitrogen rates using urea (46% Nitrogen) were applied at 1.22,
2.44, and 4.88 g m-2 every 15 days until acceptable visual quality was achieved. In 2008
the nitrogen rates were 49, 98, and 196 kg N ha-1 yr-1 and 110, 220, and 440 kg N ha-1
yr-1 for paspalum and bermuda grasses respectively. The plots were mowed at 0.64 cm
three times per week. Two levels of topdressing maintenance were established on all
the grasses. Topdressing treatments were applied according to the USGA
recommendation (O’Brien and Hartwiger, 2003), rates of 3.2 mm twice at 75-day
intervals and 1.6 mm four times at once per month. The field study was established as a
split-plot design with three replications. Nitrogen rate treatments were arranged in a
randomized complete block design (RCBD), while topdressing was the sub-plot factor.
22
The study was arranged with 72 experimental units total, organized in 18
experimental units per grass within grass as the main plots; topdressing treatment were
arranged as sub-plots and N treatments were replicated three times (Figure 2-1). In
2009 the same four cultivars from 2008 were evaluated, but the nitrogen rates and
management practices changed. In 2009 the nitrogen rates were reduced for paspalum
grasses (12, 24, and 49 kg N ha-1 yr-1) and increased for bermudagrasses (122, 244
and 488 kg N ha-1 yr-1) in order to achieve the nitrogen requirements. In 2009 the
management practice topdressing was changed to a verticutting frequency factor (every
2 weeks and every 4 weeks). In addition both bermuda grasses plots were relocated
due to the immaturity effect which produced a low visual quality in 2008. In 2009, the
mowing height was reduced (0.25 cm) and the mowing frequency was increased (four
times per week). Each experimental unit consisted of 6.9 m2 which was 0.91 m wide by
7.62 m long. In 2008 and 2008 clippings were collected every 30 days throughout the
150-day study period.
Data Collection
Data including all management practices such as aerification, mowing frequency,
and pest management (insecticides, fungicides, and herbicides) were recorded with
their product name and frequency in order to determine the total cost. At termination all
maintenance costs were evaluated against the best treatment and compared across
turfgrass species. In addition, visual quality, ball roll, clipping yield, N uptake, thatch
accumulation, thatch depth, and root dry matter were collected for both years.
Visual quality rating was taken weekly and evaluated from 1 to 9, 1 = brown,
dead turfgrass, 5.5 = minimal acceptable turfgrass, 9 = ideal green, healthy turfgrass.
Golf ball roll distance (BRD) measurement consisted of three releases, in each of two
23
directions from a standard U.S. Golf Association stimpmeter (U.S. Golf Association,
2000). Measurements were taken on a weekly basis immediately after mowing. Clipping
yield (g m-2) was collected once a month (May, June, July, August, and September).
Shoot tissue was collected using a Toro walk behind mower following 3 days of growth.
Harvested clippings were oven dried at 68° C for 48 hours and weighed to quantify dry
matter.
All harvested clippings were dried, ground, and analyzed for Total Kjeldahl
Nitrogen (TKN). The tissue N concentration was multiplied with the dry matter
accumulation to achieve the total nitrogen uptake from each experimental unit. Two root
samples were taken from each plot once per month using a rectangular (2 cm by 7 cm)
green sampler to a depth of 10 cm in order to measure root dry matter, thatch depth,
and thatch organic matter. The top portion of these samples was removed at crown
level and thatch depth (cm) was measured using a ruler from three points on the soil
cores and averaged. Roots were clipped at the base of the thatch layer and the
remaining thatch sample was placed in an 80º C oven for 96 h and weighed. Roots
were hand washed in a 1-6mm sieve to remove the roots from soil, dried at 70ºC for 48
h and weighed to determine the root dry matter (g m-2). Thatch samples were placed in
a muffle furnace (Benchtop Muffle Furnace LMF-A550, Omega Engineering, Inc.,
Stamford, CT) at 525 ºC for 3 h to provide ash free weight (Snyder and Cisar, 2000).
Data Analysis
Statistical analysis of data was performed to evaluate the treatment effects using
Statistical Analysis System (version 9.1, SAS Institute, Cary, NC). Mean separation was
accomplished by using Duncan’s multiple range test and single degree of freedom
24
contrast based on the general linear model procedure. A standard analysis of variance
(ANOVA) was used to determine statistical differences for the effect of turfgrass cultivar,
nitrogen rate, management practices (topdressing or verticutting) and their interactions
(SAS Institute Inc, 1999).
25
CHAPTER 3 RESULTS AND DISCUSSION
COMPARATIVE MAINTENANCE OF PASPALUM AND BERMUDA GRASSES
Study Description
Introduction and Material and Methods
Two Seashore Paspalum (Paspalum vaginatum Sw) and two Hybrid
bermudagrass [C. dactylon (L). Pers. X C. transvaalensis Burtt Davy] cultivars were
evaluated in a field study that ran 150 days yr-1 (2008 and 2009). The objective was to
evaluate the overall maintenance and nitrogen nutrition requirements of paspalum
grasses and bermuda grasses grown on push up putting greens. In the 2008 study,
three factors were evaluated: three nitrogen rates (49, 98 and 196 kg N ha-1 yr-1), two
topdressing levels (3.2 mm applied twice and 1.6 mm applied 5 times) and four
turfgrasses cultivars (two Seashore Paspalum cultivars Sea Dwarf and Sea Isle
Supreme and two Hybrid bermudagrass cultivars Mini Verde and Jones Dwarf) were
studied. In the 2009 study, the same four cultivars from 2008 were evaluated, but the
nitrogen rates were reduced for paspalum grasses (12, 24, and 49 kg N ha-1 yr-1) and
increased for bermuda grasses (122, 244, and 488 kg N ha-1 yr-1). Also in the 2009
study the topdressing factor was changed to a verticutting frequency factor (every 2
weeks and every 4 weeks) and both bermuda grasses were relocated due to the
immaturity of the turfgrass. In both years, the effect of the treatments was determined
for multiple parameters such as visual quality, ball roll, growth rate, nitrogen uptake,
thatch depth, roots dry matter, and thatch accumulation (weight loss on ignition) in order
to make a comparison in term of nitrogen requirement and maintenance between
paspalum and bermuda grasses.
26
In the 2008 study, topdressing (T) only influenced the overall mean ball roll
distance of one cultivar (Jones Dwarf). Other than that topdressing and the interaction
between topdressing and nitrogen (N) rate did not influence the evaluated parameters.
In the 2009 study, verticutting (V) did not influence any parameters other than: (i) the
overall growth rate of Sea Dwarf, (ii) the ball roll distance of Sea Isle Supreme during
the 2nd treatment cycle, and (iii) the overall ball roll distance of Jones Dwarf. Moreover,
N rate and turfgrass cultivars influenced some of the evaluated parameters in both
years. Therefore, the main effects of T, N rate, turfgrass, and the V are presented and
discussed below.
2008 and 2009 Results and Discussion
Turf Visual Quality
Visual quality ratings were taken weekly on a 1 to 9 scale with 9 representing
superior quality turfgrass and 5.5 representing a minimum acceptable turfgrass. Twenty-
two (2008) and eighteen (2009) visual quality ratings were averaged and analyzed
during the evaluation period. In the 2008 study, visual quality of both paspalum cultivars
was impacted at the highest N (196 kg N ha-1 yr-1) application rate. Thus, both cultivars
were similar in visual quality at the middle (98 kg N ha-1 yr-1) and lowest (49 kg N ha-1 yr-
1) nitrogen application rates (Fig. 3-1a). Trenholm et al. (2001) suggested that an N rate
application from 196 to 392 kg ha-1 improved visual quality, color, and density in two
cultivars of Paspalum vaginatum. These results coincide with ours and together suggest
that a difference between Paspalum grasses cultivars in visual quality occurs at a high
nitrogen rate (above 196 kg N ha-1 yr-1).
The mean visual quality response for both paspalum cultivars in 2008 was above
6 for all three nitrogen rates which was higher than the minimum acceptable level of 5.5
27
(Fig. 3-1a). In order to establish an accurate recommendation of nitrogen application
rate it is necessary to obtain values of visual quality below and above the 5.5
acceptable level. The 2008 results suggest that even the lowest nitrogen rate applied
(49 kg ha-1 yr-1) was too high for Paspalum grasses. Therefore, lower rates were applied
in 2009 in order to develop a N response curve. On the other hand, in the 2008 study
most of the Bermuda grasses cultivars were below the acceptable minimal value of 5.5
(Fig. 3-1b). Although the N rate applied for bermudagrass (110, 220, and 440 kg N ha -1
yr-1) was higher than paspalum grasses only Mini Verde was near acceptable quality at
the highest N rate (440 kg N ha-1) during the evaluation period of 2008. This suggests
that in terms of N requirements and maintenance bermuda cultivars required more
nitrogen compared with the paspalum cultivars in order to obtain an acceptable visual
quality. In the 2008 study, it appeared that preexisting growth characteristics such as
immaturity of the grasses on the push up greens used may have been responsible for
the poor performance of the hybrid bermuda grasses. Therefore, in the 2009 study both
bermuda cultivars were relocated and the N rate increased (122, 244, and 488 kg N ha -
1 yr-1) in order to achieve the desirable visual quality level above 5.5.
This comparative study was divided into five 30 day evaluation periods per year.
All four turfgrasses cultivars responded to nitrogen rate in different periods. Paspalum
grasses in 2008 responded in visual quality to N rate on Sea Dwarf only during the 2nd
30 day evaluation period and for Sea Isle Supreme a response to N rate was observed
during the 2nd, 3rd, 4th, and 5th 30 day evaluation periods. Bermudagrasses showed a
visual quality response due to N rate during three evaluation period for both cultivars.
Mini Verde and Jones Dwarf responded in visual quality to N rate during the 1st, 2nd, 4th
28
and the 2nd, 3rd, 4th evaluation period in 2008, respectively. In the 2008 study, a fitted
model for paspalum grasses and Mini Verde comparing visual quality and N rate
produced a strong relationship from the 2nd evaluation period for Sea Dwarf (r2 = 0.83),
Sea Isle Supreme (r2 = 0.79) (Fig. 3-2) and Mini Verde (r2 = 0.71) (Fig 3-3). A fitted
model for Jones Dwarf was observed during the 4th evaluation period (r2=0.63) (Fig. 3-
4). Although in 2009 the same tendency was found as that in 2008 for paspalum
grasses, the relationship between N rate and visual quality of Sea Dwarf (r2 =0.42), and
Sea Isle Supreme (r2 =0.37) was much weaker. Henry et al. (1979) demonstrated in
Adalayd and Futurf Seashore Paspalum that an increase in N rate from 8.1 to 33 kg ha-1
on a monthly basis improved visual quality. This suggested that visual quality could be
affected by increases in nitrogen rates. Both evaluated paspalum cultivars in 2008 and
the 2009 received four N applications. However, they received three of the four nitrogen
applications before the 2nd 30 day evaluation period. Therefore, it appears that the
response observed of Paspalum grasses to N rate in 2008 and 2009 was directly due to
the actual nitrogen applied.
Although the 2008 and the 2009 paspalum cultivars showed a similar tendency in
the 2nd evaluation periods where visual quality was affected by N rate, in 2009 the effect
of N rate on the overall mean visual quality of paspalum grasses was not different. In
2009 both Bermuda grasses were influenced by N rate in the same three evaluation
periods the (1st, 3rd, and 4th). In the 2009 study a fitted linear and quadratic model for
Mini Verde (r2=0.80) (Fig. 3-5) and Jones Dwarf (r2 =0.71) (Fig. 3-6) illustrated the
overall response for bermuda grasses. Increasing N rate resulted in increased quality.
29
Bermuda grasses did not reach a plateau therefore it suggest that the nitrogen
requirement for bermuda grasses could be even higher.
Environmental conditions of the study could be another factor contributing to the
results. Hybrid bermuda grass growth and development are influenced by
environmental conditions such as temperature, nitrogen, and light (Stanford et al.,
2005). In the 2009 study, the overall mean visual quality for the Bermuda grasses was
near acceptable at the higher rate (448 kg N ha -1 yr-1) (Fig. 3-1d) and a difference in
visual quality response was found between the N rate applied. This complements the
2008 data and together suggested that there is higher nitrogen requirement for
Bermuda grasses growing in putting greens compared with Paspalum grasses.
In the 2009 study, the paspalum grasses exhibited a reduction in the overall
mean turfgrass visual quality compared to 2008, where it appears that the decreases
from 2008 to 2009 in Sea Dwarf and Sea Isle Supreme can be attributed to the
reduction in nitrogen rates used in the 2009 study (Fig. 3-1c). Even though the
application rates in 2008 (49, 98, and 196 kg ha-1 yr-1) were reduced in 2009 (12, 24,
and 49 kg ha-1 yr-1) the Paspalum grasses still maintained an acceptable (above 5.5)
overall mean visual quality. Rates used in 2009 relate with the results obtained by
Kopec et al. (2007) where they reported an acceptable visible turfgrass quality of 6.0
(on a scale 1 to 9) or greater for all treatments at four monthly application rates of 12,
18, 24 and 36 kg ha-1 to Seashore Paspalum (Paspalum vaginatum Sw.). Also,
Environmental Turf (2009) supports low N rates for Paspalum grasses. They report that
the nitrogen requirement for Seashore Paspalum could be up to 75% less than other
turfgrasses such as bermuda grasses. According to Phillip Jennings Turf Farms (2009),
30
the N recommendation for Seashore Paspalum is low at approximately 14.63 g m-2 yr-1
or 146 kg ha-1 yr-1. This comparative study supports those low nitrogen requirements for
Seashore Paspalum and high N requirements for bermuda grasses, but according to
this study the actual N recommendation should be even lower (approximately 49 kg ha-1
yr-1) and bermuda grasses even higher (approximately 488 kg ha-1 yr-1).
An accurate N rate is very important in order to obtain high N use efficiency.
Power and Schepers (1989) suggested that the effect of N placement, N timing, and N
source are important factors, but when those factors are compared with optimizing the
N rate they usually produce smaller enhancement in terms of N use efficiency.
Moreover, many other authors have shown with several different studies that N losses
increase rapidly when the N inputs are higher than the crop assimilation capacity;
suggesting that the rate of applied N is the governing factor affecting the N use
efficiency (e.g., Broadbent and Carlton, 1978; Legg and Meisinger, 1982; Vanotti and
Bundy, 1994; Schlegel et al., 1996; Doberman et al., 2006; Meisinger et al., 2008).
Although this study suggested that paspalum requires lower N rates and bermuda
requires higher N rates compared with other studies, the environmental conditions of
this study could have influenced turfgrass visual quality.
According to Stanford et al. (2005) temperature, nitrogen, and light have an effect
on hybrid bermudagrass growth and development. They reported that temperature as
well as light levels regulated expressions of dwarfness in Tifdwarf bermudagrass. They
suggested that in regions that typically have long periods with daytime temperatures
less or equal to 27 °C and photosynthesis photon flux density (PPFD) less or equal to
600 µmol m-2 s-1 the growth of hybrid bermuda grasses changes considerably producing
31
longer internodes spacing and longer leaves in plants. Also, they reported that an
overall trend was seen in which the internodes increased due to an increase in nitrogen.
They reported that plants fertilized at the greatest N rate (24.4 kg ha-1 wk-1) had longest
internode length and more total shoot dry weight compared with those at the lowest N
rate (8.1 and 16.3 kg ha-1 wk-1). The previous results support this comparative study’s
results because it was found that bermuda grasses showed a positive response in
visual quality to increased N rate applied. Therefore, the recommended N rate for
paspalum and bermuda grasses should be adjusted depending on the conditions under
which the turfgrass will be grown.
According to Brosnan and Deputy (2008) paspalum evolution has occurred in
coastal, brackish ecosystems, and they report the possibility that paspalum grasses
only respond to nitrate nitrogen. In this study in Florida, nitrogen form was most likely
not a problem for paspalum grasses. This is because the high temperatures and soil
conditions in Florida during the 150 day evaluation period were appropriate for urea
(46% organic soluble nitrogen) to nitrify and NO-3-N was the predominant nitrogen
source available.
A difference in overall mean visual quality was found between paspalum cultivars
in 2009. The overall mean visual quality of Sea Isle Supreme was higher (6.06 to 6.13)
than Sea Dwarf (5.51 to 5.64) (Fig. 3-1c); therefore, it appears that Sea Dwarf requires
a higher nitrogen rate (12 to 24 kg ha-1 yr-1) than Sea Isle Supreme (12 kg ha-1 yr-1) in
order to obtain an acceptable level. In comparison, both hybrid bermuda (Mini Verde
and Jones Dwarf) grasses were similar across each N rate and they responded similarly
in increasing turf visual quality due to increased N rate applied. Also, a difference in

32
color was noticed between both turfgrasses. The paspalum grasses produced a more
persistent green color than the bermuda cultivars.
Finally, this comparative study results demonstrated that there is a clear
difference between paspalum cultivars compared with bermuda cultivars in terms of N
response and N requirement. Paspalum grasses showed an early response, before the
60 day evaluation period, in visual quality due to N rate; thus, permitting an acceptable
visual quality (above 5.5) with only four N applications. Also, it was found that the early
response was enough to maintain the paspalum grasses in acceptable visual quality for
the entire 150-day evaluation period for both years, which suggests that the N
requirement is lower for paspalum cultivars than bermuda cultivars. Contrasting with the
low N requirement of paspalum grasses, it was found that bermuda cultivars required
higher N rates and a different maintenance plan by applying N throughout the 150-day
evaluation period for both years in order to obtain acceptable visual quality. These
results show that the actual plateau in term of N requirement for paspalum cultivars is
lower than the bermuda cultivars.
Ball Roll
Paspalum grasses have been used in the Caribbean for many reasons such as
potential to tolerate high salinity in irrigation water and lower nitrogen requirement.
Therefore, in the last few decades some golf courses in United States (US) have
adopted new paspalum cultivars for use on golf greens with plans to increase use of salt
water while reducing nitrogen application as promising for golf greens that will tolerate
saline water and less nitrogen applications. It has been suggested that new paspalum
cultivars differ with the hybrid bermuda grasses in terms of golf course playability. Many
golfers, primarily in Latin America, the Caribbean, and now in US, have been faced with
33
a problem in terms of golf green playability, principally those golf courses with paspalum
cultivars, due to low ball roll speed. However, there is very little information related to
the actual management practices in order to alleviate problems produced by paspalum
grasses. Therefore, in this study, a comparison of the effect of maintenance practices
and N requirement produced information on maintenance practices required to meet to
golfer expectations.
In this comparative study, ball roll distance was taken weekly using a Stimpmeter
to estimate putting speed, which is considered an accepted measure of golf course
playability (Salaiz et al., 1995). As a management practice for paspalum cultivars, Phillip
Jennings Turf Farms (2009) suggested that a Stimpmeter reading of 305 cm or more
can be obtained if regular verticutting, light topdressing, and periodic rolling are applied.
Therefore, in this 2008 study it was expected that topdressing would have an effect on
ball roll distance (BRD) in paspalum cultivars; however, topdressing and nitrogen rate
did not influence the overall BRD in the 2008 study for paspalum grasses and Mini
Verde. Only one bermuda grass cultivar (Jones Dwarf) was influenced in the overall
mean ball roll by topdressing. It was found that a light topdressing produced a higher
ball roll distance (198 cm) compared with the heavy topdressing application (183 cm) for
Jones Dwarf. Because limited topdressing influence on BRD was observed in the 2008
study, topdressing treatments were replaced by two verticutting frequencies in 2009.
An effect due to N rate in mean BRD was found for both paspalum and bermuda
cultivars during the first 30-day evaluation period (Table 3-1) in 2008. It appears that
lower N rates produced a higher BRD (Fig 3-7b). Also in the 2008 study, Mini Verde
produced a higher ball roll distance than Jones Dwarf. Jones Dwarf tends to produce
34
more growth above ground, which was reflected in low BRD. Also, in 2008 the lowest
nitrogen rates produced a higher BRD for both Paspalum cultivars. Likewise, increasing
nitrogen rate (98 and 196 kg N ha-1 yr-1) reduced BRD of both Paspalum cultivars (Fig.
3-7a). In 2008, Sea Dwarf had higher BRD values (154 cm to 163 cm) compared with
Sea Isle Supreme (149 cm to 157 cm). The BRD recorded for paspalum grasses in this
study would be considered unacceptable for golf playability, because most of the golf
courses in America require from 213 to 366 cm in stimpmeter values to be of acceptable
playability (Oatis, 1990). Jones Dwarf BRD was not considered acceptable, but Mini
Verde which ranged from 214 to 221 cm, did reach the United States Golf Association
(USGA) standards. USGA experience shows that trying to keep the speed above 304
cm on a consistent basis usually causes difficult-to-manage turf problems and is not
recommended. They recommend maintaining a BRD approximately 244 cm on a daily
basis.
In the 2009 study, the same trend in BRD was observed with Sea Dwarf having a
higher BRD; however, no difference between Paspalum cultivars was observed (Fig. 3-
7c). An effect of verticutting was found in Sea Isle Supreme during the 2nd evaluation
period, where a higher BRD of 188.7 cm at the high (every 2 week) verticut frequency
was obtained compared with a BRD of 174.7 cm at the low (every 4 week) verticut
frequency. Moreover, an increase in BRD was observed from 2008 to 2009 in both
Paspalum grasses. Sea Dwarf overall BRD changed in 2008 from 153.6 cm / 163.4 cm
to 174.7 cm / 183.2 cm in 2009. However, Sea Isle Supreme increased BRD range in
2009 from 149.4 cm / 157.0 cm to 173.7 cm / 175.9 cm, which represents an increase of
approximately 15 percent in BRD for both Paspalum grasses. This can be attributed to
35
the increase in mowing frequency from 3 times wk-1 (2008) to 4 times wk-1 (2009), the
reduction in mowing height 6.34 mm (2008) to 2.54 mm (2009) and the reduction in N
rate between both years of the study.
In the 2009 study, bermuda grass differed between cultivars in the same way as
in 2008 where Mini Verde BRD was higher than Jones Dwarf. Unexpectedly in 2009,
BRD for Jones Dwarf declined (5.2 %) from 190 cm (2008) to 180 cm (2009); This result
could be due to the maturity of the Jones Dwarf and the increase in N rate from one
year (2008) to the next (2009). On the other hand, Mini Verde BRD increased (2.5 %)
from 219 cm to 224 cm (3-7d). This suggests that the change in location for bermuda
grasses in 2009 did not consistently increase BRD compared with 2008.
In the 2009 study, N rate only influenced both bermuda grasses in the 4th
evaluation period. Results from the 4th period confirmed the reduction in BRD in
response to increased N rate applied to bermudagrass. The 2009 study suggested that
addition of a higher verticutting frequency could have a positive influence on BRD;
therefore, it is suggested that verticutting every 2 weeks should be included as a
management practice for seashore paspalum.
In the 2009 study, no difference in the BRD due to nitrogen rate was observed for
paspalum grasses. This result could be due to the very healthy condition of the turfgrass
and it suggests that the nitrogen rate was not a limiting factor. Similarly, Kopec et al.
(2007) reported that BRD on Sea Isle Supreme 2000 was not influenced by nitrogen
rates. In comparison, this 2009 study found that verticutting influenced only the overall
mean BRD of Jones Dwarf, where high verticutting frequency produced higher BRD
values. Therefore, in this comparative study it appears that (i) nitrogen rate did not
36
directly affect BRD at the nitrogen rates applied for paspalum grasses, (ii) verticutting,
increased mowing frequency, and decreased mowing height can increase BRD around
15% for paspalum grasses, (iii) the BRD of bermuda grasses tends to be higher than
paspalum grasses under the same management practices.
Growth Rate
Crop growth rate (GR) refers to the dry matter accumulation rate per unit of land
area, normally it is expressed as g (m of land)-2 day-1. Usually crop growth rate is
measured by harvesting plants at frequent intervals and calculating the increase in dry
weight from one harvest to the next. Normally roots are excluded for GR. For a given
interval of GR the following equation is used: GR = (W2-W1) / SA (t2-t1); where W2 and
W1 are crop dry weight at beginning and end of interval, t1 and t2 are the corresponding
days, and SA is the soil area occupied by the plants at each sampling. Usually the most
accurate GR is obtained when the crop is sampled at frequent intervals.
In this comparative study, clippings were collected on a monthly basis in order to
obtain growth rate estimates to determine how growth rate is influenced by the study
factors nitrogen rate, topdressing or verticutting, and turfgrass cultivars. In the 2008
study, both paspalum cultivars and Jones Dwarf Bermuda grass showed similar growth
rates across the N rates applied. However, it was found that increases in N rate
produced an increased in growth rate only for Mini Verde bermuda grass. Mini Verde
responded to N rates in three of the four evaluation periods (2nd, 3rd, and 4th) (Table 3-
2). A linear regression model (r2 =0.87) shows a strong relationship between increases
in nitrogen rate and increases in growth rate in Mini Verde for 2008 (Fig. 3-9). These
results are supported by Stanford et al. (2005) was reported at day/night temperatures
ranging from 19/11ºC to 35/27ºC and increasing N rate from 8.1 to 24.4 kg ha-1 wk-1
37
resulted in increased dry matter production. Alternatively, an N rate effect on Jones
Dwarf was observed only in the 3rd evaluation period in 2008. It was found in 2008 that
the Bermuda grass cultivars differed in GR with higher growth rate values in Jones
Dwarf across all the N rates than Mini Verde (Fig 3-8b).
Each cultivar of paspalum produced a different growth rate, which was
demonstrated in the higher growth rate values (3.1 to 3.7 g m-2 day-1) in Sea Dwarf
compared with Sea Isle Supreme (2.8 to 3.0 g m-2 day-1). However, no difference in
growth rate by turfgrass was found across the nitrogen rates (Fig. 3-8a). The usual
expectation is that dry matter should increase as the rate of applied N increases; for
example, Kopec et al. (2007) suggested that higher levels of applied N with shorter
mowing heights generally increased clipping dry weight. However, this study suggests
that the growth rate for paspalum grasses was similar for both cultivars at all N rates
applied in 2008. Therefore, this implies that nitrogen requirement could be even lower
for Paspalum grasses.
It appears from this study that Paspalum grasses could produce considerable
growth rate at the lowest nitrogen applied for both years. Trenholm (2000) supports this
studys’ results because she reported that paspalum grasses have been observed
growing in areas that receive extended periods of heavy rains and low light intensity.
Also, she reported that the best growth occurred in response to warm temperatures and
long day lengths, conditions very similar to where this study was evaluated. This
evidence could explain the similar effect of nitrogen rate on growth rate for paspalum in
this study.
38
In this comparative study in 2009, growth rate was not influenced by N rates for
paspalum grasses. In this case, growth rate was similar between both Paspalum
cultivars (Fig 3-8c) which is ultimately the same result found in 2008. Thus, a shift in
overall growth rate relative to cultivars was observed during the 2 years and, it appears
that the reduction in the nitrogen rates in 2009 enhanced Sea Isle Supreme Paspalum
visual quality more than Sea Dwarf.
The same tendency for bermuda grasses was found in 2009 (Fig 3-8d) which
suggested that Jones Dwarf tends to have a higher growth rate at all the N rates applied
compared with Mini Verde. Also in 2009, an increase in Mini Verde growth rate was due
to the change in location and the incorporation of verticutting as a management practice
in 2009.
Verticutting in 2009 influenced the overall growth rate of Sea Dwarf. Verticutting
promoted a lower growth rate (2.69 g m-2 day-1) at the higher frequency (every 2 weeks)
compared with a higher growth rate (3.14 g m-2 day-1) from the lower frequency (every 4
weeks) in Sea Dwarf Paspalum. This suggests that verticutting reduced growth rate.
One possible explanation could be that the Sea Dwarf did not recuperate from the
stresses created by the higher verticutting frequency. Ultimately, this study suggests
that both paspalum cultivars and Jones Dwarf grew similarly at the applied nitrogen
rates in 2008 and 2009, and Mini Verde tended to have a lower growth rate compared
with the rest of the cultivars evaluated.
Nitrogen Uptake
In the 2008 and the 2009 paspalum study, five and four harvests, respectively
were collected and analyzed for N concentration. Clippings from each harvest were
dried in a forced-air oven at 60°C for 48h, weighed, and ground. Then each subsample
39
was prepared for total Kjeldahl N analysis. Yield-weighed tissue N concentrations were
calculated using equation 3-1 to determine the Paspalum grasses’ mean nitrogen
uptake.
For any nitrogen rate:
Gi= growth rate at ith harvest from each paspalum cultivar (g m-2 day-1)
Ni=tissue N concentration at ith harvest (%)
ny= number of harvest.
((G1*N1)+(G2*N2)...(G5*N5))*10 = Mean Nitrogen Uptake (mg m-2 day-1) ny (3-1)
In the 2008 study, both paspalum and bermuda grass cultivars overall mean N
uptake was influenced by N rate. For paspalum grasses as the rate of applied N
increased from 49 to 196 kg ha-1 yr-1 the N uptake also increased from 75 to 93 mg m-2
d-1and 71 to 83 mg m-2 d-1 for Sea Dwarf and Sea Isle Supreme, respectively (Fig. 3-
10a). It was found that both paspalum cultivars were similar in terms of overall N
uptake. However, nitrogen uptake for Sea Isle Supreme was influenced in three of the
four evaluation periods and for Sea Dwarf was influenced by N rate only during the 2nd
30-day evaluation period (Table 3-2) in 2008. Also N uptake was different between
bermuda grasses cultivars, as Jones Dwarf had a higher nitrogen uptake than Mini
Verde (Fig.3-10b). In the 2008 study, N rate affected N uptake of Mini Verde which
increased as N rate increased. Mini Verde N uptake was influenced by N rate primarily
in the 2nd and 3rd evaluation periods (Table 3-4). A fitted model from the 2nd evaluation
period of Mini Verde (r2= 0. 86) showed a positive relationship between an increase in
40
nitrogen rate and an increase in nitrogen uptake (Fig. 3-11). Jones Dwarf showed a
response during three of the four evaluation periods: 1st, 2nd, and 3rd (Table 3-3).
In the 2009 study, increasing N rate did not increase mean N uptake but the
Paspalum cultivars did differ in N uptake. Sea Dwarf N uptake in 2009 was lower than
Sea Isle Supreme (Fig. 3-10c). Although in the 2009 study N rate did not influence N
uptake, it appears that a trend existed for higher N uptake by both Paspalum cultivars in
response to N application rate compared with bermuda cultivars.
In the 2009 study, Jones Dwarf accumulated more N than Mini Verde (Fig.3-
10d). Nevertheless, in 2009 there was evidence that an increase in nitrogen application
produced an increase in nitrogen uptake. Nitrogen rate did influence the overall mean
nitrogen uptake by both Bermuda grasses in 2009. Jones Dwarf was affected by
nitrogen rate only in the 4th evaluation period. However, Mini Verde was affected by
nitrogen rate in the 1st and the 4th evaluation periods. A linear regression model
(r2=0.69) showed increased nitrogen uptake as a result of increased nitrogen application
in 2009 for Mini Verde (Fig.3-12). A reduction in N rate applied to the paspalum in 2009
resulted in a reduction of N uptake for paspalum grasses from 2008 to 2009. An
increase N rate applied to hybrid bermuda grasses produced an increase in N uptake in
2009 compared with 2008. Therefore it is suggested that there is a strong positive
relationship between N rate and N uptake for turfgrasses.
Thatch Depth
Thatch is a layer of partially decomposed organic matter between green shoot
tissue and the soil surface (McCarty et al., 2007). Five measurements of thatch depth
were made for each year (2008 and 2009). In 2008, paspalum and bermuda grasses
thatch depth fluctuated from 2.4 to 2.5 cm (Fig. 3-13a) and from 1.5 to 1.8 cm
41
respectively. Only Mini Verde was influenced by N rate. During this time period, higher
values of thatch depth were found at the highest nitrogen rate in Mini Verde Bermuda
grass. However, paspalum grasses did not differ in thatch depth and they were not
influenced by N rate in 2008. Paspalum grasses showed a higher thatch depth than the
hybrid bermuda grasses cultivars. In 2009, the same trend was found as in 2008 where
N rate did not influence thatch depth, nor did either paspalum cultivar influence the
overall thatch depth. The thatch depth in 2009 was higher for both paspalum grasses
and bermuda grasses compared with the results in 2008. An increase of around 115%
in the thatch depth was noticed from 2008 to 2009 for bermuda grasses. This increased
thatch depth is possibly due to turf maturity and relocation. The 2008 evaluation was
taken during the first year after establishment and the 2009 evaluation was taken on
established grasses. According to Trenholm (2000), one of the disadvantages of
Seashore Paspalum is that it produces moderate amounts of thatch during periods of
active growth. Therefore, higher thatch depths recorded for paspalum grasses in 2009
were expected. In general, this comparative study suggests for bermuda grasses that
Mini Verde tends to produce more thatch compared to Jones Dwarf. These data agree
with other studies such as Hollingsworth et al. (2005) where they found that thatch
depth can be affected by cultivar. Also, they evaluated the cultural management and
nitrogen source effects on ultradwarf bermuda grass cultivars and reported that other
research showed that the ultradwarfs may produce excess thatch (Hollingsworth et al.,
2005).
In terms of management, it appears that paspalum grasses will require a new set
of practices compared with bermuda grasses primarily because higher thatch depth
42
produces serious problems for golf course playability in the long term. The chemical
components of thatch are cellulose, hemicellullose, and lignin, but the main problem is
lignin. Lignin is highly resistant to microbial degradation, so that only 80% of the organic
component present in thatch is readily decomposable. According to McCarty (2001)
thatch decompositions rely upon the activity of soil microorganisms, whose activity is
greatly affected by: pH, aeration, temperature, moisture, and carbon-nitrogen ratio.
From those factors, mechanical aerification is a commonly used maintenance practice.
Some of the available options that can be used by golf course superintendents to
reduce thatch accumulation in paspalum cultivars are practices that focus on aeration.
According to Christians (1998), there are available practices that favor aeration such as:
core aerification, solid tine aerification, deep-drill aerification, water injection cultivation,
and vertical mowing. The challenge is to use combination of those maintenance
practices to increase microbial activity and reduce the thatch accumulation rate.
From this comparative study, the required maintenance for paspalum grasses
appears to be different from bermuda grasses because the higher production of thatch
depth. Light and frequent topdressing applications, the optimal nitrogen rate and
verticutting appeared to produce the best paspalum quality in this study. However,
further evaluation of other maintenance practices such as rolling frequency and
aerification intervals are highly recommended.
Root Dry Matter
Root dry matter sampling was taken five times per year. In the 2008 study, N rate
did not influence Sea Dwarf root dry matter at any of the evaluated dates, but it did
influence the overall root dry matter for Sea Isle Supreme during the 3rd evaluation
period. Sea Dwarf root dry matter was higher (1329 to 1059 g m-2) compared with Sea
43
Isle Supreme root dry matter (847 to 844 g m-2) (Fig. 3-14a) in 2008. Root dry matter for
bemuda grasses in 2008 was not influenced by N rates. However, a difference was
found between cultivars: Jones Dwarf root dry matter was higher (648 to 668 g m-2)
compared with Mini Verde (446 to 476 g m-2 ) (Fig. 3-14b).
In the 2009 study, the same tendency was found where root dry matter was not
influenced by N rates for paspalum cultivars. However, a reduction in overall mean root
dry matter was found in 2009 for paspalum (Fig 3-14c). This result suggested that even
though the grass was of acceptable quality in 2009, the decrease in N rate produced a
reduction in root dry matter between the 2 years. In the 2009 study, paspalum grasses
showed the same response to N application as in 2008 for both cultivars in root dry
matter, ranging from 857 to 1083 g m-2. In 2009, similar results were found compared
with bermuda grasses of 2008 because nitrogen rate did not produce a difference in
root dry matter (Fig. 3-14d).
In 2009, verticutting did influence the overall mean root dry matter in Jones
Dwarf. The high verticutting frequency produced more roots dry matter (692 g m-2)
compared with the low verticutting frequency (556.6 g m-2) for Jones Dwarf in 2009. This
result suggests that paspalum cultivars produced similar root dry matter, and they
produce more root dry matter than hybrid bermudagrass. Although paspalum grasses
received lower nitrogen application than hybrid bermuda grasses, they produced more
root dry matter and it could explain the higher turfgrass visual quality. Also a positive
effect in the Jones Dwarf roots dry matter was observed due to the higher verticutting
frequency.
44
Loss on Ignition
Weight loss on ignition is a measurement of the amount of organic matter or
thatch in the sample. Percentage weight loss on ignition is commonly used to quantify
the amount of organic matter accumulated in the thatch layer of turfgrass (Kruse and
Sartain 2001, Sartain, 1985; Sartain and Volk, 1984; Smiley and Craven,1978).
In 2008, the overall mean percentage loss on ignition of Paspalum grasses was
influenced by nitrogen rate. Unexpectedly it appeared that paspalum grasses
percentage loss on ignition values decreased from 13.8% to 12.1% as the nitrogen rate
increased from 49 to 196 kg N ha-1 yr-1 (Fig. 3-15a). On the other hand, Bermuda
grasses loss on ignition was not influenced by N rate in 2008 (Table 3-8).
In the 2009 study, an increase in the overall percentage loss on ignition was
observed for paspalum and bermuda grasses compared with 2008, with values from
30.35% to 32.58% (3-15c) and 35.92% to 37.34% (Fig 3-15d) for paspalum and
bermuda grasses, respectively. The increases in amount of oxidizable organic matter
were expected in the second year because a higher increase in thatch depth was found.
In 2009, paspalum grasses did not produce more weight loss on ignition in response to
applied N.
In 2009 study, all turfgrasses were very similar in weight loss on ignition across
the three nitrogen rates. This comparative study differs with other studies because they
have shown linear and quadratic effects in percentage loss on ignition with increases in
N rate (Guertal and Evans; 2006, and Trenholm et al., 1998). It appears that the
percentage loss on ignition results obtained for both years in this study can be attributed
to the similar growth rate and thatch depth responses of both cultivars to the nitrogen
rates applied.
45
Economic Analysis
Golf courses represent an important component of the Florida economy. According to
Haydu and Hodges (2002) the area owned by Florida golf courses was 82,961 hectares
with 56,656 hectares irrigated and 59,489 hectares in maintained turf. The predominant
type of turfgrass on typical putting greens and fairways in Florida is some cultivar of
Bermudagrass representing 93% of maintained turf areas. However, paspalum grasses
have been adopted by golf courses in the southeast US because they appear to have
low N requirements and tolerance to high salinity irrigation water. Accounting for the
water used, it was estimated that 173 billion gallons were used for irrigation of golf
courses in Florida (Haydu and Hodges, 2002), of which 49% came from recycled water,
and with lesser amounts of 29% and 21% from surface waters and wells, respectively
(Haydu and Hodges, 2002). Therefore, introduction of new paspalum cultivars that
require less N fertilization can have a positive impact for golf courses in Florida, but at
the same time they require a new set of management practices.
Golf course superintendents have used many cultural practices in order to produce a
healthy turf that fulfills golfers’ expectations. It has been suggested that maintenance
costs for paspalum cultivars are lower when compared with bermuda cultivars, but the
actual cost of maintaining an acceptable paspalum green is unknown. A comparative
maintenance study of paspalum and bermuda grasses was conducted and an economic
analysis was accomplished.
The cost of each of the cultural practices such as mowing (frequency and height),
aerification, irrigation, topdressing (frequency and rate), verticutting (frequency),
nitrogen fertilization (rate and frequency), pest management practices (product and
46
doses), labor, and equipment depreciation were recorded for both years (2008 and
2009) to calculate and compare the total cost.
Paspalum grasses fertilization cost ($137.5) was lower than bermuda grasses
($805.5) because during this study paspalum grasses required a lower N rate (12.25 kg
N ha-1yr-1) and fewer applications (four) compared with bermuda grasses, which
required higher N rate (49kg N ha-1yr-1) and more applications (nine). However,
paspalum grasses had a higher verticutting cost ($560) than bermudagrasses ($280)
because paspalum grasses required higher verticutting frequency (twice/month)
compared with bermuda grasses (once/month). The other cost component such as:
mowing ($2064), Aerification ($92), irrigation ($300), topdressing ($640), and pest
management practices ($1017) were similar between cultivars. Finally, paspalum
grasses total maintenance cost was lower ($4811) (Table 3-5) than Bermuda grasses
total maintenance ($5199) (Table 3-6).
47
CHAPTER 4 SUMMARY AND CONCLUSSIONS
In order to maintain an acceptable quality turfgrass throughout the year it is
necessary to understand the nitrogen requirement and management practices of the
turfgrass cultivars used. Paspalum grasses have been adopted by golf courses in the
southeast US because they appear to have a low N requirement and a high tolerance to
high salinity irrigation water. However, necessary management practices that permit
acceptable playability for paspalum grasses are mostly unknown and undocumented in
the US compared with the commonly used bermuda grasses.
This study (2008 and 2009) was conducted to determine and compare the overall
maintenance and nitrogen nutrition requirements for two Paspalum cultivars (Sea Dwarf
and Sea Isle Supreme) and two Bermuda cultivars (Jones Dwarf and Mini Verde) grown
on native soil push-up putting greens. In both years, the effect of the treatments (three
N rates and two management practices) was determined for multiple parameters such
as visual quality, ball roll, growth rate, nitrogen uptake, thatch depth, roots dry matter,
and thatch accumulation (weight loss on ignition). The effects of N rates and
management practices (topdressing in 2008 and verticutting in 2009) were discussed.
The following results were obtained:
1. Paspalum cultivars (Sea Dwarf and Sea Isle Supreme) differed compared with bermuda grasses (Mini Verde and Jones Dwarf) in terms of maintenance and nitrogen nutrition requirements.
2. Topdressing applications did not influence visual quality. However, topdressing at least once a month with 1.6 mm of sand should be applied on bermuda grasses primarily in Jones Dwarf because it increased the ball roll distance.
3. Paspalum cultivars should be fertilized four times (from May to August) with an N application rate of 49 kg N ha-1 yr-1 in order to obtain an acceptable visual quality grown in push up greens.
48
4. To obtain acceptable visual quality for bermuda cultivars they should be fertilized throughout the active growth period (from May to September) at the rate of 488 kg N ha-1 yr-1.
5. Jones Dwarf produced the highest growth rate. Paspalum grasses produced more root dry matter than Bermuda grasses, which was reflected in higher N uptake and greater thatch depth.
6. Verticutting every 2 weeks should be included as a management practice for Sea Isle Supreme in order to achieve acceptable golf course playability.
7. Maintenance requirements for both Bermuda cultivars (Mini Verde and Jones dwarf) and Sea Dwarf Seashore Paspalum should include verticutting once a month to obtain acceptable BRD.
8. Paspalum grasses fertilization cost ($137.5) was lower than bermuda grasses ($805.5) due to a lower N rate (49 kg N ha-1yr-1) and fewer applications (four) required compared with bermuda grasses, which required a higher N rate (488 kg N ha-1yr-1) and more applications (ten).
9. Paspalum grasses had higher verticutting cost ($560) than bermuda grasses ($280) because paspalum grasses required higher verticutting frequency (twice/month) compared with bermuda grasses (once/month).
10. Paspalum grasses total maintenance cost was lower ($4811) than Bermuda grasses total maintenance ($5199).
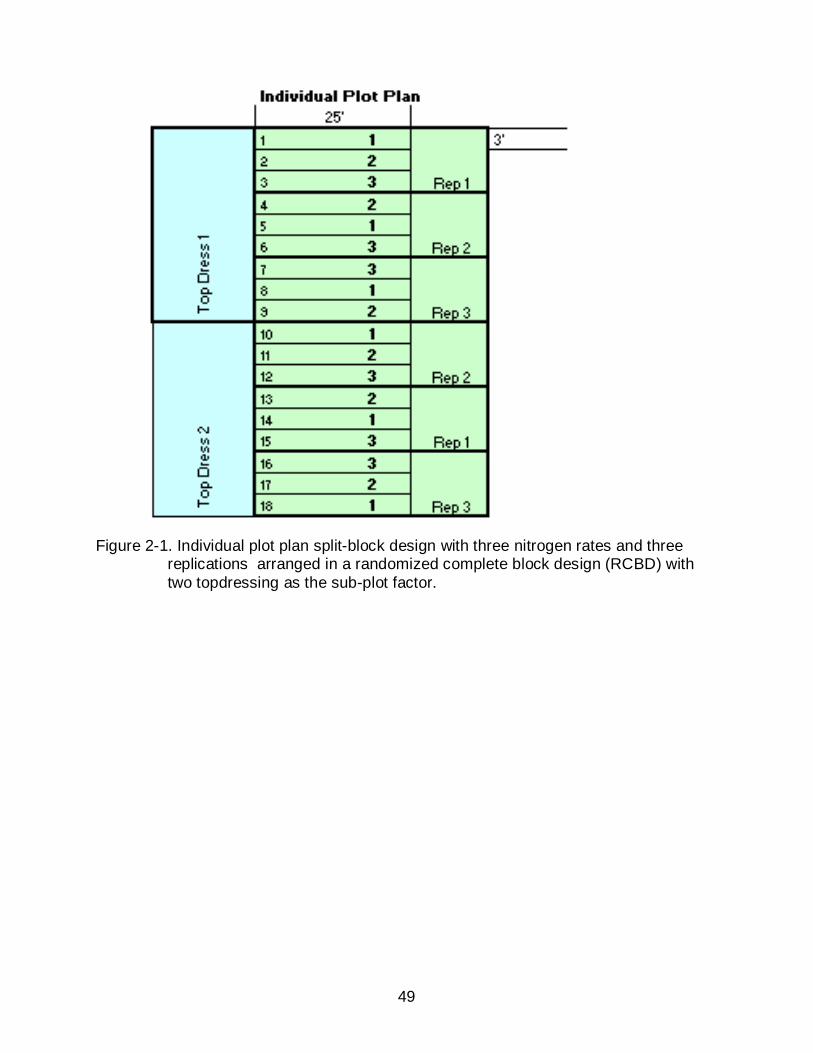
49
Figure 2-1. Individual plot plan split-block design with three nitrogen rates and three
replications arranged in a randomized complete block design (RCBD) with two topdressing as the sub-plot factor.
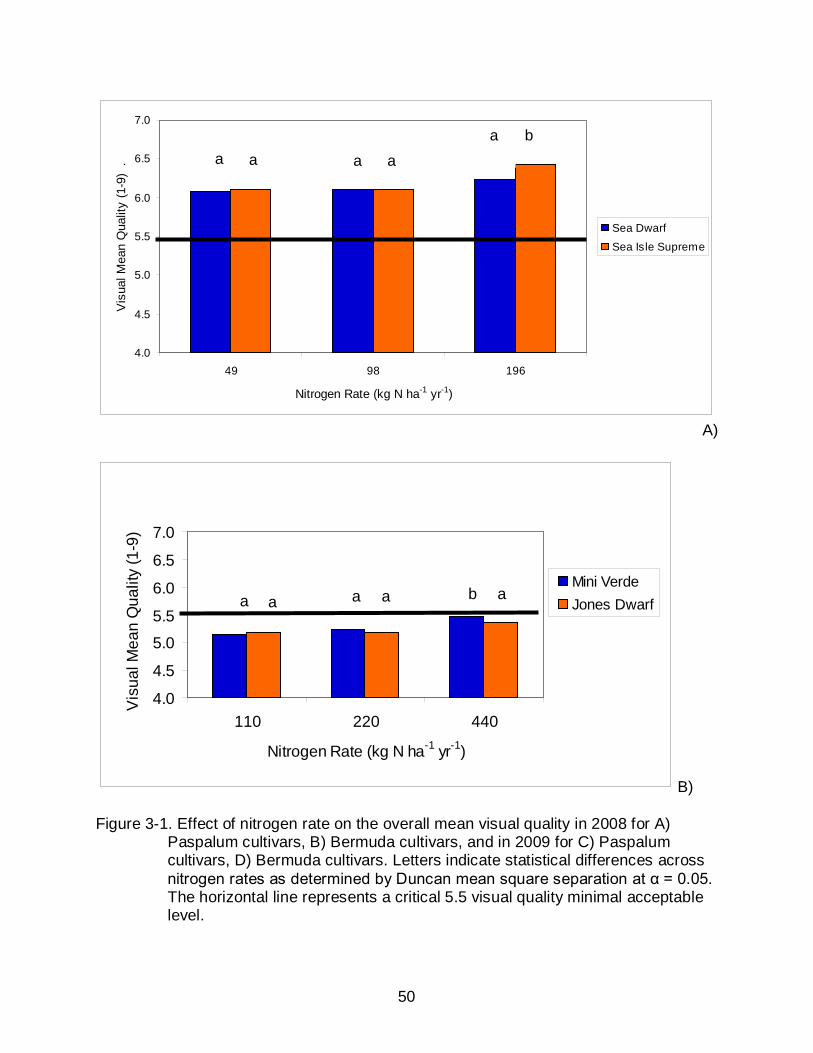
50
A)
B)
Figure 3-1. Effect of nitrogen rate on the overall mean visual quality in 2008 for A) Paspalum cultivars, B) Bermuda cultivars, and in 2009 for C) Paspalum cultivars, D) Bermuda cultivars. Letters indicate statistical differences across nitrogen rates as determined by Duncan mean square separation at α = 0.05. The horizontal line represents a critical 5.5 visual quality minimal acceptable level.
4.0
4.5
5.0
5.5
6.0
6.5
7.0
110 220 440
Nitrogen Rate (kg N ha-1 yr-1)
Vis
ual M
ean
Qua
lity
(1-9
)
Mini VerdeJones Dwarfa a a a a b
4.0
4.5
5.0
5.5
6.0
6.5
7.0
49 98 196
Nitrogen Rate (kg N ha-1 yr-1)
Vis
ual M
ean
Qua
lity
(1-9
) .
Sea Dwarf
Sea Isle Supreme
a a a a a b
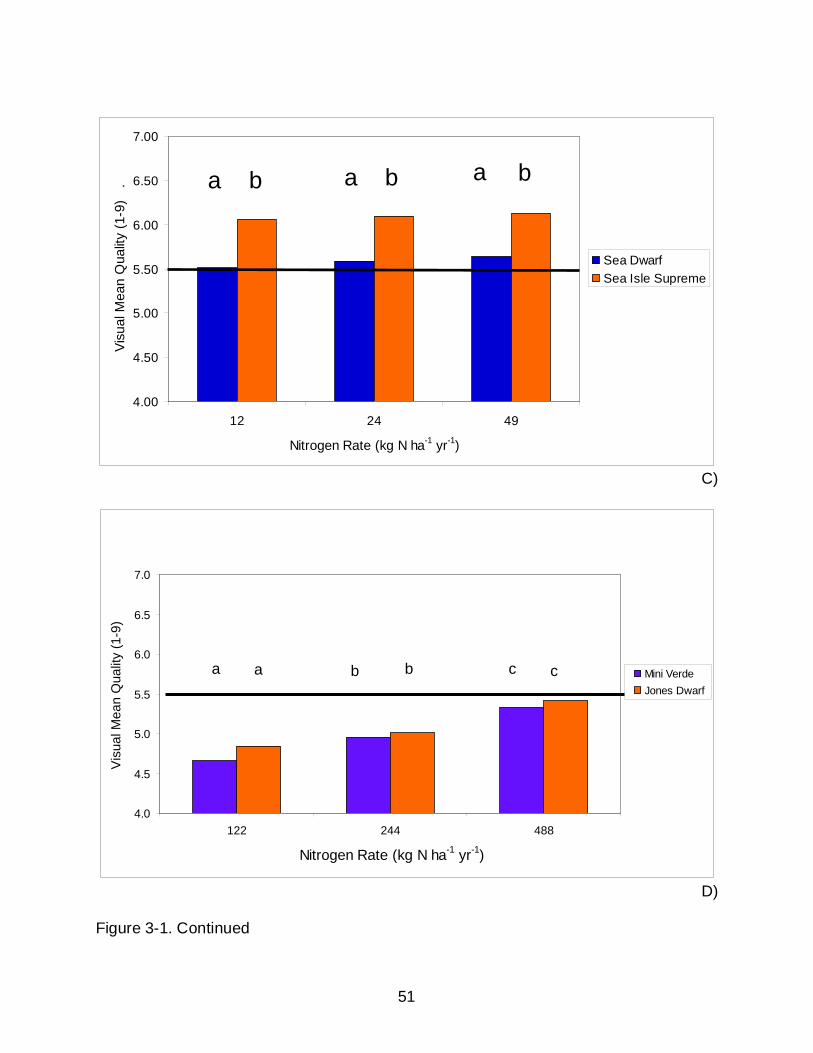
51
C)
4.0
4.5
5.0
5.5
6.0
6.5
7.0
122 244 488
Nitrogen Rate (kg N ha-1 yr-1)
Vis
ual M
ean
Qua
lity
(1-9
)
Mini VerdeJones Dwarf
a a b b cc
D) Figure 3-1. Continued
4.00
4.50
5.00
5.50
6.00
6.50
7.00
12 24 49
Nitrogen Rate (kg N ha-1 yr-1)
Visu
al M
ean
Qua
lity
(1-9
) .
Sea DwarfSea Isle Supreme
a a a b b b
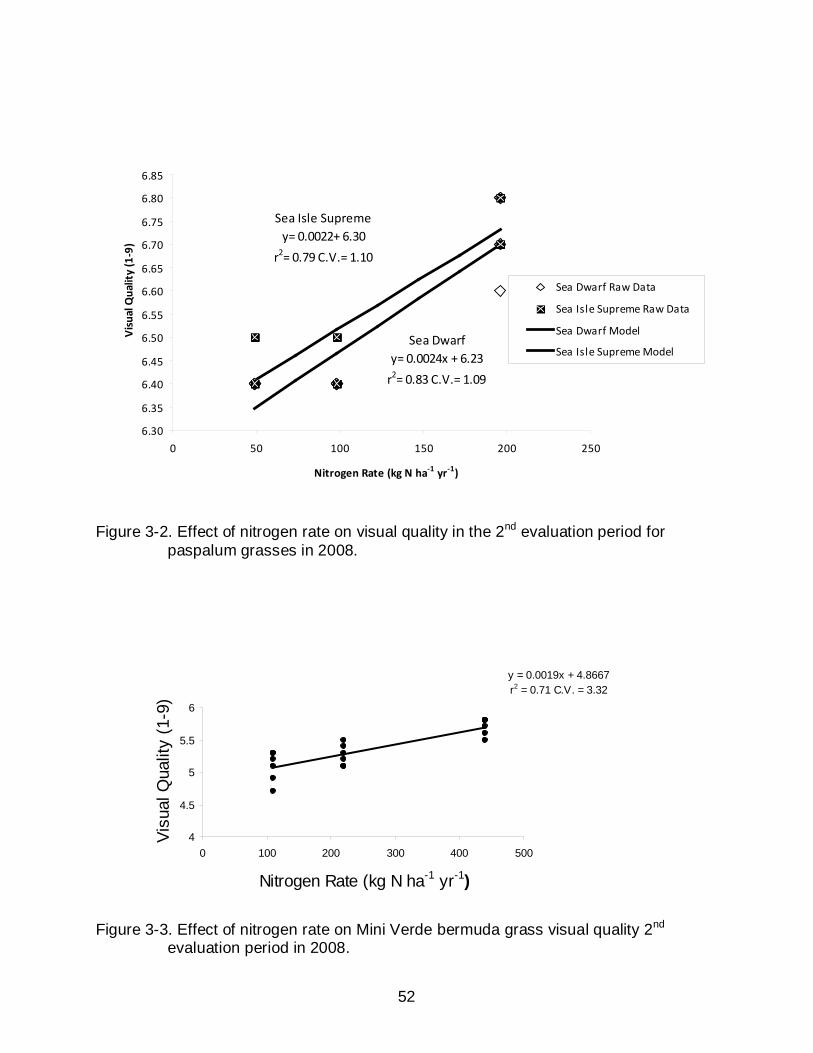
52
6.30
6.35
6.40
6.45
6.50
6.55
6.60
6.65
6.70
6.75
6.80
6.85
0 50 100 150 200 250
Nitrogen Rate (kg N ha-1 yr-1)
Vis
ual Q
ualit
y (1
-9)
Sea Dwarf Raw Data
Sea Isle Supreme Raw Data
Sea Dwarf Model
Sea Isle Supreme Model
Sea Isle Supremey= 0.0022+ 6.30
r2= 0.79 C.V.= 1.10
Sea Dwarfy= 0.0024x + 6.23
r2= 0.83 C.V.= 1.09
Figure 3-2. Effect of nitrogen rate on visual quality in the 2nd evaluation period for
paspalum grasses in 2008.
y = 0.0019x + 4.8667r2 = 0.71 C.V. = 3.32
4
4.5
5
5.5
6
0 100 200 300 400 500
Nitrogen Rate (kg N ha-1 yr-1)
Visu
al Q
ualit
y (1
-9)
Figure 3-3. Effect of nitrogen rate on Mini Verde bermuda grass visual quality 2nd
evaluation period in 2008.
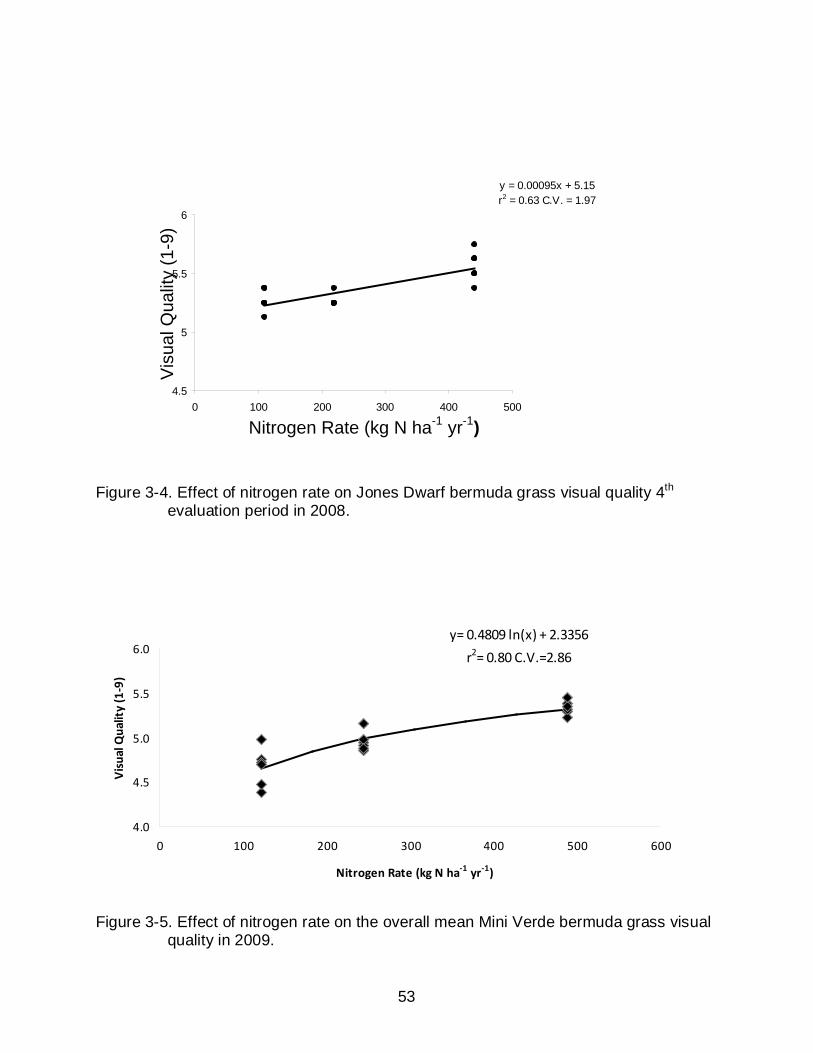
53
y = 0.00095x + 5.15r2 = 0.63 C.V. = 1.97
4.5
5
5.5
6
0 100 200 300 400 500
Nitrogen Rate (kg N ha-1 yr-1)
Vis
ual Q
ualit
y (1
-9)
Figure 3-4. Effect of nitrogen rate on Jones Dwarf bermuda grass visual quality 4th
evaluation period in 2008.
4.0
4.5
5.0
5.5
6.0
0 100 200 300 400 500 600
Nitrogen Rate (kg N ha-1 yr-1)
Vis
ual Q
ualit
y (1
-9)
y= 0.4809 ln(x) + 2.3356
r2= 0.80 C.V.=2.86
Figure 3-5. Effect of nitrogen rate on the overall mean Mini Verde bermuda grass visual quality in 2009.
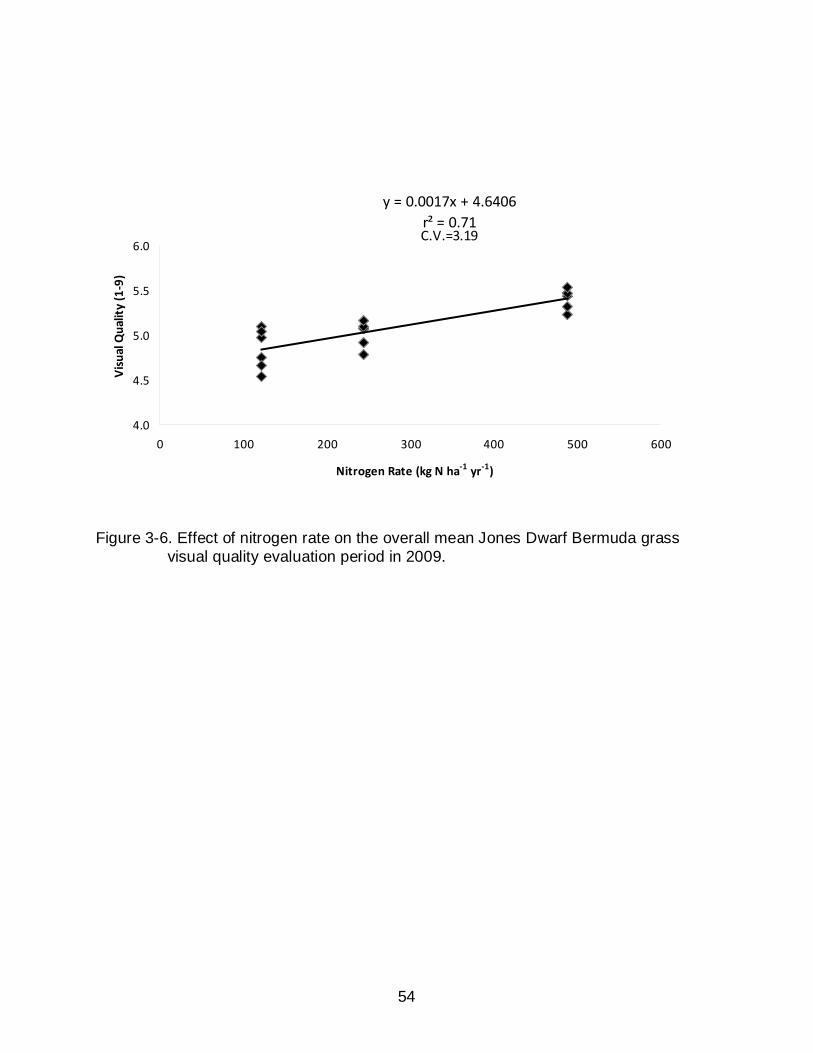
54
y = 0.0017x + 4.6406r² = 0.71
4.0
4.5
5.0
5.5
6.0
0 100 200 300 400 500 600
Nitrogen Rate (kg N ha-1 yr-1)
Vis
ual Q
ualit
y (1
-9)
C.V.=3.19
Figure 3-6. Effect of nitrogen rate on the overall mean Jones Dwarf Bermuda grass visual quality evaluation period in 2009.
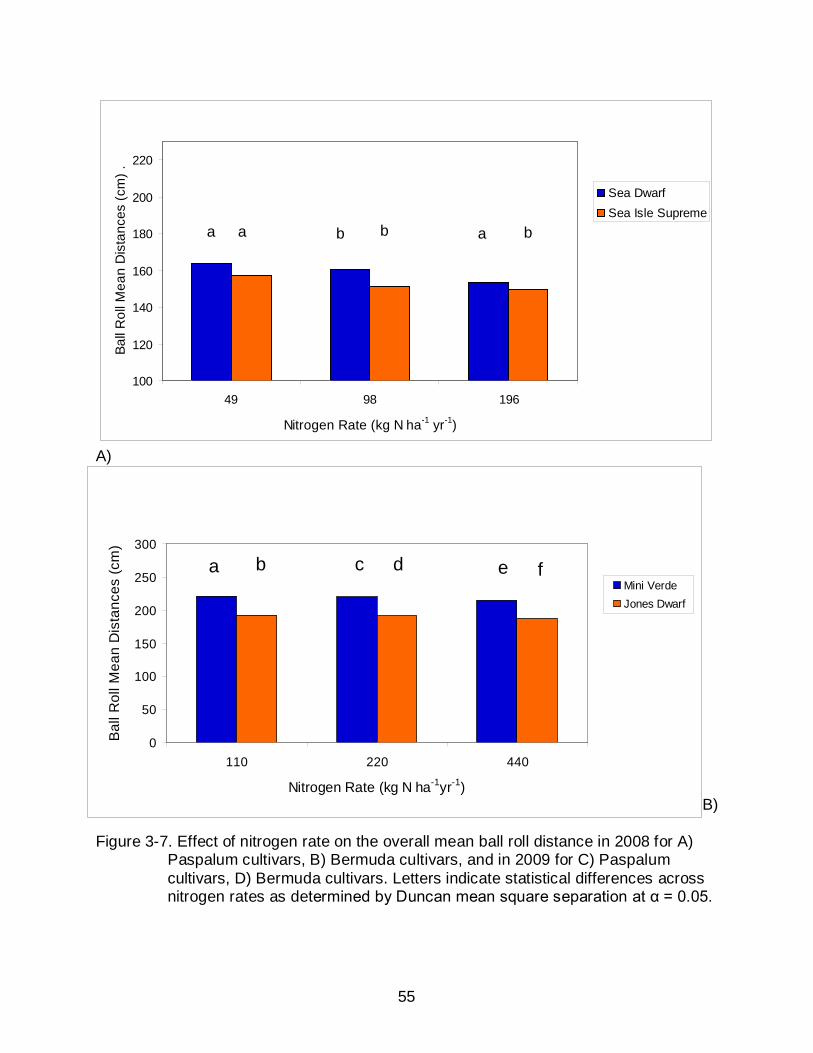
55
0
50
100
150
200
250
300
110 220 440
Nitrogen Rate (kg N ha-1yr-1)
Bal
l Rol
l Mea
n D
ista
nces
(cm
)
Mini VerdeJones Dwarf
a b c d f e
A)
B)
Figure 3-7. Effect of nitrogen rate on the overall mean ball roll distance in 2008 for A) Paspalum cultivars, B) Bermuda cultivars, and in 2009 for C) Paspalum cultivars, D) Bermuda cultivars. Letters indicate statistical differences across nitrogen rates as determined by Duncan mean square separation at α = 0.05.
100
120
140
160
180
200
220
49 98 196
Nitrogen Rate (kg N ha-1 yr-1)
Ball
Rol
l Mea
n D
ista
nces
(cm
) .
Sea DwarfSea Isle Supreme
a b a a b b
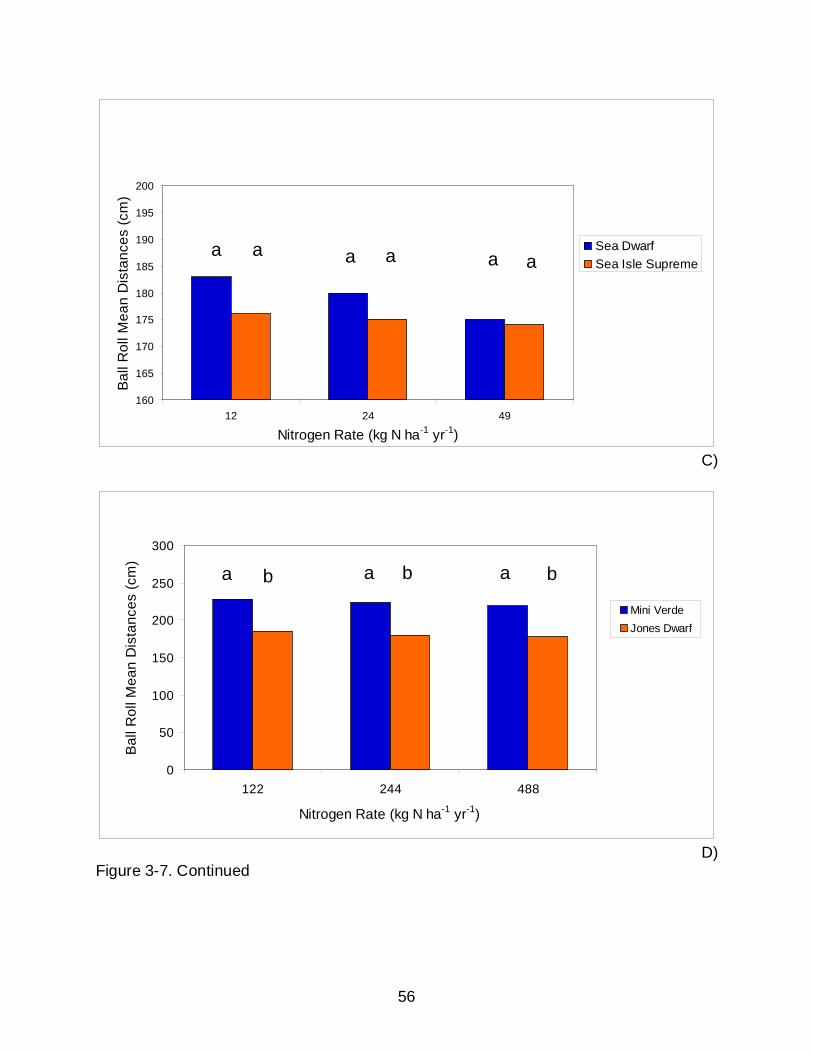
56
C)
D) Figure 3-7. Continued
0
50
100
150
200
250
300
122 244 488
Nitrogen Rate (kg N ha-1 yr-1)
Bal
l Rol
l Mea
n D
ista
nces
(cm
)
Mini VerdeJones Dwarf
a b a b b a
160
165
170
175
180
185
190
195
200
12 24 49
Nitrogen Rate (kg N ha-1 yr-1)
Bal
l Rol
l Mea
n D
ista
nces
(cm
)
Sea DwarfSea Isle Supreme
a a a a a a
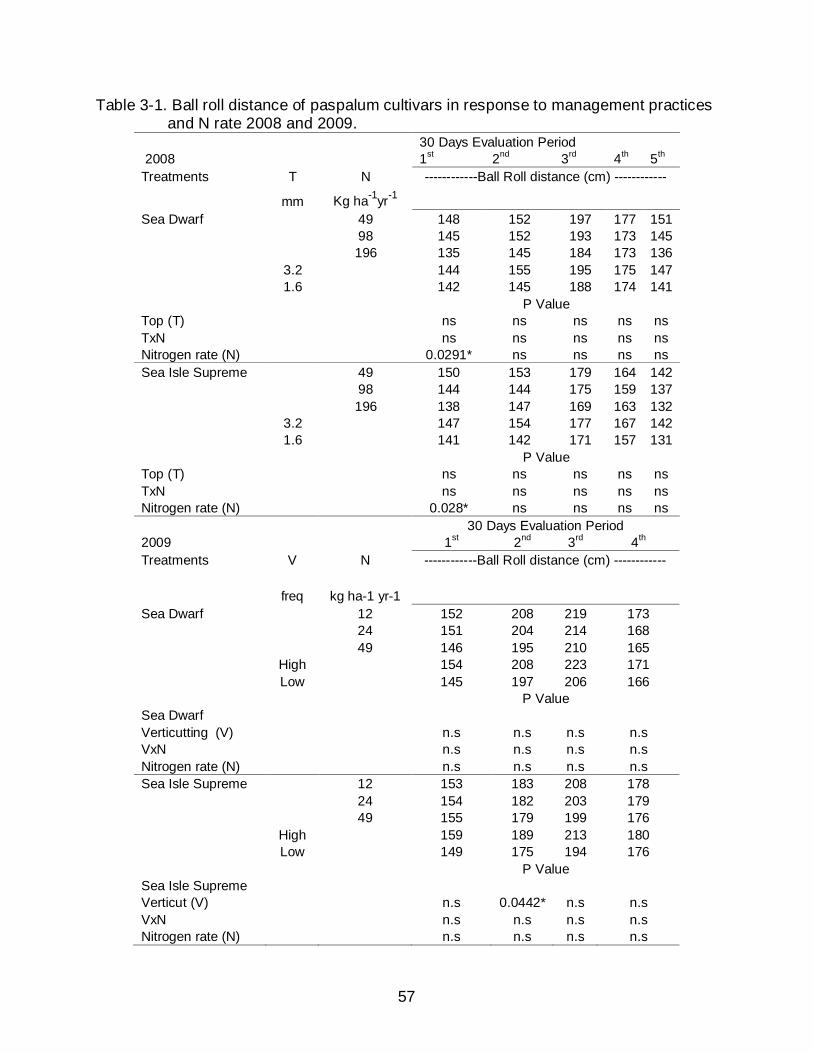
57
Table 3-1. Ball roll distance of paspalum cultivars in response to management practices and N rate 2008 and 2009.
30 Days Evaluation Period 2008 1st 2nd 3rd 4th 5th Treatments T N ------------Ball Roll distance (cm) ------------
mm Kg ha-1yr-1 Sea Dwarf 49 148 152 197 177 151 98 145 152 193 173 145 196 135 145 184 173 136 3.2 144 155 195 175 147 1.6 142 145 188 174 141 P Value Top (T) ns ns ns ns ns TxN ns ns ns ns ns Nitrogen rate (N) 0.0291* ns ns ns ns Sea Isle Supreme 49 150 153 179 164 142 98 144 144 175 159 137 196 138 147 169 163 132 3.2 147 154 177 167 142 1.6 141 142 171 157 131 P Value Top (T) ns ns ns ns ns TxN ns ns ns ns ns Nitrogen rate (N) 0.028* ns ns ns ns 30 Days Evaluation Period 2009 1st 2nd 3rd 4th Treatments V N ------------Ball Roll distance (cm) ------------
freq kg ha-1 yr-1 Sea Dwarf 12 152 208 219 173 24 151 204 214 168 49 146 195 210 165 High 154 208 223 171 Low 145 197 206 166 P Value Sea Dwarf Verticutting (V) n.s n.s n.s n.s VxN n.s n.s n.s n.s Nitrogen rate (N) n.s n.s n.s n.s Sea Isle Supreme 12 153 183 208 178 24 154 182 203 179 49 155 179 199 176 High 159 189 213 180 Low 149 175 194 176 P Value Sea Isle Supreme Verticut (V) n.s 0.0442* n.s n.s VxN n.s n.s n.s n.s Nitrogen rate (N) n.s n.s n.s n.s

58
A)
0.0
2.0
4.0
6.0
8.0
10.0
110 220 440
Nitrogen Rate (kg N ha-1yr-1)
Gro
wth
Rat
e (g
m-2
day-1
)
Mini VerdeJones Dwarf
a b a b ba
B) Figure 3-8. Effect of nitrogen rate on the overall mean growth rate in 2008 for A)
Paspalum cultivars, B) Bermuda cultivars, and in 2009 for C) Paspalum cultivars, D) Bermuda cultivars Paspalum cultivars. Letters indicate statistical differences across nitrogen rates as determined by Duncan mean square separation at α = 0.05.
0.0
2.0
4.0
6.0
8.0
10.0
49 98 196
Nitrogen Rate (kg N ha-1 yr-1)
Gro
wth
Rat
e (g
m-2
day-1
)
Sea DwarfSea Isle Supreme
a a a a a a
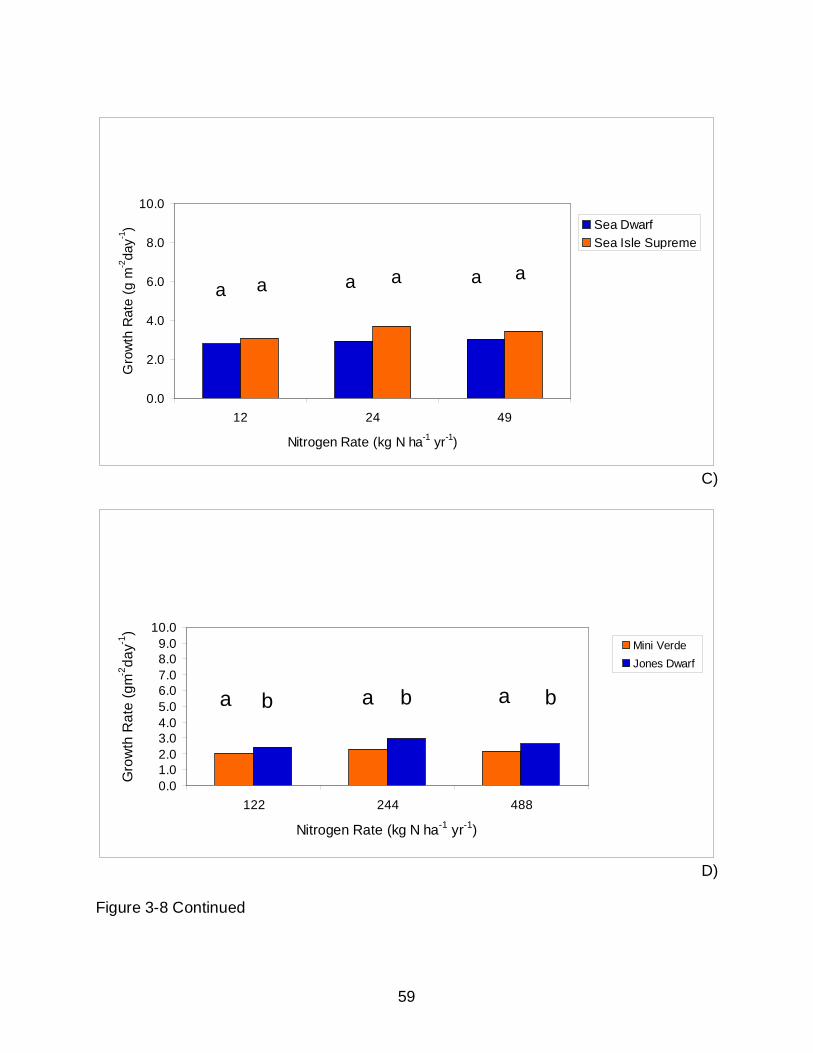
59
C)
D) Figure 3-8 Continued
0.01.02.03.04.05.06.07.08.09.0
10.0
122 244 488
Nitrogen Rate (kg N ha-1 yr-1)
Gro
wth
Rat
e (g
m-2
day-1
)
Mini VerdeJones Dwarf
a b a b b a
0.0
2.0
4.0
6.0
8.0
10.0
12 24 49
Nitrogen Rate (kg N ha-1 yr-1)
Gro
wth
Rat
e (g
m-2da
y-1) Sea Dwarf
Sea Isle Supreme
a a a a a a
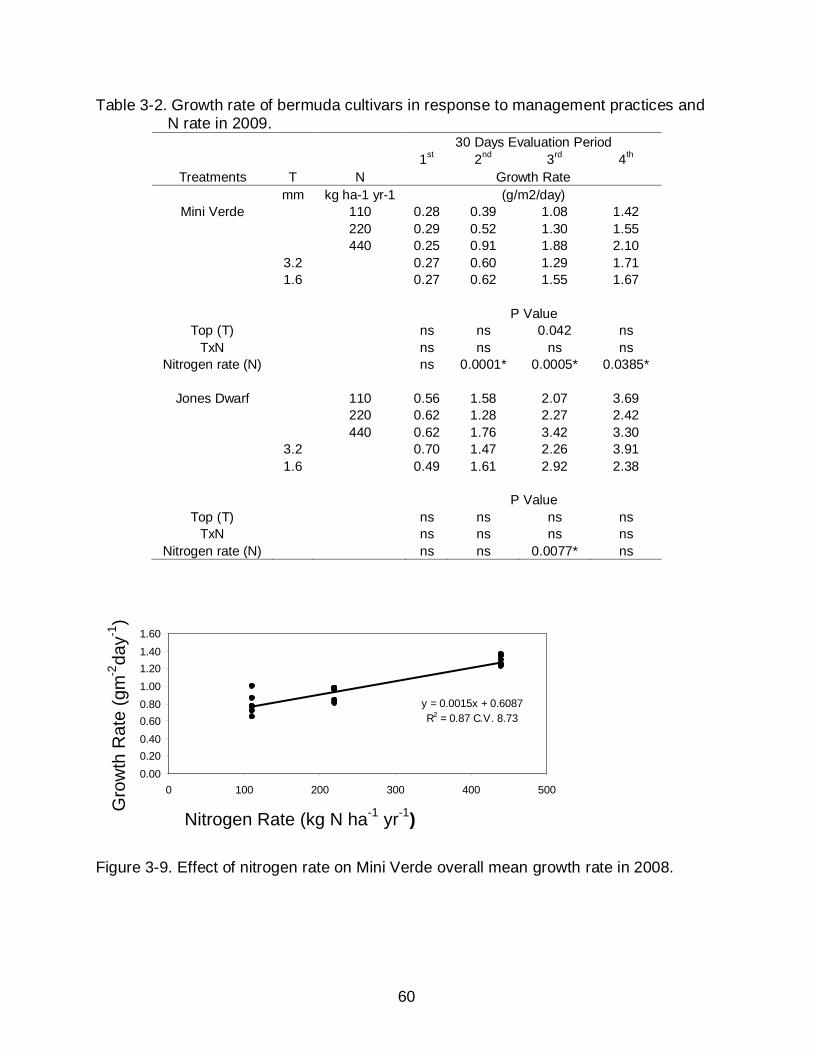
60
Table 3-2. Growth rate of bermuda cultivars in response to management practices and N rate in 2009.
Treatments T N
30 Days Evaluation Period 1st 2nd 3rd 4th
Growth Rate mm kg ha-1 yr-1 (g/m2/day)
Mini Verde 110 0.28 0.39 1.08 1.42 220 0.29 0.52 1.30 1.55 440 0.25 0.91 1.88 2.10 3.2 0.27 0.60 1.29 1.71 1.6 0.27 0.62 1.55 1.67 P Value
Top (T) ns ns 0.042 ns TxN ns ns ns ns
Nitrogen rate (N) ns 0.0001* 0.0005* 0.0385*
Jones Dwarf 110 0.56 1.58 2.07 3.69 220 0.62 1.28 2.27 2.42 440 0.62 1.76 3.42 3.30 3.2 0.70 1.47 2.26 3.91 1.6 0.49 1.61 2.92 2.38 P Value
Top (T) ns ns ns ns TxN ns ns ns ns
Nitrogen rate (N) ns ns 0.0077* ns
y = 0.0015x + 0.6087R2 = 0.87 C.V. 8.73
0.000.200.400.600.801.001.201.401.60
0 100 200 300 400 500
Nitrogen Rate (kg N ha-1 yr-1)
Gro
wth
Rat
e (g
m-2
day-1
)
Figure 3-9. Effect of nitrogen rate on Mini Verde overall mean growth rate in 2008.
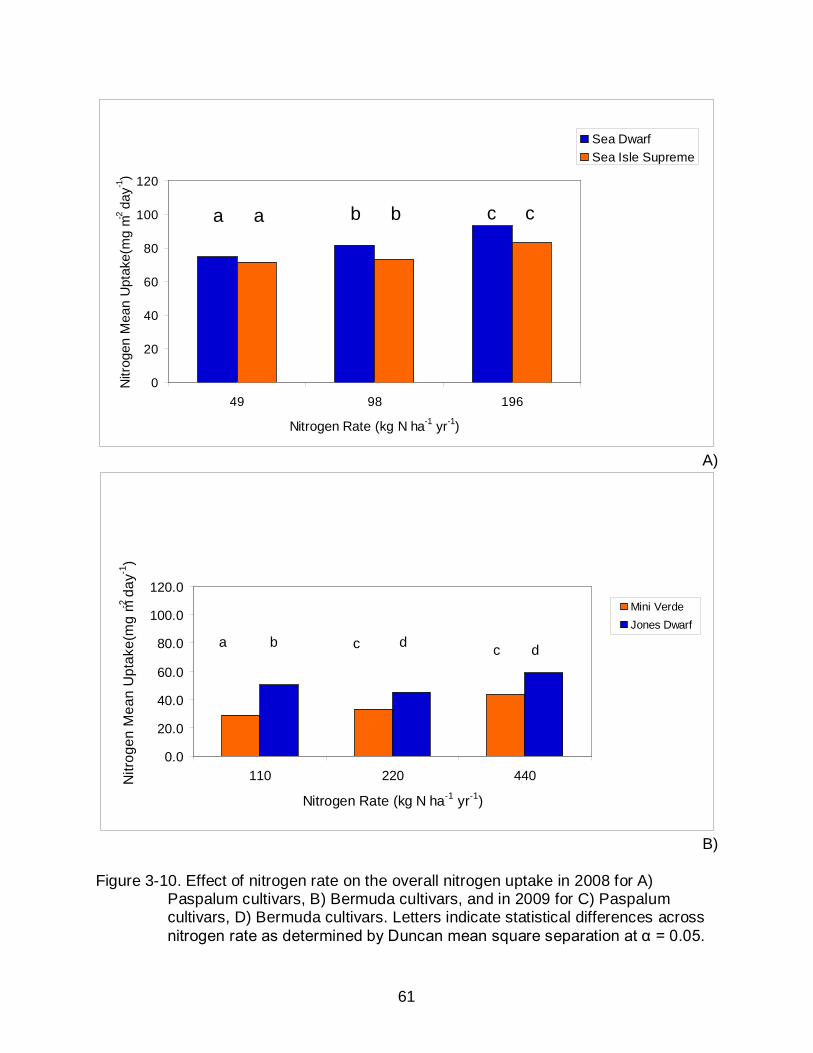
61
A)
0.0
20.0
40.0
60.0
80.0
100.0
120.0
110 220 440
Nitrogen Rate (kg N ha-1 yr-1)
Nitr
ogen
Mea
n U
ptak
e(m
g m-2
day-1
)
Mini VerdeJones Dwarf
a b c d dc
B) Figure 3-10. Effect of nitrogen rate on the overall nitrogen uptake in 2008 for A)
Paspalum cultivars, B) Bermuda cultivars, and in 2009 for C) Paspalum cultivars, D) Bermuda cultivars. Letters indicate statistical differences across nitrogen rate as determined by Duncan mean square separation at α = 0.05.
0
20
40
60
80
100
120
49 98 196
Nitrogen Rate (kg N ha-1 yr-1)
Nitr
ogen
Mea
n U
ptak
e(m
g m-2
day-1
) Sea DwarfSea Isle Supreme
a a b b c c
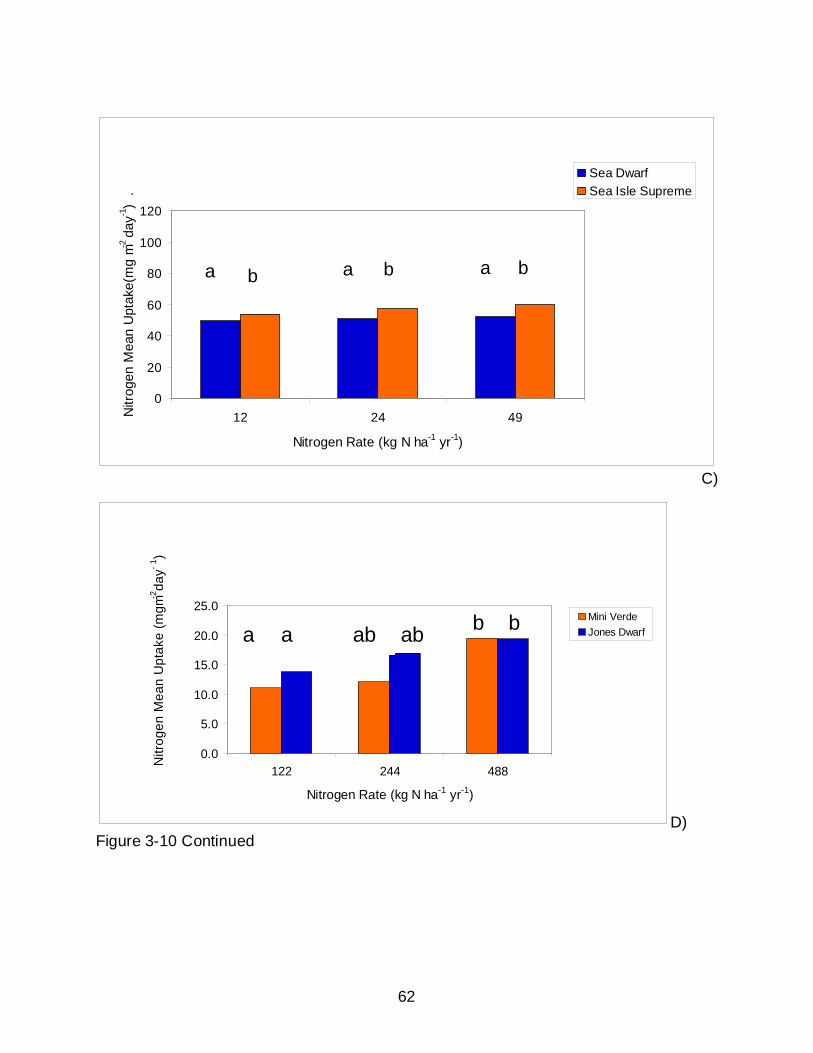
62
C)
D) Figure 3-10 Continued
0.0
5.0
10.0
15.0
20.0
25.0
122 244 488
Nitrogen Rate (kg N ha-1 yr-1)
Nitr
ogen
Mea
n U
ptak
e (m
gm -2da
y- 1)
Mini VerdeJones Dwarfa a ab ab b b
0
20
40
60
80
100
120
12 24 49
Nitrogen Rate (kg N ha-1 yr-1)
Nitr
ogen
Mea
n U
ptak
e(m
g m-2
day-1
) .
Sea DwarfSea Isle Supreme
a a b a b b
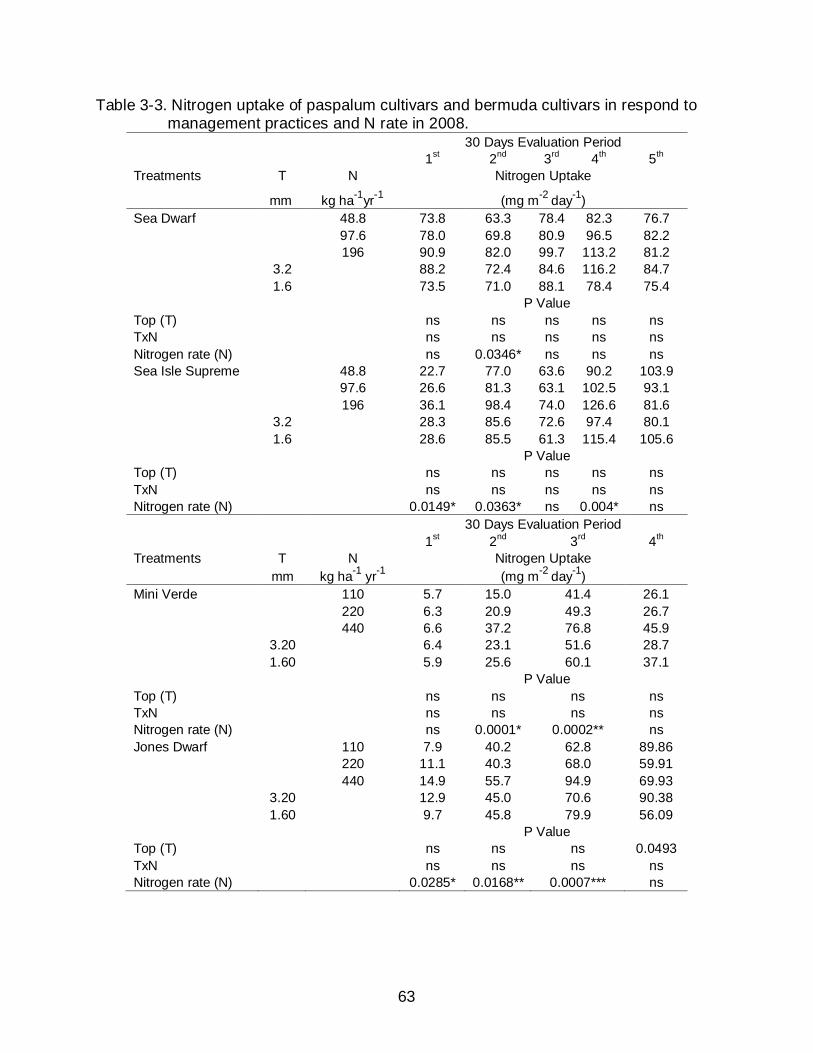
63
Table 3-3. Nitrogen uptake of paspalum cultivars and bermuda cultivars in respond to management practices and N rate in 2008.
30 Days Evaluation Period 1st 2nd 3rd 4th 5th Treatments T N Nitrogen Uptake
mm kg ha-1yr-1 (mg m-2 day-1) Sea Dwarf 48.8 73.8 63.3 78.4 82.3 76.7 97.6 78.0 69.8 80.9 96.5 82.2 196 90.9 82.0 99.7 113.2 81.2 3.2 88.2 72.4 84.6 116.2 84.7 1.6 73.5 71.0 88.1 78.4 75.4 P Value Top (T) ns ns ns ns ns TxN ns ns ns ns ns Nitrogen rate (N) ns 0.0346* ns ns ns Sea Isle Supreme 48.8 22.7 77.0 63.6 90.2 103.9 97.6 26.6 81.3 63.1 102.5 93.1 196 36.1 98.4 74.0 126.6 81.6 3.2 28.3 85.6 72.6 97.4 80.1 1.6 28.6 85.5 61.3 115.4 105.6 P Value Top (T) ns ns ns ns ns TxN ns ns ns ns ns Nitrogen rate (N) 0.0149* 0.0363* ns 0.004* ns 30 Days Evaluation Period 1st 2nd 3rd 4th Treatments T N Nitrogen Uptake mm kg ha-1 yr-1 (mg m-2 day-1) Mini Verde 110 5.7 15.0 41.4 26.1 220 6.3 20.9 49.3 26.7 440 6.6 37.2 76.8 45.9 3.20 6.4 23.1 51.6 28.7 1.60 5.9 25.6 60.1 37.1 P Value Top (T) ns ns ns ns TxN ns ns ns ns Nitrogen rate (N) ns 0.0001* 0.0002** ns Jones Dwarf 110 7.9 40.2 62.8 89.86 220 11.1 40.3 68.0 59.91 440 14.9 55.7 94.9 69.93 3.20 12.9 45.0 70.6 90.38 1.60 9.7 45.8 79.9 56.09 P Value Top (T) ns ns ns 0.0493 TxN ns ns ns ns Nitrogen rate (N) 0.0285* 0.0168** 0.0007*** ns
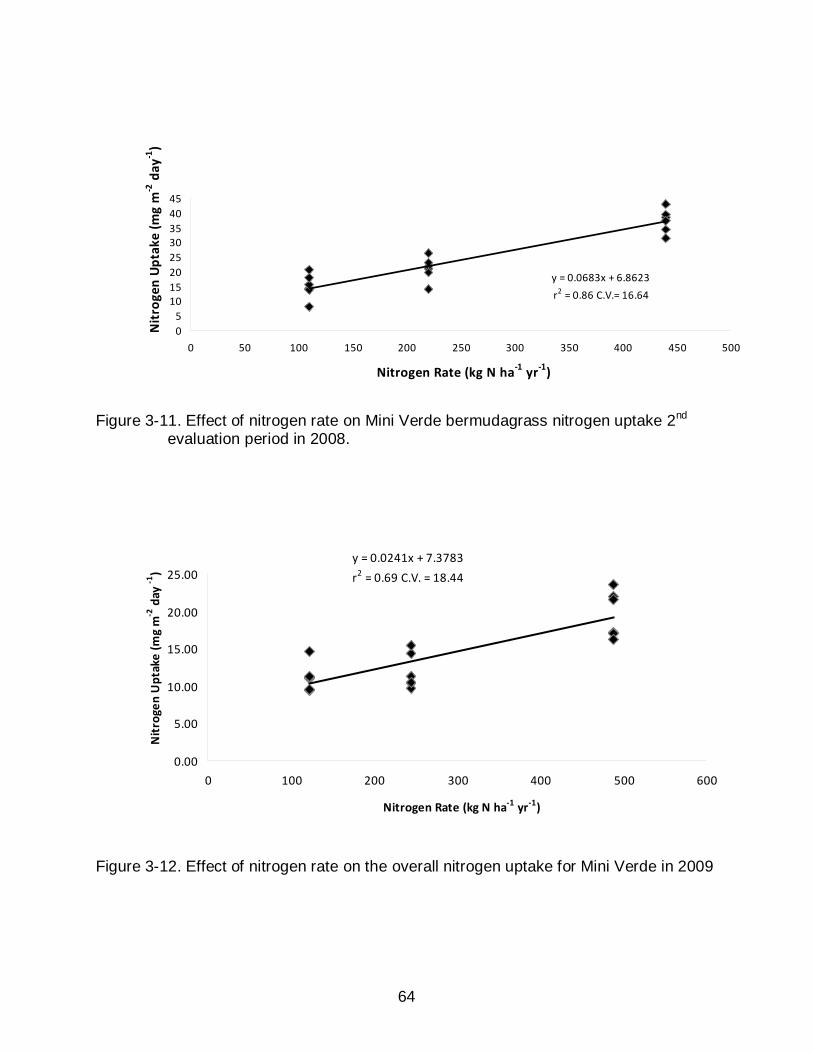
64
y = 0.0683x + 6.8623
r2 = 0.86 C.V.= 16.64
05
1015202530354045
0 50 100 150 200 250 300 350 400 450 500
Nitrogen Rate (kg N ha-1 yr-1)
Nit
roge
n U
ptak
e (m
g m
-2 d
ay-1
)
Figure 3-11. Effect of nitrogen rate on Mini Verde bermudagrass nitrogen uptake 2nd evaluation period in 2008.
y = 0.0241x + 7.3783
r2 = 0.69 C.V. = 18.44
0.00
5.00
10.00
15.00
20.00
25.00
0 100 200 300 400 500 600
Nitrogen Rate (kg N ha-1 yr-1)
Nit
roge
n U
ptak
e (m
g m
-2 d
ay -1
)
Figure 3-12. Effect of nitrogen rate on the overall nitrogen uptake for Mini Verde in 2009
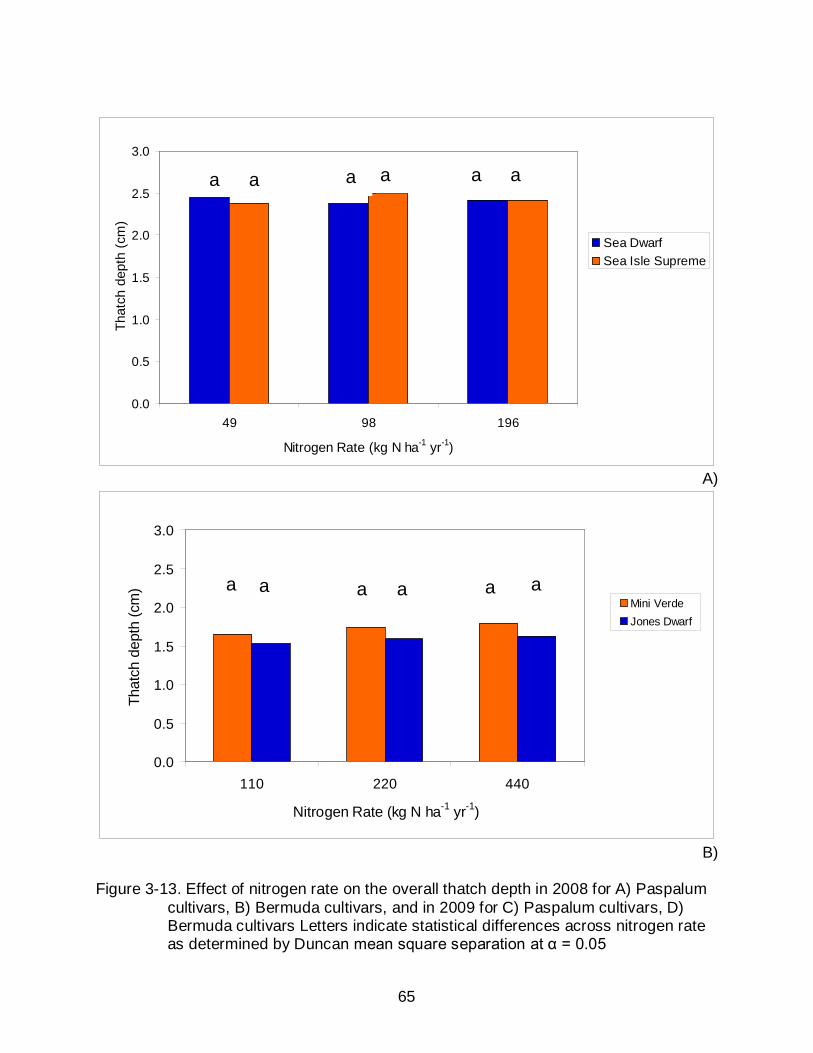
65
A)
B) Figure 3-13. Effect of nitrogen rate on the overall thatch depth in 2008 for A) Paspalum
cultivars, B) Bermuda cultivars, and in 2009 for C) Paspalum cultivars, D) Bermuda cultivars Letters indicate statistical differences across nitrogen rate as determined by Duncan mean square separation at α = 0.05
0.0
0.5
1.0
1.5
2.0
2.5
3.0
110 220 440
Nitrogen Rate (kg N ha-1 yr-1)
That
ch d
epth
(cm
)
Mini VerdeJones Dwarf
a a a a a a
0.0
0.5
1.0
1.5
2.0
2.5
3.0
49 98 196
Nitrogen Rate (kg N ha-1 yr-1)
That
ch d
epth
(cm
)
Sea DwarfSea Isle Supreme
a a a a a a
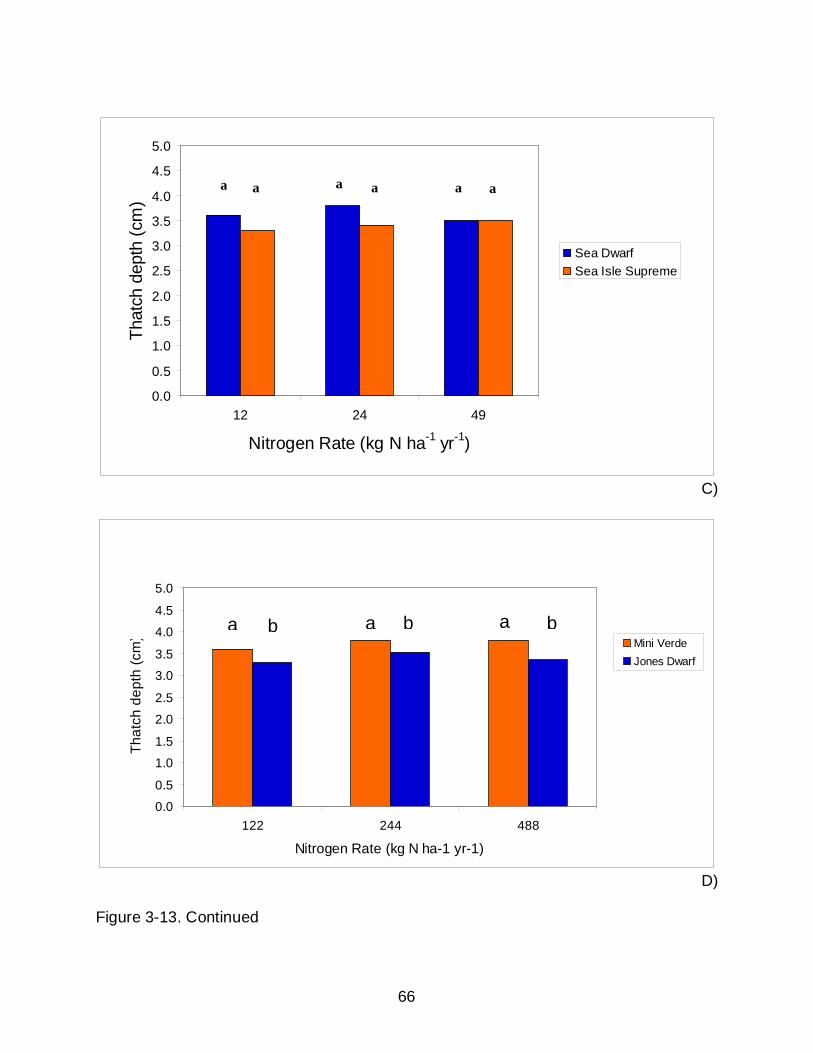
66
0.0
0.5
1.0
1.5
2.0
2.5
3.0
3.5
4.0
4.5
5.0
12 24 49
Nitrogen Rate (kg N ha-1 yr-1)
That
ch d
epth
(cm
)
Sea DwarfSea Isle Supreme
a a a a aa
C)
D) Figure 3-13. Continued
0.0
0.5
1.0
1.5
2.0
2.5
3.0
3.5
4.0
4.5
5.0
122 244 488
Nitrogen Rate (kg N ha-1 yr-1)
That
ch d
epth
(cm
) Mini VerdeJones Dwarf
a b a b b a

67
A)
B) Figure 3-14. Effect of nitrogen rate on the overall roots dry matter in 2008 for A)
Paspalum cultivars, B) Bermuda cultivars, and in 2009 for C) Paspalum cultivars, D) Bermuda cultivars Paspalum cultivars. Letters indicate statistical differences across nitrogen rate as determined by Duncan mean square separation at α = 0.05.
0250500750
10001250150017502000
110 220 440
Nitrogen Rate (kg N ha-1 yr-1)
Roo
t Dry
mat
ter (
g m-2
)
Mini VerdeJones Dwarf
a a a a a a
0
250
500
750
1000
1250
1500
1750
2000
49 98 196
Nitrogen Rate (kg N ha-1 yr-1)
Roo
t Dry
mat
ter (
g m
-2)
Sea DwarfSea Isle Supreme
a a a a a a
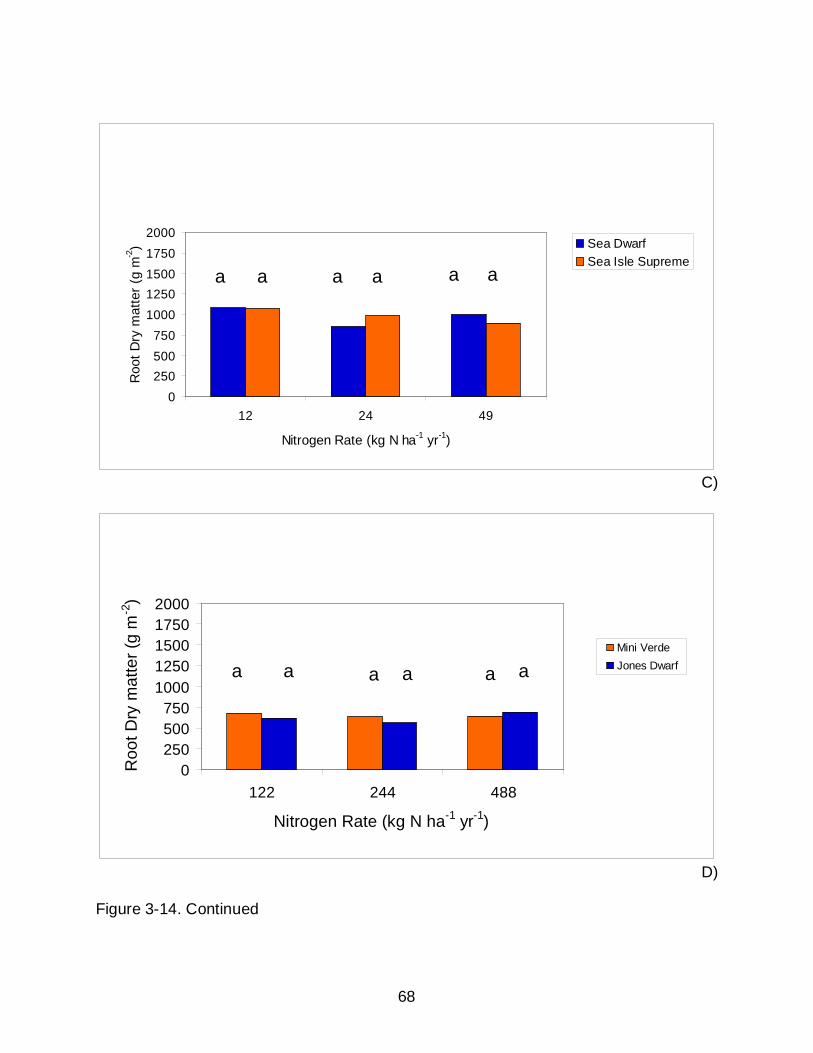
68
C)
D) Figure 3-14. Continued
0250500750
10001250150017502000
122 244 488
Nitrogen Rate (kg N ha-1 yr-1)
Roo
t Dry
mat
ter (
g m
-2)
Mini VerdeJones Dwarfa a a a a a
0250500750
10001250150017502000
12 24 49
Nitrogen Rate (kg N ha-1 yr-1)
Roo
t Dry
mat
ter (
g m
-2) Sea Dwarf
Sea Isle Supremea a a a a a
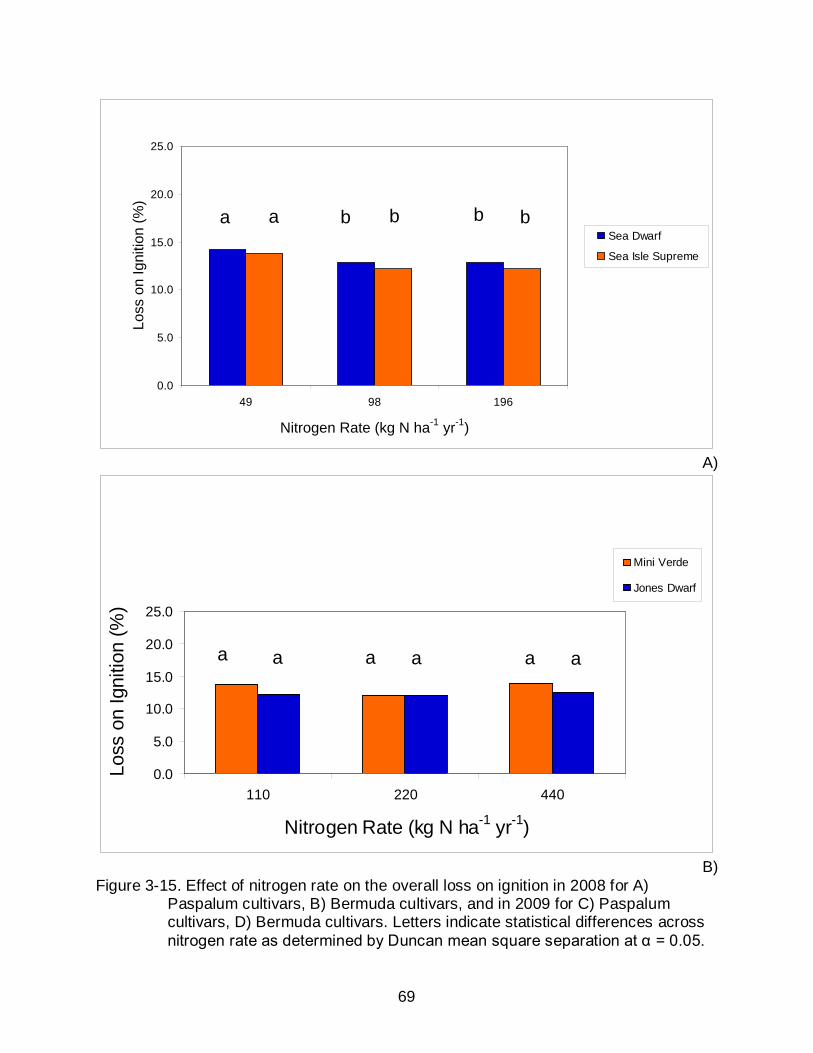
69
A)
B) Figure 3-15. Effect of nitrogen rate on the overall loss on ignition in 2008 for A)
Paspalum cultivars, B) Bermuda cultivars, and in 2009 for C) Paspalum cultivars, D) Bermuda cultivars. Letters indicate statistical differences across nitrogen rate as determined by Duncan mean square separation at α = 0.05.
0.0
5.0
10.0
15.0
20.0
25.0
110 220 440
Nitrogen Rate (kg N ha-1 yr-1)
Loss
on
Igni
tion
(%)
Mini Verde
Jones Dwarf
a a a a a a
0.0
5.0
10.0
15.0
20.0
25.0
49 98 196
Nitrogen Rate (kg N ha-1 yr-1)
Loss
on
Igni
tion
(%)
Sea Dwarf
Sea Isle Supreme
a a b b b b
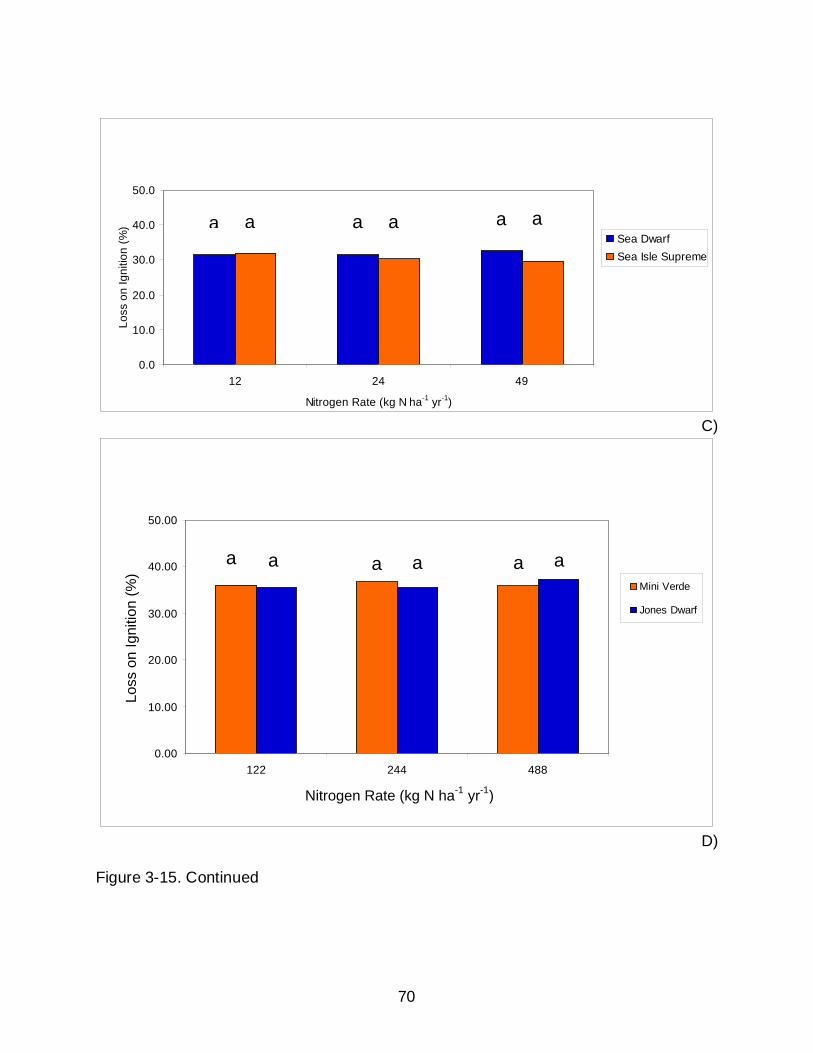
70
C)
D) Figure 3-15. Continued
0.00
10.00
20.00
30.00
40.00
50.00
122 244 488
Nitrogen Rate (kg N ha-1 yr-1)
Loss
on
Igni
tion
(%)
Mini Verde
Jones Dwarf
a a a a a a
0.0
10.0
20.0
30.0
40.0
50.0
12 24 49
Nitrogen Rate (kg N ha-1 yr-1)
Loss
on
Igni
tion
(%)
Sea DwarfSea Isle Supreme
a a a a a a
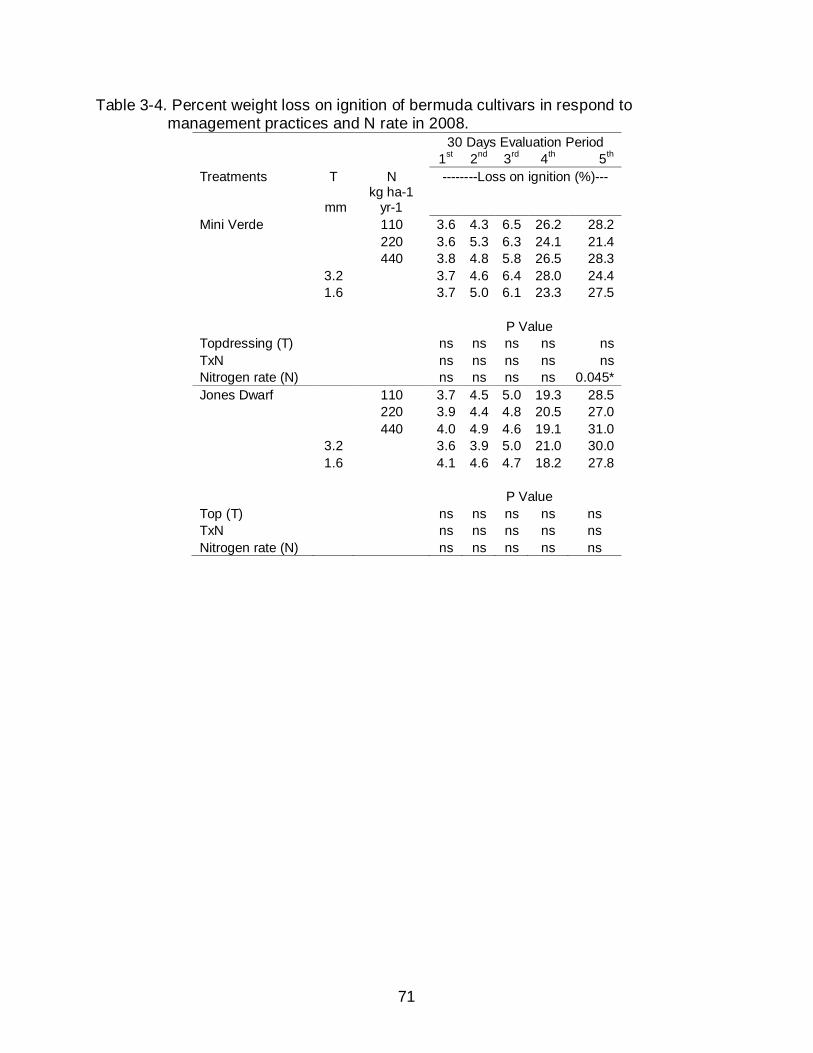
71
Table 3-4. Percent weight loss on ignition of bermuda cultivars in respond to management practices and N rate in 2008.
30 Days Evaluation Period 1st 2nd 3rd 4th 5th Treatments T N --------Loss on ignition (%)---
mm kg ha-1
yr-1 Mini Verde 110 3.6 4.3 6.5 26.2 28.2 220 3.6 5.3 6.3 24.1 21.4 440 3.8 4.8 5.8 26.5 28.3 3.2 3.7 4.6 6.4 28.0 24.4 1.6 3.7 5.0 6.1 23.3 27.5 P Value Topdressing (T) ns ns ns ns ns TxN ns ns ns ns ns Nitrogen rate (N) ns ns ns ns 0.045* Jones Dwarf 110 3.7 4.5 5.0 19.3 28.5 220 3.9 4.4 4.8 20.5 27.0 440 4.0 4.9 4.6 19.1 31.0 3.2 3.6 3.9 5.0 21.0 30.0 1.6 4.1 4.6 4.7 18.2 27.8 P Value Top (T) ns ns ns ns ns TxN ns ns ns ns ns Nitrogen rate (N) ns ns ns ns ns
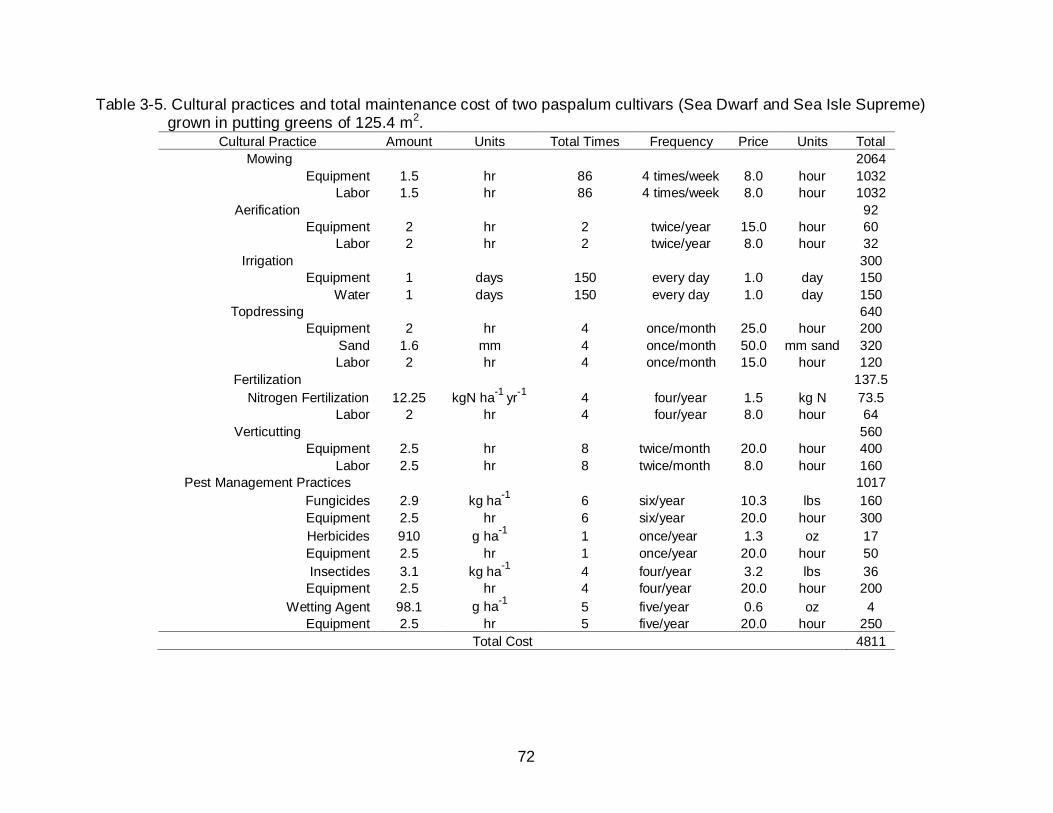
72
Table 3-5. Cultural practices and total maintenance cost of two paspalum cultivars (Sea Dwarf and Sea Isle Supreme) grown in putting greens of 125.4 m2.
Cultural Practice Amount Units Total Times Frequency Price Units Total Mowing 2064
Equipment 1.5 hr 86 4 times/week 8.0 hour 1032 Labor 1.5 hr 86 4 times/week 8.0 hour 1032
Aerification 92 Equipment 2 hr 2 twice/year 15.0 hour 60
Labor 2 hr 2 twice/year 8.0 hour 32 Irrigation 300
Equipment 1 days 150 every day 1.0 day 150 Water 1 days 150 every day 1.0 day 150
Topdressing 640 Equipment 2 hr 4 once/month 25.0 hour 200
Sand 1.6 mm 4 once/month 50.0 mm sand 320 Labor 2 hr 4 once/month 15.0 hour 120
Fertilization 137.5 Nitrogen Fertilization 12.25 kgN ha-1 yr-1 4 four/year 1.5 kg N 73.5
Labor 2 hr 4 four/year 8.0 hour 64 Verticutting 560
Equipment 2.5 hr 8 twice/month 20.0 hour 400 Labor 2.5 hr 8 twice/month 8.0 hour 160
Pest Management Practices 1017 Fungicides 2.9 kg ha-1 6 six/year 10.3 lbs 160 Equipment 2.5 hr 6 six/year 20.0 hour 300 Herbicides 910 g ha-1 1 once/year 1.3 oz 17 Equipment 2.5 hr 1 once/year 20.0 hour 50 Insectides 3.1 kg ha-1 4 four/year 3.2 lbs 36
Equipment 2.5 hr 4 four/year 20.0 hour 200 Wetting Agent 98.1 g ha-1 5 five/year 0.6 oz 4
Equipment 2.5 hr 5 five/year 20.0 hour 250 Total Cost 4811
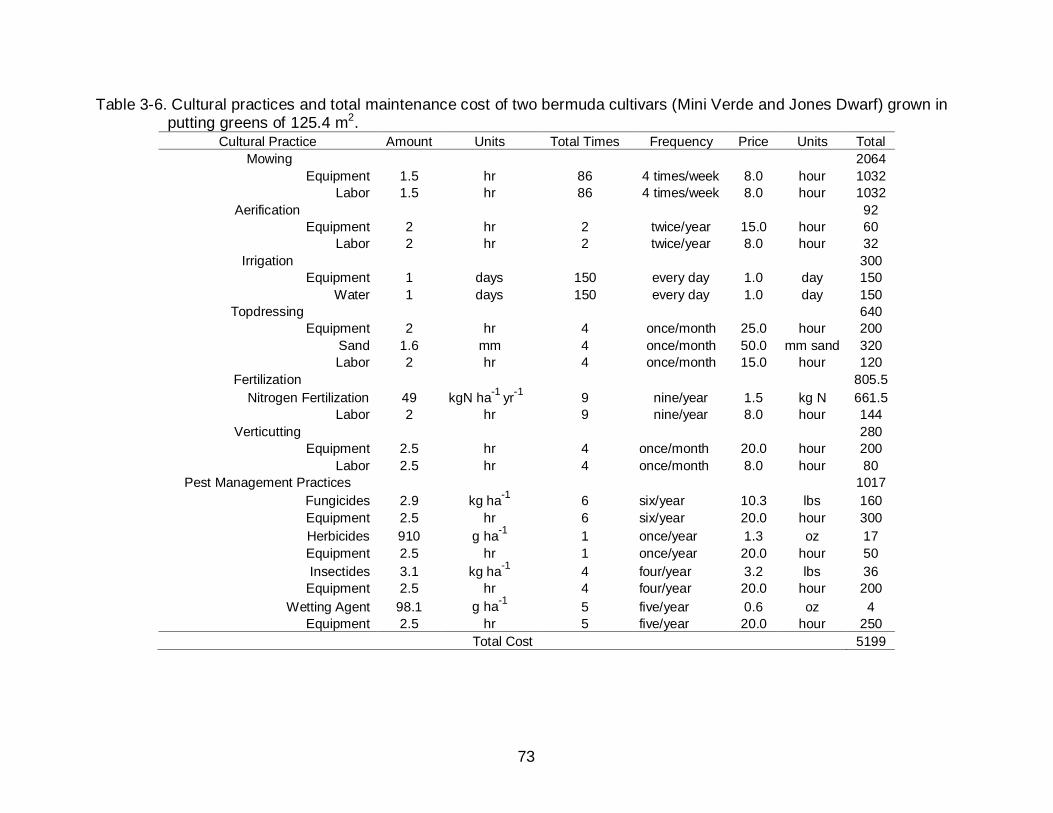
73
Table 3-6. Cultural practices and total maintenance cost of two bermuda cultivars (Mini Verde and Jones Dwarf) grown in putting greens of 125.4 m2.
Cultural Practice Amount Units Total Times Frequency Price Units Total Mowing 2064
Equipment 1.5 hr 86 4 times/week 8.0 hour 1032 Labor 1.5 hr 86 4 times/week 8.0 hour 1032
Aerification 92 Equipment 2 hr 2 twice/year 15.0 hour 60
Labor 2 hr 2 twice/year 8.0 hour 32 Irrigation 300
Equipment 1 days 150 every day 1.0 day 150 Water 1 days 150 every day 1.0 day 150
Topdressing 640 Equipment 2 hr 4 once/month 25.0 hour 200
Sand 1.6 mm 4 once/month 50.0 mm sand 320 Labor 2 hr 4 once/month 15.0 hour 120
Fertilization 805.5 Nitrogen Fertilization 49 kgN ha-1 yr-1 9 nine/year 1.5 kg N 661.5
Labor 2 hr 9 nine/year 8.0 hour 144 Verticutting 280
Equipment 2.5 hr 4 once/month 20.0 hour 200 Labor 2.5 hr 4 once/month 8.0 hour 80
Pest Management Practices 1017 Fungicides 2.9 kg ha-1 6 six/year 10.3 lbs 160 Equipment 2.5 hr 6 six/year 20.0 hour 300 Herbicides 910 g ha-1 1 once/year 1.3 oz 17 Equipment 2.5 hr 1 once/year 20.0 hour 50 Insectides 3.1 kg ha-1 4 four/year 3.2 lbs 36
Equipment 2.5 hr 4 four/year 20.0 hour 200 Wetting Agent 98.1 g ha-1 5 five/year 0.6 oz 4
Equipment 2.5 hr 5 five/year 20.0 hour 250 Total Cost 5199
74
REFERENCES
Beard, J. B., and S. Sifers. 1996. Bermudagrass breakthrough: New cultivars for Southern putting greens. Golf Course Mgt. 64(12):58-62.
Beard, J.B., S.I. Sifers, and M.H. Hall. 1991. Cutting height and nitrogen fertility requirements of Adalayd seashore paspalum (Paspalum varginatum): 1988-1989. P. 107-109. In Texas tufgrass research-1991, Publ. PR-4921. Texas Agric. Exp. Stn., College Station.
Broadbent, F.E. and A.B. Carlton, 1978. Field trials with isotopically labeled nitrogen fertilizer. P.1-41. In D.R. Nielsen and J.G. MacDonald (eds.) Nitrogen in the environment. Vol. 1. Nitrogen behavior in field soil. Academic Press, New York.
Brosnan JT, and Deputy J. 2008. Seashore Paspalum. Honolulu (HI): University of Hawaii. Turf Management 8 p.
Burton, G.W. 1966. Tifdwarf bermudagrass. Crop Sci. 6:94.
Christians, N. E. 2007. Fundamentals of Turfgrass Management. Third Edition. Hoboken, NJ. 397 p.
Christians, N.E. 1998. Fundamental of Turfgrass Management. Ann Arbor Press, Ann Arbor, MI 310p.
Cowan, T. 2001. Going low with ultrdwarfs bermudagrass putting greens. USGA Green Section Rec. 39(6):14-16.
Doberman, A., R. Ferguson, G. Hergert, C. Shapiro, D. Tarkalon, D.T. Walters, and C. Wortmann. 2006. Nitrogen response in high-yielding corn systems of Nebraska. p. 50-59. In Proc. Great Plains Soil Fertility Conf. Denver, CO. 7-8 March 2006. Vol.11. Potash & Phosphate Inst., Brookings, SD.
Dudeck, A.E., and C.L. Murdoch. 1998. Registration of ‘Floradwarf’ bermudagrass. Crop Sci. 38:538.
Duncan, R.R. and R.N. Carrow. 2000. Soon on golf courses: New seashore paspalums. Golf Course Mgt. 68(5):65-67.
Duncan, R.R., R.N. Carrow, and M. Huck. 2000. Seashore paspalum: The environmental turf grass. USGA Green Section Rec. 38(1):11-17.
Environmental Turf. 2009. Enviromentally Friendly Grasses. Retrieved May 22, 2009 from http://www.environmentalturf.com/index.html
Guertal, E.A., D.L. Evans. 2006. Nitrogen rate and mowing height effects on Tifeagle bemudagrass establishment. Crop Sci.46:1772-1778
75
Hanna, W.W., and J.E. Elsner. 1999. Registration of ‘TifEagle’ bermudagrass. Crop Sci. 39:1258.
Hanson, A. A., F.V. Juska, and G. W. Burton. 1969. Species and varieties. In A. A. Hanson and F .V. Juska (eds), Turfgrass Science, Agronomy 14: 370-409, Madison, WI.
Haydu, J. and Hodges, A. 2002. Economic Dimensions of the Florida Golf Course Industry. University of Florida, IFAS Extension EDIS, Publication #FE344. Retrieved May 22, 2009. from http://edis.ifas.ufl.edu/FE344
Hein, M. A. 1961. [Cynodon dactylon (L.) Pers.] Registration of varieties and strains of bermudagrass, III. Agron. J. 53:276.
Henry, M.J., V.A. Gibeault, V.B. Youngner, and S. Spaulding. 1979. Paspalum varginatum ‘Adalayd’ and ‘Futurf’. Calif. Turf grass Culture 29(2):9-12.
Hollingsworth, B.S., E.A. Guertal, and R.H. Walker. 2005. Cultural management and nitrogen sources effects on ultradwarf bermudagrass cultivars. Crop Sci. 45:486-493.
Kopec, D.M., L. J. Walworth, J.J. Gilbert, G.M. Sower, and M. Pessarakli. 2007. ‘Sea Isle Supreme 2000’ paspalum putting surface response to mowing height and nitrogen fertilizer. Agron. J. 99:133-140.
Krans, J.V., H.W. Philley. J.M. Goatley, Jr., and V.L. Maddox. 1999. Registration of ‘MS Supreme’ bermudagrass. Crop. Sci. 39:287.
Kruse, J., and J.B. Sartain. 2001. Evaluation of integrated turfgrass management practices for selected ultradwarf bermudagrasses. Master of Science Thesis. University of Florida, Gainesville FL 53p.
Legg, J.O., and J.J. Meisinger. 1982. Soil nitrogen budgets. p. 503-566. In F.J. Stevenson et al. (ed.) Nitrogen in agricultural soils. Agron. Monogr. 22. ASA, Madison, WI.
Mc Carty, L.B. 2001. Best Golf Courses Managements Practices Hall, Inc., Upper Saddle River, New Jersey.
McCarty and Miller, 2002. Designing, Constructing and Maintaining Bermudagrass Sport Fields Second Edition. Clemson, SC 100 p.
McCarty, L.B., M.F. Gregg and J.E. Toler. 2007. Thatch and mat management in a established creeping bentgrass golf green. Agro J. 99:1530-1537.
Meisinger, J.J., J.S. Schepers, W.R. Raun. 2008. Crop nitrogen requirement and fertilization. In JS Schepers et al. (ed.) Nitrogen in agricultural systems. Agron. Monogr. 49. ASA, Madison, WI.
76
National Golf Foundation. 2008. Research FAQ's. Retrieved May 22, 2009 from http://www.ngf.org/cgi/faqa.asp
O’Brien, P and Hartwiger, C. 2003. Aeration and topdressing for the 21st century
Oatis,D. 1990. It’s time to put the green back in green speed. USGA Green Section Record. (6): 1-6p Retrieved June 25, 2009 from http://www.usga.org/course_care/articles/management/greens/It-s-Time-We-Put-the-Green-Back-in-Green-Speed/
Phillip Jennings Turf farms. 2009. Sea Isle Supreme 2000 Paspalum. Retrieved May 22, 2009 from http://www.sodfather.com/turf-grass/seaisle-2000-paspalum.asp
Power, J.F., and J.S. Schepers. 1989. Nitrate contamination of groundwater in North America. Agri. Ecosyst. Environ. 26:165-187.
Salaiz, T.A., G. L. Horst and R.C. Sherman. 1995. Mowing height and vertical mowing frequency effects on putting green quality. Crop Sci. 35:1422-1425.
Sartain, J.B. 1985. Effect of acidity and N sources on the growth and thatch accumulation of Tifgreen bermudagrass and on soil nutrient retention Agron. J. 77:33-36.
Sartain, J.B., and B.G. Volk. 1984. Influence of selected white-rot fungi and topdressings on the composition of thatch components of four turfgrasses. Agron J. 76:359-362.
SAS Institute Inc. 1999. SAS/ETS user's guide, Version 8. SAS Institute Inc. Cary, NC.
Schlegel, A.J., K.C. Dhuyvetter, and J.L. Havlin. 1996. Economic and environmental impacts of long-term nitrogen and phosphorus fertilization. J. Prod. Agric. 9:114-118.
Smiley, R.W., and M.M. Craven. 1978. Fungicides in Kentucky bluegrass turf: Effects on thatch and pH. Agron. J. 70:1013-1019.
Snyder, G.H., and J.L. Cisar. 2000. Nitrogen/potassium fertilization ratios for bermudagrass turf. Crop Sci. 40: 1719-1723.
Stanford, R. H., R.H. White, J.P. Krausz, J.C. Thomas, P. Colbaugh, and S.D. Abernathy. 2005. Temperature, nitrogen and light effects on hybrid bermudagrass growth and development. Crop. Sci. 45:2491-2496.
Taliaferro , C. M. 1995. Diversity and vulnerability of Bermuda turfgrass species. Crop Sci. 35:327-332.
77
Taliaferro, C. M. and P. McMaugh. 1993. Developments in warm-season tufgrass breeding/genetics. IN R.N. Carrow, N.E. Christians, and R.C. Sherman (eds.), Internat. Turfgrass Soc. Res. J. 7. Intertec Publishing Corp., Overland Parks, KS, pp. 14-25.
Trenholm, L.E., A.E. Dudeck, J.B. Sartain, and J.L. Cisar. 1998. Bermudagrass growth, total nonstructural carbohydrate concentration, and quality as influenced by nitrogen and potassium. Crop Sci. 38:168-174
Trenholm, L. E. 2000. Seashore Paspalum for Florida Lawns. University of Florida, IFAS Extension EDIS, Publication #CIR1244. Retrieved May 22, 2009. from http://edis.ifas.ufl.edu/CIR1244
Trenholm, L.E., R.N. Carrow, and R.R. Duncan. 2001. Wear tolerance, growth, and quality of seashore paspalum in response to nitrogen and potassium. HortScience 36:780-783.
U.S. Golf Association. 2000. Stimpmeter instruction booklet. U.S. Golf Assoc., Far Hills, NJ.
United States Golf Association Green Section Staff. USGA Green Section. Retrieved Jul 15, 2009. from: http://www.usga.org/Content.aspx?id=25982
Vanotti, M.B. and L.G. Bundy, 1994. An alternative rationale for corn nitrogen fertilizer recommendation. J Prod. Agric. 7:243-249.
78
BIOGRAPHICAL SKETCH
Ivan Mauricio Vargas Altamirano was born in Perez Zeledon, San Jose Costa
Rica, in 1985. He grew up next to his family’s animal production farm and coffee
operation in the General Valley of the South Pacific of Costa Rica. After graduating from
EARTH University with a “Licenciatura” degree as an Agronomic Engineer in 2006, Ivan
soon moved to Gainesville, Florida, where he was admitted to the University of Florida
to pursue a Master of Science degree in the Soil and Water Science Department with a
specialization in soil fertility and turfgrass science. He received his Master of Science
from University of Florida in the spring of 2010. Upon graduation in May 2010, Ivan
plans to begin studying towards a Master in Business Administration (MBA) so that he
may pursue a business/research career that involves collaboration between Latin
America and the USA.