Embed Size (px)
Citation preview
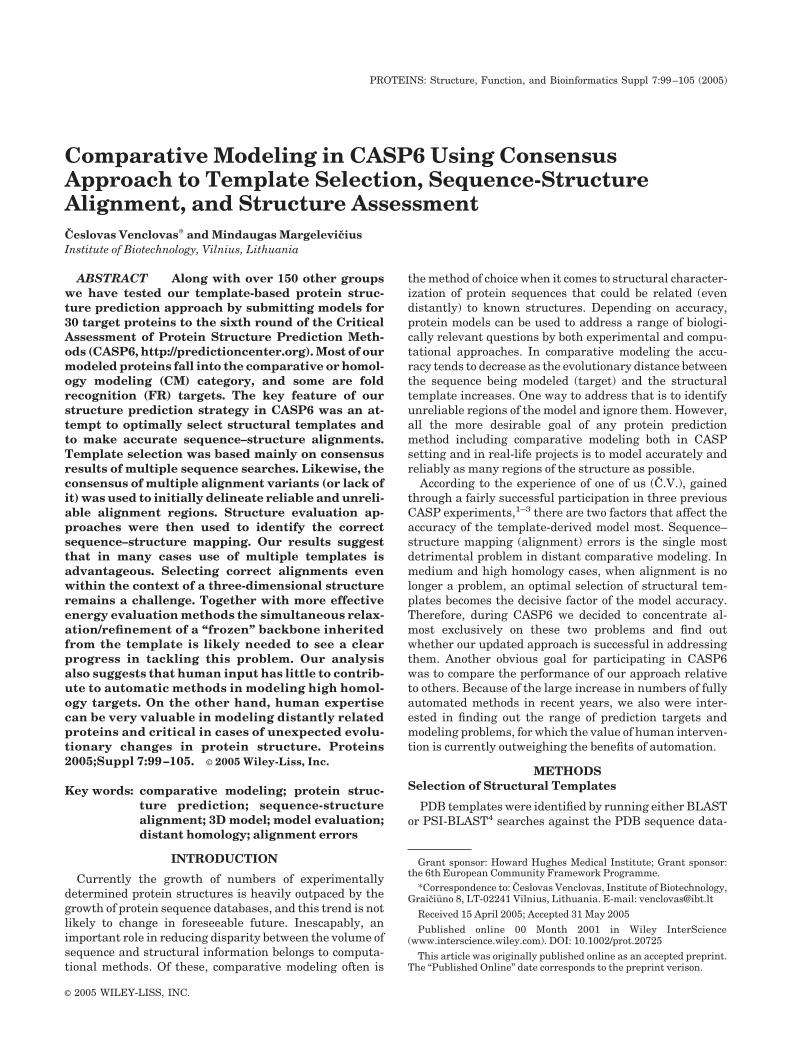
Comparative Modeling in CASP6 Using ConsensusApproach to Template Selection, Sequence-StructureAlignment, and Structure AssessmentCeslovas Venclovas* and Mindaugas MargeleviciusInstitute of Biotechnology, Vilnius, Lithuania
ABSTRACT Along with over 150 other groupswe have tested our template-based protein struc-ture prediction approach by submitting models for30 target proteins to the sixth round of the CriticalAssessment of Protein Structure Prediction Meth-ods (CASP6, http://predictioncenter.org). Most of ourmodeled proteins fall into the comparative or homol-ogy modeling (CM) category, and some are foldrecognition (FR) targets. The key feature of ourstructure prediction strategy in CASP6 was an at-tempt to optimally select structural templates andto make accurate sequence–structure alignments.Template selection was based mainly on consensusresults of multiple sequence searches. Likewise, theconsensus of multiple alignment variants (or lack ofit) was used to initially delineate reliable and unreli-able alignment regions. Structure evaluation ap-proaches were then used to identify the correctsequence–structure mapping. Our results suggestthat in many cases use of multiple templates isadvantageous. Selecting correct alignments evenwithin the context of a three-dimensional structureremains a challenge. Together with more effectiveenergy evaluation methods the simultaneous relax-ation/refinement of a “frozen” backbone inheritedfrom the template is likely needed to see a clearprogress in tackling this problem. Our analysisalso suggests that human input has little to contrib-ute to automatic methods in modeling high homol-ogy targets. On the other hand, human expertisecan be very valuable in modeling distantly relatedproteins and critical in cases of unexpected evolu-tionary changes in protein structure. Proteins2005;Suppl 7:99–105. © 2005 Wiley-Liss, Inc.
Key words: comparative modeling; protein struc-ture prediction; sequence-structurealignment; 3D model; model evaluation;distant homology; alignment errors
INTRODUCTION
Currently the growth of numbers of experimentallydetermined protein structures is heavily outpaced by thegrowth of protein sequence databases, and this trend is notlikely to change in foreseeable future. Inescapably, animportant role in reducing disparity between the volume ofsequence and structural information belongs to computa-tional methods. Of these, comparative modeling often is
the method of choice when it comes to structural character-ization of protein sequences that could be related (evendistantly) to known structures. Depending on accuracy,protein models can be used to address a range of biologi-cally relevant questions by both experimental and compu-tational approaches. In comparative modeling the accu-racy tends to decrease as the evolutionary distance betweenthe sequence being modeled (target) and the structuraltemplate increases. One way to address that is to identifyunreliable regions of the model and ignore them. However,all the more desirable goal of any protein predictionmethod including comparative modeling both in CASPsetting and in real-life projects is to model accurately andreliably as many regions of the structure as possible.
According to the experience of one of us (C.V.), gainedthrough a fairly successful participation in three previousCASP experiments,1–3 there are two factors that affect theaccuracy of the template-derived model most. Sequence–structure mapping (alignment) errors is the single mostdetrimental problem in distant comparative modeling. Inmedium and high homology cases, when alignment is nolonger a problem, an optimal selection of structural tem-plates becomes the decisive factor of the model accuracy.Therefore, during CASP6 we decided to concentrate al-most exclusively on these two problems and find outwhether our updated approach is successful in addressingthem. Another obvious goal for participating in CASP6was to compare the performance of our approach relativeto others. Because of the large increase in numbers of fullyautomated methods in recent years, we also were inter-ested in finding out the range of prediction targets andmodeling problems, for which the value of human interven-tion is currently outweighing the benefits of automation.
METHODSSelection of Structural Templates
PDB templates were identified by running either BLASTor PSI-BLAST4 searches against the PDB sequence data-
Grant sponsor: Howard Hughes Medical Institute; Grant sponsor:the 6th European Community Framework Programme.
*Correspondence to: Ceslovas Venclovas, Institute of Biotechnology,Graiciu� no 8, LT-02241 Vilnius, Lithuania. E-mail: [email protected]
Received 15 April 2005; Accepted 31 May 2005
Published online 00 Month 2001 in Wiley InterScience(www.interscience.wiley.com). DOI: 10.1002/prot.20725
This article was originally published online as an accepted preprint.The “Published Online” date corresponds to the preprint verison.
PROTEINS: Structure, Function, and Bioinformatics Suppl 7:99–105 (2005)
© 2005 WILEY-LISS, INC.
base or nonredundant NCBI sequence database, respec-tively. If no significant matches to PDB entries weredetected then consensus results reported by 3D-Jury5 athttp://bioinfo.pl/ and the GeneSilico fold recognition meta-server (http://genesilico.pl/meta)6 were consulted. In thosecases we only modeled targets, for which fold assignmentwas made with high certainty. We used multiple templateswhenever they were available unless one of the templateswas expected to be significantly closer to the target struc-ture than the others. Selection of the structural templateswas usually based on the consensus results obtained withsequence searches. Templates detected most frequentlyduring multiple PSI-BLAST searches initiated with targethomologs were considered to be better representatives ofthe target structure and therefore stronger candidates tobe selected.
Sequence–Structure Alignments
For high homology targets, where structural template(s)were among closely related sequences, alignments werederived directly from BLAST or PSI-BLAST results.Manual adjustments guided by template structures weresometimes introduced only to better position insertions/deletions. For distant homology targets, two methods wereused to generate and make preliminary assessment of thealignment confidence in a region-specific manner. In thefirst method, results of an initial PSI-BLAST search wereused in our intermediate sequence search procedure (PSI-BLAST-ISS).2 In this procedure, a set of sequences thatbridge sequence space between the target sequence andtemplate(s) are used to initiate additional PSI-BLASTsearches against the nonredundant sequence database.Target–template sequence alignments are then extractedfrom search results and their consistency is analyzed. Forregions where one dominant alignment variant is pro-duced, the alignment is considered reliable, while theregions where the consistency of target–template align-ment is lacking are deemed unreliable. In the secondmethod, publicly available 3D models for a particulartarget that were submitted to CASP6 by automatic serverswere each superimposed with one of the templates usingDaliLite.7 Next, the structure-based multiple sequencealignment between the template and model sequences wasconstructed from obtained pairwise superpositions. Theregion-specific alignment reliability was then assessed asin the first method. Results by both methods were con-trasted and consensus regions were considered to bereliably aligned. For the remaining regions alternativealignment variants were evaluated at the level of 3Dmodels. Models based on these alternative alignmentswere assessed by several methods including ProsaII8
profiles and Z-scores, Verify3D profiles,9 and visual inspec-tion. Verify3D was a new addition in CASP6 in hopes tomake assessment of models even more rigorous than inearlier CASPs. We have used ProsaII Z-scores as a mainnumerical criterion for ranking models based on alterna-tive alignments and alternative placement of insertions/deletions. We also used ProsaII Z-scores to estimate thequality of our models relative to CASP6 server models. The
targeted goal was to produce a model that according to theProsaII Z-score would fare better than any server-generated model.
Construction of Models
Three-dimensional models both for initial evaluationpurposes and for submission were generated from givensequence–structure alignments automatically with MOD-ELLER.10 In most cases side chains were rebuilt withSCWRL.11 Manual intervention was kept to a minimumand no energy minimization procedures were used.
RESULTS AND DISCUSSION
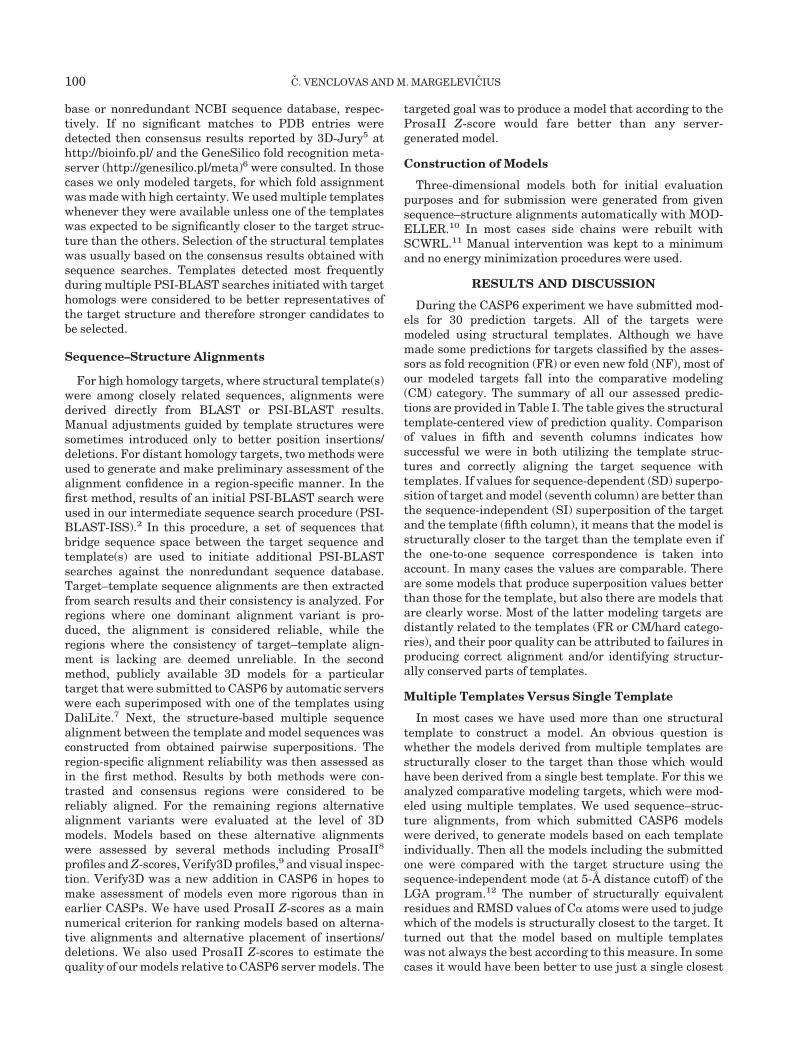
During the CASP6 experiment we have submitted mod-els for 30 prediction targets. All of the targets weremodeled using structural templates. Although we havemade some predictions for targets classified by the asses-sors as fold recognition (FR) or even new fold (NF), most ofour modeled targets fall into the comparative modeling(CM) category. The summary of all our assessed predic-tions are provided in Table I. The table gives the structuraltemplate-centered view of prediction quality. Comparisonof values in fifth and seventh columns indicates howsuccessful we were in both utilizing the template struc-tures and correctly aligning the target sequence withtemplates. If values for sequence-dependent (SD) superpo-sition of target and model (seventh column) are better thanthe sequence-independent (SI) superposition of the targetand the template (fifth column), it means that the model isstructurally closer to the target than the template even ifthe one-to-one sequence correspondence is taken intoaccount. In many cases the values are comparable. Thereare some models that produce superposition values betterthan those for the template, but also there are models thatare clearly worse. Most of the latter modeling targets aredistantly related to the templates (FR or CM/hard catego-ries), and their poor quality can be attributed to failures inproducing correct alignment and/or identifying structur-ally conserved parts of templates.
Multiple Templates Versus Single Template
In most cases we have used more than one structuraltemplate to construct a model. An obvious question iswhether the models derived from multiple templates arestructurally closer to the target than those which wouldhave been derived from a single best template. For this weanalyzed comparative modeling targets, which were mod-eled using multiple templates. We used sequence–struc-ture alignments, from which submitted CASP6 modelswere derived, to generate models based on each templateindividually. Then all the models including the submittedone were compared with the target structure using thesequence-independent mode (at 5-Å distance cutoff) of theLGA program.12 The number of structurally equivalentresidues and RMSD values of C� atoms were used to judgewhich of the models is structurally closest to the target. Itturned out that the model based on multiple templateswas not always the best according to this measure. In somecases it would have been better to use just a single closest
100 C. VENCLOVAS AND M. MARGELEVICIUS
template. The impact of multiple templates on modelquality relative to other predictor groups could be seenmost clearly for medium/high homology (CM/easy) targets.For example, models for T0235, T0274, T0275, and T0282,where a combination of templates led to improvement overany individual template used, all appear among top fivemodels according to the GDT_TS score. In contrast, ourmodel for T0229, for which a single template, would havebeen a better choice, although it has a correct alignmentfare much worse in comparison to many other groups.Thus, our results suggest that it would be too simplistic toclaim that using multiple templates rather than a singleone is always better. It depends on a particular modelingcase. However, given the difficulty of identifying the best
template beforehand, the use of multiple templates offersan increased chance that at least one of the selectedtemplates is among the best.
Sequence–Structure Alignments
Sequence–structure alignments were one of our majorpriorities, and we were able to correctly align manydifficult regions where most of predictor groups failed.Good examples are targets T0208 and T0211, which arediscussed in detail below. Conversely, the majority of ouralignment errors were made in regions where usually lessthan 10–15% of predictor groups were correct. An encour-aging observation is that essentially all of alignmenterrors that appear in structurally conserved regions of our
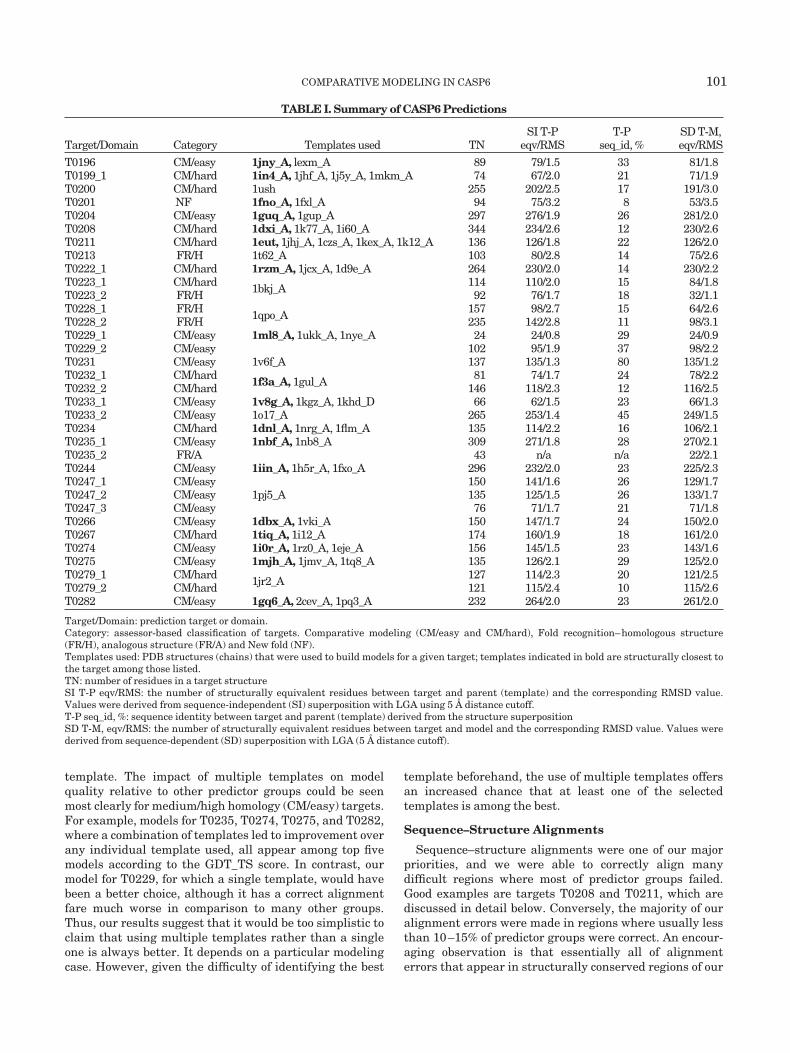
TABLE I. Summary of CASP6 Predictions
Target/Domain Category Templates used TNSI T-P
eqv/RMST-P
seq_id, %SD T-M,eqv/RMS
T0196 CM/easy 1jny_A, lexm_A 89 79/1.5 33 81/1.8T0199_1 CM/hard 1in4_A, 1jhf_A, 1j5y_A, 1mkm_A 74 67/2.0 21 71/1.9T0200 CM/hard 1ush 255 202/2.5 17 191/3.0T0201 NF 1fno_A, 1fxl_A 94 75/3.2 8 53/3.5T0204 CM/easy 1guq_A, 1gup_A 297 276/1.9 26 281/2.0T0208 CM/hard 1dxi_A, 1k77_A, 1i60_A 344 234/2.6 12 230/2.6T0211 CM/hard 1eut, 1jhj_A, 1czs_A, 1kex_A, 1k12_A 136 126/1.8 22 126/2.0T0213 FR/H 1t62_A 103 80/2.8 14 75/2.6T0222_1 CM/hard 1rzm_A, 1jcx_A, 1d9e_A 264 230/2.0 14 230/2.2T0223_1 CM/hard 1bkj_A 114 110/2.0 15 84/1.8T0223_2 FR/H 92 76/1.7 18 32/1.1T0228_1 FR/H 1qpo_A 157 98/2.7 15 64/2.6T0228_2 FR/H 235 142/2.8 11 98/3.1T0229_1 CM/easy 1ml8_A, 1ukk_A, 1nye_A 24 24/0.8 29 24/0.9T0229_2 CM/easy 102 95/1.9 37 98/2.2T0231 CM/easy 1v6f_A 137 135/1.3 80 135/1.2T0232_1 CM/hard 1f3a_A, 1gul_A 81 74/1.7 24 78/2.2T0232_2 CM/hard 146 118/2.3 12 116/2.5T0233_1 CM/easy 1v8g_A, 1kgz_A, 1khd_D 66 62/1.5 23 66/1.3T0233_2 CM/easy 1o17_A 265 253/1.4 45 249/1.5T0234 CM/hard 1dnl_A, 1nrg_A, 1flm_A 135 114/2.2 16 106/2.1T0235_1 CM/easy 1nbf_A, 1nb8_A 309 271/1.8 28 270/2.1T0235_2 FR/A 43 n/a n/a 22/2.1T0244 CM/easy 1iin_A, 1h5r_A, 1fxo_A 296 232/2.0 23 225/2.3T0247_1 CM/easy
1pj5_A150 141/1.6 26 129/1.7
T0247_2 CM/easy 135 125/1.5 26 133/1.7T0247_3 CM/easy 76 71/1.7 21 71/1.8T0266 CM/easy 1dbx_A, 1vki_A 150 147/1.7 24 150/2.0T0267 CM/hard 1tiq_A, 1i12_A 174 160/1.9 18 161/2.0T0274 CM/easy 1i0r_A, 1rz0_A, 1eje_A 156 145/1.5 23 143/1.6T0275 CM/easy 1mjh_A, 1jmv_A, 1tq8_A 135 126/2.1 29 125/2.0T0279_1 CM/hard 1jr2_A 127 114/2.3 20 121/2.5T0279_2 CM/hard 121 115/2.4 10 115/2.6T0282 CM/easy 1gq6_A, 2cev_A, 1pq3_A 232 264/2.0 23 261/2.0
Target/Domain: prediction target or domain.Category: assessor-based classification of targets. Comparative modeling (CM/easy and CM/hard), Fold recognition–homologous structure(FR/H), analogous structure (FR/A) and New fold (NF).Templates used: PDB structures (chains) that were used to build models for a given target; templates indicated in bold are structurally closest tothe target among those listed.TN: number of residues in a target structureSI T-P eqv/RMS: the number of structurally equivalent residues between target and parent (template) and the corresponding RMSD value.Values were derived from sequence-independent (SI) superposition with LGA using 5 Å distance cutoff.T-P seq_id, %: sequence identity between target and parent (template) derived from the structure superpositionSD T-M, eqv/RMS: the number of structurally equivalent residues between target and model and the corresponding RMSD value. Values werederived from sequence-dependent (SD) superposition with LGA (5 Å distance cutoff).
COMPARATIVE MODELING IN CASP6 101
models were not unexpected. The exception is T0266, aneasy CM target, where an alignment error was inadver-tently introduced by a human error. Thus, both PSI-BLAST-ISS results and structure-based alignments ofpublic server 3D models were effective in delineatingunreliable alignment regions. However, it is frustrating tosee that a successful detection of problematic regions hasnot always led to a successful identification of the correctsequence–structure mapping. From the experience of ear-lier CASPs it was clear that in many difficult to alignregions sequence pattern matching methods are virtuallyuseless, and that assessment of structures using energy-based approaches might be more promising.2,3 In CASP6,to better discriminate between correct and incorrect align-ments within the context of 3D structure, we addedVerify3D profiles to our usual evaluation procedure thatincludes ProsaII and visual assessment. However, havingseveral methods of evaluating alternative alignments some-times did complicate things, because it was not alwayspossible to reach the consensus. In such cases the selectionof alignment variants had to rely on expert human judg-ment. In the context of overall CASP6 alignment resultswe think that more effective local structure evaluationmethods based on physicochemical properties perhapscomplemented with simultaneous relaxation/refinementof inherited “frozen” backbone are needed.
Manual Modeling Versus Automatic Servers
Because during CASP6 we often used models producedby servers as our self-assessment baseline, it was interest-ing to compare our results with results from automaticmethods. Compared to the best model obtained by any ofthe participating servers our models trail slightly behindin the “CM/easy” category (the average difference inGDT_TS13 is �1.0%). However, in the “CM/hard” category,on average, our models outscore the best server-generatedmodels by 1.2% in GDT_TS. If we consider best modelsfrom all human groups, then humans outperform serversin both categories, but the trend remains similar. The gapbetween humans and servers is two times narrower for“CM/easy” targets (T0240 excluded because of classifica-tion uncertainty) compared to “CM/hard” (the averagedifference of 2.1% and 4.5% in GDT_TS values, respec-tively). This observation suggests that servers are clearlycatching up in performance for proteins that have closerelatives with known structure, but human input stillmakes a difference when it comes to modeling distantlyrelated proteins.
Examples of a Beneficial Human Input (T0208,T0211)
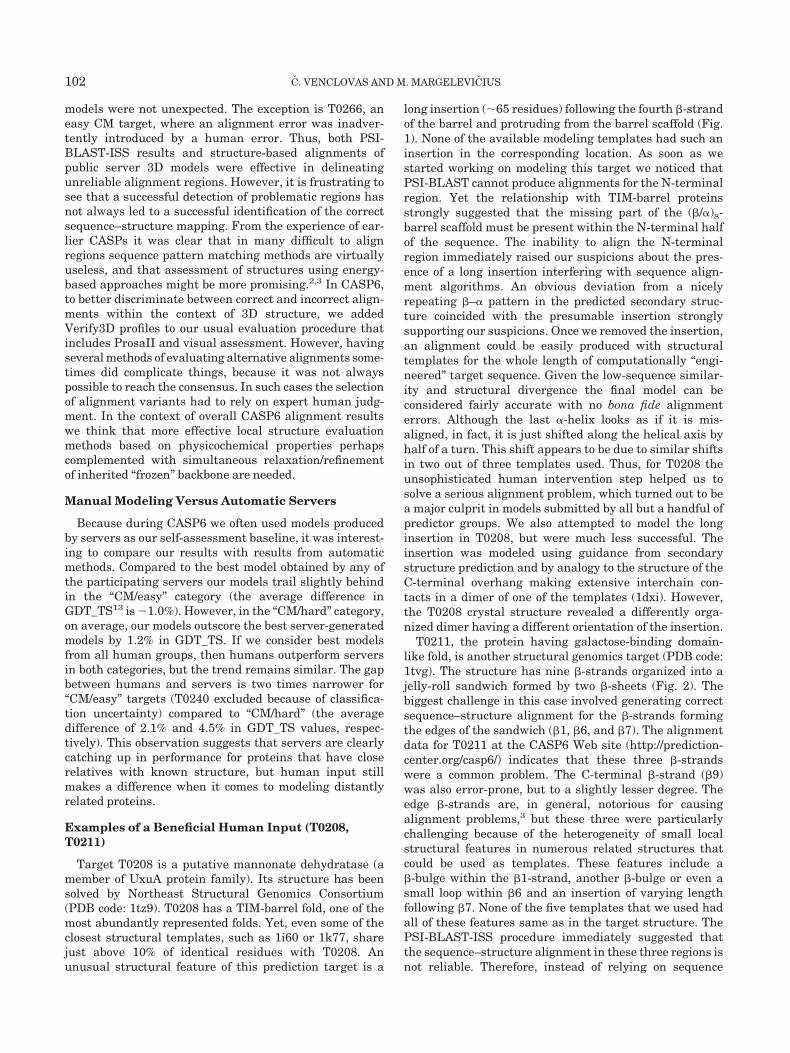
Target T0208 is a putative mannonate dehydratase (amember of UxuA protein family). Its structure has beensolved by Northeast Structural Genomics Consortium(PDB code: 1tz9). T0208 has a TIM-barrel fold, one of themost abundantly represented folds. Yet, even some of theclosest structural templates, such as 1i60 or 1k77, sharejust above 10% of identical residues with T0208. Anunusual structural feature of this prediction target is a
long insertion (�65 residues) following the fourth �-strandof the barrel and protruding from the barrel scaffold (Fig.1). None of the available modeling templates had such aninsertion in the corresponding location. As soon as westarted working on modeling this target we noticed thatPSI-BLAST cannot produce alignments for the N-terminalregion. Yet the relationship with TIM-barrel proteinsstrongly suggested that the missing part of the (�/�)8-barrel scaffold must be present within the N-terminal halfof the sequence. The inability to align the N-terminalregion immediately raised our suspicions about the pres-ence of a long insertion interfering with sequence align-ment algorithms. An obvious deviation from a nicelyrepeating �–� pattern in the predicted secondary struc-ture coincided with the presumable insertion stronglysupporting our suspicions. Once we removed the insertion,an alignment could be easily produced with structuraltemplates for the whole length of computationally “engi-neered” target sequence. Given the low-sequence similar-ity and structural divergence the final model can beconsidered fairly accurate with no bona fide alignmenterrors. Although the last �-helix looks as if it is mis-aligned, in fact, it is just shifted along the helical axis byhalf of a turn. This shift appears to be due to similar shiftsin two out of three templates used. Thus, for T0208 theunsophisticated human intervention step helped us tosolve a serious alignment problem, which turned out to bea major culprit in models submitted by all but a handful ofpredictor groups. We also attempted to model the longinsertion in T0208, but were much less successful. Theinsertion was modeled using guidance from secondarystructure prediction and by analogy to the structure of theC-terminal overhang making extensive interchain con-tacts in a dimer of one of the templates (1dxi). However,the T0208 crystal structure revealed a differently orga-nized dimer having a different orientation of the insertion.
T0211, the protein having galactose-binding domain-like fold, is another structural genomics target (PDB code:1tvg). The structure has nine �-strands organized into ajelly-roll sandwich formed by two �-sheets (Fig. 2). Thebiggest challenge in this case involved generating correctsequence–structure alignment for the �-strands formingthe edges of the sandwich (�1, �6, and �7). The alignmentdata for T0211 at the CASP6 Web site (http://prediction-center.org/casp6/) indicates that these three �-strandswere a common problem. The C-terminal �-strand (�9)was also error-prone, but to a slightly lesser degree. Theedge �-strands are, in general, notorious for causingalignment problems,3 but these three were particularlychallenging because of the heterogeneity of small localstructural features in numerous related structures thatcould be used as templates. These features include a�-bulge within the �1-strand, another �-bulge or even asmall loop within �6 and an insertion of varying lengthfollowing �7. None of the five templates that we used hadall of these features same as in the target structure. ThePSI-BLAST-ISS procedure immediately suggested thatthe sequence–structure alignment in these three regions isnot reliable. Therefore, instead of relying on sequence
102 C. VENCLOVAS AND M. MARGELEVICIUS
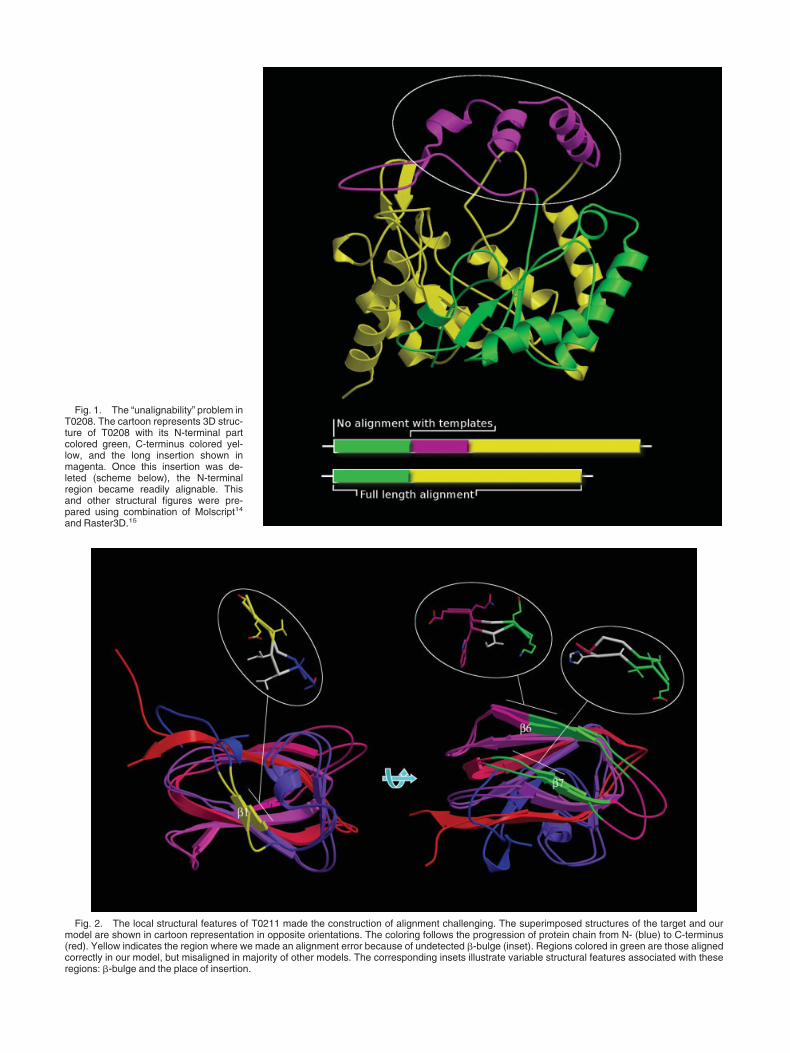
Fig. 1. The “unalignability” problem inT0208. The cartoon represents 3D struc-ture of T0208 with its N-terminal partcolored green, C-terminus colored yel-low, and the long insertion shown inmagenta. Once this insertion was de-leted (scheme below), the N-terminalregion became readily alignable. Thisand other structural figures were pre-pared using combination of Molscript14
and Raster3D.15
Fig. 2. The local structural features of T0211 made the construction of alignment challenging. The superimposed structures of the target and ourmodel are shown in cartoon representation in opposite orientations. The coloring follows the progression of protein chain from N- (blue) to C-terminus(red). Yellow indicates the region where we made an alignment error because of undetected �-bulge (inset). Regions colored in green are those alignedcorrectly in our model, but misaligned in majority of other models. The corresponding insets illustrate variable structural features associated with theseregions: �-bulge and the place of insertion.
methods to supply the correct alignment we assessed anumber of potential alignment variants in the context ofthe 3D structure. Based on consensus energy evaluationusing ProsaII and Verify3D coupled with visual assess-ment we have correctly identified the presence of �-bulgein �6 and selected the correct length of the �7–�8 connec-tor producing correct alignment for �6 and �7. Yet, wefailed to detect the presence of a �-bulge within �1,misaligning its N-terminal part. Surprisingly, even withthat error, the fraction of correctly aligned residues in ourmodel is significantly larger than in any other T0211model. Apparently, the explanation is simple: no othergroup has correctly aligned both �6 and �7.
Example of an Incorrect Hypothesis Leading to aWrong Model (T0223)
T0223 is yet another structural genomics target, aputative nitroreductase (PDB code: 1vkw). This target is agood example for illustrating a potential value of humaninput, because to properly model the complete proteinchain it was necessary to use a dimeric template instead ofa monomer.
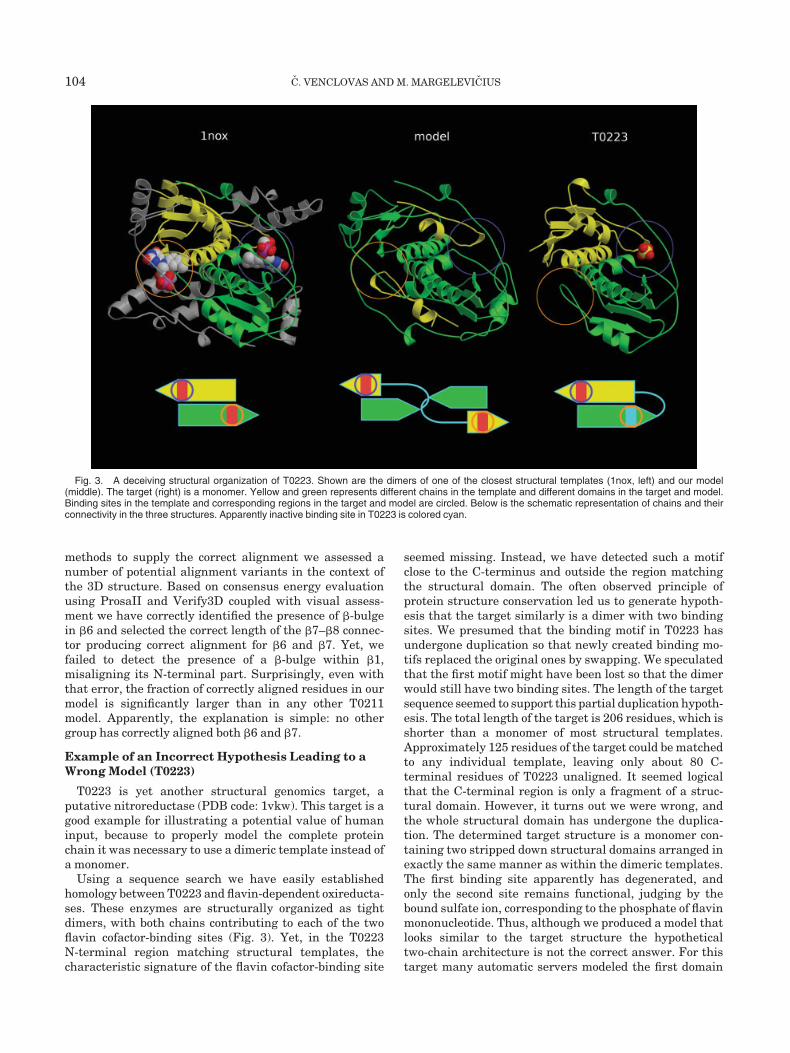
Using a sequence search we have easily establishedhomology between T0223 and flavin-dependent oxireducta-ses. These enzymes are structurally organized as tightdimers, with both chains contributing to each of the twoflavin cofactor-binding sites (Fig. 3). Yet, in the T0223N-terminal region matching structural templates, thecharacteristic signature of the flavin cofactor-binding site
seemed missing. Instead, we have detected such a motifclose to the C-terminus and outside the region matchingthe structural domain. The often observed principle ofprotein structure conservation led us to generate hypoth-esis that the target similarly is a dimer with two bindingsites. We presumed that the binding motif in T0223 hasundergone duplication so that newly created binding mo-tifs replaced the original ones by swapping. We speculatedthat the first motif might have been lost so that the dimerwould still have two binding sites. The length of the targetsequence seemed to support this partial duplication hypoth-esis. The total length of the target is 206 residues, which isshorter than a monomer of most structural templates.Approximately 125 residues of the target could be matchedto any individual template, leaving only about 80 C-terminal residues of T0223 unaligned. It seemed logicalthat the C-terminal region is only a fragment of a struc-tural domain. However, it turns out we were wrong, andthe whole structural domain has undergone the duplica-tion. The determined target structure is a monomer con-taining two stripped down structural domains arranged inexactly the same manner as within the dimeric templates.The first binding site apparently has degenerated, andonly the second site remains functional, judging by thebound sulfate ion, corresponding to the phosphate of flavinmononucleotide. Thus, although we produced a model thatlooks similar to the target structure the hypotheticaltwo-chain architecture is not the correct answer. For thistarget many automatic servers modeled the first domain
Fig. 3. A deceiving structural organization of T0223. Shown are the dimers of one of the closest structural templates (1nox, left) and our model(middle). The target (right) is a monomer. Yellow and green represents different chains in the template and different domains in the target and model.Binding sites in the template and corresponding regions in the target and model are circled. Below is the schematic representation of chains and theirconnectivity in the three structures. Apparently inactive binding site in T0223 is colored cyan.
104 C. VENCLOVAS AND M. MARGELEVICIUS
comparably to human groups. In contrast, none of theautomatic servers produced any reasonable model for thesecond domain. Not many human groups were able tocorrectly infer evolutionary history and produce satisfac-tory models for the whole protein either. However, thosefew who did outperformed servers by a large margin(20–30% GDT_TS). Modeling of this target taught us alesson that human interpretation of the biological datasometimes can be very helpful in modeling, but care shouldbe taken in interpreting the data.
CONCLUSIONS
Our CASP6 results have shown that in template-basedmodeling the use of multiple templates is often beneficial.However, with the increasing number of available tem-plates a simplistic combination of template structures isperhaps not the best way forward. Combining availablestructural information at the level of local template frag-ments may be more effective in increasing the accuracy ofmodels. Yet the ability to select the most accurate struc-ture will require more effective energy-based methods.The same applies to sequence–structure alignments. Ourresults and results of other groups in CASP6 suggest thatin most cases choosing the correct alignment is not aproblem of insufficient sampling of different alignmentvariants. Alignment errors seem to seep in because of aninability to distinguish the correct alignment variant fromthe incorrect one. Along with the development of bettermethods to assess alignments within the context of 3Dstructure it seems important to be able to “defrost” theinherited template backbone. Some of the correct align-ments simply do not look plausible in the context of thetemplate scaffold because of backbone deviation that per-haps could be reduced during simultaneous relaxation/refinement of the local structure. In CASP6, the perfor-mance of automatic methods has increased substantially,and in high homology modeling human input is oftendetrimental. However, in modeling distantly related pro-
teins, especially those having unusual structures, humaninput may be of critical importance.
ACKNOWLEDGMENTS
We thank CASP6 organizers and assessors for theirhard work, and experimentalists for providing their pro-tein structures.
REFERENCES
1. Venclovas C, Ginalski K, Fidelis K. Addressing the issue ofsequence-to-structure alignments in comparative modeling ofCASP3 target proteins. Proteins 1999;Suppl 3:73–80.
2. Venclovas C. Comparative modeling of CASP4 target proteins:combining results of sequence search with three-dimensionalstructure assessment. Proteins 2001;Suppl 5:47–54.
3. Venclovas C. Comparative modeling in CASP5: progress is evi-dent, but alignment errors remain a significant hindrance. Pro-teins 2003;53(Suppl 6):380–388.
4. Altschul SF, Madden TL, Schaffer AA, Zhang J, Zhang Z, MillerW, Lipman DJ. Gapped BLAST and PSI-BLAST: a new generationof protein database search programs. Nucleic Acids Res 1997;25:3389–3402.
5. Ginalski K, Elofsson A, Fischer D, Rychlewski L. 3D-Jury: asimple approach to improve protein structure predictions. Bioinfor-matics 2003;19:1015–1018.
6. Kurowski MA, Bujnicki JM. GeneSilico protein structure predic-tion meta-server. Nucleic Acids Res 2003;31:3305–3307.
7. Holm L, Sander C. Mapping the protein universe. Science 1996;273:595–603.
8. Sippl MJ. Recognition of errors in three-dimensional structures ofproteins. Proteins 1993;17:355–362.
9. Luthy R, Bowie JU, Eisenberg D. Assessment of protein modelswith three-dimensional profiles. Nature 1992;356:83–85.
10. Sali A, Blundell TL. Comparative protein modelling by satisfac-tion of spatial restraints. J Mol Biol 1993;234:779–815.
11. Canutescu AA, Shelenkov AA, Dunbrack RL Jr. A graph-theoryalgorithm for rapid protein side-chain prediction. Protein Sci2003;12:2001–2014.
12. Zemla A. LGA: a method for finding 3D similarities in proteinstructures. Nucleic Acids Res 2003;31:3370–3374.
13. Zemla A, Venclovas C, Moult J, Fidelis K. Processing and analysisof CASP3 protein structure predictions. Proteins 1999;Suppl3:22–29.
14. Kraulis PJ. Molscript—a program to produce both detailed andschematic plots of protein structures. J Appl Crystallogr 1991;24:946–950.
15. Merritt EA, Bacon DJ. Raster3D: photorealistic molecular graph-ics. Methods Enzymol 1997;277:505–524.
COMPARATIVE MODELING IN CASP6 105