Embed Size (px)
Citation preview

Report No. FAA-RD-73-198 .iv
COMPARATIVE PERFORMANCE OF STRUCTURALLAYERS IN PAVEMENT SYSTEMS
VOLUME IV
Analysis Of Insulating Lay,*,s<In Pavement Test Sections
Walter R. Barker and Frazier Parker, Jr.
U. S. Army Engineer Waterways Experiment StationSoils and Pavements Laboratory
P. 0. Box 631, Vicksburg, Miss. 39180
JANUARY 1977FINAL REPORT APR ,
2 Document is available to the public through the ,_ kJ-jL -J-National Technical Information Service, C
, ,Springfield, Va. 22151
Prepared for
DEPARTMENT OF DEFENSE U. S. DEPARTMENT OF TRANSPORTATIONDEPARTMENT OF THE ARMY FEDERAL AVIATION ADMINISTRATIONOffice, Chief of Enineers Systems Research & Development ServiceWashingtoo 0. C. 20314 Washington, 0. C. 20591

NOTICES
This document is disseminated under the sponsorship of the Department ofTransportation in the interest of information exchange. The UnitedStz.tes Government assumes no liability for its contents or use thereof.
The United States Government does not endorse products or manufacturers.Trade or manufacturers' names appear herein solely because they areconsidered essential to the object of this report.

/ /. Technical Repet Dcumentetioe Peg1. Reort Mo. 2. Government Aceos,.n N.. 3. Re""tint, Cteo, N. -
FAA-RD&T3-l98*wVol l- -_,_
S OMPARATIVE PERFORMANCE OF STRUCTURALkAYERS IN Jan 77) __
PAVENT RYS'M4S. OLUME 17. PALYSIS OF 4NSULATING! Permng Orgen lotion CedAYERS IN PAVEMENT TEST SECTIONS. __-__-----__-
... . . . ._~_ __~__I Performing Organisation Report N .
- Technical Report S-74-.8V( Walte R Barker 9 Frazier k Jr Volume IV
".- 9. Performing Orgenimsliin Mie end Address 10 Work Unit No (TRAIS)
U. S. Army Engineer Waterways Exl.eriment Station ___
Soils and Pavements Laboratory AP. 0. Box 631, Vicksburg, Miss. 39180 -- -FA71WAI-218
13 Type of Reprt end Porod Co.ered1?. SpeArtrn9 Agency Neo end AddressOffice, Chief of Engineers, U. S. Army FiWashington, D. C. 20314 and r. _tFederal Aviation Administration R- Sn.,.,,. Agency CodeWashington, D. C. 20591 _.
IS. Svppeonteti Notes
16. Ahs ct.. .
This report describes an analysis of results from tests of pavements contain-ing insulating layers to determine the structural adequacy of pavements containingthe various types of insulating materials and to determine the location of theinsulating layers to ensure adequate structural performance of the pavements. Vol-ume I of this report describes the design, construction, and behavior under trafficof both flexible and rigid prototype airfield pavements containing expanded poly-styrene panels and lightweight concrete containing expanded polystyrene beads as thecoarse aggregate. The results from the traffic tests are analyzed herein to deter-mine why the pavements containing layers of the insulating materials performed asthey did and the proper location within the pavement structure for the insulatinglayers to ensure adequate structural performance. Conclusions from the study indi-cate that the insulating materials behave differently than conventional pavingmaterials. or flexible pavement design, the vertical compressive stresses andhorizontal tensile stresses in the insulating materials should be kept below mea-sured strength values. For rigid pavement design, granular or chemically stabilizedbase or subbase material should be provided between the concrete slab and the insu-lating material, and a base or subbase course should be placed between the poly-styrene panels and subgrade materials susceptible to pumping.
1. Key W d 1. Distribution StoementFlexible pavementRigid pavement Document is available to the publicInsulating materials through the National Technical InformAtionFrost design Service, Springfield, Va. 22151Pavement performanceIt. secirity CI*estf. hlf Ass ,Ir) PO. Seevwrty Cleilf. (o INtS pie") 21. Ne. of Paes 22. Price
Unclassified Unclassified 145
Fera DOT F 1700.7 (6-721 *opooiwttio" of c4pIe id peg evueei d
(gf /--

PREFACE
The investigation reported herein was Jointly sponsored by the
Office, Chief of Engineers, U. S. Army (OCE), as a part of the Military
Construction Short-Range Airfield Pavement Research Program and by the
Federal Aviation Administration (FAA) as a part of 1 iter-Agency Agree-
ment No. DOT FAT1WAI-218, "Development of Airport Pavement Criteria."
OCE technical monitor for this investigation was Mr. A. F. Muller
(DAEN-MCE-D), and the FAA technical representative was Mr. Fred Horn(Q- --43o).
The investigation was conducted during the period March 1972-
August 1973 at the U. S. Army Engineer Waterways Experiment Station (WES)
by personnel of the Soils and Pavements Laboratory (S&PL), under the
general supervision of Measrs. James P. Sale and Richard G. Ahlvin,
Chief and Assistant Chief, respectively, of S&PL. This report was pre-
pared by Dr. Walter R. Barb:er and Dr. Fra,.ier Parker, Jr.
Directors of WES during the conduct of the investigation and the
preparation of this report were BG E. D. Peixotto, CE, COL G. H. Hilt,
CE, and COL J. L. Cannon, CE. Technical Director was Mr. F. R. Brown.
pmp....._.--. - --
IS
Oil'i*L AV41li'L I1 __~g
1

TABLE OF CONT8T
pageI RODUCTION . . . . . . . . . . .. . .. . .. ... .. .. . 5
BAC:KGROUND. . . .. . . . . .. . . . 50BWECTIVES .. . . . . . . . . . . . .5
PROPERTIES OF INSULATING MATERIALS . . . . . . . . . . . . . . . 6
FLEXIBLE PAVO4EXT TEST SECTION. .. ........... .. . 9
CONSTRUCTION . . . .. . . . . . . . . . . . . ...... . 9PROPERTIES OF AS-CONSTRUCTI PAVM4UTS. . . . ........ 10TRAFFIC . ...S.S................... 15AFTER-TRAFFIC INVESTIGATIONS . . . . . .. . . . . . . . . . . 11ANALYSIS OF TkST RSULTS . . .A. . . . . . . . ...... 15
RIGID PAVENT TEST SECTION ................... 24
CONSTRUCTION ........ ... ............ . 24PROPERTIES OF AS-COUISTRUCTED PAV'D(EXTS ....... 25
TFFICLE...........US0~....... ........ 49TFFLPV?4F';RCCN!MIW . . . . . . . . .00 . . 269
AFTER-TRAFFC INVESTIGATIOS . . . . . . . .. . . . . . . . . 32AF ALYSIS OF TEST RESULTS . . . . . . . . . . . . . . . . . . . 3
CONCLUSIONS AND RECO EN. TO. .. ............... . . . . . . . . . 49FLEXIBLE PAVMENTS; COX CLUSTON S .. .. .. .. .. .. . .. 49FLEXI:BLE PAVEENTS; REM0MFOATIOMt ....... 9RIGID PAV¢BEENS; CONCLUSION S . ........ 50RIGID e AVE' 4NTS; RECORaMTIOAIS . ....... 51
TABLES 1-9 . ... ... ...... .. .... .. . ..... 53FIGURES 1-94 . .. .. .. .... . . .. ... 62
PE ERMqCES .. .. .. . . .. .. . . .. .. .. .. .. . .. 141
!3

T. I
-* ii _!
j~ ~ ~ ~ ~~ I UIl"IlI .I---,
iz~~~~~~~~
, ., 0IL
1, t .i , , ,l"s• " ' I ' I - i I I '
Itili
IS S I jII
1. 1- .ol
"*11 ' d l .I .-"i
I S I i ON~~~~4 4p 0g Ai
0 i i
41 iii
toz
fall- Il' sis
j Vi1E~Z i 4

INTRODUCTION
BACKGROUND
One pavement defsign concept used in regions where frost action is
a problem is to place insulating layers in the pavement structure to
prevent the penetration of freezizg temperatures into Zrost-susceptible
materials. Innovations in material utilization have included the use of
prefabricated polystyre.e panels and polystyrene bead concrete as insu-
lating layers.
A significant factor in the design of pavements containing insu-
lating layers is the depth at which the insulating layer should be
placed. To be most effective, the insulating material should be located
as near the surface as possible. The exact location should be con-
trolled by the strength of the material and the structural adequacy of
the resulting pavement system.
Volume I of this report 1 describes the design, construction, and
behavior under traffic of prototype rigid and flexible airfield pavement
test sectio0i, Included in these test sections were test items contain-
ing insulatiAg layers. The insulating layers were placed at various
locations within rigid and flexible pavement structures to evaluate the
struetural performance of the insulating materials and to study the
effects of the location of the insulating layers within the pavement
structures.
--)BJ ECTIVE
The objectives of this report are to analyze the results from
tests of the pavements contf.ining insulating layers, to determine the
structural adequacy of pavements containing various types of insulating
layers, and to determine the location of the insulating layers to ansure
adequate structural performmnce of the pavements.

PROPERTIES O" ISMLATING MATERIALS
Two types of materia"s were used as insulating layers. The first
type was an expanded polyjstyrene panel msnufac.;ured by Dow Chemical Cor-
poration under the trade name of Styrofoam. Three different strevth
aterials vere employed: Styrofoam HD-300, Styrofoam HI, and. S -yro-
foam SM. These have nominal strengths of 120, 60, and 35 psi, respec-
tively. (Note: The Ltrength values are the manufacturer's published
minimum compressive strength measured perpendicular to the panel face at
5 percent strain.) The MD-3K0) material was supplied in 3- by 16- by
108-1n. panels, the HI material in 4- by 24- by 96-in. panels, and the
SM material in 3- by 24- by 48-in. panels. The second type material was
a lightweight concrete manufactured under a patentr ! process held by
BASF Wyandotte Corporation. The coarse qggregate was an expanded poly-
styrene bead. The trade name of the lightweight concrete s Styropor
concrete. The strungth can be increased by decreasing the polystyrene
bead content, b:t the resulting Styropor concrete will be denser and
have poorer insulating qualities. The opposite effect i: achieved bi
incre-3ViY the polystyrene bead content. A discussion of the production
of Sty' ,or concrete ak3ng with various properties of the material can
be foun; in Hohviller and K8hling. 2
0. sportance in the atructural behavior of the lightweight Con-
crete are its strength and load-defirma t ion characteristics. Figure 1
presents the 28-day compressive cute strength as a Punction ol the vmit
,.eight, and Figure 2 presents dyrA;aic modulus (28 day) as a function unit
weight. 2
In the test section, lightweight concrete mixes having unit
weights of 44 and 52 pot vere used. The material generally followed the
trends illustrated in Figp;res 1 and 2; i.e., the 52-pcf material was
stiffer and has a higher ,trength than the 44-pcf material. Table 1
summarizes the results ot coirression and flexural tests performed on
6- by 12-in, cylinders and 6- by 6- by 36-in. beams, respectively. The
beam and cylinders were cast durIng construction according to American
Society for Testing and Materials (ASTM) Designation, C 19 2-69 ,T which
6
is equivalent to Metliod CRD-C 10. The data shown in Table 1 indicate
that the strength and modulus of the lighweight concrete are rather
insensitive to age but hig#ly dependent on density. This is caused by
the overshadowing effects of the polystyrene beads. Eliminating the
tests at ages of 7 and 66 days and averaging those remaining yields, re-
Sspectively, average compressive strengths of 446 and 770 psi, flexural
strengths of 161 and 163 psi, compressive moduli of 0.215 x 10⁶ and
0.301 x 10⁶ psi, and flexural mocALU of 0.452 x 10⁶ and 0.646 x 10⁶ psi
for the concrete mixes with unit weights of 44 and 52 pcf. The strengths
indicated in Figure 1 for the two iifferent lightweight concrete mixes
3re greater than their respective avsured strengths, and the dynamic
moduli indicated in Figure 2 are greater than the measured compressive
moduli but less than the measured flezural moduli. The 52-pcf material
was used in the flexible pavement test secttion and the 44-pcf material
in the rigid pavement.
A limited number of tests were conducted on the insulating mate-
rials to define their load-deformation and strength characteristics.
For the 120- and 60-psi polystyrene panels, unconfined compression and
cyclic unconfined compression (resilient modulus) tests were conducted.
Results of unconfined compression tests are shown in Figure 3. For com-
parison, the results of an unconfined compression test on the 4-CBR clay
(CH) subgrade material are also presented. As can be seen in the fig-
ure, both the 120- and the 60-pei panels met the manufacturer's speci-
fied compressive strength. Although no tests were run, the stress-
strain and strength characteristics of the 35-psi panels were assumed to
be similar to those of the 120- and 60-psi materials. Results from the
cyclic tests are presented in Figure 4. The results from cyclic tests
on the clay are also presented for comparison. It can be seen in Fig-
ure 4 that the resilient modulus of the panels decreases only slightly
with increases in deviator stress. The slight decrease in resilient
moduli of the two panels is in marked contrast to the decrease in
resilient modulus of the clay with increases in deviator stress. At
very low values r,' deviator stress, the modulus of the clay is higher
than that of either of the panels, but at values of subgrade stress
7

which would nornmally be expected in Arport pavement structures (5 to
7 psi), the resilient modulus is about equal to or slightly less than
the modulus for the 60-ysi panel. The static modu.l. computed (at a
strain level of 2 percent) from the data presented in Figure 3 are close
to but below the resilient noduli (for 6-psi deviator stress) for the
120- and 60-psi panels. The static modulus of the clay is much lower
than its resilient modulus. The moduli are 3000 and 4500 psi for the
60-psi panel, 6000 and 6900 psi for the 120-psi panel, and 1200 and
4100 psi for the clay.
Tests similar to laboratory CBR tests were conducted on all three
polystyrene panels located on a firm surface. The load penetration
curves for these tests are shown in Figure 5. For comparison, a range
of load penetration curves for the sbrade soil is presentel. Although
only one curve is presented in Figure 5 for each panel, three tests were
conducted for each; hoveer, little variation was noted. The computed
CBR's for the 120-, 60-, and 35-psi 1anels were 10, 6, and 3.8,
respectively.
8

FLEXIBLE PAVEMENT TEST 53T ION
The layout of the flexible pavement section, including the sub-
items containing the insulating layers, is shown in Figure 6. The verti-
cal locations of the insulating layers within the pavcents are shown in
Figure 7.
The locations of the polystyrene panel insulatib yc yera- were
selected by considering the expected vertical stress d tribution, as
obtained from a linear or nonlinear finite element analy3is, through the
sections without the insulating layers. The selection process for the
vertical locations for the 60-psi panels placed in item 4 is !"l1strated
in Figure 8. The expected vertical stresses at the top of the insu-
lating layers were calculated as 15 and 45 psi for the deep and shtdlow
locations, respectively. The linear elastic analysis was used for
item 4 because it was felt that, for the materials in this pavement, a
linear elastic approximation of the load-deformation response was &uffi-
ciently accurate. The selection process for the 120-psi panels pli.red
in item 5 is illustrated in Figure 9. The expected stresses at tht. top
of the insulating layers were calculated as 36 and 80 psi for the ieep
and shallow locations, respectively. A nonlinear analysis was perfrmed
for item 5 because of the stress-dependent nature of the response of
the granular materials (crushed limestone and sandy gravel). The modXti
of elasticity of the crushed limestone and sandy gravel were assumed to
te functions of the horizontal stress.
The locations for the lightweight concrete were checked based oi
the tensile stress at the bottom of the layer as computed by layered
elastic theory. For the shallow and the deep locations in items 4 and 5,
the tensile stresses at the bottom of the layers were less than 100 psi.
They were considerably less than the tensile strength of the lightweight
concrete as measured with beam tests. The results from the beam tests
are summarized in Table 1.
CONSTRUCTION
The construction of the test section is described in detail in
9

Volume I of this report, but will be summarized here for easy refer-
ence. An existing pavement was removed and 6 to 12 ii. of the in-place
clay subgrade was reprocessed with material added or removed where nec-
essary to obtain the desired grades; the water content was adjusted as
required; and the material was compacted with a 30-ton pneumatic-tired
roller.
The polystyrene layers were constructed by placing the panels by
hand in a staggered pattern as illustrated in Figure 10. The light-
weight concrete was mixed in 1/2-cu-yd batches, placed in forms, the
surface screeded to grade, and cured with wet burlap for 40 hr.
The soil and cement for subitems 4a-4d were premixed in a vindrow
adjacent to the test section, placed with a front-end loader, and spread
loosely in layers about 6 in. thick. The gravelly sand subbase and
crushed limestone base in subitems 5&-5d were placed in the same manner.
Each layer was compacted by 8 coverac_2a of the 30-ton roller with tire
pressures of about 70 psi, and for those lifts not over the insulating
materials, an additional 8 coverages of a 50-ton roller were applied.
The 50-ton roller was not useu over the insulating layers for fear of
damaging the materials.
The asphaltic concrete surfacing was laid down with a finisher in
10-ft-wide lanes. Compaction was accomplished with a 10-ton tandem
steel-wheeled roller and the 30-ton pneumatic-tired roller.
PROF -TiES OF AS-CONSTRUCTED PAVDEUTS
The material properties for the material in items 4 and 5 mea-
• ared prier to traffic are contained in Table 2. Since the material
above the insulating layers w~a compacted only with the 30-ton roller,
it was expected that the density of the material above the insulating
layers in the subitems would be less than it was in the main items.
However, from the data in Table 2 this is not evident. It was also
expected that the density of the lift above the polystyrene panels would
be less thar that of lifts nearer the surface, because of the effects of
of the low panel stiffness. This effect was generally observed for all
the other items (including 1, 2, and 3) where the density of the lift
10

above the subgrade was less than that of lifts nearer the surface. How-
ever, this effect is not apparent from the data in Table 2, and in fact,
the measured densities of the material above the stiff lightweight con-
crete layer were less than they were above the polystyrene panels.
TRAFFIC
Traffic was applied to the flexible pavements containing insulat-
ing layers with a 50-kip single-wheel assembly having a tire inflation
pressure of 190 psi. A detailed description of the application of1
traffic and subsequent pavement performance is contained in Volume I.
Table 3 summrizes the traffic data. The rating given a subitem was
based on permanent deformation of the pavement and cracking of the
asphaltic concrete layer. A pavement was considered failed when either
of the following occurred:
a. Surface upheaval of the pavement adjacent to the traffic lanereached 1 in. or more.
b. Cracking extended through the asphaltic concrete layer.
Subitems 4a-4d developed extensive cracking under the 50-kip
single-wheel assembly and were considered failed when the cracks pene-
trated the full depth of the asphaltic concrete. Subitems 4a and 4b were
considered failed at 170 coverages and subitems 4 c and 4d at 240 cover-
ages. Subitems 5a, 5c, and 5d sustained severe cracking and subitem 5b
slight cracking under the 50-kip single-wheel assembly. All subitems
were considered failed at 240 coverages when the cracks extended through
the asphaltic concrete.
AFTER-TRAFFIC INVESTIGATIONS
After termination of traffic, test pits were excavated in each
subitem for visual inspection of the insulating materials. In-place CBR
tests were conducted, and water content and density determinations were
made at various locations inside and outside the traffic lane in sub-
items 4a, 4c, 5a, and 5c. Moisture content determinations were made
near the surface of the stabilized base course in subitem 4b. Profiles
of the layers are shown in Figures 11-14. The CBR test results, mois-
ture contents, and densities are shown in Table 4. Load penetration
11

curves for the CBR tests conducted on the polystyrene panels are shown
in Figure 15, and curves for tests on the lightweight concrete are shown
in Figures 16 and 17.
SUBITEm 4a
The results of the CBR tests on the stabilized clayey sand were
erratic, ranging from a high of 114 to a low of 22. The CBR values mea-
sured outside the traffic lane were 114, 33, and 22 for depths of 3, 15,
and 22 in., respectively, and inside the traffic lane were 67, 27, and
56 for depths of 3, 15, and 22 in., respectively. In the main portion
of the test section, the CBR of the stabilized clayey sand varied from
93 to 150+ for all tests conducted prior to traffic and al tests con-
ducted after traffic but outside the traffic lane. The CBR values for
the main test section inside the traffic lane measured after traffic
were 150+ ad 70 for a depth of 3 in., 50 for a depth of 12 in., and 26
for a depth of 15 in.1
A comparison of the CBR's measured in the main test section with
the CBR's measured in subitem 4a indicates that the stabilized material
in the subitem was weaker than the stabilized material in the main test
section.
The average of the CBR's measured after traffic in the subgrade
uf the main test section was 6.2 as compared to an average of 3.3 for
subitem 4a. It can also be noted that the subgrade CBR's of subitem 4a
measured inside thn traffic lane were less than the CBR's measured out-
side the traffic lane. The tests conducted outside the traffic lane
were on the south side of the subitem. The lower values inside the
traffic lane and higher values outside the traffic lane were consistent
with the observation that the most severe rutting due to traffic occurred
to the north of the center line of the traffic lane.
The stiffness of the polystyrene, as measured by the load pene-
tration curves in Figure 15, was unaffected by the traffic. With the
exception of flexural cracking, the condition of the polystyrene (Fig-
ure 18) was excellent; i.e., there appeared to be no crushing of the
insulating material. The cause of the flexural cracking of the
12
polystyrene panels which were placed transverse to the traffic lane ap-
peared to be permanent deformation of the material beneath the panels.
Such deformations are indicated by the layer profiles in Figure 11.
SuBITm 4b
The only tests run in subitem 4b were moisture content determina-
t!ons near the surface of the stabilized base course. However, the per-
formance of the pavement and the lack of crushing in the polystyrene
substantiate the conclusion that the polystyrene was not directly the
cause of failure. The condition of the panels after 240 coverages,
which was long after failure, is illustrated in Figure 19.
SuBITE4 1 c
The CBR's measured for the stabilized clayey sand in subitem 4c,
partieularly beneath the lightweight concrete, indicated poor stabiliza-
tion. While the subgrade CDR's were not as low as those for the sub-
grade of subiten 4a, the CER's measured inside the traffic lane were
less than those measured outside the traffic lane. The load penetration
curves shown in Figure 16 indicate that at two locations inside the
traffic lane the stiffness of the lightweight concrete had been reduced
and that at one location the stiffness was unchanged. This indicates
that, in some areas, crushing of the surface of the lightweight concrete
had occurred.
Cracks had developed parallel to traffic in the lightweight con-
crete at the edge of the traffic lane and near the center of the traffic
lane. The profiles shown in Figure 12 indicate rutting occurred in the
stabilized clayey sand beneath the insulating material which probably
caused the cracking.
The results of the after-traffic testing indicated that failure
was caused by the lack of stabilization of the clayey sand beneath the
lightweight concrete.
SUBITEK 4d
A test pit was opened at the east end of subitem 4d and the west
end of subitem 5a at 170 coverages to observe the condition of the
13

lightweight concrete. The cracking that had developed in subitem 4d is
shown in the right side of Figure 20. The cracking of the lightueignt
concrete in this subitem indicated failure of this materiel, particu-
larly in the area of the transition between subitem 4d and subitem 5a.
SUBITM4 5a
On the crushed stone base in subitem 5a, in-place CBR values
inside and outside the traffic lane were 63 and 53, respectively. In
the main test section, the CBR values measured at the top of the base
both inside and outside the traffic lane were 150+ for traffic lane 1
and 133 for traffic lane 2. Thus, the CBR tests indicate a weaker base
material existed in subitem 5a than existed in the main test section.
Likewise, the subbase and subgrade CBR's were lower in subitem 5a than
in the main test section.
The condition of the lightweight concrete at 170 coverage. s in-
dicated in the left-hand portion of Figure 20. Although not visible in
the photograph, hairline cracks parallel to traffic were noted in the
surface of the lightweight concrete. The load penetration curves of the
CBR tests conducted on the surface of the lightweight concrete, shown in
Figure 17, indicated a weakening of this materiel due to traffic. Such
weakening would be the result of crushing of the concrete matrix in the
lightweight concrete.
SUBITE4 5b
An examination of the surface of the lightweight concrete in
subitem 5b showed one small longitudinal hairline crack near the center
of the traffic lane. A test pit was located at the center of the sub-
item, and it was determined that only about 0.4 in. of permanent defor-
mation had occurred at the top of the lightweight concrete. This
roughly corresponds to the deformation observed at the surface.
SUBITEM 5c
The CBR's measured at the surface of the crushed stone base were
lower than those for the base of the main test section, but the CBR
values measured on the gravelly sand roughly corresponded to those
14

measured in the gravelly sand of the main test section. The CBR's mea-
sured in the subgrade of this subitem were higher than the CBR's mea-
sured for the subgrade of the other subiteis and were approximately the
same am those measured in the subgrade of item 5 in the main test sec-
tion. The load peuetration curves (Figure 15) showed no difference in
stiffness of the polystyrene inside the traffic lane from that outside
the traffic lane.
The polystyrene in subitem 5c was placed with the long dimension
of the panels parallel to the direction of traffic as shown in Figure 21.
Placement in this manner permitted the insulation to deform with the
rutting, and thus no flexural cracking of the polystyrene occurred. No
crushing of the surface of the polystyrene could be detected.
SUBITE4 5d
Figure 22 shows the surface of the polystyrene in su'bitem 5d.
The polystyrene of this subitem appeared, as was the case in subitem 5c,
to be in excellent condition.
ANALYSIS OF TEST RESULTS
REVIEW OF PE"ORMANCE
In reviewing the results of the traffic tests the following
general observations were made:
a. Failures began at the transitions between items. This isillustrated in Figure 23, which shows the initial distressfor subitem 4a. For this particular distress, the point ofmaximum deformation was directly over the transition betweensubitems 4a and 4b. Figure 24 shows the failure of sub-item 4d, which began at the transition between subitem 4d andsubitem 5a.
b. The center of the permanent deflection basin of permanentdeformation was not in the center of the traffic lane but wasoffset to the north side of the traffic lane. This effect isillustrated in Figures 25 and 26. This offset was toward tkjoutside edge of the test section.
c. For subitems 5c and 5d, in which the polystyrene panels wereplaced parallel to traffic, distinct cracks developed in theasphaltic concrete directly above the Joints between panels.This is illustrated in Figure 27 which shows the longitudinalcracking in subitem 5c.

The above observations led to the conclusion that the failures in
the insulated test tms ee initiated by discontinuities such as tran-
sitions, panel cracks, and the eget of the lightweight concrete. This
conclusion has been substantiated by the performanc, of other full-sized
test sections in which premture failures have often occurred at transi-
tions. The cause of these failures has been attributed directly to the
lack of compaction. With the exception of subitem. 4d, which failed
because of crushing of the lightveight concrete, this concept seems ap-
r.icable to the failures of the subitems containing the Insulated layers.
It should be noted that the performace of subitsos 5a and 5b wss consid-
erad superior to the performance of the other items, although failure
was assigned at 240 coverages. As can be seen in Figures 28 and 29,
only a few cracks had occurred in these Itms at 210 coverages. Consid-
ering the discontinuitie,%, subitm 5b performed rmarkably well. For
subitsm 5b, Figure 29 shows there was very little cracking and the cross
section in Figure 26 shows very little permanent deformation. The supe-
rior performance of subitems 5. and 5b can be aitributed to the fact
that the lightweight concrete provIded a rigid base to support the gran-
ular materials during traffic.
The failure of subitea 1d cannot be blamed on poor performance of
oth,- pavemet mterials. In this case, the lightveight concrete was
placeu directly under the asphaltic concrete and failure occurred due to
crushing of the po.ystyrene beads within the lightweight concrete. In
this case, the compressive strength of the lightweight concrete was not
sufficient to withstand stress concentrations at its surface.
The failure of subitems 4a, 4b, j, and 5d indicated a lack of
stabilisation and/or the influence of discontinuities. In these items,
the lack of compation at the discontinuities resulted in reduced load-
distributing characteristics and shear strength of the granular and sta-
bilized materials. This resulted in large deformations, both above and
below the Insulating layers. In subitems 4. and 4b, the panels were
placed transverse to the traffic. The large permanent deformation, as
shown in Figures 11 and 25, caused flexural cracking of the panels
parellel to the direction of traffic, a" shown in Figures 18 and 19. Ir.
16

subitems 5c and 5d, the longitudinal placement of the panels permitted
deformation without cracking of the panels. This resulted in severe
rutttng, as illustrated in Figures 12 and 26, and longitudinal cracking.
as shown in Figure 27.
TIEORETICAL ANALYSIS
A theoretical analysis was conducted for subitems 5c and 5d to
determine the influence of placing the insulating layers within the
granular material. The analysis consisted of estimating the resilient
modulus of the pavement components, computing the resilient response
utilizing a linear elastic layered response model (Chevron computer pro-
gram9 ), and relating the computed response to allowable response. Al-
though a nonlinear response model had been used in placement of the poly-
styrene panels, a linear elastic layered response model was used in the
analysis to conform to the design scheme presmted by Barker and
Drdbston. 10 In addition, the resilient response was related to the per-
manent deformation of the pavement system.
The first step in the analysis ws to estimate the resilient
modulus and Poisson's ratio of the pavement components. The results of
resilient modulus tests conducted on samples taken from the nain part of
the test section and on laboratory prepared samples of the clay (CH)
siubgrade are shown in Figure 30. The field samples wunre taken at vari-
ous depths. It should be noted that the resilient moduli of the field
samples were considerably higher than the resilient moduli of laboratory
samples of comparable mois .ure contents. The suifrade had ben in place
for severa2 years, and the .ffects of thixotropic stiffening and compac-
tion by traffic in past terts probably caused the differences; in stiff-
ness. In addition, the CR tests indicated that the subgrade in the
subitems ias less stiff than it was in the main items. It should be
noted that the top 6 to 12 in. of the subgrade was reprocessed and there-
fore characterization with the laboratory data, at least for the upper
part of the subgrade, would appear to be Justified. For these reasons,
a resilient modulus of 3,000 psi was selected for characterizing the
subgrade. This is based on the laboratory curves and an estimated
17

deviator stress of 5 to 6 psi. The measured Poisson's ratio for the clay
vas relatively insensitive to the state of stress, and vas approximately
equal to O.4. The results from resilient modulus tests of the polysty-
rene panels have been presented earlier. These tests vere conducted
perpendicular to the panel fr .' and represented the direction of maxima
stiffness. In -he test sctioi;, the panels appeared to be subjected .
bending, and thus the modulus in the direction partllel 1o the panel
faces would sieificantly influence the layer behavior. Also, there vei e
weak planes along the joint betveen panels. To accoun for these two
factors, the resilient wdulus of the polystyrene was reduced to one
half, giving a resilient modulus of 3,500 psi. By comparing measured
load penetration curves computed with elastic theory, it was determined
that Poisson's ratio frr the polystyrene was close to zero, and thus
zero was used for this material. To characterize the granular materials,
the granular layers were subdivided into sublayers of 6 to 8 in. in
thickness. The modulus of each sublayer depended on the aodulus of the
layer beneath, according to a characterization scheme presented in
Barker and Brabston. 1 0 Poisson's ratio for the gravelly sand and
crushed limestone was es-imated at 0.2 ad 0.35, respectively. In the
analysis, two modulus values were estimated for the asphaltic concrete:
500,000 psi for a vinter day and 30,000 psi for - hot summer day. The
value 0.45 was ur'd for Poisson's ratio for be-th tie winter day and
sumner day. The echemes described resulted in v-14racterization of the
pavements as shown schematically in Figures 31 and 32.
The pavement response was computed utilizing the Chevron coputer
progr6am. 9 One pavement response of particular interest was the vertical
deflection at the surface, which could be compared with the measured
deflections. The comparisons of the computed deflections and measured
deflections are illustrated in Figure 33. The agreement of the measured
deflectioas with cor ruted deflections vas obtained vith the computed
deflections adjusted to account for the assumption in the layered
elastic theory of an Indefinite depth of subgrade. This assumption re-
sults in computed deflections at very large dirtances fro& the tire,
vhich tave not been observed in actual tests. The adjustment in this
18

case is made by moving the computed deflectioa upward such that the indi-
cated deflection at 80 in. from the center line of load would be zero.
The a-pleement between this adjusted curve and the measured deflection is
considered excelient, especially considering the scatter in the measured
data.
Computed vertical stress distrZ'ajtions, with depth, are given in
Figures Y, and 35 for summer and winte.- conditions, respectively. In
each figure, the distribution is given for subitems 52 and 5d. In com-
paring the istributions, it can be seen that there is little difference
in the stress for a given depth between subitems 5c and 5d. There is a
substantial difference, near the surface, in stress between a summer day
and a winter day. Also, there are differences in the vertizal stress at
the top of the polystyrene in subitem 5c (15 psi for a winter day and
18 psi for a summer day) and in subitem 5d (38 psi for a winter day and
51 psi for a suer day).
The distribution of vertical strain with depth for sumer condi-
tions is given in Figure 36 for o..bitems 5c and 5d. The vertical ines
in the figure represent the strain at the middle of a layer (except for
the subgrade, in which the distribution within the layer is represented).
In the upper granular layers the strain is greater in subitem 5d than
in 5c by approximately 35 percent, whereas below the polystyrene the
strain in both items is almost the same. Within the polystyrene, the
strain in subitem 5d is over twice that in subitem 5c. Thus, from the
standpoint of stress and strain, it vould appear that subitem 5c should
perform better than subitem 5d. This is contrary to the assigned behav-
ior where both were assumed to have failed at the same time. The prob-
lem is therefore one of degree of distress under what are considered
failure conditions.
In the design procedure for flexible pavement proposed in Barker
and Brabston,10 the vertical strain is used as the criterion for pre-
dicting the performance of a pavement. For the subgrade conditions and
applied traffic, the allowable strain is about 0.001 in./in. From the
plot in Figure 36, it can be seen that for both items the computed sub-
grade strain is almost twice the allowable. The purpose of limiting the
19

subgrade strain is to prevent rutting of the subgrade. In addition to
resilient sodulus tests as discussed earlier, rutting tests on the sub-
grade soil were conducted uting laboratory prepared samples. Two rela-
ti ,nships were developed from these tests. The first is the relation-
ship between permanent strain and resilient strain presented in Fig-
ure 37, and the second is the relationship between the ratio of permanent
strain to resilient strain and resilient modulus of the subgrade mate-
rial presented in Figure 38. The relationships were developed for
1000 stress repetitions, but the applied traffic is given in terms of
coverages. Traffic producing 1 coverage was considered to produce
3 repetitions of the max~imn strain at the subgrade surface; i.e. each
pass within 3 tire widths of a point would be considered as a strain
repetition. Since the relationship far 1000 stress repetitions was
available, it vas used as an approximation for 720 strain repetitions
which resulted from the applied traffic. The permanent strain at a
point in the subgrade can be determined from the relationships shown in
Figures 37 and 38. For example, at the top of the subgrade, a resilient
strain of 0.0018 in./in. is obtained from Figure 36. With this value of
resilient strain, a permanent strain of approximately 0.003 is obtained
from Figure 37 for a 3-CBR material. By using the distribution of re-
silient strain as shown in Fieure 36 for subiten 5d and the relationship
between resilient strain and permanent strain in Figure 37, the distri-
bution of permanent strain in the subgrade can be determined. The com-
parison between resilient strain and permanent strain to a depth of
70 in. is given in Figure 39.
If it is assumed that the permanent strain goes to zero at some
depth (say, 170 in.), then an approximation of the permanent deformation
in the subgrade can be made by computing the area under the permanent
strain distribution curve. From Figure 39, the area frem 70 in. to
170 in. is approximated as a triangle with an area representing
0.0385 in. of deflection. The remaining curve is broken into three
trapezoids from depths of 42 to 50 in., 50 to 60 in., and 60 to TO in.
The trapezoids have areas of 0.0172, 0.0130, and 0.0090 s in., respec-
tively. Summing these values gives a permanent deformation at the top
20

OF of the subgrade of 0.08 in. The distribution of permanent deformation
with depth is given in Figure 40.
The permanent deformation at the top of the subgrade can also be
estimated using the relationship presented in Figure 38 and the computed
resilient deformation. In this case, if it is assumed that the ratio
remains constant with depth and that the subgrade is infinite, then the
permanent deformation is equal to the computed resilient deformation
times the strain ratio. Interacting (graphically) the resilient strain
with depth curve to a depth such that the strain is essentially zero
yields R resilient deformation at the top of the subgrade of 0.115 in.
From . i 38, a strain ratio of 1.6 was obtained for a subgrade soil
of 3000 si. With a resilient strain of 0.115 in. and a straf:, ratio of
1.6, the permanent deformation of the surface of the subgrade in sub-
item 5d was estimated as 0.184 in. This -estimated deformation is greater
than the value previously estimated but was expected since the subgrade
stiffness probably increases with depth and the strain ratio decreases
with depth.
For either case, the estimated permanent deformation at the top
of the subgrade is insignificant when c-mpared to the measured (somewhat
greater than I in.) permanent deformation at the surface of the pavement.
This is not inconsistent wich observed behavior of the test item in
which no detectable perwnent deformation was measured at the top - the
subgrade. The theoretical analysis of the permanent deformation in the
subgrade and the observed condition of the polystyrene panels lead -o
the conclusion that nearly all of the observed pernm. nent deformation
occurred in the granular materials.
The conclusions reached as a result of an analysis utiltz4rg
layered elastic theory must be considered in the iight o; the proba-
bility that the vertical stresses are underpredicted. M-organ and11
Scala, in a review Gf flexible pavement behavior and application olf
elastic theory to pavement analysis, came to the following conclusion:
"The general failure of two and three layer systems to satisfy the
Burmister prediction appears to be due to lower than expected moduus
for the stiffer layers resulting from their inability to withstard
21

tension, or their dependence on confining stress which may not be suffi-
cient." The selection of values of moduli in this analysis was made
with the knowledge that materials not capable of sustaining tension
exhibit poorer load-distributing quality than a material of the same
modulus but having the capability of sustalning tension. The design10
procedure presented in Barker and Brabston provides for use of elastic
theory by direct correlation of computed strain values with pavement
performance. The real danger is when an attempt Is made to predict per-
formance by directly comparing computed values of pavement response with
laboratory determined material properties. In the design of pavements
containing insulating layers, stresses computed by elastic layered
theory should be used with caution. In Figure 36, which shows th, :,e-
silient deformation in the granular material, it can be seen that above
the polystyrene panels resilient strains on the order of 0.004 in./in.
are computed, which is about frour times the strain allowed for the sub-
grade. Although no information is available on the resilient strain and
permanent strain for the granular material, it must be assumed that, at
ouch Large resilient strains, large permanent strains would occur. If
the relationship between resilient strain and permanent strain for the
granular material is similar to the relationship developed for the sub-
grade, then the analysis would indicate that the major portion of per-
manent deformation occurred in the granular material betveen the as-
phaltic concrete surface and the insulating layer. Such a conclusion is
in agreement with the observed behavior of the test items.
No theoretical aailysis was conducted for the other items, but
from the analys's 7f subitems 5c and 5d, some general deductions can be
made. In item 4, where there was less structure above the subgrade, it
would be expecte4 tiat the permanent deformation in the subgrade would
contribute ihore to the total deformation than was the case in item 5.
The total result would be poorer performance of these items. If the
same chacteriai n were used for the granular materials in sub-
items 5a and 50 sa was used for subitems 5c and 5d, it would be found
that the moduluo of the granular material above the lightweight concrete
would be much higher than that above the polystyrene panels. The
22

increased modulus values would result in lower computed strains within
these matprials and a better load-distributing capability for these mate-
rials. The results of placing the stiffer material would be to improve
the load-carrying and distributing characteristics of the granular mate-
rials, thus improving the performance of the items. The improved stiff-
ne~s of these items is indicated by the measured deflections which were
less than 0.1 in.
23

RIGID PAVED&i"r ,T SECTION
The layout of the rigid pavement test section, including the sub-
items containing insulating layers, is shown in FigAre hi. Item 5,
which contained the Insulating layers, was divided into subitems 5a-5d
each ccsaposed of four 12-1/2- by 12-1/2-ft slabs. Subitem 5 contained
a 3-in.-thick layer of 35-psi polystyrene placed on the clay subgrade
over which was pla-I 6 in. of cement-stabilized lean clay. Subitem 5b
contained 9 in. of lIghtweight concrete directly on the subgrade. Sub-
itm 5c c rntained 3 in. of 12 0-psi polystyrene placed directly on the
subgrade, and subitm 5d contained 3 in. of 35-psi polystyrene placcd
directly on the clay subgrade. Fifteen-inch portland cement concrete
(PCC) slabs were placed on the above-described foundations.
CONSTMUCTION
The construction of the test section is described in detail in
Volume I of this report, 1 but will be sumarized here for easy reference.
The subgradc was prepared by remoing an existing rigid payewnt test
section and reprocessing, compacting, and grading as necessary to obtain
the desired strength and elevatiun. The subgrade for subitems 5a and 5b
was excavated 6 in, 4eeper than that for subite 5c and 5d to aceca-
sodate the 9-im. thickness of lightweight concrete in subitem 5b and the
6-in.-thick layer of cement-stabilized lean clay over the 3-in.-thick
layer of 35-psi polystyrene ir . subitem a,
Aftr the subgrade was raded, the cement-stabilized lean clay
base for Item 4 and the transitica slab between items 4 and 5 were
placed. Tht reinforced rcsecrete transition slab between items 4 and 5was then plact. Next the lightweight concrete was placed, as described
for the flexible pavement section. The polystyrene panels in sub-
items 5a, 5c, and 5d were then placed, by land, directly on the sub-
grade. The panels were staggered in a pattern as illustrated in Fig-
ure 42. The cemet-stabilized lean clay r'.r cubitem 5a was premixed,
placed on the panels, spread, and compacts. with a 30-ton psematic-
tired roller which had a tire pressure of about 60 psi. The
24

cement-stabilized lean clay had to be placed in the space between the
lightweight concrete and the transition slab between items 4 and 5. As
can be seen in Figure 42, the construction sequence restricted the space
available for operating construction equipment.
The 15-1: -thik PCC surfacing was placed in two 25- by 50-ft
lanes; the north lane being placed first. Concrete was mixed in ready-
mix trucks, placed between forms with a crane and bucket, and consoli-
dated with internal hand vibrators. The surface was screeded with a
straightedge and hand finished with bull floats and trowels. Construc-
tion techniques are illustrated in Figure 43. The concrete was wet-
cured with burlap and plastic sheeting for 7 days.
The north and south lanes were separated by a keyed-and-tied
longitudinal construction joint as shown in Figure 44. The keyway was
formed in the north slabs by wooden strips fastened to the forms. Thin
metal strips were attached to the base to provide weakened planes at
12-1/2-ft spacings both transversely and longitudinlly. In addition,
saw cuts were made in tne tops of the slabs to further weaken the sec-
tion, and to form a straight groove for ease in sealing. A crack
developed between subitems 5b and 5c in the north lane prior to sawing,
resulting in an irregular joint. Grooves for joint seal installation
were sawed in the construction and contraction joints and filled with
hot-poured joint sealing compound meeting Federal Specification
sS-s-164(4). 12 The crack between subitems 5b and 5c was not sealed.
PROPERTIES OF AS-CONSTRUCTED PAVE4ENTS
No field tests were conducted in item 5 as construction was pro-
gressing. However, plate bearing tests, conducted according to Military
Standard MIL-STD-621A, Method 104,13 on items 1-4, yielded modulus of
soil reaction values for the subgrade of from 40 to 85 pci with an aver-
age of 65 pci. The subgrade in item 5 was similar.
Flexural tests on 6- by 6- by 36-in. beams,5 compression tests,3
and split- g tensile tests14 on 6-in.-diam by 12-in.-long cylinders
yielded average flexural and compressive tensile strengths of 542 and
5150 psi, respectively, at 28 days age. Properties of the lightweight
25

concrete and polystyrene panels have been enumerated previously.
TRAFFIC
Traffic was applied to the rigid pavements containing insulating
layers with 200- and 240-kip twin-tandem assemblies having 190- and
250-psi tire inflation pressures, respectively. The layout of the traf-
fic lanes is shown in Figure hl. Traffic with the 200-kip assembly was
applied along the longitudinal construction joint in lane 1, and traffic
with the 240-kip assembly was applied in lane 2. A detailed description
of the application of traffic and subsequent performance of the pavement
is contained in Volume 1.
Table 5 summarizes the traffic data for the rigid pavements con-
taining insulating layers. Three failure conditions are listed: ini-
tial crack, shattered slab, and complete failure. The pavement condi-
tions considered to constitute failure for unreinforced PCC pavements
are as follows:
a. Initial crack failure. A crack that is visible at the sur-face of the pavement, extends through the depth of the slab,and is caused by traffic loading constitutes the initialcrack failure condition. This should not be confused withsurface cracking resulting from such minor defects as spalls,popouts, shrinkage, etc. It must also be recognized thatconcrete may crack during its early life due to causes otherthan traffic loadings, and any such cracks should not be
construed as denoting the initial crack failure condition.
b. Shattered slab failure. Cracking that is visible on the pave-ment surface or subdivides a pavement slab into six pieces ormore constitutes the shattered slab failure condition. Thecracking must be associated with traffic loading rather thanresulting from some minor defect or early life cracking priorto application of traffic.
c" Complete failure. Cracking that is visible on the pavement
surface and subdivides the pavement slab into individualpieces having an area of less than about 15 to 20 sq ft eachand that is characterized by relatively large permanentdeformations and faulted cracks or joints constitutes com-plete failure.
Failure for subitems 5a-5d was difficult to assign because the behavior
was somewhat different from that normally observed. Cracking did not
develop in the usual manner; i.e., dividing the slabs into large pieces.
26

Cracking usually developed along joints (at times being short discon-
tinuous cracks). As cracking progressed, spalling and eventually total
disintegration occurred along joints. Faulting along joints and pumping
were also observed. Another anomaly in the performance of several sub-
items was that cracking developed outside the traffic lane, but not
within the traffic lane. The exceptions were subitem 5c with the
200-kip loading and subitem 5d with the 240-kip loading. In these two
subitems, cracking developed and progressed as expected.
Pumping occurred in all subitems and was considered a significant
factor in performance 3f all subitems. The pumping was normally asso-
ciated with rainfall and would continue after rairfall had ceased. The
duration and severity of pumping increased as the 2evel of applied traf-
fic increased.
Because of the unusual performance of the pavement containing in-
sulating layers and the uncertainties involved in assigning failure as
listed in Table 5, the detailed descriptions of the behavior of the pave-
ments contained in Volume 1 will be repeated herein. This is provided
so that the reader can develop an accurate picture of the pavement con-
dition and draw his own conclusions regarding the serviceability of the
pavements at the various levels of applied traffic.
Traffic was applied in lane 1 with the 200-kip load and then in
lane 2 with the 240-kip load. The development of cracking is shown in
Figure 45. The development of permanent deformation in each subitem
with traffic is shown in Figures 46-49.
SUBITEN 5a, LANE 1
The first cracks developed parallel to and about 1 ft south of
the longitudinal construction joint (Figure 50) at about 1770 coverages.
As traffic progressed the cracking and spalling along the Joint con-
tinued until traffic was discontinued after 3000 coverages (Figure 51).
As can be seen in Figures 45, 50, and 51, no structural cracking, as
normally observed in PCC pavements, was evident; thus the indication of
joint failure in Table 5. Pumping of the cement-stabilized material at
the transverse joints was first observed at 750 coverages. The pumping
27

began after a rainfall of 0.25 in. The severity of pumping increased as
traffic was applied. The measured permanent deformation at 3000 cover-
ages averaged about 1.1 in. with a maximum of 1.4 in. A maximum differ-
ential movement of about 0.6 in. occurred along "he longitudinal con-
struction joint at 3000 coverages. It can be seen in Figure 46 that thepermanent deformation and differential movement were more severe at the
ends of the subitem than they were in the interior.
SUBITEN 5a, LANE 2
Some cracking developed in the slabs north of the longitudinal
construction joint prior to application of the 240-kip traffic in lane 2.
Some spalling had also occurred along the transverse joints north of the
longitudinal construction joint prior to traffic in lane 2. This crack-
ing and spalling, portions of which are visible in Figure 52, developed
during traffic in lane 1, during turnaround operations while traffic
(beyond 3000 coverages) was applied to items l-4, and during collection
of static instrumentation data in lane 2. The location of the cracks is
shown in Figure 45b. This cracking was outside the traffic lane and was
not considered in assigning failure during application of traffic in
lane 2. No major structural cracks developed during traffic but cracking
and spalling occurred along the longitudinal contraction joint and the
transverse joint between subitems 5a and 5b. The condition of the pave-
ment at 200 coverages is shown in Figure 53. At 500 coverages spalling
was noted at the vest end of the longitudinal joint and progressed with
continued application of traffic. The cracking and spalling were severe
at 750 coverages and the longitudinal joint and the transverse contrac-
tion joint between subitems 5a and 5b were considered as failed. Traffic
was continued to 950 coverages at which time the condition of the pave-
ment was as shown in Figure 54. Pumping of the cement-stabilized mate-
rial was initially noted at 350 coverages and became progressively more
severe as traffic progressed. Evidence of pumping can be seen in Fig-
ure 54. The pumping followed a period of rainfall in which 2.05, 0.15,
and 0.16 in. of rain occurred on 3 successive days. The measured pave-
ment deformation at 950 coverages averaged about 0.6 in. with a maximum
28

of about 0.7 in. As can be seen in Figures 48 and 54, the differential
movements even at 950 coverages, along the longitudinal Joint was small.
However, in Figure 54, there appears to be considerable differential
movement between subitems 5a and 5b.
SUBITE 5b, LANE 1
The deterioration of this subitem was limited to a strip along
the south side of the longitudinal construction joint. The first
spalling and cracking was noted at 1770 coverages (Figure 55). Cracking
and spelling progressed with the application of traffic and were severe
at 3000 coverages as indicated in Figure 56. No structural cracking, as
normally observes in PCC pavements, was evident; thus the ind. cution of
joint failure in Table 5. Pumping was first observed at the transverse
joint separating subitems 5b and 5c at about 340 coverages (following a
0. 4 9-in. rainfall) and at the joint separating subitems 5a and 5b at
740 coverages (following a 0.25-in. rainfall). The pumped material was
apparently from beneath subitems 5& and 5c, rather than 5b. The mea-
sured permanent deformation, at 3000 coverages, averaged about 0.65 in.
with a maximum of 0.9 in. A maximum differential movement of 0.3 in.
had developed along the longitudinal construction joint at 3000 cover-
ages. In Figure 46 it can be seen that the permanent deformation and
differential movement were greater at the west end of the subitem than
they were in the interior.
SUBIT24 5b, LANE 2
The performance of subitem 5b was similar to 5a. The only struc-
tural cracking occurred outside the traffic lane prior to traffic and
consisted of one crack as shown in Figure 45. Spalling along the trans-
verse joint between subitems 5b and 5c began soon after traffic was
started. This was the joint which formed before the top groove could be
sawed. Spalling began along the longitudinal joint at 540 coverages and
at 740 coverages extended for the full length of the subitem. The spall-
ing along both the east transverse joint and the longitudinal joint is
shown in Figure 57. Pumping along the longitudinal joint and the
29

transverse joint between subitems 5b and 5c began at about 320 coverages
(following 2.05-in. rainfall). The severity of pumping increased as the
applied traffic increased. Evidence of pumping can be seen in Figure 57.
The measured permanent deformation averaged about 1.3 in. with a maximum
of about 1.9 in. at 950 coverages. There was a differential movement al
about I in. along the longitudinal joint. This is shown in Figures 48
and 57.
SUBITEI 5c, LANE 1
The initial crack failure condition was assigned at 1000 cover-
ages. The condition of the pavement is illustrated in Figure 58. Addi-
tional cracking occurred until the shattered slab failure condition was
reached at 1230 coverages as illustrated in Figure 59. There was rather
severe cracking and spalling along the longitudinal construction joint
and the transverse contraction Joint between subitems 5b and 5c just
north of the longitudinal construction joint (Figures 58 and 59). The
transverse joint was the one where cracking occurred before the groove
in the top could be sawed and this accentuated the spelling. Landing
mat was placed over subitem 5c after 1230 coverages. Pumping of the
clay sujigrade was observed at the east end at about 200 coverages
(following a 1.08-in. rainfall) and at the vest end at 340 coverages
(following a 0. 4 9-in. rainfall). The pumping became extremely severe as
traffic was continued. The cross sections in Figure 4T7 indicate that
the maximum permanent deformation at 1000 coverages was about 0.3 in.
with very little differential movement between the nwrth and south slabs.
This seemed inconsistent with the amount of pumping. However, at
1230 coverages a differential movement of 0.6 in. uas measured.
SUBITED Sc, LANE 2
The failure of this subitem was much like that in subitems 5&
and 5b in that the primary distress was the spalling and faulting along
the longitudinal contraction joint. The only cracking occurred prior to
traffic outside the traffic lane and consisted of a longitudinal crack
north of the longitudinal construction joint and cracking along the
30

transverse contraction joint between subitems 5c and 5d. Spalling and
cracking along the longitudinal joint began at about 160 coverages and
extended along the entire length of the joint at 430 coverages. The
spalling was severe and the joint was considered as failed at 740 cover-
ages although traffic was continued to 840 coverages, at which time the
pavement had reached the condition shown in Figure 60. Pumping was ini-
tially noted at the transverse joint between subitems 5c and 5d at
320 coverages (following a 2.05-in. rainfall). The measured permanent
deformation at 840 coverages averaged about 1 in. with a maximum of
1.1 in. The cross sections in Figure 49 show a maximum differential
movement of about 0.6 in. along the longitudinal joint near the west end
of the subitem at 840 coverages.
SUBITE2 5d, LANE 1
The first crack observed in this subitem was a longitudinal crack
located about 2 ft south of the south edge of the traffic lane. This
crack did not extend from a free edge to a free edge but extended from
the east edge to the center of the slab. The crack did not propagate
to a second free edge, open up, or spall with additional traffic up
to 3000 coverages. The history of this crack is illustrated in Fig-
ures 45, 61, and 62. Because the crack occurred outside the traffic
lane and because it did not deteriorate with traffic, it probably did
not extend for the full depth of the slab and was not considered repre-
sentative of a failure condition. Therefore, in Table 5 the failure of
the item is denoted by a joint failure. At 2220 coverages cracking and
spalling developed along the longitudinal construction joint and at
3000 coverages extended for the full slab length as shown in Figure 62.
The deterioration was not, however, as severe as it was in sub-
items 5a-5c. Pumping was observed initially along the transverse joint
between subitems 5c and 54 at 220 coverages (following a 1.08-in. rain-
fall), but was not observed along the east edge until 750 coverages
(following a 0.25-in. rainfall). The cross sections shown in Figure 47
indicate a maximum permanent deformation of about 0.3 in. at the west
end and very little differential movement between the north and south
31
slabs. The cross sections also show that the permanent deformation and
differential movement were largest at the west end which is consistent
with observations of pumping.
SUBITB4 5d, LANE 2
At 20 coverages, cracks developed within the traffic lane as
shown in Figure 45. Cracking continued and spalling began along the
cracks until the shattered slab failure condition was reached at 200 cov-
erages (Figures 45 and 63). Cracking along the longitudinal Joint at
the west end was evident at 200 coverages. Traffic was continued to
350 coverages. No additional major structural cracks occurred, but
spalling along the cracks and along the entire length of the longitudinal
joint was quite severe as shown in Figure 64. No pimping of any conse-
sequence occurred prior to termination of traffic at 350 coverages. At
350 coverages a maiam permanent deformation of about 0.6 in. was mea-
oured. As shown in Figure 49, the maxkm perumanent deformation did not
occur along the longitudinal joint, but occurred north of the joint near
the center of the traffic lane. This coincided with the intersection of
the major structural cracks. The differential movement along the longi-
tudinal joint was small as shown by the cross aections in Figure 49.
AFTER-TRAFFIC INVESTIGATIONS
The after-traffic testing program consisted of the excavation of
test pits for observation of the condition of the insulating layers, per-
forming plate bearing tests to evaluate the modulus of soil reaction of
the foundation material, and sampling and testing the portland cement
and lightweight concrete to assess their strength ard modulus. The mea-
sured properties are summarized in Table 6. Bems and cores of the
lightweight concrete tested in compression and flexure yielded a flex-
ural strength of 127 psi, a flexural modulus of 0.373 x 10⁶ psi,
a compressive strength of 271 psi, and a compressive modulus of
0.134 x 10⁶ psi. Load-deflection curves for the plate bearing tests
are contained in Figures 65 and 66.
Upon examination of the results from the plate bearing tests, the
following observations were made:
32

a. The average soil reaction modulus was 132 pc-' This is con-sistent with values measured in items i-4 (aft_ traffic)where the average was 146 pci. Because of the similaritiesin the after-traffic soil reaction modulus, it was assumedthat the as-constructed subgrade in item 5 was similar tothat in items 1-4. Items 1-4 had an average modulus of soilreaction, measured prior to traffic, of 64 pci.
b. The polystyrene layers reduced the modulus of soil reaction.In Figure 67, it can be seen that the 3-in. layer of 120-psipolystyrene in subitem 5c reduced the modulus from 120 to63 pci and that the 3-in. layer of 35-psi polystyrene in sub-item 5d reduced the modulus from 143 to 103 pci. In sub-item 5a the modulus of soil reaction on top of the 35-psipolystyrene was 78 pci. Assuming that the effect of the35-psi polystyrene layer would be similar to that in sub-item 5d, the modulus of soil reaction on top of the subgradein subitm 5a was probably greater than 78 pci.
c. The modulus of soil reaction values on top of the ,5-psi poly-styrene were hWgher than the value for the 12u-psi polysty-rene. This s inconsistent with the strength and stiffnessproperties of the material. However, because only a smallnumber of tests were run, no definite conclusions can be drawnconcerning this apparent anomaly. Possible causes for the in-consistencies are differences in the subgrade stiffness (as
indicated betwee. subitems 5c and 5d), the inherent variabil-ity in the test procedures, and poor seating of the panels.
d. The measured modulus on top of the cement-stabilized leanclay in subitem 5a was 188 pci as compared to 328 pci initem 4. The difference war probably caused by the effects ofthe polystyrene in the structure and/or lack of compaction inthe 6-in. cement-stabilized layer. The lack of compactionwas thought to be caused by the presence of the polystyreneand the confined working space (see Figure 42).
e. The stiffening effect of the 9-in. lightweight concrete insubitem 5b is evident from the measured modulus of soilreaction of 420 pci.
The cracking along the longitudinal construction Joint in sub-
items 5a, 5b, and 54, and to some extent in 5c, developed about 1 ft
south of the Joint. This is about at the end of the tie bars, and the
spalling and breakout of material along the Joint appeared to progress
at about a 45-deg angle to the Joint. However, during removal of the
slabs from the test pits, the tie bars and Joint were disturbed so that
the actual condition of the Joints could not be verified.
The test pit in subitem 5c, lane 1, revealed that the panels were
33

cracked along the longitudinal construction joint. The cracks were lo-
cated about 1 ft south of the joint. In addition, there were several
cracks in the center of the slab about 6 ft south of the longitudinal
construction joint. The condition of the 120-psi polystyrene panels iF
illustrated in Figure 68..
The test pit in subiten 5b, lane 2, revealed that a crack had de-
veloped in the lightweight concrete along the longitudinal joint. As
can be seen in Figure 69, the surface of the lightweight concrete on the
north side of the joint was about 1 to 2 in. lower than on the south
zide. Evidence of differential oyement in the pavement can also be seen
in the cross sections shown in Figure 48. Dting removal of the slab in
the test pit, it was observed that the slab was bonded to the lightweight
concrete. When the lightweight concrete was removed, evidence that the
subgrade material had pumped up through the crack in the material was
noted. Evidence of this is shown in Figure TO which shows a seam of
clay material through th crack in the lightweight concrete.
The test pit in subitem 5c, lane 2, revealed that the 120-psi
polystyrene panels were cracked along the longitudinal contraction joint
at a distance of from 6 to 12 in. north of the joint. The condition of
th6 panels is illustrated in Figure 71.
ANALYSIS OF TEST RESULTS
The analysis of the results of the tests will consist of a com-
parison of the actual perfornce of the pavemnts with expected per-
formance based on current design criteria (Corps of hngineers (CE) and
Federal Aviation Administration (FAA) criteria). The behavior will then
be analyzed to determine why the pavements performed as they did. This
vill b',4lcally involve a study of the support provided by the founda-
tions containing Insulating layers and the effects of a number of fac-
tors on the stresses and deflections in the pavement system which in-
fluenced the performance of the pavements.
CGheArISON OF OBdt W ANDPED.ICTD PDFOOANCE
The performiance data for the pavemeonts containing insulating
314

layers are contained in Table 5. The performance of the pavements waS
eh hrmcterized by failure along the longitudinal construction and contrac-
tion Joints in all but three situations. These being subiten c, lane I
and aubitem 5d, lane 2, where failure due to cracking occurred, and sio-
item 5d, lane 1, where some distress along the longitudinal Joint had
occurred when traffic was stopped (3000 coverages) but the Joint was not
considered failed.
FAA and CE first crack failure (initial failure) design criteria
are based on crw:king of the slabs. Using these criteria and the prop-
erties of the pavements listed below, the expected performance of the
pavements was computed:
Slab thickness a 15 in.
Concrete modulus of elasticity a 6 x 10⁶ psi
Concrete Poisson's ratio a 0.2
Concrete flexural strength
Lane 1 a 833 psi
Lane 2 a 863 psi
Modulus of soil reaction
Subitem a 190 pei
Subit.. 5b - 420 pci
Subitm 5c 6D pai
Subitem 5d a 100 pci
The predicted performance is summarized in Table 7 along with the
actual performance. It can b seen that Joint failures generally oc-
curred at coverage levels much lower than those predicted. The excep-
tions being subitem 5c, lane 1, where the predicted and observed perfor-
mences were close, and subites 5c, lane 2, where the observed performance
was somewhat better than pred toted.
A caMarison of the observed and predicted performances my also
be made by computing the ratio of the concrete flextal strength to the
computed stress, referred to as the design factor, and plotting this
r versus the log of the observed coverage level, as shown in Fig-
ure 72. . . shown in the figre is the CZ and FAA relationship for
first cra- fai -- (design or perforance) criteria. With the
35

WEc,, ±c of two situations mentioned previously, the points all plot
aoo e tLe performance relationship indicating that the pavement peor-
•-ace was not as good as expected.
Wher comaring the observed performance with the established per-
f)rmkrce criteria, several factors should be considered. The scatter in
the aa points (Figure 72) appears :ite large, but historically pave-
' e' $ zerfornance data has exhibited large variability. Some of the
tbLe reasons for the large variability will be considered subse-
wateatly. The mode of failure observed (Joint failure rather than crack-
i ,g cf the slabs) is a factor in assessing not only the scatter but also
t.e relative performance of the pavments. The data pcnts exhibit con-
si..-rable scatter and indicate poorer perfortance than the etaolished
ritera, but it should be noted that the points, for the t's cases
where the failure was due to cracking, are reasonably close to the es-
ablished performance relationship.
In assessing rivement performance, there is the ever-present
problem of assigning representative flexural strength values. The as-
signent of foundation support values is also a problm. In' particular,
the modulus of soil reaction used was the value maued aft -r comple-
tion of traffic, which should have been larger than it was the
beginning of traffic. Althouh no tests were run in item 5 nior to
traffic, before and after tests in items 1-4 indicated that t he stiff-
ness of the subgrade increased with traffic. Tests on the I !e in all
but item 3 also showed an increase in modulus of soil react -. with
traffic. Therefore, the support values used in the analysis yer prob-
ably larger than those which were effective during traffic; thus, the
predicted performance should have been better than that observed. How-
ever, the differences indicated for subitems 5& and 5b are too large to
be attributed to the foundation support.
There was scme evidence to indicate that the difference between
the before- and after-traffic soil modulus values on the polystyrene in
subitems 5c and 5d should have been larger than could be attributed to
an increase in the subgrade stiffness. Poor seating between the poly-
styrene panels and the subgrade could have produced wsually low

support values until traffic produced sufficient plastic deformation to
provide uniform contact between the panels and the subgrade. As a re-
sult, the initial support values could have been much lower than indi-
cated by after-traffic tests.
The poor seating of the panels and the confined working space
could haie affected the cozqpction of the cement-stabilized layer in
subitem 5a. However, the lack of compaction should have been most pro-
nounced at the ends of the slabs which would have been manifest by dete-
rioration of the transverse joints. However, as noted previously, the
longitudinal joints deteriorated rather than the transverse joints. The
krformance of the transverse joints also discredits the theory that the
discontinuity (nonuniforwity) of the foundation was a primary factor in
the unusual performance. While it is true that deterioration usually
starts near transitions (of which there were five), this did not appear
to be an important factor, since all transverse joints remodned rela-
tively free from cracking and sp.llift.
The prioary difficulty in assessing the performance of the pave-
ments, however, revolved around the mode of distress in the pavements;
i.e., cracking end spelling along the joints. There were apparently
some rather significant differences between the responses to Imposed
loads of the slabs on the insulating layers and those on normal founda-
tions. This difference was manifested in the joint distress rather than
cracking.
The relatively mall slab size (12-1/2 by 12-1/2 ft), large thick-
ness (15 in.), and large load (magnitude and 11 by 58 in. spacing of
four wheels) could have created unusual stress and deflection patterns
within the pavement. This may have resuted in rocking or rotation,
rather than bending, of the short, stiff slabs. This would have pro-
duced tensile stresses in the slabs which were within tolerable limits
but deflections at joints which aould have caused unusually large local-
ized stresses along the joints. Once again, the fact that the transverse
joints did not deteriorate reduces tha credibility of this argmnt.
However, the concept appears much more attractive when the manner
in which loads were applied and the unusual properties of the insulating
37

materials are considered. The loads were applied primarily along one
side of the longitudinal construction Joint in lane 1 and along the lon-
gitudinal contraction Joint in lane 2. This resulted in permanent defor-
nation along one side of the Joint which accentuated the rocking of the
s3ab and deflection along the Joint.
It is tempting to attribute the unusual pavement response to the
unusual properties of the insulating materials (these properties being
a Poisson's ratio of approximately zero and a crushing mode of failure).
For the polystyrene panels, there is the additional factor of aniso-
tropic load deformation and strength characteristics; i.e., the material
is stronger and stiffer when loaded perpendicular to the races of thepanels. These properties combined with the application of load.s over a
limited pavemint width would have led to pavement response which was
different than that for conventional paying materials, In particular, a
zero Poisson's ratio and a er*uhing failure mode would not have resulted
in a tendency for the material to expand horizontally upon loading.
Therefore, there would have been no bildup of residual horizontal
stresses and no resulting increase in stiffness with traffic. The crush-
ing mode of failure would also have prevented soy remolding of the mate-
rial with the application of loads along adjacent paths. Because of the
anisotropic material response, the stiffness of the polystyrene layers
moy have been less than predicted with the material properties, as mea-
sured from compression tests with the load applied perpendicular to the
direction of the panel face. ilover, the response and condition of the
pavements did not indicate that the properties of the insulating layer
were a significant factor In the performance of the pavements.
The permnent deformations in subitems 5c and 5d appeared to oc-
cur primarily in the subgrnde and were apparently caused by densifica-
tion and shear. In subitem 5&, the permanent deformation appeared to
be primarily caused by pmping of the cement-treated lean clay. There
was also evidence of pumping of the subgrade material (especially in
lane 2) in subitems 5c and 5%. The response of the pavement in sub-
Item 5b, lane 2., was unique. A differential movement along the longi-
tudinal contraction Joint of about I in. was observed on the surface
38

and on top of the lightweight concrete in the test pits. A crack had
developed in the lightweight concrete along the joint. It is not known
what caused this crack, but it mav have been a shear failure caused by
the loading along the joint. Another possibility is that, due to the
bond between the PCC slab and the lightweight concrete, the crack could
have been cause(! by bending or a combination of bending and tensile
stresses, the bending being caused by loading and the tensile stresses
by shrinkage of the PCC surfacing. The effect of the crack was to in-
crease the stresses on the subgrade and to cause pumping of the subgrade
material through the crack.
The c3mbined effects of slab size, magnitude of load, application
of load on one side of the joints, and large permanent deformations may
have caused unusually large stresses near the joints. As the slabs
rotated and deflected downward, large horizontal compressive forces
would have resulted in the top of the slabs, as illustrated IS Pigure 73.
This force combined with the shearing forces transferred across the
joint would have resulted in large shear stresses in the material, and
would account for the cracking and spalling along the edge of the joint
nearest to the center of the traffic lane. The deterioration is illus-
trated in Figures 51, 54, 56, 57, 59, 60, 62, and 64, and it can be seen
that the cracking and spalling occurred primarily along only one side of
the joint.
An additional factor which may possibly have affected the perfor-
mance of the pavements containing polystyrene panels was the fact that
the layers were discontinuous; i.e., made up of separate panels. As
will be discussed in more detail in the following section, the presence
of the polystyrene layers decreased the supporting capacity of the foun-
dation, rather than increasing it as it should have, based on the proper-
ties of the material. It is possible that the zeduction in the support-
ing capacity, as measured with a 30-in.-diam plate, would be smaller
than that experienced by the slabs; i.e., the effective supporting
capacity experienced by the slab was less than that measured by the
plate bearing test. This may have accentuated the deflections along the
joints.
39

The discontinuities in the layer and rigidity of the individual
panels probably also accentuated the pumping of the subgrade. The panels
probably had sufficient stiffness to rebound after the load had passed,
whereas the subgrade would have been permanently displaced, creating a
small void beneath the panels which would have acted as a reservoir for
water. With additional applications of load, the panels would have
again deflected, ejecting the water and suspended subgrade material.
This would have continued until the panels cracked, as they apparently
did in same cases. An unexplainable anomaly to this argument was the
transverse joints where the pumping was more noticeable than along the
longitudinal joints, but which performed satisfactorily.
ANALYSIS OF SUPPORTING CHARAC-TERISTICS OF INSULATING LAYES
Measured load deformation curves from plate bearing tests on the
subgrade and the insulating layers are shown in Figures 65 and 66. The
values of modulus of soil reaction and the locations where they were mea-
sured are illustrated in Figure 6T. Some of the apparent anomalies in
the measured supporting characteristics of the insulating layers were
pointed out previously and will be considered in detail in this section.
In order to study the nature of the supporting characteristics of
the insulating layers, the plate bearing tests were simulated with an
axisymmetric linear finite element program. The mesh used for the simu-
lation is shown in Figure T4.
A modulus of 1950 psi was selected for the subgrade from a trial-
and-error procedure. The subgrade was assumed to have a modulus of soil
reaction of 132 pci (average of values measured in subitems 5c and 5d).
With a plate pressure of 10 psi, the modulus was varied until a plate
deflection of 10/132 in. was obtained. A Poisson's ratio of 0.4 was
assigned for the subgrade material.
The 35-psi polystyrene was assigned a modulus of 1950 psi. This
is based on the assumption that this material would behave similar to
the 120- and 60-psi polystyrene as shown in Figure 3; i.e., the ultimate
compressive strength (35 psi) is developed at 2 percent strain, and up
40

to this level of strain the stress-strain curve is approximately linear.
A Poisson's ratio of zero was assigned based on observations of the re-
sponse of the material in unconfined compression tests and in previously
described CBR tests. Similarly, a modulus of 6000 psi was assigned for
the 120-psi material; i.e., the stress-strain relationship from the un-
confined compression tests in Figure 3. The resilient modulus for the
material is similar, as shown in Figure 4. A Poisson's ratio of zero
was also assigned to this material.
The lightweight concrete was assigned a modulus of 250,000 psi.
This is based on unconfined compression tests of cylinders conducted
according to ASTM 469-65. 6 Modulus values computed from flexural tests
on beams were somevhat larger. However, it was felt that the results
from the compressive tests were more representative of the response of
the material. A Poisson's ratio of zero was assigned to the lightweight
concrete. This results because the polystyrene beads control the re-
sponse of the material and are crushed, with little lateral volume
change, as load is applied.
A modulus value of 50,000 psi was assigned the cement-stabilized
lean clay. This vas based on the results of unconfined compression
tests on cylinders of the material mixed in the field and compacted in
the laboratory. Modulus values from flexural tests on beams, indirect
tensile tests on cylinders, and repetitive load tests on cylinders,
yielded larger values. However, it was felt that the static unconfined
compression tests were the most representative for the static plate load-
ing tests. A Poisson's ratio of 0.15 was assigned.
The plate bearing tests were simulated by applying a plate pres-
sure of 10 psi to the layered systems described by combinations of the
elastic constants. The resulting load-deformation relationships for
subitems 5a-5d are plotted with the measured relationships in Fig-
ures 75-78. For all four subitems, the computed stiffness of the system
is greater' than the measured stiffness.
In Figure 75, the measured and computed cruves for subitem 5a are
shorn. The difference in the slopes of the early portions of the curves
is 124 pci or about 66 percent of the measured value. There are three
41

possible causes for the differences in the measured and computed stiff-
ness. The compaction of the 6-in. layer in the field my not have been
as good as that obtained in the laboratory because of the flexibility of
the underlying polystyrene panels on the clay uubgrade. Secondly, the
35-psi polystyrene was in panels and may have been more flexible than if
it vere continuous as modeled. This would mean that the effective
modulus of the layer was less than 1,750 psi. This factor will be con-
sidered in subiteas 5c and 5d. Finally, traffic my have caused crack-
ing or localized failures in the stabilized laqer reducing the effective
modulus of the material to ame value lover than 50,000 psi.
The load-deformation curves for subitm 5b shown in Figre 76
show that the measured stiffness of the system is approximately one half
the computed stiffness (difference of 415 pci). So verified explanation
c=n be offered for this difference. The modulus of the lightweight con-
crete might be suspect, but the results from compression tests, which
were considerably less than the results from flexure tests, were used.
The most likely possibility seems to be that traffic caused some reduc-
tion in the stiffness of the lightweight concrete and thus a reduction
in the stiffness of the system. A reduction in the stiffness of the
subgrade is excluded since all evidence in other items points toward an
increase with traffic. The plate bearing test was conducted in lane 2
where the 240-kip assembly load wa applied. Cracking of the light-
weight concrete along the Joint was observed in the test pit, and the
slab was bonded to the lightweight concrete and had to be broken loose
during construction of the test pit. There may have been additional
cracking in the lightweight concrete which was not noted which could
have affected the plate bearing results. The removal of the slab may
also have adversely affected the stiffness of the materiel. The re-
peated application of pressures of between 10 and 20 psi may also have
resulted in some crushing of the polystyrene beads in the concrete
matrix. Once the structure within the beads had been destroyed, they
could have become very weak, resulting in" a weakening of the total
matrix. This is a possible cause of the differences in the stiffness,

although unsubstantiated since no repeated load tests were run on the
lightveight concrete.
Curves for subitems 5c and 5d are shown in Figures T7 and 78,
respectively. As noted previously the lover strength (more flexible)
35-psi panels had a higher stiffness than did the 120-psi panels. This
has been discussed previously and may be attributable to local differ-
ences in the subgrade stiffness and test variation. However, it is
also interesting to note that the computed stiffness for both cases is
less than the measured stiffness. This is probably caused by the fact
that the material was in discontinuous panels rather than in a continuous
layer as modeled. The 30-in. diameter would have had to span at least.
one joint since the panels were 16 and 24 in. wide, respectively, for
120- and 35-psi panels. As a result' the effective modulus of the lae
was probably lover than 6000 psi for the 120-psi poystyrene and 1750 psi
for the 3:-psi polystyrene. The combined effects of differences in sub-
grade stiffness (different than the average modulus of soil reaction of
132 pci) may explain the differences between the measured and computed
stiffness and the variation in the magnitude of the difference between
the two items. There is also the possibility that poor seating of the
panels on the subgrade could have caused a reduced stiffness of the sye-
ztea, although the application of traffic should have minimized these
effects.
In summary, it can be concluded that the measured stiffness was
always less than the computed stiffness. The modulus values used in the
simulation of trie plate bearing tests were conservative estimates usually
based on the test procedure giving the smallest values. Therefore, it
is concluded that the insulating layers have different supporting char-
acteristics than normal paving material and that the polystyrene layers
reduced the supporting capacity of the subgrade. The primary reasons
for this are thought to be the flexibility of the polystyrene layers
caused by the discontinuities in the layer, the compressibility of the
polystyrene beads in the lightweight concrete, and the low or nearly
zero Poisson's ratio of the insulating materials. The low Poisson's
ratio permits vertical compression without any lateral expansion.
4.3

Therefore, there Is no buildup of horizontal confining stresses and the
resulting stiffening of the material.
ANALYSIS OF PAY0IT
87RISM AND DWiZCToNs
In this section, the stresses In the FCC slabs end the deflections
experienced by the pavements wl be exmined. Measured deflections,
computed deflections, and computed stresses will be exmined to deter-
mane the causes for the umumal performance of the payments containing
the insulating laes; I -*e., hy locallsed cracking and spalling oc-
cured along the longitudinal Joint rather than cracking of the slab.
The measured deflection# ware obtained with a rod and level. The
initial readings were taken with the dual-ta i Sear In place (centered
longitudinally In the slabs with two of the wheels tangent to either the
longitudinal conSt uction Joint In lan 1 or the lonitulinal cotrac-
tion Joint in lane 2) and final readings taken after the load vas re-
mored. The deflection was obtained by subtracting the Initial reading
from the final reading. This rebomn deflection Is representative ofthe elastic deflection experienced by the pamant.
Stresses and deflections we computed for edge and Interior load
positions on dense liquid foundation conditions vith equations as 4e-veloped by Westersard. 1 The actual computations vwre accomplishedusing Influence charts developed by PIckett, et, &ls and Piokett and
Ray.* Stresses and deflections vere also computed using the discreteelement method as developed by Hudson and Ia tlk. Actual computa-
tions were accomplished using a computer code developed by Panak and
Matlock.23 The discrete element aethod is based on the same basic model
as the Westergaard method (I.e., a thin slab on a deme liquid founda-
tiot.), but uses finite difference approximations for solving the equa-
tions of bending rather than a closed fora solution. With the discrete
element method, discrete slabs may be considered, fhereas, the equations
developed by Weetergeard and grapcally displayed In the influence
charts are based on the asumption of semi-infinite slbs.
Table 8 contains a stamry of maxima measured and computed

deflections. Properties of the slabs and foundation support values used
in the comptations were as previously described. Ysium computed
stresses are s'iimarized in Table 9. Deflections and stresses at the
pavement edge (with the load at the edge) and deflections and stresses
within the interior of a slab (with the load located within the slab
interior) were computed using the influence charts. These are contained
in Columns 4 &nd 5 of Table 8 and Columns 2 and 3 of Table 9. The
values in parentheses in Colmn 2 of Table 9 are computed values of edge
stress multiplied by 0.75. This procedure is followed in design to
represent the stress conditions at a joint where the actual stresses
would be less than the computed free-edge stresses because of the upward
force on the loaded slab produced by the adjacent slab.
For the discrete element method, deflections and at esses are
shown for 12-1/2- by 12-1/2-ft slabs and for 25- by 25-ft slabs. The
actual slab size was 12-1/2 by 12-1/2 ft. and the pavement as modeled
with the finite element method is shown in Figure 79. The increment
length used was 1-1/2 ft. The bending stiffness along the contraction
joints and along the doweled construction joint between the transition
slab and subitem 5S was reduced by 100 percent; i.e., the joints func-
tioned as hinges with no ment capacity but with full shear transfer.
The bending stiffness along the keyed-and-tied longitudinal construction
joint was reduced by 94 percent. The shear transfer capability along
the joints was 100 percent. The load was applied Won the longitulinal
construction joint as illustrated for subiten 5S in Figure 79, and along
the longitudinal contraction joint as illustrated for subitem 5c in
Figure 79.
In order to study the effects of slab size, stresses and deflec-
tions were computed assuiing that the slabs were 25 by 25 ft. For
15-in.-thick slabs, a 25-ft joint spacing is more realistic than a
12-1/2-ft spacing. An illustration of the discrete element model for
this condition is shown in Figure 80. Subitems 5b-Sd are modeled as if
the slabs were 25 by 25 ft. This model was used for loading in sub-
items 5c and 5d, lane 1. For loading in lane 29 the longitudinal joint
was changed to a contraction joint. For loading in subitem 5b.
45

subitem 5a was added and subitem 5d was eliminated from the model. It
was necessary to restrict the extent of the pavement modeled because of
computational requirements; i.e., with a 1-1/2-ft increment length it
would have been excessively costly and time-consuming to model the
entire item as was done for the 12-1/2- by 12-1/2-ft slabs.
Measured and computed deflection basins are shown in Fig-
ures 81-92. In these figures, measured deflection basins for transverse
lines through two of the wheels of the dual-tandem assembly and fo
longitudinal lines through the centroid of the dual-tandem assembly are
plotted. In addition, deflection basins computed with the discrete ele-
ment method are shown for transverse lines through two of the wheels and
for lines along the longitudinal construction joint in lane 1 and along
the longitudinal contraction joint in lane 2. For the transverse lines
the measured and computed positions were the same. However, for the
lon itudinal lines, the measured values were taken along the longitu-
dinal axes of the gear but the computed values were force lines along
the longitudinal joints. Basins are shown for the computations with
12-1/2- by 12-1/2-ft slabs and in selected cases for the computations
with 25- by 25-ft slabs assumed. For lane 1 the loading on four wheels
was 200 kips, and for lane 2 the loading on four wheels was 240 kips.
Deflections. From the analysis of the measured and computed
deflections, the following was observed:
a. The measured deflections were generally larger than the com-puted deflections. This is apparent from comparison of themeasured values in Columns 2 and 3, Table 8, with the computeddeflections and from comparisons of the computed and measureddeflection basins in Figures 81-92. There was considerablescatter in the measured data as evidenced by the measuredcurves in Figures 81-92. The accuracy of the measuringdevices for deflections of the magnitude in question issomewhat suspect, and therefore the comparisons between themeasured and computed deflections should be consideredcautiously. In regard te the comparison of the measured andcomputed deflections, it should also be noted that the mea-surements were made prior to traffic and that the computedvalues were based on modulus of soil reaction values fromplate tests run after traffic was completed.
b. The general trend (disregarding the scatter) is that theslope of the measured deflection basins is steeper than that
4.6
of the computed basins (Figures 81-92). The slopes both mea-sured and computed appear to be steeper in the transversethan in the longitudinal directions. This is an indicationof more rotation of the slabs, without bending, which isconsistent with the distress along the longitudinal joints.The apparent rotation is more pronounced in lane 2 than inlane 1 and more pronounced in subitems 5c and 5d than in 5aand 5b. These observations are consistent with the proximityof lane 2 to the pavement edge and the weaker foundationsupport in subitems 5c and 5d.
c. The deflections computed with the discrete element modelalong the joints (Columns 6 and 8 of Table 8) are approxi-mately equal to, but always slightly larger than, the deflec-tions computed with the influence charts for the slab interiorconditions (Column 5), and always smaller than the edge de-flections (Column 4). This is consistent with the discreteelement model for the joints which assumes full shear transferor equal deflection on either side of the joint.
d. Slab size does affect deflections as evidenced by the dif-ference between the value computed with semi-infinite slabs,25- by 25-ft slabs, and 12-1/2- by 12-1/2-ft slabs. Gener-ally, the computations with the larger slabs resulted insmaller deflections (Columns 5, 6, and 8, Table 8, andFigures 81-90). The one exception is subitem 5c (Figures87-89); but it in felt that, for the 12-1/2- by 12-1/2-ft slabmodel, the deflections were influenced by the proximity of
*the loading to the high-strength foundations in subitem Sb,whereas, for the model with the 25- by 25-ft slabs, the in-fluence of the higher strength foundation In subitem Sb wasdiminished.
e. The effect of slab size on deflection is more noticeable inlane 2 where the loads are near the edge of the pavement(Figures 83, 85, 87, and 89). The effect is also morepronounced in subitem 5d than in the other subitems due tothe proximity of the load to the end of the item (Fig-ures 90 and 92). The foundation strength diminishes theeffect of slab size and loading near an edge. This can beobserved by comparing the deflection basins in Figures 85and 89. The deflection at the slab edge for subitem 5b ispractically zero whereas the deflection at the slab edge forsubitem 5c is 0,0036 in. For both items, the deflection atthe slab edge for 25- by 25-ft slabs was practically zero.The measured, and to a certain extent the computed, deflec-tior, basins indicate more rotation of the outer slab inlane 2 than the slabs in lane 1.
f. There is no apparent relationship between the measured deflec-tions and the pavement performance nor is there any apparentrelationship between the computed deflections and the pavement
34T
performance. In Figure 93, the measured (maximum at thejoints) and computed (discrete element theory with 12-1/2- by12-1/2-ft slabs) deflections are plotted as a function of thetraffic applied to the pavements in terms of coverages, andin Figure 94 the measured and computed deflections are plottedas a function of the log of the coverages. No well-definedrelationship iS apparent from either of these plots, althoughthe general trends seem to be that the performance is inde-pendent of computed deflection and that tLe performanceimproves as the deflections decrease for the measureddeflections.
Stresses. From the analysis of the computed stresses, the fol-
loving was observed:
a. The bending stresses computed with the discrete elementtheory with 25- by 25-ft slabs (Column 5, Table 9) wereapproximately equal to the iterior stresses (Column 3,Table 9) computed with influence charts, but both weresmaller than the edge stresses (Column 2, Table 9) computedwith influence charts. "his is as expected since the 25 per-cent reduction in edge stress is a conservative estimate fordesign, plus the fact that the assumption in the discreteeleuent model of full shear transfer at the joints (equaldeflections on either side of the joints) would not reallyrepresent the behavior of joints since some differentialmovement does occur. As it affects the stress in the slab,the condition modeled at the joints is not significantlydifferent from interior conditions.
b. The bending stresses computed with 12-1/2- by 12-1/2-ftslabs (Column 4, Table 9) were smaller than those computedwith Westergaard theory (Columns 2 and 3, Table 9) or thosewIth 25- by 25-ft slabs (Column 5, Table 9). This indicatesthat slab size did influence the state of stress in the pave-ment slabs and therefore may have significantly influencedthe performance of the pavements. This factor ir consistentwith the slab rotation that was discussed previously inconjunction with the deflections.
4.8

CONCLUSIONS AND RECOMMENDATIONS
The conclusions and recomnendations contained herein are based on
the tests conducted on the flexible and rigid test pavements containing
insulating layers, the tests on the materisls contained in these pave-
ments, and the analyses of the data obtained from these tests.
FLEXIBLE PAVEMENTS; CONCLUSIONS
Based on the field observations and the theoretical study, the
following conclusions are drawn:
a. The principal cause of the failure in subitems 4a, 4b, 5c,and 5d was a lack of shear strength of the materials abovethe insulating layer. The lack of strength was due to themore flexible insulating layer within the material to be coot-pacted, the reduction in compaction effort, the nearness tothe edge of the section, and discontinuities between testitems.
b. In subitem 4c the pavement failure was primarily caused bythe progressive failure of the stabilized material above thelightweight concrete which finally resulted in failure of thelightweight concrete itself.
c. The failure of the pavement in 44 was due to a failure of thelightweight concrete. The cover above the lightweight con-crete was not sufficient to prevent stress concentrations,particularly at the edge of the section. Failure started atthe edge and progressed inward until complete failure oflightweight concrete had occurred.
d. The lightweight concrete subitems in item 5 performed remark-ably veil, considering their size and the discontinuitiespresent at the transitions between them. The lightweight con-crete increased the stiffness of the subitems as indicated bythe deflection measurements which did not increase when mea-sured at 170 coverages.
e. Although the computed compressive stress on the insulatingmaterial was, in all cases, much less than the compressivestrength of the insulating material, damage to the materialsdid nccur. The indication is that the actual stresses weregr.'er than the computed stresses.
FLEXIBLE PAVEMENTS; PECOMMENDATIONS
The recomendations are as follows:
149

a. Caution must be used in placing of insulating materials withina pavement section. When using the ratio of the laboratorymeasured compressive strength and computed stress, it shouldbe kept in mind that most analytical procedures for computingstress will underpredict.
k. Although consideration must be given to the compressivestrength of insulating materials, consideration must also begiven to the magnitude of the resilient strains in the insu-lating materials and in the pavement material above and belowthe insulating layer. In the absence of other supportingdata, all resilient strains should be kept below those recom-mended for allowable subgrade strains in Barker andBrabston. 1 0
RIGID PAVDIUS; COMCWSIONS
The conclusions are as follows:
g. The rigid pavements containing insulating layers did notperform as expected. The behavior of the PCC slabs wascharacterized by spalling and cracking along longitudinaljoints rather than cracking of the slabs. There were twoexceptions to the above; i.e., subitem 5c, lane 1, andsubitea 5d, lane 2. Generally the observed performancewas less than predicted with conventional rigid pavementevaluation procedures.
b. The cause of the unusual performance of the pavements isnot known. It is theorized that it could have been partlycaused by the slab size; i.e., thick (15-in.), small(12-1/2- by 12-1/2-ft) slabs that rotated and did not bend.It was impossible to assess the effect of slab size to ascer-tain if it actually affected the performance of the pavements.
c. All of the pavements pumped. It is theorized that thepresence of the insulating layers accentuated pumping (pimp-ing may also have been influenced by slab size). The rigid-ity of the polystyrene panels and the discontinuities in thelayer were condu Wre to the development of voids and subse-quent entrapment of water beneath the paneis. Ejection ofthe water and suspended materials resulted with traffic.
d. In addition to the increased pumping potential, the insulat-ing layers do not behave as conventional paving materials.The supporting characteristics of the layers ire less thanwould be indicated by the elastic properties of the material.Several reasons for this were postulated including discon-tinuitiev in the layers, poor seating of the panels, and
localized crushing of the material. In addition, the zeroPoisson's ratio of the material would mean that the materialin the layers would not have a tendency to expand laterallyupon loading. Therefore, thire would be no increase in
C0

stiffness (providing the shear strength of the material isnot exceeded). The crushing mode of failure of the insulat-ing materials would affect the pavement response in the samemanner (provided shear failure does occur) since there wouldbe no tendency for the material to move horizontally and up-ward when shear failur- occurs.
e. Due to the number of extraneous influences, the tests did notprovide sufficient evidence to adequately evaluate the per-formance of rigid pavements containing insulating layers.
RIGID PAVOCEETS; ROC(MMENDATIONS
The following are tentative recommendations for the use of insulating
layers beneath rigid pavements:
a. There should be a leveling course of sand placed beneath poly-styrene panels. The panels should be placed and firmly seatedto ensure full contact of the panel with the leveling course.
b. For subgrades susceptible to pumping (CH, CL, 30, ML, andOL, and S and SC where the water table is high or drainagepoor), a minimua of 4 in. of base course should be placedbetween the polystyrene panels and the subgrade. In thenomenclature used by the FAA, the layer would be referred toas a subbase layer. The material may be a granular materialor a chemically stabilized material meeting appropriate CE orFAA requirements.
c. A minima of 6 in. of base (subbase) course should be placedbetween the slab and the insulating layer (polystyrene panelsor lightweight concrete). The material may be a granularmaterial or a chemically stabilized material and should meetappropriate CE or FAA material and compaction requirements.
d. Although the analyses produced no clear evidence to indicatethat the plate bearing test adequately evaluated the support-ing characteristics of foundations containing insulatinglayers, it appears to be as applicable as any other availablemethod. Therefore, it is recomended that slab thickness bebased on a measured modulus of soil reaction. The measure-sent should be made on top of the base cwurse.
. The joint failures indicate that keyed-and-tied longitudinalconstruction joints and witied-ndoweled longitudinal con-traction joints in pavements containing insulating layersmay be inadequate. Sovever, the doweled transverse construc-tion joint betveen subitem 5a and the transition slab and theuntted--Moveled transverse contraction joints perrormed sat-isfactorily. It is felt that the unusual slab size and pup-ing were probably the primary causes of the joint failures,and that, with normal size slabs and the requiremonts con-tained in recomendations a-c, conventional joint
51

configurations viii be adequate. Therefore, it is recommendedthat no changes be made to current Joint measurements andpractices until additional data are obtained.
f. Additional full-scale accelerated traffic tests should be per-formed vith slabs of more realistic dimensions. The pavementsshoud be constructed vith and without recomended basecourses and with various Joint configurations includingdoweled Joints. In conjunction with the traffic tests, theeffect of the seating of the polystyrene panels and panelsite on the load-supporting characteristics of the layershould be investigated. The effect of bond or lack of bondbetween lightweight concrete layers and the slab should bestudied.
52

Table 1
Material Properties of Lightweight Concrete Mixes
Curing Unit Compressive Flexural Compressive FlexuIR=.Specimen Time Weight Strength* Strength** Mod;lust Mod lusft
No. Days Pcf Isi psi lopsi 0 2Pi
2-1 7 44 145 0.364
2-4 7 44 140 0.649
2-7 7 44 125 0.406
2-2 280 44 150 0.425
2-8 280 44 175 0.482
2-9 280 44 175 0.478
1-44-3 66 44 155 0.568
1-44-1 339 44 150 0.394
1-44-2 339 44 160 0.363
2-3 227 44 370 0.178
2-6 227 44 640 0.256
2-9 227 44 570 0.265
1-44-1C 336 44 300 0.171
1-44-2C 336 44 350 0.207
1-52-4 66 52 195 0.760
1-52-5 66 52 160 0.543
1-52-1 339 52 160 0.595
339 52 165 0.676
1-52-3 139 52 165 0.659
1-52-1C 336 52 750 0.313
1-52-2C 336 52 780 0.297
1-52-3C 336 52 780 0.294
* Determined according to ASTM C 39-713 (CRD-C 144).
* Determined according to ASTM C 78-645 (CRD-C 164).t Determined according to ASTM C 469-656 (CRD-C 194).it Determined according to CRD-C 21.4
53

O. 4 aw~N~t~A Ok
41D.0 $0 2- C& .4n*
hi .0 tn.*~4 4 .4 .4
9: 9
0. U0
-4u a
w Mo00* 0V m
Ii' W,
54

Table 3
Lss~aa of Traffic Test Data for Flexible Pavement Teat
SuitssCta~iniInsulatigkers
maximm maximumSub- Rated Permanent Elastic Maximum Degrepitem Subgrade No. of Deformation Deflection Upheaval of Rating ofNo._ ORj Coverage, in. in. in. Crackiag Itmn
4a 4.2 0 0.0 0.16 -- --
170 1.3 0.36 0.3 Severe Failed2140 1.5 - 1.1 Severe
14b 4.2 0 0.0 0.10 ----
170 1.4 0.28 0.2 Severe Failed2140 1.8 -- 1.1 Severe
4c 4.2 0 0.0 0.0 ---
170 1.0 0.20 0.3 Slight Satisfactory2140 2.7 - 1.5 Severe Failed
14d 4.2 0 0.0 0.06 - --
170 1.0 0.29 0.3 Slight Satisfactory2140 2.7 -- 1.14 Severe Failed
5s, 4.1 0 0.0 0.08 - --
170 0.8 0.08 -- Slight Satisfactory2140 1.0 -- -- Severe Failed
5b 4.1 0 0.0 0.09- -
170 0.6 0.08 -- None Satisfactory2140 1.0 - 0.3 slight Failed
5c 4.1 0 0.0 0.15 ---.-
170 1.0 0.12 -- Slight Satisfactory2140 1.2 - 0.3 Severe Failed
5d 4.1 0 0.0 0.14 -----
170 1.2 0.12 -- Slight Satisfactory2140 1.3 -- 0.2 Severe Failed
55

£fw.twto Oate 0. t rtv..i M temtf.ia
it go. of Waco. 0.etint bessity tab ceeteat peasity Tab
he Cam mad wit% 1. 3 6f tha. 109.1 83.8 ilk 11.6 115.8 86.7s mvest pqt. is 81 16.6 110.1. 81.6 13 10.7 121.6 93.8
W0pol p11011.0. is- 7 -
ciww " with 28 96 11.8 109.5 $3.9 22 16.8 116.5 89.35 N*opot-
*am om clay .1. 88 .8 30.9 83.0 93.2 4.1. 8.2 87.3 93.90ars" 31. 3.1 39.4 81. 100.8 3.8 6.6 8".3 98. I
1.0 .6 3b..5 85.5 100.60 8.8 33.9 84.? 99.0hb1 clamg SMAwim 24h 10 3 - 13.5 116.8 89.5 - 13.0 117.1. 90.0
I ~ po ot -Mad smme
be mleay im with 21.0 1 101. 114 110.9 85.0 130w 14..? 115.2 88.35 pmmt pnt-low coma0
Lishweat es- 9 39 - - - 6 - - -@1010
OEMa mo with 1s 51 18.8 112.5 84.2 18 13,.4 11.8 91.0-pro p.S.
lame eameameaw #I ul . 88 18 28.7 89.5 98.1.' 1 $6.9 88.6 "Jo2ga" 31. 6 30.7 88.* 99.90 8 189 89.0 9.2
So1.hd ie 0 1..5 33.5 81.9 "9.go 5 38.0 85.1. 90.22e IE ia. 21.0 3 i3 1..) 11.1.) 100.2 53 S.5 1W..5 101.7
UMWigaoht ses. 9 15 - - -- - -
4*evelny am 1 to8 6.1 137.8 104.1 t0 9.3 138.8 100.330 so 8.9 116.1. 103.0 16 6.1 134.9 101.9Iom lyrb a 3.6 31.1. 87.5 88.2 3.1. 31.7 87.8 10
31.13 48e 3. 811 9.6 100.40 3.9 38.6 84.7r 160:9s 3A 33.1. 85.0 100.02 1..3 38.0 85.3 0.22
it Crus~hedim.- 11.0 3 48 3.8 Ik.* 101.9 85 8.4 11.6.5 1ot.?
bmeully som 9 69 .9 13".2 1M. 1.9 4.0 11.2.0 191.3180POt polyst, om 11. 1is - 5Grsally seM 2? 31 6.? W13. l~b,0 23 1.5 135.9 101.
39 9 6.9 130.1 go-$ 9 1.0 137.1 185.now slag omb 12 3.6 38.6 85.3 99.So 1.5 88. 90.1. 0.3pgrade 1.1 h.. 33.1 85.? 100.02 4.3 383 66.5 99.1.'
51. 5.8 38.9 86.5 100.64 5.1 31.6 86.9 99.6
0ua troo o CK 12 (ARME P 698-70) Meal. d..1tY senwpinilq to Ol*ld Is"piee voter coc~U.
56

0 0 00 0
*fH *-4 43 *.
000 002
401 1 l 0
"q0
~~~~~ a ~I0 o
El "4
0e4 Ud 84.).4
00 1- H4 C', 0
040~
3 co H N Hf fn H (N
* cm L(
41 U' U' 0 0 0
to4w 0 0 0
0 00 t 8OLI §OWNM g 0If R54-

0 "1 11 0 0 -
4, I
*4 40 12 0% OD
P4* 43$4'4
v 04, 4 U) 0 " -
, 0 4-). .
* H 0 1
\0 to R 414
o-4i-0'
00
'40
c* 2 - 1 4
0 .s
~H V4 IIH I~.00 00000
0 00004,44, 4. .34)
41J gs hso w gs
14 f 1
* 4-
0#58

Table 7
Comparison of Observed and Predicted
First Crack Performance
Lane 1 U Le 2Observed Predicted Observed Predicted
Subitem Coverage s 2re5s Cox Coverges
5a 3000* 30,000 750* T,O00
5b 3000* 400,000 7500 70,000
5C 1000 860 430* 60
5d 0 6,500 20 540
* Joint failure at indicated coverage level.*' No failure at completion of traffic (3000 coverages).
?'

0 "0 4 *l e U N- co 0~r42 4 30 1 0 0 00 0
4-) 000 1000H U$
o0 CAi0 14 en
4.34 1 .1(
0000
0n F- CO* ~ o30 (Ya ~ ~ C 0 - -P- ~
04 000 000
a V-4 0
0 l 00042 0001 to 0
a s t444 0 3
1 P4'
C4 *4 43
r4 10 Fla 10 9 4 41
JC % 44 b 4 CY - - . 0 40
to to +) 0 0000 0000 A"
4-1 1Y4HI "q
Im V -4
41414 143: N
1-4 0000 004-
4144 00
0 .
;6!VoI a 868C0 -r4

Table 9
Comuted Stresses in Rigid Pavement Subitems Containi
Insulati La ers Loaded with Dual-Tandem Gears
Pickett and RayInfluence Charts
At Edge of Slab Interior of Discrete Element ModelSub- Parallel to the Slab Beneath i2-1/2- by l2-i2-ft 25- by 25-ftitem Edge. psi 'heel., psi* Slabs, psi Slabs, psi
Lane 1, 200-kip Load
5a 708 (531)* 430 420 --
5b 565 (423) 359 285 315
5c 936 (702) 548 474 562
5d 827 (620) 494 338 463
Lane 2, 2O-kiR Load
5a 850 (637) 516 ....
5b 679 (509) 431 345 376
5c 1124 (843) 658 570 682
5d 992 (744) 592 -- 552
* Gear was located in interior of slab. For all other cases the longi-tudinal axis of the gear was located parallel to the edge or joint.
o The numbers in parentheses are the computed free-edge stresses multi-plied by 0.75 to account for reduction in stress provided by supportfrom adjacent slabs.
61

INDICATED STRENGTH OF 52-PCFLIGHTWEIGHT CONCRETE = 910 PSI
m0 I
Z INDICATED STRENGTH OF 44-PCFLIGHTWEIGHT CONCRETE - 630 PSI
- - -- - -!
o I ., I , ! .
NT:MEASUREMENTS WERE MADE4) N OTE 9- N CUBES
~400
0II100 II
to 20 30 40 SO g
UNIT WEIGHT, PCF
Figure 1. Relationship between 28-day compressivecube strength and unit veight of the lightweightconcrete (after Hohwiller and lthling2 )
62

SO00
400-
200
: UNIT WIEIGHTP PCF
! Figure 2. Relationship betwee n sat modulus and unit veight~of the ltghtwelght concrete (after Robviller and O~hling2)
63

140
.20~12 ,hbl PSI POLYSTYRENE PANEL.
/0 / 00
60i~ POLYSTYPENE PANEL.
hi 0
404

ILI I I
IL
I IL 0
000-0 1
-1
655
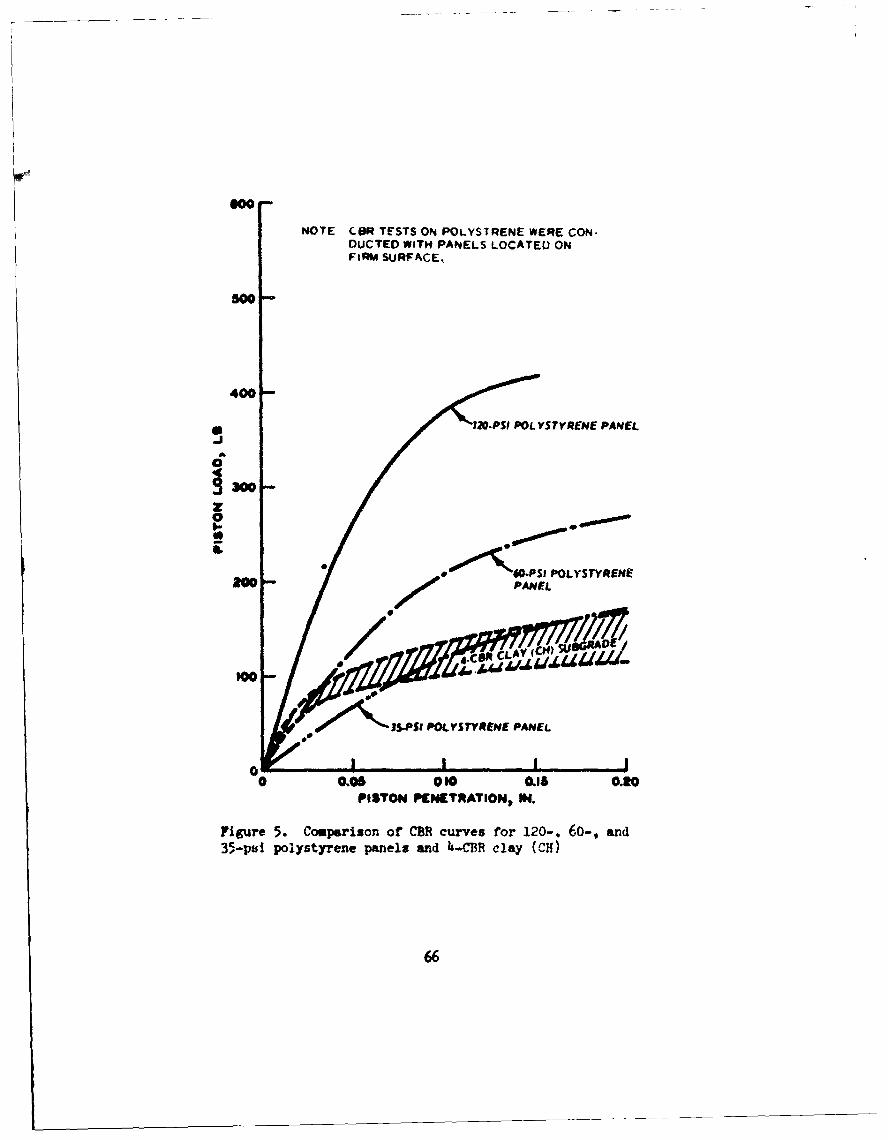
NOTE COR TESTS ON POLYSTRENE WERE CON-DUCTED WITH PANELS LOCATEV ONFIRM SURFACE.,
50
400-
120-PSI POL VSTYRENE PANEL
300
0'1000PSI POLYSTYRENEPANEL
"J ,PS1 POf YSTYRENE PANEL
00
0 0006 0.90 0.1 0.20PISTON PENETRATION, IN.
Figure 5. Comparison of CER curves for 120-, 60-, and35-put polystyrene panels and 4-CBR clay (CH)
66

0
0 10J3 rq I4U I I 4>
a . .40
U ItI~ I 0IC
J 4c~ V0-~1 I I JLI L- 0U'
ir aV 4IA .p
.3' -E J
;~ £ 0
II-
I.- 02 ~ ii U 4 1IJ w
* N N
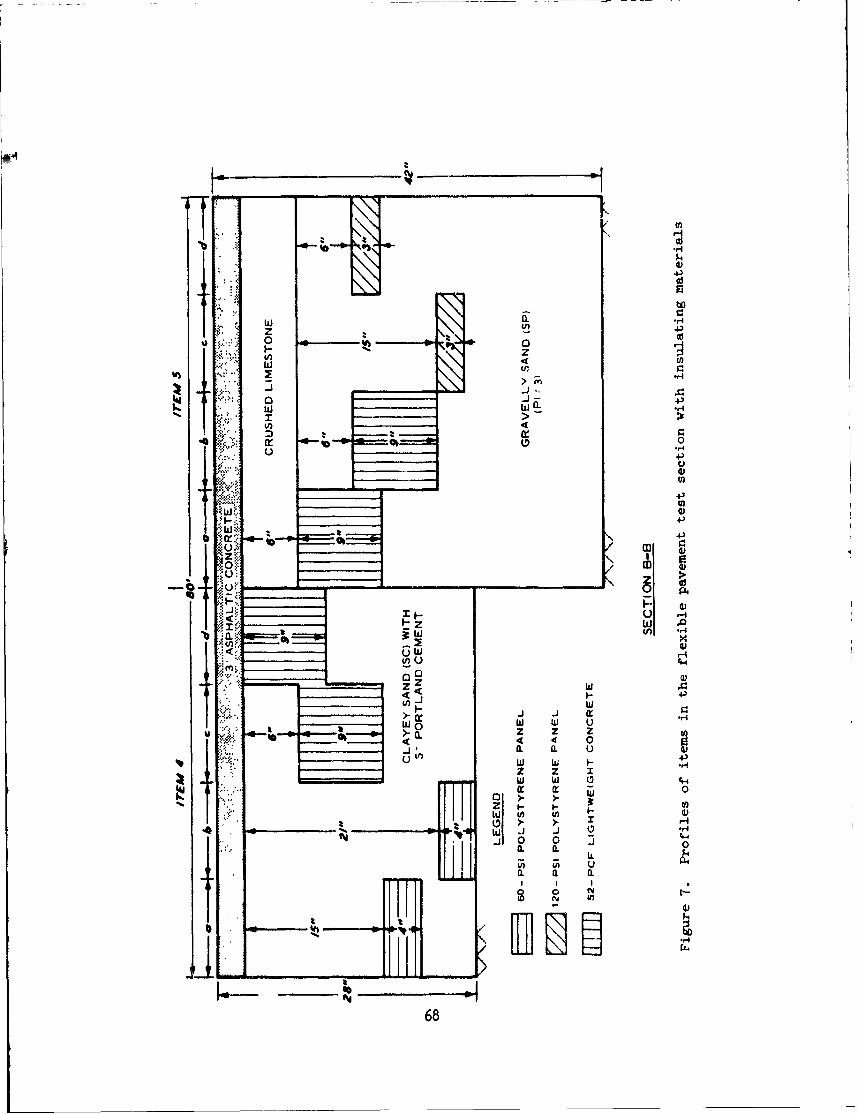
Yj 4j43
4
L343
zz - -
U~ 43
to 0
U) V))- > H
a. a-o C
4y in4
0. 0. r4
w wf 4
68 .-

VERTICAL STRESS, PSI020 40 80 80 100
ASPHALT IC CONCRETE (E 50,000 PSI)
CLAYEY SAND (SC) WITH 5t. PORTLAND CEMENT (E - 0,000 PSI)
10
20-6-1
Z POLYSTYRENE
S30
0 ~CLAY (CH) SUBGRADE (E75,000 PSI)
40-
50-
0
Figure 8.Vertical stress distribution in i.tem 4withoutinsulating layers computed with linear finite elementanalysis
69

VERTICAL STRESS, PSI0 20 40 *0 so 100
~~~SPAtIC CONCRETE (E =50.000 PSiV:'...
CRUSHED LIMESTONE (SW-SM)[EE f (-)
I0GRAVELLY SAND (SP) EE f0')
20
000
0
CLAY (CH) SUBGRADE (E =5,000 PSI)
Figure 9. Vertical stress distribution in item 5 withoutinsulating layers computed with nonlinear finite elementanalysis
'TO

Figure 10. Pattern for placement of polystyrene panels
in Insulating layers
71"

- RArF1C LAtEDISTANCE FROM CENTER LINM Or TRAFFIC LANE, FT
NOPTH SOUTH
0 4r V 4 *0,SPATC
F-11
,3 _IF,.
1
V4A A J M
Figure 11 11 TeA pi prfile oV suieflexibl pae 4n test ection. StWio 1+2Afte 24 oveae oL Itkige-he
aaq PHsembly 9 4,
72 6V 1

- Tarric LAWOWICE FROM C(NTER LOK Of TRAFFIC LANE, FT
NWTN SOUTH
& 1,30,, & 04, w 1 ,
44NINFT 19-
A.b .4.IS --91 1q4'
F~ue 2 es i poiVq fsuie 1 .cflexible pa wet tst -et~n - t-t-o- - +- 5after ~ -- 2-. c-eae -f -0k -n-e-w-ee-
asoemblyMSTW9S

- TWIC LAWUUC FMM CECtER LM~ OF TRAFFC LANC , FT
Nw"I SOUTH
II
Figure~~ 13 'es it4 ieo'abte afleziblpavemnt tes eto.6 Sion &4 6
after,4' *i0 4oeae of 50ki 4inAle-veA44s.se Iblyd
14 r 4 &6

- T*MF/C LAWEDSMCC UNOM UINTO LIKE Of TRAPFIC LANE , FT
WrH SOUTH0 2 4
SURM a Afr2A imp, r Alac A v
P A 44 AASPHALTIC, 43
A 4 4Pv
4A~,S A.~.t V VA vIV& Va-. A...
A4 r -1
V .CRSq LIVTN (S-S).-
LIGI4 4 7-GH & ONCRETE'a0
IV $
ga
flxil p Lve.: WEGH CONCRETE
after ~ ~ ~ ~ SN 21Cqs,:p):'-:. ~ e
after 1yC

6001
doo0000
400- 0
/tSUIITE Sc. 120-PSI POLYSTYRENEJ (INSIDE 8 OUTSIDE rAFFIC LANEI
j 3W
z0
IUSIDE TRAFFIC LANE S0PIE POYSYRN
/ USD100FCLN OPS OYTRN
NOTE: CON TESTS CONDUCTED ON POLYSTRENEPANELS IN PLACE
OJ0O03 0.15 0.20PISTON PENETRATIONS IN.
Fioure 15. Load penetration curves fromt Cfl testscondued~ on the 220- and 60-psi polystyrene insubitems 5c and hag, flexible payment test section
76

3500
LEGEND
3000- 0 TESTS INSIDE TRAFFIC LANE0 TESTS OUTSIDE TRAFFIC LANE
N.OTE TESTS INSIDE THE TRAFFIC LANEWERE CONDUCTED NEAR A CRACKIN THE LIGHTWEIGHT CONCRETE.
2500
J 2000-
.0
z
0
0 005 0.10 0.15 a~20 0.25PISTON PNAIO, IN.
Figure 16. Data points from CBll tests conducted on lightweightconcrete in subitei I4c, flexible pAVcment test section
77

3500 //
/1>..--0o
3000//
2500 I
IIoo-
ii /
00
~LEGEND
Soo 9 TESTS INSIDE TRAFFIC LANE
0 TESTS OUTSIDE TRAFFIC LANE
0o0 00 010 0.15 020 025
PISTON PENETRATION, IN.
Figure 17. Data points fro,. CBR tests conducted on lightveightconcret.e in s,;bitem ,t, flexible pavement test sectlon
78

1" (rci rrtc-k,; ina jO y~ltyr*,. " : ifls;utbi ),a '1, £1lexible IpfvCufleft te,:t. ect ion
79

Firilre 19. Cra~cks IL P(1Y:-.tYreri parnels in subtTr 14b,"XI lb It v avement. tf ;f oe,:t !on
FIfgure "0. Cr'ackoi In I'l.ghtwcI Flit concrelte in aubitem i Idanid 5ai., I'lexible! pavement tet~ rootion
80

I2,r 1 Surf C,2 of polystyr'ene pan~els in subitem 5c,flexible paement t~est section
-'igure 22. Surf'ace of polystyr'ene paneis ;,n subitem 5d,-~Ibie Pavement test sect,ion

,~
Figure 23. Initial distress atk t"ransition betweensubiltems 4a a nd (Ib, flexible Favement test section~
~--AA - = _ULf i.RagiWI
Figure 24. Crackirg at transitioi 'between subitems 4d:I.5,1, flexible pav!eet. test sectirn
812

K -- Trf1fC LAE
NORTH DITAC ftOM CENTER LINE Or TRArFIC LANE . T SOUTH
STA 1 + 25 SBTEM 4a.
STr135 SUBITEM 4b
13 540 I +RG(
183
I:Sql+51 U3TM4

600T ~SNG~FAOU C~nTE LINE OF TRAFFIC LANE , T $OUT"
-S1+54 JIITEM 5*
WWI
*lr 26 ass s ~ n nsbta .d
flexible pavemnt test sttion

JAI-
Figure 27'. Longitudinal cracking in subitem 5c directly aboveJoints between polystyrene panels, flexible Pavement test section
Figure 28. Condition of subitem 5r t iasigned failure,I'exibic pvement, test sec tion
85

7T ~
Figure 29. Condition of subitem 5b at assigned failure,flexible pavemcnt test section
86

0)0
0.
040
4 0z0
o
> i
IL, I . *>01 ILp Z *
41 W0 0
JLi 4( 4.K
Iii0
-r4
04
87S

POISSCN'SLAYER SECTION MATERIAL MODULUS RAT!O
0 1 ~ ASPHALTIC j30.000 Psi 04
2 .i LIMESTONE 37.000 PSI 0.35
I0-
3 .. .. 16.400 PSI 0.20
d- . % .~ GRAVELLY~ SAND
20 4 8 .700 PSI 0.20
3 50 PSI 0.0POLYSTYRENE 350PI 00
30 GRVLY 15.000 PSI 0.20
40.. SAND
t .. ;*. 7,900OPSI 0.2040 ..
SSUBGRADE 3,000 PSI 0.40
Figure 31. Representation of the material characterizationfor subitem 5c, flexible pavement test section
88

POISSON'SLAYER SECTION MATERIAL MODULUS RATIOASPHALTIC 1 30.000 PSI 04
I CONCRETE 500.000 PS 0.4" * . . 4 .
2 " .;, E CRUSHED2 LIMESTONE 22.500 PSI 0.35
" *0 .
S " " - GRAVELLY
- "000. SAND 800 PSI 0.20
41YROOAM 3,500 PSI 0.0020 .,° *
20... 1 Z-PSI 22,000 PSI 0.20'".•". POLYSTYRENE
- - .. - .-
S*. •.* ". e19,500 PSI 0.20
' . GRAVELLY30-' .... • . SAND
7 .0" 13,500 PSI 0.20
*P• "* " * "" .* .0 * 0 "(
.* -. 7.000 PSI 0.2040
SUBGRADE 3.000 PSI 0.40
Figure 32. Representation of the material characterizationfor subitem 54, tlexible pavement test section
89

NORTH4 DISTANCt PROM CCNTtfR LINE Of TIRE, IN. SOUTH
40 20 0 t0 40 so so0.2 I
0
-0.42
4020 0 20 40 s0 so
0. 0
-0.4
LEG§ND
a 0 COVERAGES MESUE
0 170 COVERAGES I
- COMPUTED tE 5 $00,000 PS11
COMPUT ED IC1 20,000 PSI I
- COMPUTED CURVE ADJUST ED TOCORRECT FOR ASSUMPTION THATDEPTH OF SORGRAOE IS INrINITE
NOTE MEASUREMENTS TAKEN, JAN. 1973
Figure 33. Compaison of measured and como tddfetosfrsbitems 5c and 54 whe~i loaded with a 50-hip single-wheel assembly
g0

VERTICAL STRESS, PSI
10
20 GRAVELLY SAND
I' POLYSTYRENE PANELS, SUBITEM 5D
20- 100, URIT 5DGRAVELLY SAND
40
CLAY WBJGRADE
so
60-
Figure 34~. Distribution of vertical stress beneath centerof tire with depth for subiteus 5c and 5d, summer conditions(E1 30,000 psi)
91

VERTICAL STRESS9 PSI0 80 40 00 so 100K-COt4CSE.-ato ~GRAVELLY SAND SNrm5
2 - -U IA 50 GRVEL -SAND-- -- --
POLYSYSTRENELS PUBELS SCBTMS
GRRAVELLY SAND
- -- P LYENE PAE 5 SBTMC
so--
oo
Figure 35. Distribution of vertical stress beneath centerof tire with depth for subitme 5c and 5d, winter conditions(E1 500,000 psi)
92

VERTICAL STRAIN, IN./IN.
0 O.OOZ 0.004 0.006 0.008 C.010
ASPHALTIC CONCRETC
ICRUSHED LiMESTONE
10- ,o II GRAVELLY SANDI
r FOLYSTYRENE PANELS. SUBITEM5D
20 GRAVELLY SAND
POLYSTYRENE PANELS. SUbITEM SC
X 30
GRAVELLY SAND
40
CLAY SUBGRADE
--- SUBITEM SC-- 1-S ITEM 5D
0
Figure 36, Distribution of vertical strain beneatb centerof tire with depth for subitems 5c and 5d, summer conditions(E= 30,000 psi)
93

0.010
NOTE: NUMBERS REFER TO CURVALUE FOR MATERIAL
0.0
3.2
I
0.o0a
00 000 0.004 *AN$4
RESLKENT STRAIp W./4.
Figure 37(. Relationship between perma-nent strainl and resilient strain forclay subgrade
914

9 -4
wCt2
041-4i
-H4)
C- 4)1-4
43-40
P. 00 ~H
/ 11 1-,4
/ 0+
d-~
NIVVIS~~ ~ ~~ ZN11A 004)I L~VV41J IV95/
i ............

STRAIN, N./I.0 0.001 0.002 0.0034 0 '1 ..... -400
RESILIENT 040STRAIN
" "PERMANENT STR.AIN
o
To --
Figure 39. Comparison of resilient andpermanent strain in the subgrade of sub-item 5d, flexible pavement test section
PUEMANENT oErORMATIOIt, IN.o 0.02 0.04 0.00 0.00 0.10 0.12~40
O-- - -
so
70 -
Figure 40. Permanent deformation withinthe subgrade of subitem 5d, assumingzero permanent strain at 120-in. depth,flexible pavement test section
96

rrfiX uL-~-41
V4Z z~ .. *-%
I" w 4
3K -Iz 2I-- W-- - --z D1~ OW9.. ~ ~I * Uo
lo - -TT±. ~ NO0M'
Iu r1,
0 0
so t a.-
io !;Y±z w
a -U 0
lie h
97u
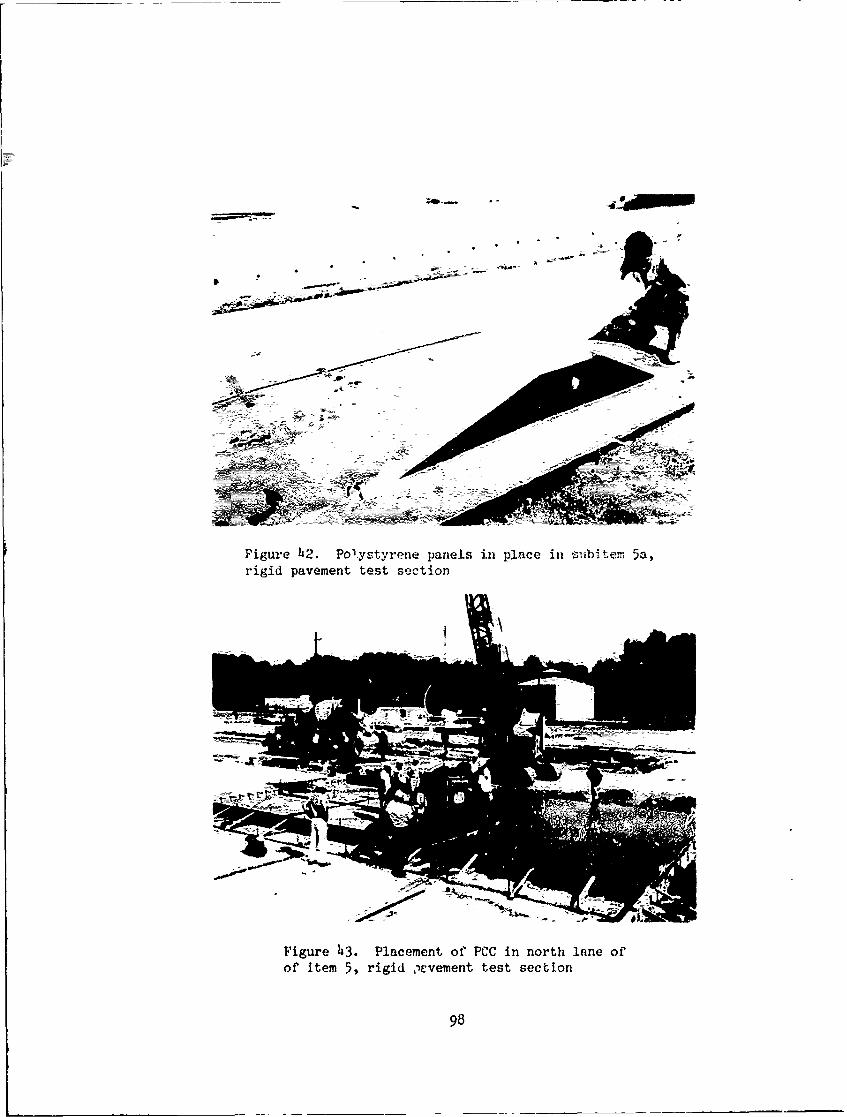
6:F'igure !42. Polystyrene panels in place in sb 4tem 5a,rigid pavement test section
Figure 43. Placement of PCC in north lane ofof item 5, rigid -wvvement test section
98

WM--
rs*.
D (EP*ddED TIE-MA"A S.
At OPL C TO C
KPVLZ -TIEo:OINT it
Figure 44.* Details of 'krt~nlcntuto on
99

a 0 C
a AfibLAt7 -
z4:
-T - --- '-
J8 U
~=Iy J.L.M
it *4771dl(iT
LANE 4.20K)ODN .LAE2 4-I ODN
.040-ASOCIAED CRCKS MELOW4
Figr 45443-k4vlpen niem5 ii
pavement~ tes setio
* '-till U

s CAW -Z N AWPV -. WA AW --- LA~
so. - " Dow MO )t as 900 Ile Poo A" 500 J" a" . sft
to SV 2#4 _ _(TI S.f
I 4
I I p_ _ _ _ 4'
*CST CWC i
Figure 4s6. Surface deformation in subitens 5a. and 5b,latte 1, rilgid pavement test section
101

age tooe W 41
STA ~ ~ 71 '-fS~~ STA_'244SU9ITEM 54
as ' --- s,-Rf-
Fi.,~.~ tr 7 uplrLekefrm-o. insbies can d
~~--- ---- -- ~
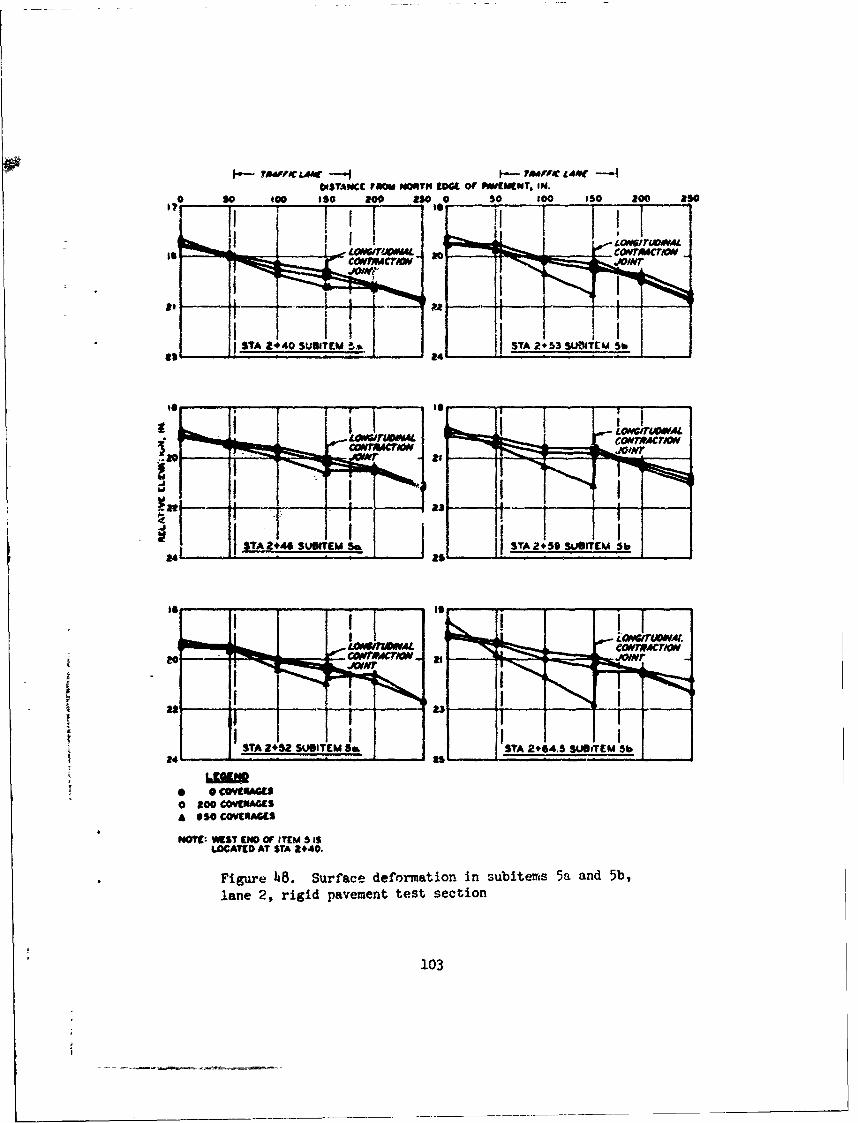
~-- A~'IlC ~tE f h- rar-c LAMC --1DISTANCE rfbw POfY OR G to or11011CWT, lid.
0 so too ISO t0o n50 0 so 100 IS0 200 ISO
STA 2440 SUSITM to^ STA 2. 53 SOI TCM 5b
a2 -
- ? f 46 SfWEM L T 45 UITMS
STA 2+52 SUSIT EM U. STA 2+1SA.5 Susi TEM Sb
0 800 COVCUAGCSa 050o COCRACS
"Mr: WEST END OW 11WM 515sLOCATED AT STA 2440.
* Figure 48. Surface deformation in subitems 5a and 5b,lane 2, rigid pavement test section
103
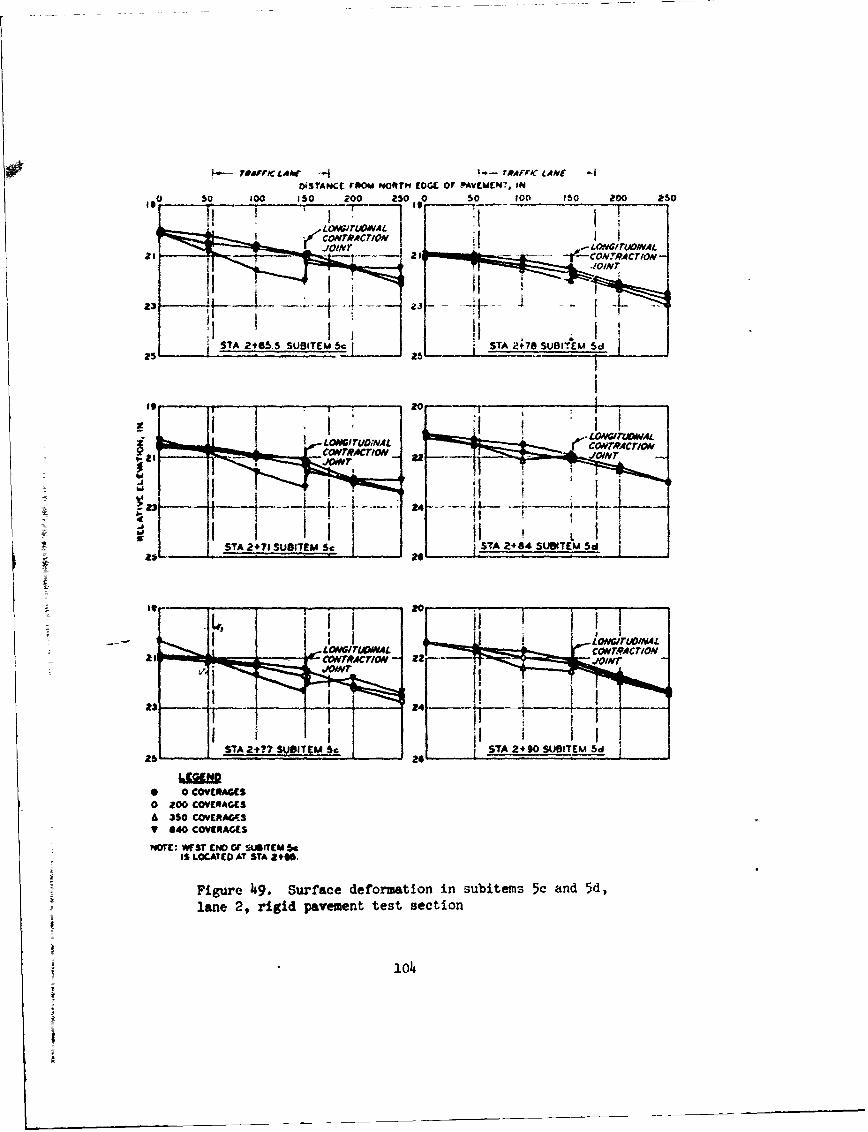
0.4 ~FfAC LAP. 4fois1AwcC rom @#0RTm EDGE Of PAVEMCNW, IN
o so 100 150 200 2S0 0 #on I0SO5 200 250
fI Io~ 211 '60T41r;NVA
STA 21. SUITEM Sc STA +8 SUBeTEM 5d
25C-V 6 flA 25' 1
ON 0 COVZRAGC
J 0401NNGE
101

-- at-
7>7
- e-!a I
105

WO-
TW /
- N

Figure 514. Condition of subitem '-a, lane 2, 950 coverage-s,rig.id pavement tes, section
U 24--
Fig.,ure 55. Condition of subitem 5b, lane 1, 3770 coverages,rigid pavemecnt test section
107

-4-t
- ~=> -
Fiue 7 Cni~rtio fsb m5,ln ,90cvrgs
rigid~ paeetts eto
108Y

F - 4-t c
~-4
---s'A-7tA
Figure 59. Condition of' subitem 5c, lane 1, 1000 coverages,rigid pavement test sectiion
j109

A'
Figure 60. Condition of subitem 5c, lane 2, 8ho coverages,
rigid pavement test section
-
Figure 61. Condition of subitem 5d, lane 2, 1770 coverages,rigid pavement test section
110

A~ n5;-
IN i mFigure 62. Condition of' subitem 5d, lane 1, 3000 coverages,rigid pavement test section
Figure 63;. Coriditlon of' subitem 5d, lane ,no coverages,rig.d paveme~nt test section

Vi, tre 64. Condition of .subitemn 5d, lane 2, 350 cwwrerages,
rigid p~avemnent tezt~ section
112

II 00aI.
£ 0 Ac. 4-)06
10
-0
000 0 cji
--...--.- J _______0
2 ? -
qh.
0 44
14
113 1

AC 4-- ! 3-- ~ l u= 120 PCI
OzI I __a___I
0 606 010 0.9 0.80 0.25 0.30
II-]' 77
'PCI
SO [.7> .- ..- 4 __-
LM4EE LAN PLVI N
• Ofts oCLIO OAS .o o.25s 0.30
I I0 OOS 010 0.16 O.8O O.2s 0.30
AVCMW KV- LECao% IN.
@WCt 16& TIC uaOA.US OF sonL RACTsl #4 POL'is CUNc W.MV UNCOMSA * MR SAlUeATMiI.
Figure 66. Plate bearing tests, subitum., 5c and5d, lanes 1 a.d 2, rigid pavement test seot':on

So Sb 3d
i.. PC/ e
A-0
EZ 35-PSI POLYSTYRENE
120-PSI POL.YSTYRENE
SLIGHTW!EIGHT CONCRETE
V LOCATION OF PLATE SEARING
Ma CEMENT-SrABILIZED LEAN CLAY
Figure 6T.- Location of pilate bearing tests initem 5, rigid pavement test section

-- m -
br$
Figure 68. Condition of 120-psi polystyrene panelsalong longitudinal construction joint in subitem 5c,lane 1, rigid pavement test section
Figure 69. Test pit in subitem 5b, rigid pavement testsection, illustrating differential deformation in light-weight concrete along the longitudinal contraction joint
116

CI'
Figure 70. Test pit In subi ,em 5b, r;iFd Da1rmenL tes sct=illustrating -pumping ofc 1ay subr'n'(e thrnug-z crack In light-11weight ,oncrete
Figure 71. Cfondjjl t n: 2r ,ivy'w"r. nig
I~~ ~ ~ i*' tdi i

tL
z0
u-1
0 :
zj W 1-4ww
(3 M W Q_ _ _ _ _ w_ _ _ _ o_ _ (r~48
"r4
0 0
ma U
0
-4
-. r4
U
_ _ _ _ A _ _ li_
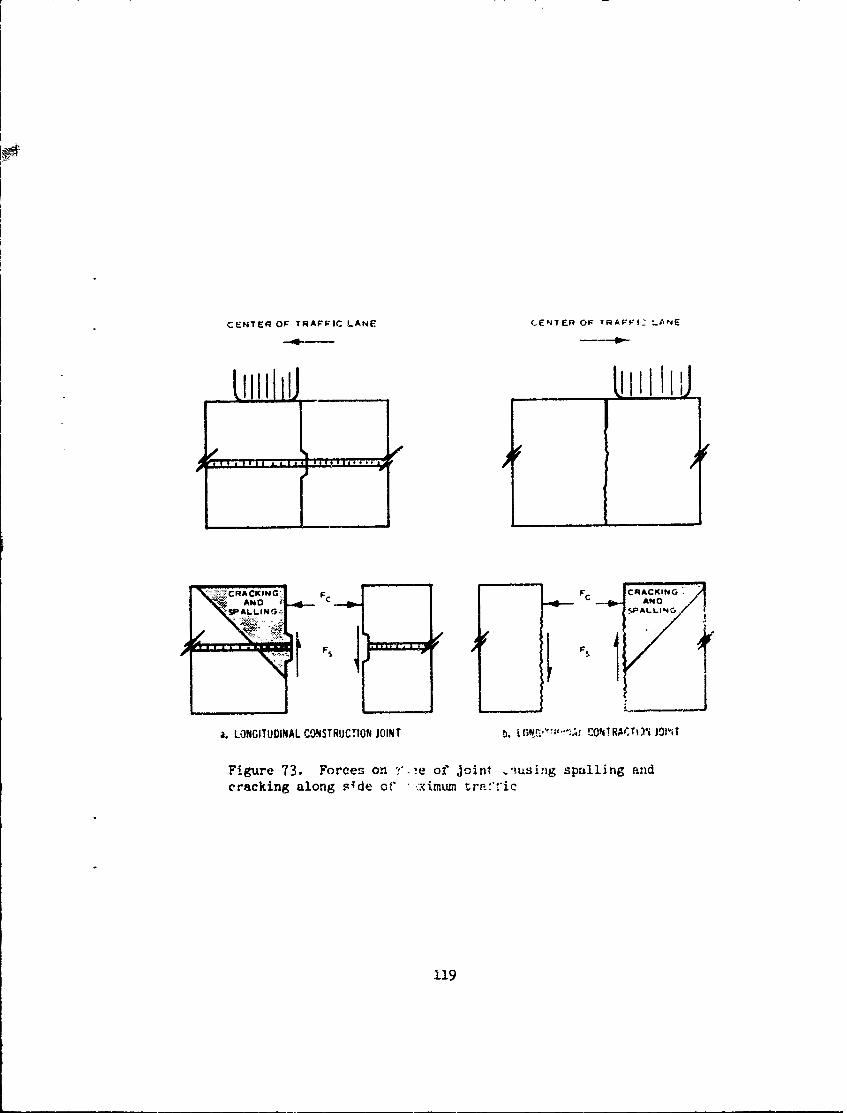
CENTER OF TRAFFIC LANE (-ENT7ER OF TRAFFI>- L-ANE
-CRACKINTG Fc FC CRACKN
WAL N SP AL.LI-40~
aLONGITUDINAL CONSTRUCTION JOINT b. Tf~~ ROWARCT i J01'1,
Figure 73. Forces on -,'.!e of join*,tusing sprilling andc'-acking along s 4de of - :ximuxn trn:Tfic
119
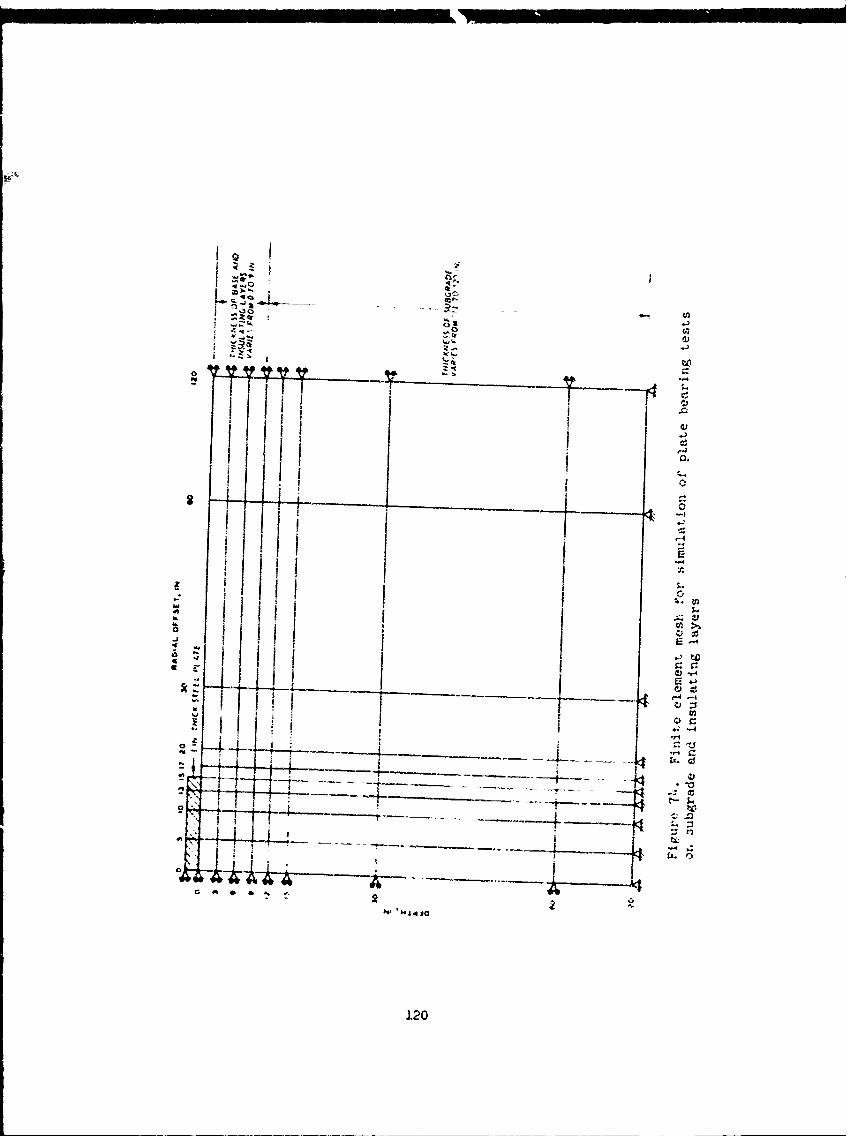
IIIQ 1
r -o,-
I 4IO .
i I !--"
~~0
j .3.
J..3
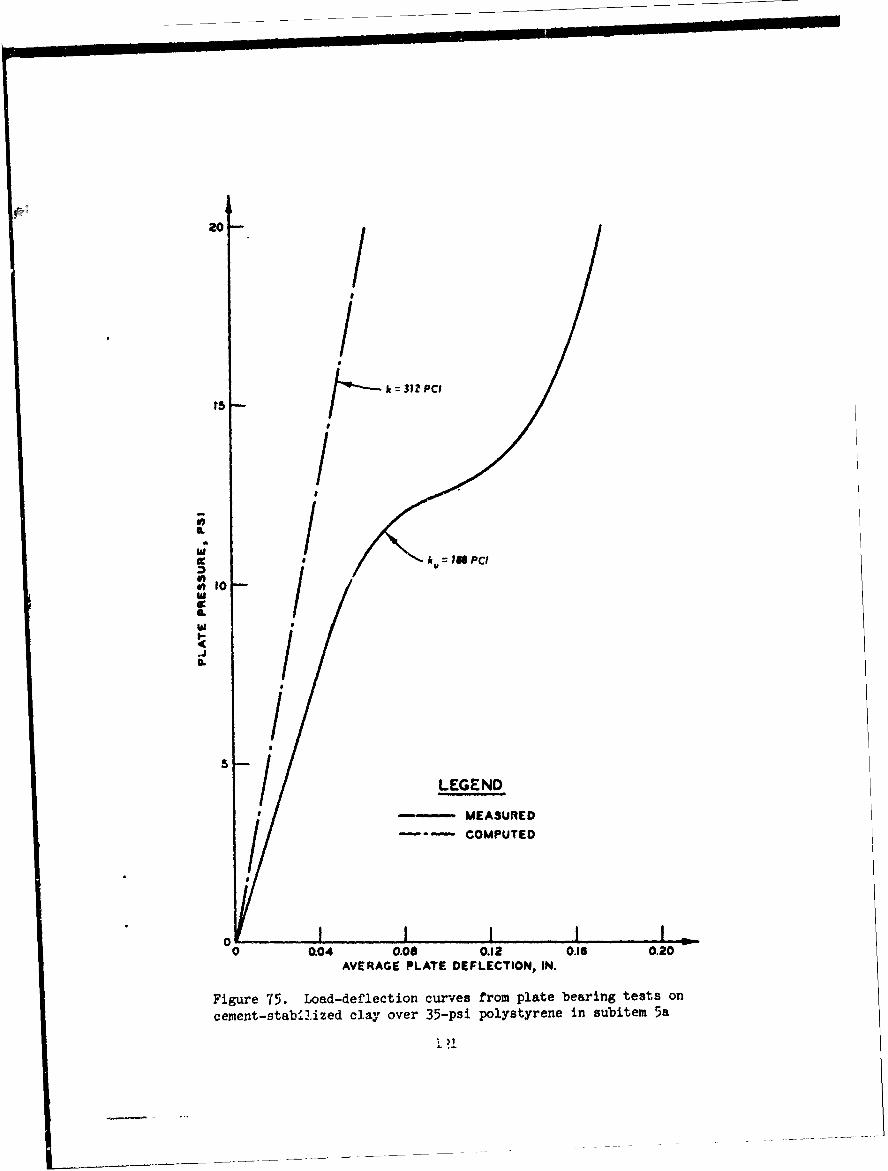
20 /
It 312 PC$
*k & in PC/0) lo
ILI
W I
LEGEN
- MEASIURED
000.04 0.00 0.12 0.16 0.20AVERAGE PLATE DEFLECTION, IN.
Figure 75. Load-deflection curves from plate bearing tests on
cement-stabilized clay over 35-psi polystyrene in subitem 5a

k =97PCI
II/
I --
1 IO--
gO/ "I' = P
CORUCTED PON PLATE KNOW
k.= 55 PCa
NOT CORRECTED FOR PLATE KDING
LEGEND
- AiURED-" - COMPUTED
00.0 OA 0.03 0.04 0O6AVERAGE PLATE DEPLECTI0ON. N
Figure 76. Load-deflection curves from plate bearingtests on lightweight concrete in subitem 5b

• ./
ie°I. 02 5I3 pa"
AO COCED O ~ON INEAILY
COMPUCTED RPJEIERL
0 ~~~ OAS 0A0S.150.0ED2
AVERAGE PLATE DEFLECTION4, WA.
Figure 77. Load-deflection curves from plate bearingtests on 120-psi polystyrene in subitem 5c
12.)

20 / /
/SUM TEM d
5123 PCI
/~SUIMTEOl
I0 / = 1P /
$K /
..--omCOMPUTED
0 / 0.10 O.IS 0O0 O.2
AvaRAGI[ PLATE 0,9L[ElCTHON, IN.
Figure T8. Load-deflection curves from plate bearingtests on 35-pli polystyrene in subitem 5d
h.i:
4 U i
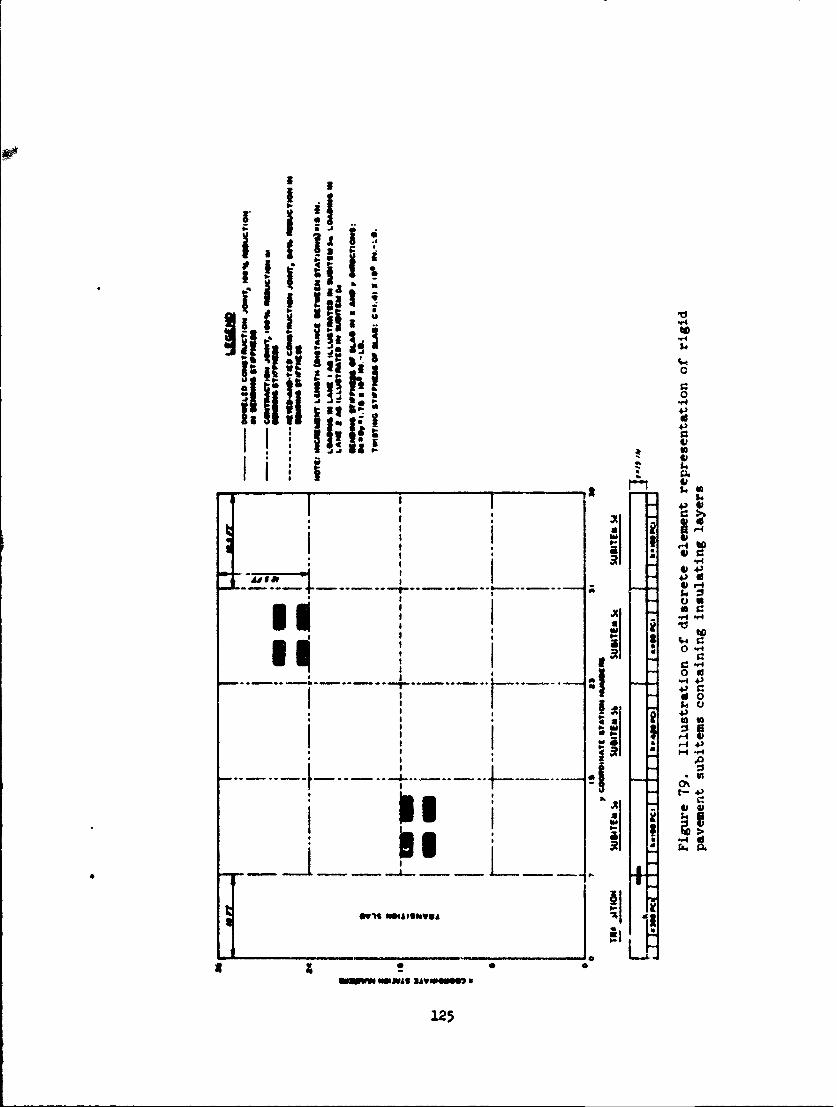
lk 0
4
.43
0 f
4U
44,
4,4)
4168N mel$"Moo
125r

AAt ULL Covs
q fA!~ ii#-4w06 r-4
~; b' 40j -P4
~j!3i 0
:1: ~*ir4
$.4)
I 0.04
4-14
'1 99N
r.4
43V
-4)
1. 44)
t
40 43
126

NO"" DISThMCC FfOOM LOISTeUoNAL jOIWT, FT
as ao s 0o
0 I'sII I
A\4 tt )W3""X%
C-AfW ASI~ydf~
CW"U Iro LU~fIP I?, 00,FmLAM
Of SOL RtACTIOS vALUES IXMItOACOWtLMPOF tRameI
Figure 81. Deflections for subitem 5a, lane 1, alonga~ transverse line through two of the wheels
12T

W~*Acg FU@WM5 S owO ?0Se SkAS, ry
- LffWKm OF w RO am$ Ulot~au IN w~a 0 lf$"e oV
Mom a"1 A
tw~~m
Figuare 82. Deflections for rigid pavement subitem 5a., lane 1, alongthe longitudin~al construction joint
128

OT4 ISTANcr rom LONGITUDINAL JOfN? F suTas to is 10 5 0 5 10 is 20 Z
0 Of -
0 04
000
0 010 -j~
U
44
0 Is'54CIOMA
0 0 ICMLITI
O0 CIWIKIUU? -2 -3 F L
NOU MVUEC?.ALSNA T&*WAK LOINSW
BIKM?( tLIES WML INM l A~ft MAS(LUAICMITIS~ OSS SIALKS
0 22 TWIRMUOMMV(C Ca"IIUWSLO119WOVOMATIOW"v.1*5 agAr
= OFhS ISFIC
0 14
0 1.01
Figure 83. Deflections for rigid pavement subiten 5b, lane 1, along atransverse line throughs two of the wheels
129

BEST AVAHp'Br COPY
DISTANCE FROM WrST [0~0 OF 11ANSMVON SLAN, 0 10 3 to 15 20 25 30 35 40 43 so SS 0
0 I I I --
C. 02
0 04
006 -(
-J4
S0 90 - o"INCtTolA
-a 0 '2 - 9116FLICTIS a3-15IpiiMA
0 94 1UT3?R0VEa
To"ho MSU I IUA*T LOF TNLI:P U31 t Zuu IT
0 IS
8 1111 F I
Figure 84~. Deflections for rigid pavement subitei 5b, lane 1, alongthe longitudinal construction joint
130

K-i
20 0
% 4.
z00
0 06
0
-J J" 0 14 00-w
0 0 6 -
IT iiSINOM U IMM.AFt M
OW~ AV an TO m NO
ZO~J (Lm TIAbW
2 u
Figure 85. Deflections for rigid pavement subitem 5b, lane 2, along
a transverse line through two wheels
131

ES i A iir
"c7
47t
iff
%*i- T- WV i tXZO !
Figure - A ._e____ '
_"
r -- pt-__'
132
a a
thei~ ---iu a cotrcto Joint
132n '4.s 'ca

ORhDISTANCE FROM ONGITU0IUJAL jOINT, FT SOUT04to 15 io 0 5 10 20 2
004
0
I-V
- 0 :8
0 ;2 cwfwj }
04
0 is
Figure 87. Deflections for rigiiJ pwarereil %b-na~ transverse line throtigh two whels
133

t, av &O S 31 IM do 45 so so
amon 9MSWR- .Acw0 .0/
I
Figrure~ je o i1 ane I,~ along
13'

NOTHS:TANCE FROM LON4GITUDINAL JOINT. * T SOuTm25 20 is 90 5 0 6 '0 is 20 2S
0
0 02/
0 04 Od
0 06/
0 08
0 go CONACTION ANIT
I~j\/ t~j~ CONSTUtIO OIT
Y 0 MEASURED DEFLECTIONIS
0 12 - COMPUTED OE!LECTIONS - 1h' - 171 FT SLAMS
CO PUTED DFLECTIONS - 25 -25FT SLAW
I 1~O 5111(11 OF THE DUAL-TANDEM ASENKY FOR0 14 IDISCRETE ELEMEWN WAL 31112S 2$VT $IU1101
L.OAD WOULD K LOWAED AT CENTER JOINT INICH> WOULD K A CONTRACTION JDINT RAThERt THA A
CONSTRUCTION JOIT ANO THE TWO CONTRACTIONJOITS SMORK WULAD KE FLINNTEO MEASURED
* VALUES TAKEN PRIOR TO TRAFFIC. COMPUTED0 IS VALUES UASED ON OIULUS OF SOIL REACTION VALUES
i MEASUSED AT COPLETION OF TRAFFIC
0 20 I1
0 26
Figure 89. Deflections for rigid pavement subitem 5c, lane 2,) along
a transverse line through two wheels
135

Li hVru LAL. L' ~.i
WSAWCf r*O0 *CSI (W~ Of TRANSIT.ON $LAII, F,
0 5 0 5 20 Z5 30 35 40 45 SC 55 so
I Ca
0 10 /
04
0 to0 0 *MuIOWUcTSS
20 - WE~ COM MLSKFUUMSANt AIC ME LOWTINGSAI.CWTVAM POIN MANNU VAUS ANf ALONGME
oO IINA aMSo N I I AE N?4A IS 1'AI 0IM I IL A A TT
ME OOSLuc~WAI U:AIUif@ low foo ftic~i ftVM TSW 011 si MIlN
02 ALON ff020I01 0W3 M TMI"
Figure 9. PetlecioNIAKI ?WE rUii avee subite Tican , lnthe longitudinal Contr!10 VAot joItAQ
0 Z4- MITOIN:CWVII VLUE "SD 136U
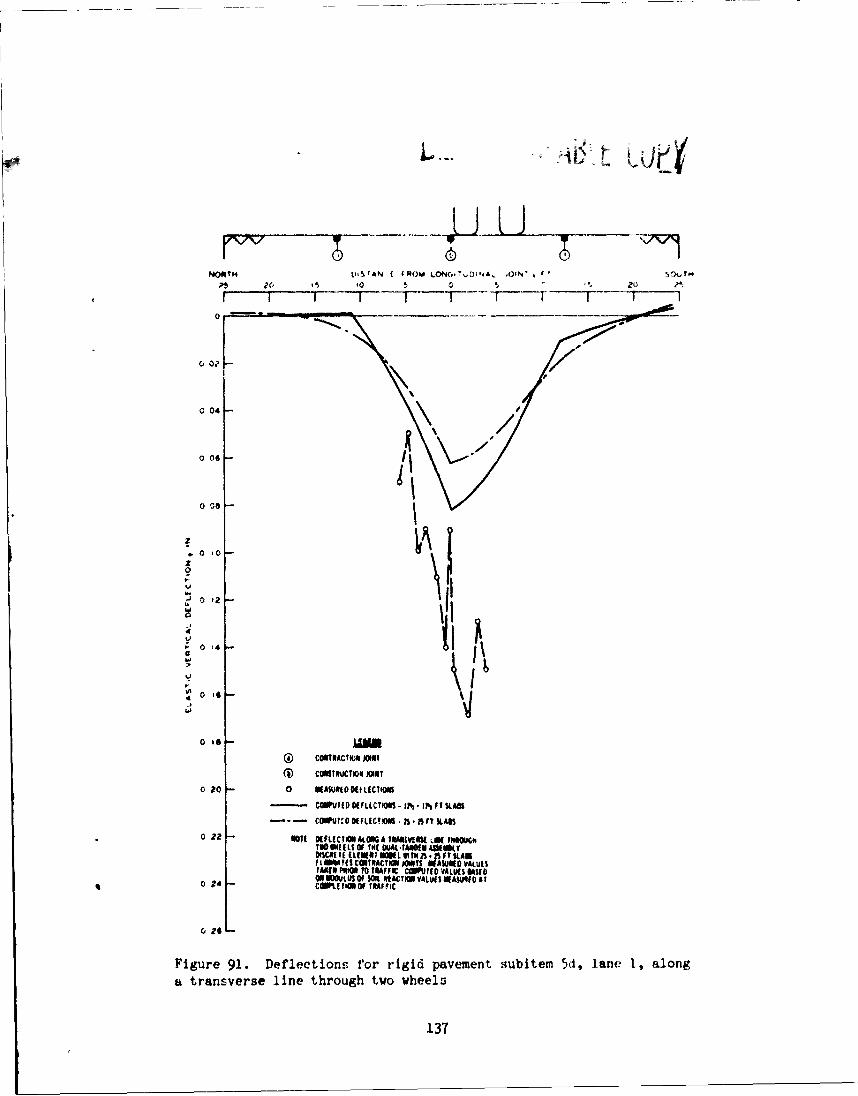
CNSrM ( FlOM LONCT,D,.A ()-N- S 5
0 OfG
0
4aWM vki
® Cmh1RACTION JOI?
o 20 0 hIA$*IOOCLEC?101
- COMPUTED CRFLECTICSN - IN - IN% It UAW
- - CONU?DOO LECuI S - 15 f7 KI$~h
0 2- NOTE DEFLECTIONALONGA T *NVtUA .W[ INO~
PUSREItI ELE~MEN 101I. I S FT KAUFINM ISCONIAVtuON)S g UANNjOlVAUISTUISP*WY T RAIFIC CWJ4D VALUltSURDONuio OLS O $1 tACIMVALUf$ WAWRO AT
0 24 COPL t"O aTUtMFIC
Figure 91. Deflections for rigid pavement subitem 5d, lane 1, alonga transverse line through two wheels
137

...L.. % U
DISTANCE FRMo WEST iND OF TtANS#TION SLAS, FT
a S to 1S 20 as 30 3 40 As So i 6
0 | ..I I. .. ..
O0
o 04
0 ~imim* mziniim
o s awm I LICIm I- MtW tLMIU - A - A I AS
0
61 mUI~tal A l iSIIIS tlW M
0 IOL
Figure 92. Deflections for rigid pavement subitem 5d, lane 1, alongthe longitudinal (:onstructton joint
138

COVERAGES
0 1000 2000 3000
0.1
z0
I..
00
0 JOINT FAILURE. MEASURED DEFLEC TION
W000000A joiNT FAILUjRE. COMPUTED DEFLEC TIONoCRACK(ING, FAILURE, MEA~tiRED OFF LECTION
V ::RACKING FAILURE. COMFUTED OFr L.EC.TION
o NO FAILURE. MEASURED DEFLECTION
o HO FAILURE, COMPUITED DEFLECTION
0.3 --- I
$ Figure 93. .1*If defle!ction versus coverage level fo rigidpriveinent subitens vonilnaining irtsulaLine laiyers
139

'4
0
"-
J4
-4) 9
0 0 0.
r4
04)0
I OH
-W U0 2 t4
03

REFERENCES
1. Burns, C. D. et al., "Comparative Performance of Structural Iaersin Pavement Systems; Design, Construction, and Behavior UnderTraffic of Pavement Test Sections," Report No. FAA-RD-73-198,Vol I, Jun 1974, Federal Aviation Administration, Washington, D. C.,and Technical Report S-74-8, Vol I, Jun 1974, U. S. Army EngineerWaterways Experiment Station, CE, Vicksburg, Miss.
2. Bohwiller, F. and Khling, K., "' yropor-Filled Lightweight Coa-crete," Badische Anilin- & Soda-Fabrik AG, 1968, Federal Republicof Germany.
3. American Society for Testing and Materials, "Standard Method ofTest for Compres3ive Strength of Cylindrical Concrete Specimens,"Designation: C 39-71, 1972 Annual Book of ASTfM Standards, Part 10,1972, Philadelphia, Pa.
4. U. S. Army Engineer Waterways Experiment Station, CE, Handbook ofConcrete and Cement, Aug 1949 (with quarterly supplements),Vicksburg, Miss.
5. American Society for Testing and Materials, "Standard Method ofTest for Flexural Strength of Concrete (Using Simple Beam withThird-Point Loading)," Designation: C 78-64, 1972 Annual Book ofASTM Standards, Part 10, 1972, Philadelphia, Pa.
6. , "Standard Method of Test for Static Modulus of Elastic-ity and Poisson's Ratio of Concrete in Compression," Designation:C 469-65, 1972 Annual Book of ASM Standards, Part 10, 1972,Philadelphia, Pa.
7. ________ "Standard Method of Making and Curing Concrete TestSpecimens in the Laboratory," Designation: C 192-69, 1972 AnnualBook of ASTM Standards, Part 10, 1972, Philadelphia, Pa.
8. , "Standard Method of Test for Moisture-Dessity Relationsof Soil Using 5.5-lb Rammer and 12-in. Drop," Designation:D 698-70, 1972 Annual Book of AS'I Standards, Part 11, 1972,Philadelphia, Pa.
9. Michelow, J., "Analysis of Stresses and Displacements In ann-Layered Elastic System Under a Load Uniformily Distributed on aCircular Area," Sep 1963, California Research Corp., Richmond,Calif.
141

10. Barker, W. R. and PF'abston, W. N., "Develcpment of a Struotural
Design Procedure for Flexible Airport Pavements," Report No.FAA-RD-74-199, Sep 1975, Federal Aviation Administration,Washington, D. C., and Technical Report S-75-17, Sep 1915, U. S.Army Engineer Waterways Experiment Station, CE, Vicksburg, Miss.
11. Morgan, J. R. and Scala, A. J., "Flexible Pavement Behavior andApplication of Elastic Theory--A Review," Proceedings. AustralianRoad Research Board, Vol 4, Part 2, 1968, pp 1201-1243.
12. General Services Administration, "Sealing Compound, Hot PouredType, for Joints in Concrete," Federal Specifications SS-S-164(4),Aug 1964, Nashington, D. C.
13. Department of Defense, "Method 104, Modulus of Soil Reaction,"Milita Standard 621-A, Test Method for PAvement Sub rade, Subbase,and Base-Course Materials, Dec 19% , Washington, D. C.
14. American Society for Testing and Materials, "Standard Method ofTest for Splitting Tensile Strength of Cylindrical Concrete Speci-mens," Designation: C 496-71, 1972 Annual Book of AST4 Standards,Part 10, 1972, Philadelphia, Pa.
15. Westergaard, H. M., "Stresses in Concrete Pavements Computed byTheoretical Analyses," Public Roads, Vol 7, No. 2, Apr 1926,pp 25-35.
16. . "Analytical Tools for Judging Results of StructuralTests of Concrete Pavements," Public Roas, Vol 14, No. 10,Dec 1933, pp 185-188.
17. , "Stresses in Concrete Runways of Airports," Proceeding.19th Annual MeetiDS of the Highway Research Board, Dec 1939,pp 197-202.
18. , "Stress Concentrations in Plates Loaded over SmallAreas," Transactions, American Society of Civi± Engineers, Vol 108,Paper No. 219?, 1943, pp 831-886.
19. , "New Formu)as for Stresses in Concrete Pavements ofAirfields," Transactions, American Society of Civil Enineers,Vol 113, Paper No. 2340, 1948, pp 425-444.
20. Pickett, G. et ai., "Deflections, Moments, and Reactive Pressuresfor Concrete Pavements," Bulletin No. 65, Oct 1951, Kansas StateCollege, Manhattan, Kans.
21. Pick-tt, G. and Ray, G. K., "Influence Charts for Concrete Pave-ments," Transactions. American Society of Civil Engineers, Vol 116,Paper No. 2425, 1951, pp 49-T3.
142

22. Hudson, W. Ronald and Matlock, Hudson, "Discontinuous and Ortho-tropic Plates and Pavesent Slabs," Report No. 56-6, May 1966,Center for Highway Research, The University of Texas, Austin, Tex.
23. Panak, John J. and Matlock, Hudson, "A Discrete-Element Method ofIkltiple-Loading Analysis for Two-Wav Bridge Floor Slabs," Reportgo. 56-13, Jan 1970, Center for Higlr A Research, The Universityof Texas, Austin, Tex.
113