Embed Size (px)
Citation preview
Molecular Ecology (2011) 20, 4533–4549 doi: 10.1111/j.1365-294X.2011.05268.x
Comparative phylogeography reveals a shared impact ofpleistocene environmental change in shaping geneticdiversity within nine Anopheles mosquito species acrossthe Indo-Burma biodiversity hotspot
KATY MORGAN,*†1 SAMANTHA M. O’LOUGHLIN,*‡1 BIN CHEN,§ YVONNE-MARIE LINTON,–
DAMRONGPAN THONGWAT,** PRADYA SOMBOON,†† MUN YIK FONG,‡‡ ROGER BUTLIN,§§
ROBERT VERITY,* ANIL PRAKASH,–– PE THAN HTUN,*** THAUNG HLAING,*** SIMONE
NAMBANYA,††† DUONG SOCHEAT,‡‡‡ TRUNG HO DINH§§§ and CATHERINE WALTON*
*Faculty of Life Sciences, University of Manchester, Manchester M13 9PT, UK, †Max Planck Institute for Developmental
Biology, 72076 Tuebingen, Germany, ‡NERC Centre for Population Biology, Imperial College London, Silwood Park, Ascot,
Berkshire SL5 7PY, UK, §College of Life Sciences, Chongqing Normal University, Chongqing 400047, China, –Natural History
Museum, London SW7 5BD, UK, **Department of Microbiology and Parasitolgy, Faculty of Medical Sciences, Naresuan
University, Phitsanulok 65000, Thailand, ††Department of Parasitology, Faculty of Medicine, Chiang Mai University, Chiang
Mai 50200, Thailand, ‡‡Department of Parasitology, University of Malaya, 50603 Kuala Lumpur, Malaysia, §§Department of
Animal and Plant Sciences, The University of Sheffield, Sheffield S10 2TN, UK, ––Regional Medical Research Centre, Dibrugarh
786001, Assam, India, ***Department of Medical Research, Yangon 11191, Myanmar, †††Centre of Malariology, Parasitology
and Entomology, Vientiane, Lao People‘s Democratic Republic, ‡‡‡National Centre for Malaria, Parasitology and Entomology,
Phnom Penh, Cambodia, §§§National Institute of Malariology, Parasitology and Entomology (NIMPE), Hanoi, Vietnam
Corresponde1These autho
� 2011 Black
Abstract
South-East Asia is one of the world’s richest regions in terms of biodiversity. An
understanding of the distribution of diversity and the factors shaping it is lacking, yet
essential for identifying conservation priorities for the region’s highly threatened biodiver-
sity. Here, we take a large-scale comparative approach, combining data from nine forest-
associated Anopheles mosquito species and using statistical phylogeographical methods to
disentangle the effects of environmental history, species-specific ecology and random
coalescent effects. Spatially explicit modelling of Pleistocene demographic history supports
a common influence of environmental events in shaping the genetic diversity of all species
examined, despite differences in species’ mtDNA gene trees. Populations were periodically
restricted to allopatric northeastern and northwestern refugia, most likely due to Pleistocene
forest fragmentation. Subsequent southwards post-glacial recolonization is supported by a
north–south gradient of decreasing genetic diversity. Repeated allopatric fragmentation and
recolonization have led to the formation of deeply divergent geographical lineages within
four species and a suture zone where these intraspecific lineages meet along the Thai–
Myanmar border. A common environmental influence for this divergence was further
indicated by strong support for simultaneous divergence within the same four species,
dating to approximately 900 thousand years ago (kya). Differences in the geographical
structuring of genetic diversity between species are probably the result of varying species’
biology. The findings have important implications for conservation planning; if the refugial
regions and suture zone identified here are shared by other forest taxa, the unique and high
levels of genetic diversity they house will make these areas conservation priorities.
Keywords: Anopheles, MsBayes, Phylogeography, Population genetics, South-East Asia, SPLATCHE
Received 6 April 2011; revision received 9 July 2011; accepted 20 July 2011
nce: Catherine Walton, Fax: +161 275 5082; E-mail: [email protected]
rs contributed equally to this work and are joint first authors.
well Publishing Ltd
4534 K. MORGAN ET AL.
Introduction
Considerable efforts have been made to explain the pro-
cesses of diversification in the Tropics, which harbour
the vast majority of the World’s biodiversity (reviewed
in Gaston 2000). South-East Asia encompasses four bio-
diversity hot spots: Wallacea, The Philippines, Sunda-
land and Indo-Burma (Myers et al. 2000). Of these, the
Indo-Burmese hot spot covers the greatest area (all of
mainland South-East Asia excluding peninsular Malay-
sia) yet is the least well studied. The dynamic climatic
and environmental history of South-East Asia is likely
to have played a key role in shaping the distribution of
biodiversity across the region (Sodhi et al. 2004); an
understanding of this is not only of fundamental scien-
tific interest but also important for specific potential
applications to malaria control and more generally for
the long-term conservation of biodiversity. The matter
is urgent as most tropical diversity is contained within
forests yet recent rates of deforestation are reportedly
higher in South-East Asia than in any other tropical
region (Achard et al. 2002). Biodiversity studies are
important for discovering unique genetic lineages and
cryptic species, but also to identify areas and landscape
features that have been influential in driving diversifica-
tion, so that processes of diversification may continue
in the future (Moritz et al. 2000; Moritz 2002). Despite
mainland South-East Asia’s rich biodiversity and fragile
conservation status, phylogeographical studies into the
origin and distribution of tropical biodiversity have
mainly focused on other regions (Fjeldsa 1994; Fjeldsa
& Lovett 1997; Colinvaux et al. 2000; Moritz et al. 2000;
Hewitt 2004). Here, we investigate the biogeography of
mainland South-East Asia using comparative phyloge-
ography, a powerful approach for determining the dif-
ferential effects of environment and species-specific
ecologies on the distribution of intraspecific genetic
diversity across a landscape (Bermingham & Moritz
1998; Carnaval et al. 2009).
Two major historical environmental factors that
potentially shape genetic diversity are climatic and tec-
tonic change (Crisci et al. 2003). South-East Asia has a
very complex tectonic history involving collisions of the
Indian and Australian plates into the South-East Asian
plate during the Cenozoic with subsequent movements
of these and other minor plates (Hall 2002). Tectonic
activity in the Pliocene and Pleistocene, i.e. on the time
frame where we might expect to detect effects at the
intraspecific level, is confined largely to the insular
region where it resulted in island formation and uplift.
This has primarily generated diversity at the species,
rather than intraspecific, level because of dispersal and
allopatric isolation on islands (e.g. Steppan et al. 2003;
Esselstyn et al. 2009). On the mainland, a more impor-
tant factor shaping intraspecific genetic diversity is
likely to be the periodic climatic fluctuations of the
Pleistocene, and this is the hypothesis we test here. In
more extreme latitudes, glacial maxima were experi-
enced as the extension of ice sheets, and in South-East
Asia, they resulted in substantial forest contraction and
fragmentation (Heaney 1991; Hewitt 2004; Hope et al.
2004).
The importance of the Pleistocene climatic fluctua-
tions and associated changes in tropical forest cover in
driving tropical diversification has long been debated,
primarily in relation to neotropical diversity (Haffer
1969; Haffer & Prance 2001). According to the ‘Pleisto-
cene refuge’ hypothesis, during the arid, cool periods of
the Pleistocene, the fragmentation of tropical forest hab-
itat isolated populations in allopatric refugia, with con-
sequent divergence because of genetic drift and local
adaptation (Haffer & Prance 2001). This hypothesis has
been disputed as a cause of neotropical diversity,
because of palynological evidence supporting the exis-
tence of continuous forest habitat throughout South
America during the Pleistocene (Colinvaux et al. 2000,
2001; Mayle et al. 2004). This may, however, not be the
case in South-East Asia. Palynological and sedimento-
logical data indicate substantial reductions in tropical
forest cover across South-East Asia during the last gla-
cial maximum (LGM), accompanied by expansions of
grassland and savannah habitat (van der Kaars 1991;
Kealhofer & Penny 1998; Penny 2001; Hope et al. 2004;
White et al. 2004). Aridity levels across South-East Asia,
and hence the fragmentation of tropical forest habitat,
were amplified by the large impact of glacio-eustatic
sea level changes on landmass configuration during the
Pleistocene (Heaney 1991). These sea level fluctuations
caused the repeated exposure and submergence of land
bridges between the mainland and insular regions
(Voris 2000). This not only drove dispersal and diver-
gence in land-based fauna (Ziegler et al. 2007; Reddy
2008) but also reduced the surface area of ocean across
which evaporation could occur, so lowering the mois-
ture content of the monsoon rains (Heaney 1991).
Because of the relatively small number of phylogeo-
graphical studies conducted in South-East Asia, it is dif-
ficult to identify the general biogeographical patterns in
the region. However, the wide distribution of several
forest-associated taxa (Colobinae monkeys (Brandon-
Jones 1996), Asian elephants (Vidya et al. 2009), dholes
(Iyengar et al. 2005), piculet birds (Fuchs et al. 2008)
and Anopheles mosquitoes (Morgan et al. 2009; Chen
et al. 2011) from Sri Lanka to Vietnam coupled with the
presence of distinct, divergent lineages within them,
indicates that forests throughout this region have some-
times been continuous but at other times fragmented.
Where examined, divergence dated to within the
� 2011 Blackwell Publishing Ltd
PHYLOGEOGRAP HY OF ANOPHELES IN IND O-BURM A 4535
Pleistocene and has been attributed to the isolation of
populations within allopatric forest refugia during gla-
cial maxima. Although refugial regions have been pro-
posed in Sri Lanka ⁄ southern India (Morgan et al. 2009;
Vidya et al. 2009), Nepal (Fuchs et al. 2008), northeast-
ern India (O’Loughlin et al. 2008; Morgan et al. 2010),
Myanmar (Fuchs et al. 2008), Yunnan (Chen et al. 2004,
2011) and eastern South-East Asia (O’Loughlin et al.
2008; Morgan et al. 2009, 2010; Chen et al. 2011), there
is no firm consensus as to the likely number or location
of these refugia.
Further phylogeographical studies to identify regions
of high and ⁄ or unique genetic diversity could greatly
benefit ecosystem-based conservation planning in
South-East Asia. However, it can be difficult to perform
these directly on species of conservation concern,
because of their rarity and often incomplete taxonomic
and distributional information. In the Wet Tropics of
Australia, biogeographical patterns within a wide range
of invertebrate taxa strongly predicted conservation pri-
orities in vertebrate species, indicating that invertebrate
taxa may be used as ‘taxon surrogates’ for endangered
species (Moritz et al. 2001). Because of the medical
importance of Anopheles mosquitoes, the taxonomy, dis-
tribution and ecological characteristics of many species
are relatively well documented (Manguin et al. 2008).
Several Anopheles species show strong association with
tropical forest habitats (Reid 1968), and previous phylo-
geographical studies have supported a role of environ-
mental change in shaping genetic diversity within
Anopheles mosquitoes (Chen et al. 2004, 2011; O’Lough-
lin et al. 2008; Morgan et al. 2009, 2010). Forest-depen-
dent mosquitoes are therefore likely to be a good model
taxon for elucidating the processes underlying, and pat-
terns of, co-distributed forest biodiversity in South-East
Asia.
Under the Pleistocene refuge hypothesis, the genetic
diversity of forest taxa is expected to have been shaped
by a common environmental influence, the fragmenta-
tion of forest habitat during periods of increased arid-
ity. Traditionally, identifying a shared environmental
influence on genetic diversity has involved looking for
common patterns across the gene trees of different spe-
cies (e.g. Schneider et al. 1998; Feldman & Spicer 2006).
Species are expected to show a genetic signature of
their population history in the distribution of genetic
diversity among populations; additionally, where there
are distinct geographical lineages within species, these
are expected to be both spatially congruent across spe-
cies and to have simultaneous divergence times (Endler
1982; Moritz et al. 2009). However, because of the sto-
chastic nature of mutational, coalescent and demo-
graphic processes, similar population histories may give
rise to very different gene trees, and vice versa (Nielsen
� 2011 Blackwell Publishing Ltd
& Beaumont 2009). Because of the variance expected in
the time to the most recent common ancestor of diver-
gent lineages, according to coalescent theory, comparing
independently estimated divergence times across
multiple taxon pairs may be misleading (Nielsen &
Beaumont 2009). Several recently developed coalescent-
based techniques account for the inherent stochasticity
of gene tree coalescence, enable alternative evolutionary
scenarios to be statistically evaluated and in some cases
allow multi-taxa data sets to be analysed simulta-
neously (Knowles 2004; Hickerson et al. 2006, 2007;
Nielsen & Beaumont 2009). These latest methodologies,
combined with comparative phylogeography, provide
an ideal toolkit for testing the expectations of the Pleis-
tocene refuge hypothesis described earlier.
Our previous studies of Anopheles species have sug-
gested some similarity in cross-species phylogeographi-
cal patterns, notably in east–west divergence within
mainland South-East Asia: in intraspecific geographical
lineages of An. minimus (Chen et al. 2011), An. annular-
is and An. splendidus (Morgan et al. 2009); and the allo-
patric divergence and subsequent speciation of
An. baimaii and An. dirus (Morgan et al. 2010). How-
ever, the degree of congruence between phylogeograph-
ical patterns of different species, and the likely locations
of Pleistocene forest refugia that underlie these patterns,
is unclear. Here, we draw together mitochondrial CO2
sequences from 1032 specimens comprising nine
mosquito species, sampled throughout mainland South-
East Asia. In addition to four newly sampled species
(An. aconitus, An. philippinensis, An. maculatus and
An. sawadwongporni), we have substantially extended
the geographical sampling of five previously studied
species (An. annularis, An. baimaii, An. splendidus,
An. jeyporiensis and An. minimus), most notably from
the little studied regions of northeastern India and
Myanmar. The use of multiple species counteracts the
potential problem of inferences from a single marker
being owing to locus-specific effects, because any
shared patterns of genetic diversity must necessarily
indicate a common cause. To our knowledge, this
study, with its use of multiple species and extensive
geographical coverage, is the first large-scale phylogeo-
graphical study performed in this region.
Five of the analysed species (An. minimus, An. bai-
maii, An. maculatus, An. sawadwongporni and An. splen-
didus) show a strong association with forest habitat;
Anopheles annularis, An. philippinensis and An. aconitus
can also be found in forest habitat; however, they are
also common in deforested habitats such as rice pad-
dies; An. jeyporiensis prefers hilly and mountainous
areas and is limited to northern latitudes (Covell 1927;
Reid 1968; Darsie & Pradhan 1990; Rattanarithikul et al.
2006). The sampled species come from three Series (an
4536 K. MORGAN ET AL.
informal taxonomic grouping) within the subgenus Cel-
lia (genus Anopheles): the Neomyzomyia Series (Anophe-
les baimaii); the Myzomyia Series (An. minimus,
An. aconitus and An. jeyporiensis all from the Funestus
Group); and the Neocellia Series (An. maculatus,
An. sawadwongporni, An. annularis, An. philippinensis
and An. splendidus (Garros et al. 2005; Harbach & Kit-
ching 2005). Within the Neocellia Series, Anopheles mac-
ulatus and An. sawadwongporni are most closely related
to each other, both being classified within the Macula-
tus Group, and An. philippinensis and An. annularis are
most closely related, both being within the Annularis
Subgroup. Anopheles splendidus (within the Splendidus
Subgroup) is relatively distantly related to these group-
ings (Harbach & Kitching 2005; Morgan et al. 2009).
Shared association with forest habitat is therefore not
particularly dependent upon taxonomic affinity of the
species.
This combined data set provides the opportunity to
differentiate the effects of shared environmental and
species-specific ecological effects on population history.
We will test two key predictions of the refuge hypothe-
sis: congruent patterns of genetic diversity and simulta-
neous vicariance of geographical lineages across
species. Differentiation between alternate biogeographi-
cal scenarios is made possible by the use of spatially
explicit coalescent-based modelling techniques and hier-
archical approximate Bayesian computation (hABC)
An. maculatusAn. aconitus
An. annularis
An. minimus
An. philippinensisAn. baimaii
An. sawadwongporniAn. splendidusAn. jeyporiensis
Location of modelledwestern refugia
Location of modelledeastern refugia
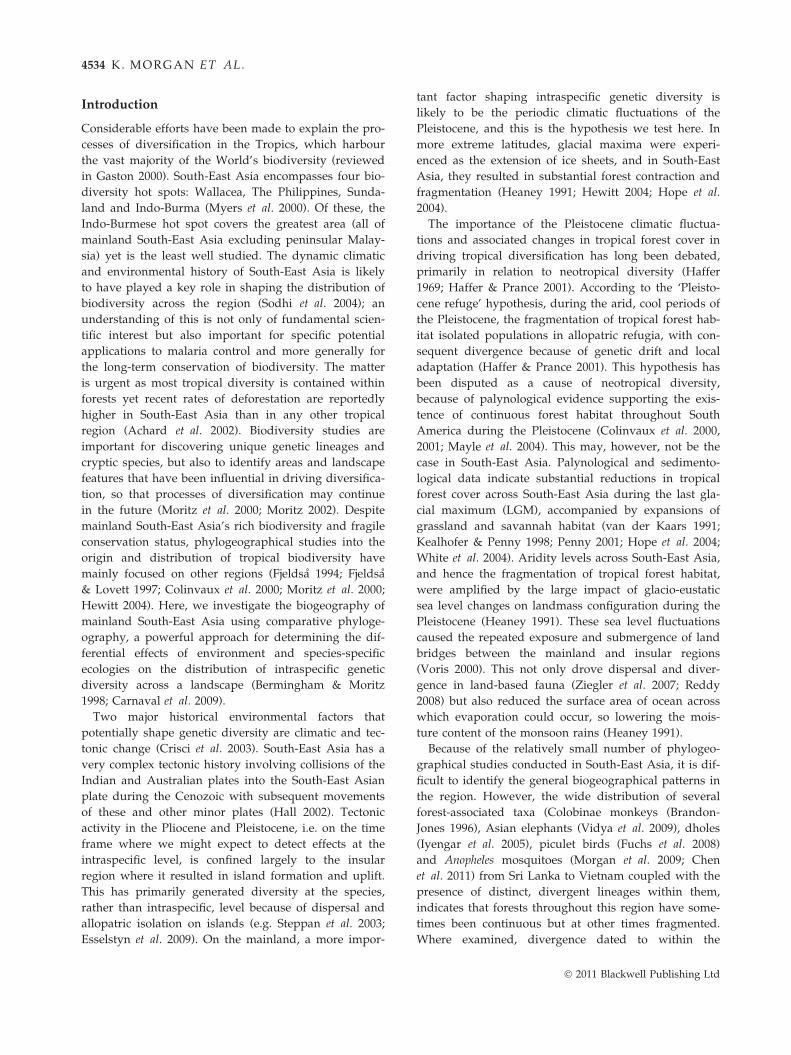
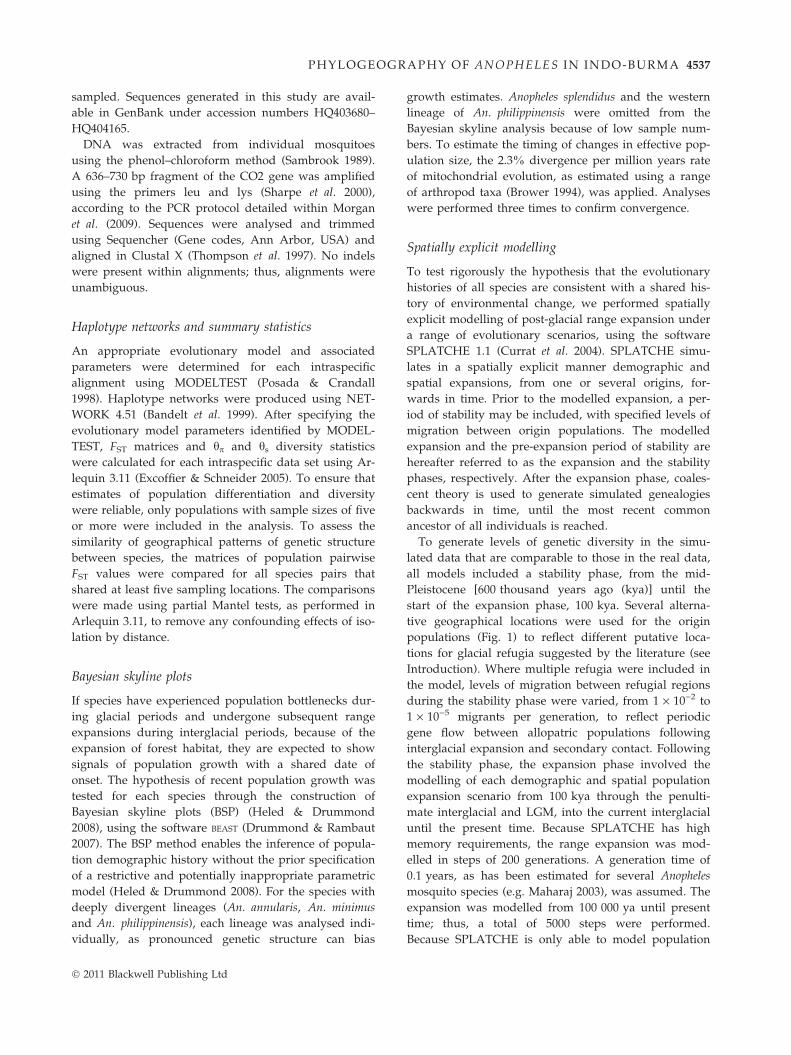
Fig. 1 Topographical map of mainland South-East Asia, indicating th
analysis, as implemented in the SPLATCHE (Currat
et al. 2004) and MsBayes (Hickerson et al. 2007) soft-
ware, respectively.
Materials and methods
Data collection
Nine Anopheles mosquito species were sampled from
across South-East Asia (Fig. 1; Table S1, Supporting
information). Some 499 sequences of the mitochondrial
CO2 gene were included from previous studies; 148
An. baimaii (O’Loughlin et al. 2008), 164 An. minimus
(Chen et al. 2011), 107 An. annularis (Morgan et al.
2009), 9 An. splendidus (Morgan et al. 2009) and 71
An. jeyporiensis individuals (Chen et al. 2004), and the
CO2 gene fragment was also sequenced from a further
533 Anopheles mosquitoes. This included many of the
same species from previously unsampled locations: 8
An. annularis; 37 An. baimaii and 15 An. jeyporiensis
from Myanmar; and 24 An. minimus from Myanmar,
Laos and Cambodia. In addition, sequences from four
previously unsampled species were included: 140
An. aconitus, 169 An. maculatus, 66 An. sawadwongporni
and 74 An. philippinensis from 16, 25, 9 and 7 geograph-
ical locations across South-East Asia, respectively (see
Fig. 1 and Table S1, Supporting information). Not all
species were present or available from each locality
e sampled locations for each species within this study.
� 2011 Blackwell Publishing Ltd
PHYLOGEOGRAP HY OF ANOPHELES IN IND O-BURM A 4537
sampled. Sequences generated in this study are avail-
able in GenBank under accession numbers HQ403680–
HQ404165.
DNA was extracted from individual mosquitoes
using the phenol–chloroform method (Sambrook 1989).
A 636–730 bp fragment of the CO2 gene was amplified
using the primers leu and lys (Sharpe et al. 2000),
according to the PCR protocol detailed within Morgan
et al. (2009). Sequences were analysed and trimmed
using Sequencher (Gene codes, Ann Arbor, USA) and
aligned in Clustal X (Thompson et al. 1997). No indels
were present within alignments; thus, alignments were
unambiguous.
Haplotype networks and summary statistics
An appropriate evolutionary model and associated
parameters were determined for each intraspecific
alignment using MODELTEST (Posada & Crandall
1998). Haplotype networks were produced using NET-
WORK 4.51 (Bandelt et al. 1999). After specifying the
evolutionary model parameters identified by MODEL-
TEST, FST matrices and hp and hs diversity statistics
were calculated for each intraspecific data set using Ar-
lequin 3.11 (Excoffier & Schneider 2005). To ensure that
estimates of population differentiation and diversity
were reliable, only populations with sample sizes of five
or more were included in the analysis. To assess the
similarity of geographical patterns of genetic structure
between species, the matrices of population pairwise
FST values were compared for all species pairs that
shared at least five sampling locations. The comparisons
were made using partial Mantel tests, as performed in
Arlequin 3.11, to remove any confounding effects of iso-
lation by distance.
Bayesian skyline plots
If species have experienced population bottlenecks dur-
ing glacial periods and undergone subsequent range
expansions during interglacial periods, because of the
expansion of forest habitat, they are expected to show
signals of population growth with a shared date of
onset. The hypothesis of recent population growth was
tested for each species through the construction of
Bayesian skyline plots (BSP) (Heled & Drummond
2008), using the software BEAST (Drummond & Rambaut
2007). The BSP method enables the inference of popula-
tion demographic history without the prior specification
of a restrictive and potentially inappropriate parametric
model (Heled & Drummond 2008). For the species with
deeply divergent lineages (An. annularis, An. minimus
and An. philippinensis), each lineage was analysed indi-
vidually, as pronounced genetic structure can bias
� 2011 Blackwell Publishing Ltd
growth estimates. Anopheles splendidus and the western
lineage of An. philippinensis were omitted from the
Bayesian skyline analysis because of low sample num-
bers. To estimate the timing of changes in effective pop-
ulation size, the 2.3% divergence per million years rate
of mitochondrial evolution, as estimated using a range
of arthropod taxa (Brower 1994), was applied. Analyses
were performed three times to confirm convergence.
Spatially explicit modelling
To test rigorously the hypothesis that the evolutionary
histories of all species are consistent with a shared his-
tory of environmental change, we performed spatially
explicit modelling of post-glacial range expansion under
a range of evolutionary scenarios, using the software
SPLATCHE 1.1 (Currat et al. 2004). SPLATCHE simu-
lates in a spatially explicit manner demographic and
spatial expansions, from one or several origins, for-
wards in time. Prior to the modelled expansion, a per-
iod of stability may be included, with specified levels of
migration between origin populations. The modelled
expansion and the pre-expansion period of stability are
hereafter referred to as the expansion and the stability
phases, respectively. After the expansion phase, coales-
cent theory is used to generate simulated genealogies
backwards in time, until the most recent common
ancestor of all individuals is reached.
To generate levels of genetic diversity in the simu-
lated data that are comparable to those in the real data,
all models included a stability phase, from the mid-
Pleistocene [600 thousand years ago (kya)] until the
start of the expansion phase, 100 kya. Several alterna-
tive geographical locations were used for the origin
populations (Fig. 1) to reflect different putative loca-
tions for glacial refugia suggested by the literature (see
Introduction). Where multiple refugia were included in
the model, levels of migration between refugial regions
during the stability phase were varied, from 1 · 10)2 to
1 · 10)5 migrants per generation, to reflect periodic
gene flow between allopatric populations following
interglacial expansion and secondary contact. Following
the stability phase, the expansion phase involved the
modelling of each demographic and spatial population
expansion scenario from 100 kya through the penulti-
mate interglacial and LGM, into the current interglacial
until the present time. Because SPLATCHE has high
memory requirements, the range expansion was mod-
elled in steps of 200 generations. A generation time of
0.1 years, as has been estimated for several Anopheles
mosquito species (e.g. Maharaj 2003), was assumed. The
expansion was modelled from 100 000 ya until present
time; thus, a total of 5000 steps were performed.
Because SPLATCHE is only able to model population
4538 K. MORGAN ET AL.
expansions, it was necessary to maintain a glacial cli-
mate until the onset of the most recent interglacial. This
is considered analogous to populations repeatedly colo-
nizing and becoming extinct from the low-altitude
regions during each of the proceeding interglacials. A
switch from a glacial to an interglacial climate was initi-
ated after 4250 steps, corresponding to the onset of the
last deglaciation in the northern hemisphere, 15 kya
(Clark et al. 2009).
During the expansion phase, SPLATCHE allows the
incorporation of relevant environmental information
into the model. The species within this study exhibit
varying degrees of forest dependency and association;
thus, forest cover is likely to have been important for
population survival and dispersal. As the available pal-
ynological data provide little specific information
regarding the distribution of habitat types across South-
East Asia during the last 100 ky (van der Kaars 1991;
Penny 2001; Hope et al. 2004; White et al. 2004), altitude
was used as a proxy for Pleistocene forest cover. The
rationale for this is that mid-elevation regions are likely
to have retained sufficient moisture for forest habitats
to survive during the glacial periods as they are suffi-
ciently high to intercept the monsoon rains and fog
with subsequent run-off of moisture, without being so
high that low temperatures prevent forest growth (Hea-
ney 1991; Gathorne-Hardy et al. 2002). Topographical
information taken from the National Geophysical Data
Centre (NGDC) service (Amante & Eakins 2009) was
therefore used to define and incorporate environmental
heterogeneity into a total of 21 679 demes, each of
which represents an area of approximately 325 km2,
across mainland South-East Asia. Each deme was classi-
fied into one of 25 equally sized categories. Carrying
capacity and friction values were then assigned to each
deme, according to the altitudinal category within that
deme. The carrying capacity and friction parameters
represent, respectively, the size of the population that
any given deme can support and the ease with which
individuals can travel through that deme. The carrying
capacity of intermediate elevations was kept constant
throughout glacial and interglacial periods, at an inter-
mediate carrying capacity of 1000, to reflect the persis-
tence of forest habitat in these regions throughout the
Pleistocene (Heaney 1991; Gathorne-Hardy et al. 2002).
High-elevation regions are likely to have become too
cold and low-elevation regions too arid for the survival
of forest habitat (Gathorne-Hardy et al. 2002), so these
regions were allocated low carrying capacity and high
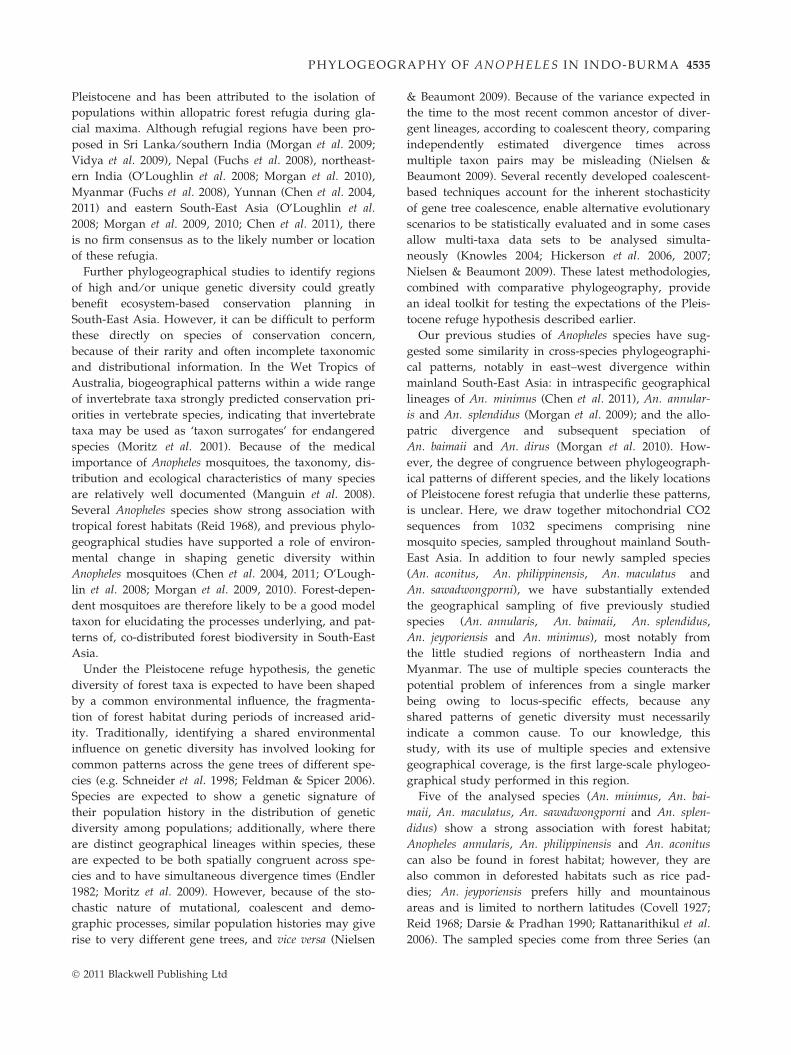
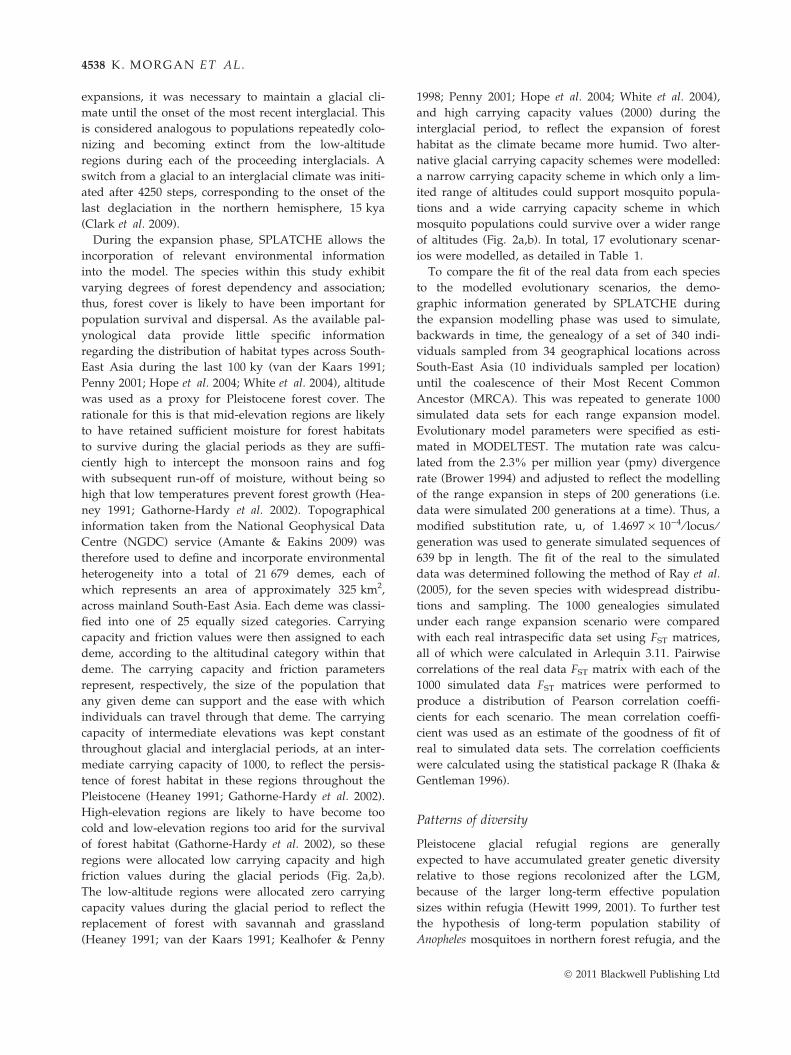
friction values during the glacial periods (Fig. 2a,b).
The low-altitude regions were allocated zero carrying
capacity values during the glacial period to reflect the
replacement of forest with savannah and grassland
(Heaney 1991; van der Kaars 1991; Kealhofer & Penny
1998; Penny 2001; Hope et al. 2004; White et al. 2004),
and high carrying capacity values (2000) during the
interglacial period, to reflect the expansion of forest
habitat as the climate became more humid. Two alter-
native glacial carrying capacity schemes were modelled:
a narrow carrying capacity scheme in which only a lim-
ited range of altitudes could support mosquito popula-
tions and a wide carrying capacity scheme in which
mosquito populations could survive over a wider range
of altitudes (Fig. 2a,b). In total, 17 evolutionary scenar-
ios were modelled, as detailed in Table 1.
To compare the fit of the real data from each species
to the modelled evolutionary scenarios, the demo-
graphic information generated by SPLATCHE during
the expansion modelling phase was used to simulate,
backwards in time, the genealogy of a set of 340 indi-
viduals sampled from 34 geographical locations across
South-East Asia (10 individuals sampled per location)
until the coalescence of their Most Recent Common
Ancestor (MRCA). This was repeated to generate 1000
simulated data sets for each range expansion model.
Evolutionary model parameters were specified as esti-
mated in MODELTEST. The mutation rate was calcu-
lated from the 2.3% per million year (pmy) divergence
rate (Brower 1994) and adjusted to reflect the modelling
of the range expansion in steps of 200 generations (i.e.
data were simulated 200 generations at a time). Thus, a
modified substitution rate, u, of 1.4697 · 10)4 ⁄ locus ⁄generation was used to generate simulated sequences of
639 bp in length. The fit of the real to the simulated
data was determined following the method of Ray et al.
(2005), for the seven species with widespread distribu-
tions and sampling. The 1000 genealogies simulated
under each range expansion scenario were compared
with each real intraspecific data set using FST matrices,
all of which were calculated in Arlequin 3.11. Pairwise
correlations of the real data FST matrix with each of the
1000 simulated data FST matrices were performed to
produce a distribution of Pearson correlation coeffi-
cients for each scenario. The mean correlation coeffi-
cient was used as an estimate of the goodness of fit of
real to simulated data sets. The correlation coefficients
were calculated using the statistical package R (Ihaka &
Gentleman 1996).
Patterns of diversity
Pleistocene glacial refugial regions are generally
expected to have accumulated greater genetic diversity
relative to those regions recolonized after the LGM,
because of the larger long-term effective population
sizes within refugia (Hewitt 1999, 2001). To further test
the hypothesis of long-term population stability of
Anopheles mosquitoes in northern forest refugia, and the
� 2011 Blackwell Publishing Ltd

Carrying capacityscale
0
100
500
1000
1500
2000
(a) (b)
(c)
Fig. 2 Representation of the carrying capacity values for the individual demes within South-East Asia. a and b show the glacial car-
rying capacities modelled under the narrow altitudinal range and wide altitudinal range scenarios, respectively; c shows the intergla-
cial carrying capacities.
PHYLOGEOGRAP HY OF ANOPHELES IN IND O-BURM A 4539
inferred recent colonization of the south, we tested the
expectation of a correlation between latitude and
genetic diversity. Anopheles jeyporiensis was omitted
from this analysis as this species is distributed solely at
high latitudes, and An. splendidus was omitted because
of insufficient sample sizes. The diversity statistics hp
and hs were calculated for each population, after remov-
ing those populations with fewer than five individuals.
Correlations between diversity and latitude were car-
ried out independently for each species; however,
because the numbers of populations per species were
typically low, we also maximized the power to test the
hypothesis by combining the populations of all species
into a single analysis. To enable this, the diversity sta-
tistics were normalized by allocating a value of one to
the population within each species with the highest
� 2011 Blackwell Publishing Ltd
diversity statistic and calculating the relative diversity
statistics of all other populations within that species.
The significance of correlations between diversity statis-
tics and latitude was determined using SPSS.
Hierarchical Bayesian analysis of simultaneousdivergence
An expectation of the Pleistocene refuge hypothesis is
that vicariance between geographical lineages will be
simultaneous across multiple co-distributed taxa, as that
vicariance has been caused by a common environmen-
tal event (Endler 1982; Moritz et al. 2009). For those
species with geographically congruent divergent lin-
eages (An. annularis, An. philippinensis, An. splendidus
and An. minimus; see Fig. 3a–d), the hypothesis of
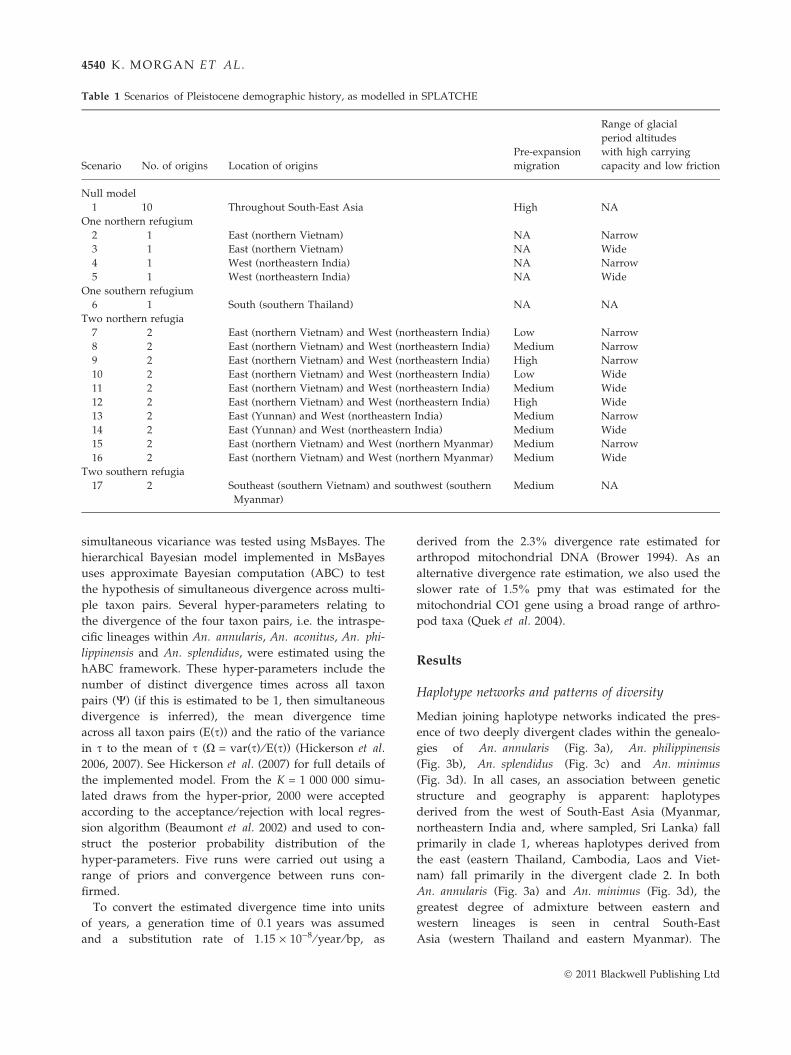
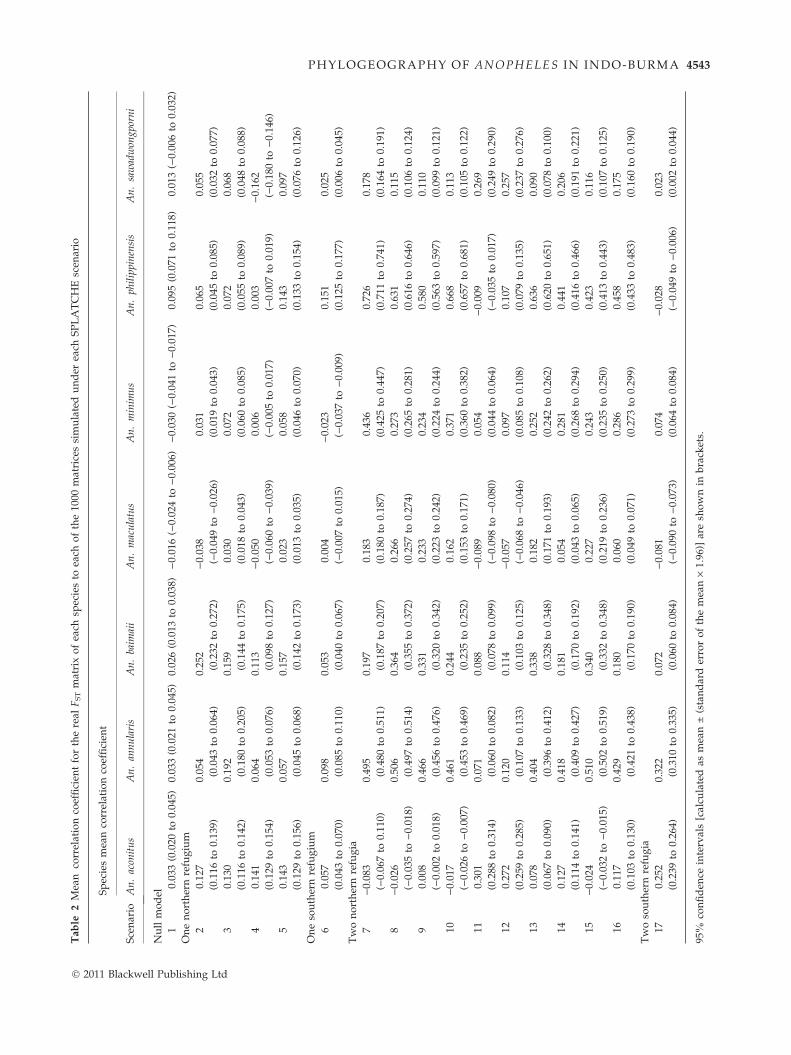
Table 1 Scenarios of Pleistocene demographic history, as modelled in SPLATCHE
Scenario No. of origins Location of origins
Pre-expansion
migration
Range of glacial
period altitudes
with high carrying
capacity and low friction
Null model
1 10 Throughout South-East Asia High NA
One northern refugium
2 1 East (northern Vietnam) NA Narrow
3 1 East (northern Vietnam) NA Wide
4 1 West (northeastern India) NA Narrow
5 1 West (northeastern India) NA Wide
One southern refugium
6 1 South (southern Thailand) NA NA
Two northern refugia
7 2 East (northern Vietnam) and West (northeastern India) Low Narrow
8 2 East (northern Vietnam) and West (northeastern India) Medium Narrow
9 2 East (northern Vietnam) and West (northeastern India) High Narrow
10 2 East (northern Vietnam) and West (northeastern India) Low Wide
11 2 East (northern Vietnam) and West (northeastern India) Medium Wide
12 2 East (northern Vietnam) and West (northeastern India) High Wide
13 2 East (Yunnan) and West (northeastern India) Medium Narrow
14 2 East (Yunnan) and West (northeastern India) Medium Wide
15 2 East (northern Vietnam) and West (northern Myanmar) Medium Narrow
16 2 East (northern Vietnam) and West (northern Myanmar) Medium Wide
Two southern refugia
17 2 Southeast (southern Vietnam) and southwest (southern
Myanmar)
Medium NA
4540 K. MORGAN ET AL.
simultaneous vicariance was tested using MsBayes. The
hierarchical Bayesian model implemented in MsBayes
uses approximate Bayesian computation (ABC) to test
the hypothesis of simultaneous divergence across multi-
ple taxon pairs. Several hyper-parameters relating to
the divergence of the four taxon pairs, i.e. the intraspe-
cific lineages within An. annularis, An. aconitus, An. phi-
lippinensis and An. splendidus, were estimated using the
hABC framework. These hyper-parameters include the
number of distinct divergence times across all taxon
pairs (W) (if this is estimated to be 1, then simultaneous
divergence is inferred), the mean divergence time
across all taxon pairs (E(s)) and the ratio of the variance
in s to the mean of s (X = var(s) ⁄ E(s)) (Hickerson et al.
2006, 2007). See Hickerson et al. (2007) for full details of
the implemented model. From the K = 1 000 000 simu-
lated draws from the hyper-prior, 2000 were accepted
according to the acceptance ⁄ rejection with local regres-
sion algorithm (Beaumont et al. 2002) and used to con-
struct the posterior probability distribution of the
hyper-parameters. Five runs were carried out using a
range of priors and convergence between runs con-
firmed.
To convert the estimated divergence time into units
of years, a generation time of 0.1 years was assumed
and a substitution rate of 1.15 · 10)8 ⁄ year ⁄ bp, as
derived from the 2.3% divergence rate estimated for
arthropod mitochondrial DNA (Brower 1994). As an
alternative divergence rate estimation, we also used the
slower rate of 1.5% pmy that was estimated for the
mitochondrial CO1 gene using a broad range of arthro-
pod taxa (Quek et al. 2004).
Results
Haplotype networks and patterns of diversity
Median joining haplotype networks indicated the pres-
ence of two deeply divergent clades within the genealo-
gies of An. annularis (Fig. 3a), An. philippinensis
(Fig. 3b), An. splendidus (Fig. 3c) and An. minimus
(Fig. 3d). In all cases, an association between genetic
structure and geography is apparent: haplotypes
derived from the west of South-East Asia (Myanmar,
northeastern India and, where sampled, Sri Lanka) fall
primarily in clade 1, whereas haplotypes derived from
the east (eastern Thailand, Cambodia, Laos and Viet-
nam) fall primarily in the divergent clade 2. In both
An. annularis (Fig. 3a) and An. minimus (Fig. 3d), the
greatest degree of admixture between eastern and
western lineages is seen in central South-East
Asia (western Thailand and eastern Myanmar). The
� 2011 Blackwell Publishing Ltd

An. philippinensis
An. minimus
An. splendidus
(a) An. annularis
An. aconitus
COLOUR KEY
An. sawadwongporni
An. maculatus
An. baimaii
(f)
(b)
(d)
(h)
(g)
(i)
(e)
(c)
An. jeyporiensis
Fig. 3 Median joining haplotype networks for each of the nine species included within this study. The size of the circles is propor-
tional to the number of individuals with that haplotype; circles are coloured according to the locality from which individuals were
sampled. The length of the branches separating haplotypes is proportional to the number of mutational steps between them. Haplo-
type networks were constructed using NETWORK 4.51.
PHYLOGEOGRAP HY OF ANOPHELES IN IND O-BURM A 4541
haplotype networks of An. aconitus (Fig. 3e), An. jeypo-
riensis (Fig. 3f), An. sawadwongporni (Fig. 3g) and
An. maculatus (Fig. 3i) do not show deeply divergent
eastern and western lineages. Substantial genetic diver-
sity can be seen in the networks of both An. aconitus
and An. jeyporiensis with many unique and divergent
haplotypes. By contrast, haplotypes of the closely
related An. maculatus and An. sawadwongporni from
across most of mainland South-East Asia form predomi-
nantly star-like genealogies indicative of recent popula-
tion expansion. The network of An. baimaii, which has
a distribution limited to the west of South-East Asia,
also displays a star-like appearance (Fig. 3h).
The partial Mantel tests comparing the matrices of
population pairwise FST values between species pairs,
controlling for the effect of isolation by distance,
revealed no statistically significant correlations. How-
ever, the following partial correlations showed a posi-
tive trend that approached significance: An. minimus
and An. annularis (r = 0.602, P = 0.064), An. minimus
� 2011 Blackwell Publishing Ltd
and An. philippinensis (r = 0.623, P = 0.094) and
An. minimus and An. aconitus (r = 0.374, P = 0.059),
suggesting some similarity between these species in the
distribution of genetic diversity across the landscape.
Hence, both the haplotype networks and FST matrices
revealed that whilst there are some similarities between
certain species, there are also considerable incongruenc-
es in the overall phylogeographical patterns.
Population expansion
Similarly timed population expansions were detected in
An. aconitus, An. jeyporiensis, An. baimaii, An. maculatus
and the eastern lineages of An. annularis, An. minimus
and An. philippinensis, starting in the mid- to late Pleis-
tocene, between 300 and 100 kya (see Fig. S1, Support-
ing information). Within the western lineages of
An. annularis and An. minimus, the Bayesian skyline
analysis supported a stable population size rather than
a recent expansion (Fig. S1d,f, Supporting information).
4542 K. MORGAN ET AL.
Although the BSP of An. sawadwongporni suggests a
lack of recent population growth (Fig. S1k, Supporting
information), this is misleading as it results from the
almost complete lack of genetic variation in this data
set, which is itself indicative of very recent expansion
(either demographic or selective sweep).
Spatially explicit modelling of demographic history
The FST matrices of An. annularis and An. baimaii best
fitted the demographic scenarios 15 and 8, respectively,
which both include two refugia in the northeast and
northwest of South-East Asia, limited adaptability to
glacial environments, and medium levels of pre-
expansion migration between refugia (Tables 1 and 2,
Fig. S2a,b, Supporting information). Because An. bai-
maii is restricted to western South-East Asia, the genetic
data were compared with simulated data from only the
corresponding western populations; hence, the best sup-
ported scenario for this species effectively represents a
single northwestern refugium. Anopheles minimus and
An. philippinensis best fitted scenario 7, which was simi-
lar to scenario 8 but allowed only low levels of pre-
expansion migration between refugia (Tables 1 and 2,
Fig. S2b,e, Supporting information). Scenario 11, which
was similar to scenario 8 but included adaptability to a
wider range of glacial environments, showed the best
fit to the FST matrices of An. aconitus and An. saw-
adwongporni (Tables 1 and 2, Fig. S2c,g, Supporting
information). The best fitting scenario for all species
was always amongst those with two allopatric northern
refugia (scenarios 7–16), rather than the following alter-
native scenarios: the null model, which included multi-
ple origins and high levels of pre-expansion migration
between them (i.e. no refugia); scenarios including a
single northern refugium; or scenarios including single
or multiple southern refugia (Tables 1 and 2). The spe-
cific location of eastern and western refugia was varied
between northern Vietnam and Yunnan, and between
northern Myanmar and northeastern India, respectively.
There was little difference between the fit of the real
data in each species to those simulated using various
combinations of these putative northeastern and north-
western refugia (Tables 1 and 2).
Patterns of diversity
No significant correlations were detected between
genetic diversity and latitude when each species was
considered independently. This is probably because of
low power associated with small sample sizes because
the combined analysis with the normalized diversity
statistics from all species detected significant and posi-
tive correlations between latitude and hp (r = 0.347,
P = 0.002, n = 77; see Fig. S3, Supporting information)
and between latitude and hs (r = 0.343, P = 0.002,
n = 77). The hypothesis of greater genetic diversity in
the north relative to the south was therefore supported.
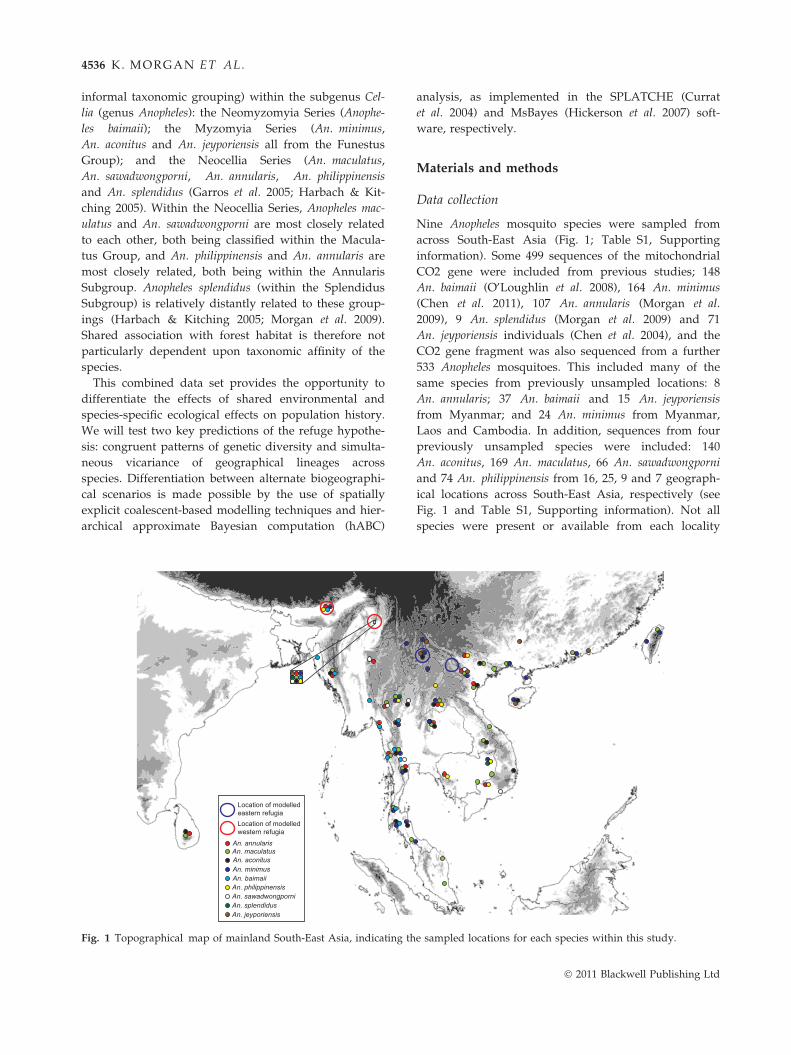
Simultaneous divergence
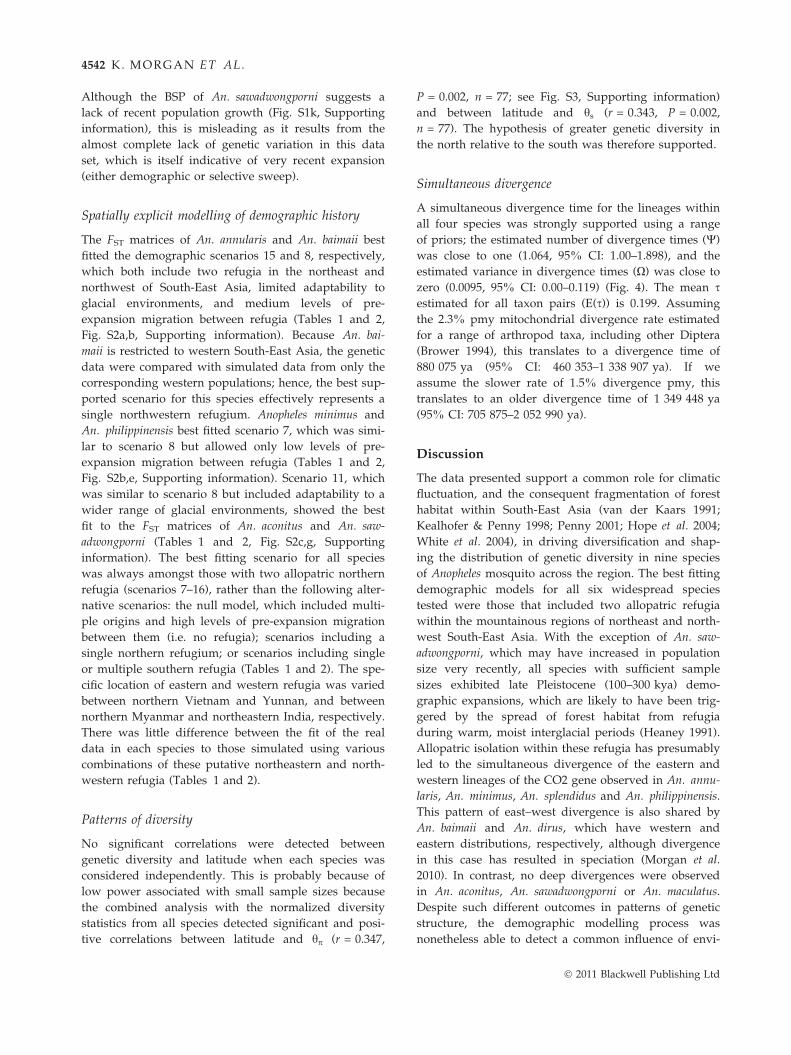
A simultaneous divergence time for the lineages within
all four species was strongly supported using a range
of priors; the estimated number of divergence times (W)
was close to one (1.064, 95% CI: 1.00–1.898), and the
estimated variance in divergence times (X) was close to
zero (0.0095, 95% CI: 0.00–0.119) (Fig. 4). The mean sestimated for all taxon pairs (E(s)) is 0.199. Assuming
the 2.3% pmy mitochondrial divergence rate estimated
for a range of arthropod taxa, including other Diptera
(Brower 1994), this translates to a divergence time of
880 075 ya (95% CI: 460 353–1 338 907 ya). If we
assume the slower rate of 1.5% divergence pmy, this
translates to an older divergence time of 1 349 448 ya
(95% CI: 705 875–2 052 990 ya).
Discussion
The data presented support a common role for climatic
fluctuation, and the consequent fragmentation of forest
habitat within South-East Asia (van der Kaars 1991;
Kealhofer & Penny 1998; Penny 2001; Hope et al. 2004;
White et al. 2004), in driving diversification and shap-
ing the distribution of genetic diversity in nine species
of Anopheles mosquito across the region. The best fitting
demographic models for all six widespread species
tested were those that included two allopatric refugia
within the mountainous regions of northeast and north-
west South-East Asia. With the exception of An. saw-
adwongporni, which may have increased in population
size very recently, all species with sufficient sample
sizes exhibited late Pleistocene (100–300 kya) demo-
graphic expansions, which are likely to have been trig-
gered by the spread of forest habitat from refugia
during warm, moist interglacial periods (Heaney 1991).
Allopatric isolation within these refugia has presumably
led to the simultaneous divergence of the eastern and
western lineages of the CO2 gene observed in An. annu-
laris, An. minimus, An. splendidus and An. philippinensis.
This pattern of east–west divergence is also shared by
An. baimaii and An. dirus, which have western and
eastern distributions, respectively, although divergence
in this case has resulted in speciation (Morgan et al.
2010). In contrast, no deep divergences were observed
in An. aconitus, An. sawadwongporni or An. maculatus.
Despite such different outcomes in patterns of genetic
structure, the demographic modelling process was
nonetheless able to detect a common influence of envi-
� 2011 Blackwell Publishing Ltd
Tab
le2
Mea
nco
rrel
atio
nco
effi
cien
tfo
rth
ere
alF
ST
mat
rix
of
each
spec
ies
toea
cho
fth
e10
00m
atri
ces
sim
ula
ted
un
der
each
SP
LA
TC
HE
scen
ario
Sce
nar
io
Sp
ecie
sm
ean
corr
elat
ion
coef
fici
ent
An
.ac
onit
us
An
.an
nu
lari
sA
n.
baim
aii
An
.m
acu
latu
sA
n.
min
imu
sA
n.
phil
ippi
nen
sis
An
.sa
wad
won
gpor
ni
Nu
llm
od
el
10.
033
(0.0
20to
0.04
5)0.
033
(0.0
21to
0.04
5)0.
026
(0.0
13to
0.03
8))
0.01
6()
0.02
4to
)0.
006)
)0.
030
()0.
041
to)
0.01
7)0.
095
(0.0
71to
0.11
8)0.
013
()0.
006
to0.
032)
On
en
ort
her
nre
fug
ium
20.
127
(0.1
16to
0.13
9)
0.05
4
(0.0
43to
0.06
4)
0.25
2
(0.2
32to
0.27
2)
)0.
038
()0.
049
to)
0.02
6)
0.03
1
(0.0
19to
0.04
3)
0.06
5
(0.0
45to
0.08
5)
0.05
5
(0.0
32to
0.07
7)
30.
130
(0.1
16to
0.14
2)
0.19
2
(0.1
80to
0.20
5)
0.15
9
(0.1
44to
0.17
5)
0.03
0
(0.0
18to
0.04
3)
0.07
2
(0.0
60to
0.08
5)
0.07
2
(0.0
55to
0.08
9)
0.06
8
(0.0
48to
0.08
8)
40.
141
(0.1
29to
0.15
4)
0.06
4
(0.0
53to
0.07
6)
0.11
3
(0.0
98to
0.12
7)
)0.
050
()0.
060
to)
0.03
9)
0.00
6
()0.
005
to0.
017)
0.00
3
()0.
007
to0.
019)
)0.
162
()0.
180
to)
0.14
6)
50.
143
(0.1
29to
0.15
6)
0.05
7
(0.0
45to
0.06
8)
0.15
7
(0.1
42to
0.17
3)
0.02
3
(0.0
13to
0.03
5)
0.05
8
(0.0
46to
0.07
0)
0.14
3
(0.1
33to
0.15
4)
0.09
7
(0.0
76to
0.12
6)
On
eso
uth
ern
refu
giu
m
60.
057
(0.0
43to
0.07
0)
0.09
8
(0.0
85to
0.11
0)
0.05
3
(0.0
40to
0.06
7)
0.00
4
()0.
007
to0.
015)
)0.
023
()0.
037
to)
0.00
9)
0.15
1
(0.1
25to
0.17
7)
0.02
5
(0.0
06to
0.04
5)
Tw
on
ort
her
nre
fug
ia
7)
0.08
3
()0.
067
to0.
110)
0.49
5
(0.4
80to
0.51
1)
0.19
7
(0.1
87to
0.20
7)
0.18
3
(0.1
80to
0.18
7)
0.43
6
(0.4
25to
0.44
7)
0.72
6
(0.7
11to
0.74
1)
0.17
8
(0.1
64to
0.19
1)
8)
0.02
6
()0.
035
to)
0.01
8)
0.50
6
(0.4
97to
0.51
4)
0.36
4
(0.3
55to
0.37
2)
0.26
6
(0.2
57to
0.27
4)
0.27
3
(0.2
65to
0.28
1)
0.63
1
(0.6
16to
0.64
6)
0.11
5
(0.1
06to
0.12
4)
90.
008
()0.
002
to0.
018)
0.46
6
(0.4
56to
0.47
6)
0.33
1
(0.3
20to
0.34
2)
0.23
3
(0.2
23to
0.24
2)
0.23
4
(0.2
24to
0.24
4)
0.58
0
(0.5
63to
0.59
7)
0.11
0
(0.0
99to
0.12
1)
10)
0.01
7
()0.
026
to)
0.00
7)
0.46
1
(0.4
53to
0.46
9)
0.24
4
(0.2
35to
0.25
2)
0.16
2
(0.1
53to
0.17
1)
0.37
1
(0.3
60to
0.38
2)
0.66
8
(0.6
57to
0.68
1)
0.11
3
(0.1
05to
0.12
2)
110.
301
(0.2
88to
0.31
4)
0.07
1
(0.0
60to
0.08
2)
0.08
8
(0.0
78to
0.09
9)
)0.
089
( )0.
098
to)
0.08
0)
0.05
4
(0.0
44to
0.06
4)
)0.
009
()0.
035
to0.
017)
0.26
9
(0.2
49to
0.29
0)
120.
272
(0.2
59to
0.28
5)
0.12
0
(0.1
07to
0.13
3)
0.11
4
(0.1
03to
0.12
5)
)0.
057
()0.
068
to)
0.04
6)
0.09
7
(0.0
85to
0.10
8)
0.10
7
(0.0
79to
0.13
5)
0.25
7
(0.2
37to
0.27
6)
130.
078
(0.0
67to
0.09
0)
0.40
4
(0.3
96to
0.41
2)
0.33
8
(0.3
28to
0.34
8)
0.18
2
(0.1
71to
0.19
3)
0.25
2
(0.2
42to
0.26
2)
0.63
6
(0.6
20to
0.65
1)
0.09
0
(0.0
78to
0.10
0)
140.
127
(0.1
14to
0.14
1)
0.41
8
(0.4
09to
0.42
7)
0.18
1
(0.1
70to
0.19
2)
0.05
4
(0.0
43to
0.06
5)
0.28
1
(0.2
68to
0.29
4)
0.44
1
(0.4
16to
0.46
6)
0.20
6
(0.1
91to
0.22
1)
15)
0.02
4
()0.
032
to)
0.01
5)
0.51
0
(0.5
02to
0.51
9)
0.34
0
(0.3
32to
0.34
8)
0.22
7
(0.2
19to
0.23
6)
0.24
3
(0.2
35to
0.25
0)
0.42
3
(0.4
13to
0.44
3)
0.11
6
(0.1
07to
0.12
5)
160.
117
(0.1
03to
0.13
0)
0.42
9
(0.4
21to
0.43
8)
0.18
0
(0.1
70to
0.19
0)
0.06
0
(0.0
49to
0.07
1)
0.28
6
(0.2
73to
0.29
9)
0.45
8
(0.4
33to
0.48
3)
0.17
5
(0.1
60to
0.19
0)
Tw
oso
uth
ern
refu
gia
170.
252
(0.2
39to
0.26
4)
0.32
2
(0.3
10to
0.33
5)
0.07
2
(0.0
60to
0.08
4)
)0.
081
()0.
090
to)
0.07
3)
0.07
4
(0.0
64to
0.08
4)
)0.
028
()0.
049
to)
0.00
6)
0.02
3
(0.0
02to
0.04
4)
95%
con
fid
ence
inte
rval
s[c
alcu
late
das
mea
n±
(sta
nd
ard
erro
ro
fth
em
ean
·1.
96)]
are
sho
wn
inb
rack
ets.
PHYLOGEOGRAP HY OF ANOPHELES IN IND O-BURM A 4543
� 2011 Blackwell Publishing Ltd

Den
sity
01
23
41.0 1.5 2.0 2.5 3.0 3.5 4.0
Psi (= number of possible divergence times)
50
100
150
200
Pr(Om
ega, E(t) I X)
00.0
0.1
0.2
0.3
0.4
0.5
E(t)
1.2
1.0
0.8
0.6
0.40.2
0.0
Omega
(a)
(b)
Fig. 4 The posterior distributions of parameters estimated using MsBayes [35]. a shows the posterior probability distribution of W,
the number of divergence times across multiple taxon pairs; b shows the three-dimensional joint-probability distribution of E(s), the
mean divergence time across multiple taxon pairs, and X, which represents the variance in estimated divergence times across taxon
pairs.
4544 K. MORGAN ET AL.
ronmental history on the distribution of genetic diver-
sity across all species.
Differences between species in the patterns of genetic
diversity, which are present despite a common influ-
ence of Pleistocene environmental change, can be
explained by a combination of stochastic effects and dif-
ferences in species biology. The SPLATCHE modelling
approach can provide some insight into the latter. The
fit of real to simulated data sets was influenced by lev-
els of pre-expansion migration between refugial regions,
representing levels of gene flow as populations
expanded from allopatric refugia during the intergla-
cials. Whereas An. minimus and An. philippinensis best
fitted a model of low pre-expansion migration, all
remaining species best fitted a model with higher levels
of gene flow, potentially representing differences in dis-
persal capacity.
The model fitting was also influenced by the breadth
of altitudinal range of high carrying capacity and low
friction during glacial periods, corresponding to a spe-
cies’ tolerance to glacial habitats. Anopheles minimus and
An. baimaii best fit models that have a low altitudinal
range, consistent with our understanding that these spe-
cies are highly forest dependent (Reid 1968; Darsie &
Pradhan 1990; Rattanarithikul et al. 2006). Anopheles
aconitus and An. sawadwongporni are the only species
that best fit evolutionary scenarios with a wider altitu-
dinal range, indicating greater flexibility to glacial habi-
tats. Anopheles aconitus is more of an ecological
generalist, utilizing exposed larval habitats such as rice
paddies and ditches (Overgaard et al. 2003). During gla-
cial periods, An. aconitus may have been able to survive
in a relatively wide range of habitats, providing they
retained sufficient moisture to provide appropriate
� 2011 Blackwell Publishing Ltd

PHYLOGEOGRAP HY OF ANOPHELES IN IND O-BURM A 4545
larval habitat. A similar argument may apply to
An. sawadongporni as its larval habitats, shaded streams
(Rattanarithikul et al. 2006), could also potentially occur
across a wider altitudinal range than forest habitats.
However, it would then be surprising that An. macula-
tus, which is apparently ecologically similar and closely
related to An. sawadongporni (Rattanarithikul et al. 2006;
Morgan et al. 2009), best fitted models with narrow alti-
tudinal ranges of suitable glacial habitat. This apparent
difference is also striking given that over the same area
of mainland South-East Asia (i.e. excluding eastern
China, Taiwan and Sri Lanka), the gene trees of both
species indicate recent range expansions. This suggests
that the differences in the altitudinal ranges of suitable
glacial habitat for these two species may be due to limi-
tations in the SPLATCHE modelling approach, for
example, in the limited number of scenarios modelled
and ⁄ or the greater geographical sampling coverage for
An. maculatus. If An. aconitus, An. sawadongporni and
perhaps also An. maculatus are more plastic in their
habitat requirements, this may underlie their lack of
formation of deeply divergent lineages, presumably
owing to lower levels of isolation during glacial periods
compared to the other more forest-associated species in
this study.
The spatially explicit modelling approach provided
strong evidence for the persistence of mosquito popula-
tions in two allopatric northern refugia, in the east and
the west of South-East Asia, during the Pleistocene gla-
cial periods. The approach had insufficient power, how-
ever, to distinguish between the potential eastern
regions of northern Vietnam and Yunnan, and between
the potential western regions of northern Myanmar and
northeastern India. Northern Vietnam, northeastern
India and northern Myanmar were all identified as
putative forest refugial regions, based on a phylogenetic
study of the Neocellia Series of Anopheles mosquitoes
(Morgan et al. 2009). Northern Vietnam has also been
proposed as a refugial region for the following forest-
associated taxa: Anopheles baimaii (Morgan et al. 2010),
the bird species Sasia ochracea (Fuchs et al. 2008) and
Colobinae monkeys (Brandon-Jones 1996). The substan-
tial population structure within Anopheles jeyporiensis,
which is limited to the north of South-East Asia, further
supports the persistence of suitable forest habitat in the
north throughout the Pleistocene. Increased, high-den-
sity sampling throughout the mountainous northern
regions may enable the locations of Pleistocene forest
refugia to be more precisely pinpointed, the relative
importance of those refugia defined and any additional
complexity, such as microrefugia (Rull 2010), identified.
Because of the long-term persistence of populations
within glacial refugia, such regions are expected to
accumulate greater diversity than recently colonized,
� 2011 Blackwell Publishing Ltd
less stable regions (Hewitt 1999, 2001). For example,
within continental Europe, the long-term survival of
many species in southern refugia has led to greater
genetic diversity in the south relative to the more
recently colonized north (Hewitt 2001, 2004). In the for-
est-dependent South-East Asian taxa studied here, a
similar pattern is evident, but genetic diversity
increases with increasing latitude. North–south clines of
decreasing diversity along similar regions of the Thai–
Myanmar border have also been noted at the intraspe-
cific level in the black fly, Simulium tani (Pramual et al.
2005) and at the species level in sphingid moths (Beck
et al. 2007). This commonality of latitudinal diversity
gradient together with the demographic modelling sup-
ports a scenario of long-term survival in mountainous
northern refugia followed by more recent colonization
of the south for a range of taxa. All of the putative refu-
gial areas, northeast India, northern Myanmar, Yunnan
and northern Vietnam, are not only rich in genetic
diversity as observed here but are also noted regions of
high species biodiversity and endemicity (Pramual et al.
2005; Sterling & Hurley 2005; Ying-shan et al. 2007).
The results of this study support the importance of
montane regions as sources and sinks of tropical biodi-
versity, as has previously been documented in Borneo,
Malaya and Sumatra (in Crematogaster ants; Quek et al.
2007), in Africa (Fjeldsa & Lovett 1997; Roy 1997; Bowie
et al. 2006) and in South America (Fjeldsa & Rahbek
2006).
The Thai–Myanmar border is a suture zone where
the deeply divergent eastern and western lineages of
An. minimus and An. annularis overlap, and also a
potential hybrid zone where the sister taxa An. dirus
and An. baimaii meet (Morgan et al. 2010). Increased
sampling within the region is necessary to determine
whether An. splendidus and An. philippinensis also have
suture zones along the Thai–Myanmar border. Simulta-
neous divergence of eastern and western lineages
within An. annularis, An. minimus, An. philippinensis
and An. splendidus is strongly supported by hABC anal-
ysis and estimated to have occurred within the mid-
Pleistocene, �900 or �1300 kya, depending on the
divergence rate used. The �900 kya estimate is likely to
be more accurate because this used the divergence rate
of 2.3% pmy (Brower 1994), which was estimated from
groups taxonomically similar to Anopheles (e.g. several
Diptera) and the same gene, CO2. Conversely, the 1.5%
pmy divergence rate estimated by Quek et al. (2004)
used a very broad range of arthropods (including crabs)
and a different gene, CO1. Allopatric divergence in the
speciation of An. dirus and An. baimaii also dates to a
similar time period, �1 Ma using the faster Brower
(1994) rate of divergence (Morgan et al. 2010). The
simultaneous and apparently coincident formation of
4546 K. MORGAN ET AL.
suture ⁄ hybrid zones across several species suggests that
this divergence was indeed driven by a common influ-
ence of environmental change. The estimated date
(using either molecular clock) is too recent to have been
triggered by tectonic activity or orogony, which dates
back to 5 Ma or earlier in this mainland region (Hall
2002). A more likely explanation for the initial driving
of divergence is the change in Pleistocene glacial cycles
approximately 1 Ma, such that the cycles occurred more
rapidly and with increased severity (Imbrie et al. 1992).
The increased environmental pressures resulting from
this change may have intensified the fluctuations in for-
est cover, triggering diversification within forest-associ-
ated taxa.
The positioning of the suture zone may result from
the southwards projection of the northern mountainous
region into the narrow mountainous formation along
the Thai–Myanmar border (see Fig. 1). At the transition
into the post-glacial period, the regions close to the
mountains are likely to have been reforested prior to
the more distant and initially more arid areas of central
Myanmar and Thailand. Consequently, the mountain-
ous projection along the Thai–Myanmar border could
facilitate early southwards dispersal from eastern and
western refugia along its eastern and western flanks to
form the suture zone.
If the common patterns in the distribution of genetic
diversity detected in this study are also found in other
forest-associated taxa, the refugial regions of the moun-
tainous north of South-East Asia and the suture zone
on the Thai–Myanmar border would have particularly
high conservation value. These regions not only cur-
rently possess high and unique genetic diversity but
would also be important for the generation and mainte-
nance of biodiversity in the long term. Thus, northern
Vietnam, Yunnan, northern Myanmar and northeastern
India, as well as the border region of Thailand and
Myanmar, are highlighted as important regions for fur-
ther study. In this respect, Anopheles mosquitoes will be
useful in more fine-scale studies of these regions to
characterize in greater detail the effects of Pleistocene
environmental change. Above all, it is imperative that
comparable studies of other forest-dependent taxa,
including vertebrates, are conducted to determine the
taxonomic generality of the findings of this study and
ensure that this understanding can be taken into
account in planning conservation policy.
Acknowledgements
Thank you to all staff at the following institutions, for their
invaluable help in mosquito collection: Gauhati University in
northeastern India; the Office of Disease Prevention and Control
in Chiang Mai, Thailand; the Department for Medical Research,
Myanmar; the Centre of Malariology, Parasitology and Ento-
mology, Laos; the National Institute of Malariology, Parasitol-
ogy and Entomology, Vietnam; and the Center of Malariology,
Parasitology and Entomology in Phnom Penh, Cambodia. We
also thank David Robertson, University of Manchester, and
Michael Bruford, Cardiff University, for helpful discussion and
NERC, NSFC (Grant No. 31071968) and the Edinburgh NERC
Biomolecular Analysis Facility for funding and support.
References
Achard F, Eva HD, Stibig H-J et al. (2002) Determination of
deforestation rates of the world’s humid tropical forests.
Science, 297, 999–1002.
Amante C, Eakins BW (2009) ETOPO1 1 Arc-Minute Global
Relief Model: Procedures, Data Sources and Analysis. NOAA
Technical Memorandum NESDIS NGDC-24, 19 pp.
Bandelt H-J, Forster P, Rowhl A (1999) Median-joining
networks for inferring intraspecific phylogenies. Molecular
Biology and Evolution, 16, 37–48.
Beaumont MA, Zhang W, Balding DJ (2002) Approximate
Bayesian Computation in Population Genetics. Genetics, 162,
2025–2035.
Beck J, Kitching IJ, Haxaire J (2007) The latitudinal distribution
of Sphingid species richness in continental Southeast Asia:
what causes the biodiversity ‘hotspot’ in northern Thailand?
The Raffles Bulletin of Zoology, 55, 179–185.
Bermingham E, Moritz C (1998) Comparative phylogeography:
concepts and applications. Molecular Ecology, 7, 367–369.
Bowie RCK, Fjeldsa J, Hackett SJ, Bates JM, Crowe TM (2006)
Coalescent models reveal the relative roles of ancestral
polymorphism, vicariance, and dispersal in shaping
phylogeographical structure of an African montane forest
robin. Molecular Phylogenetics and Evolution, 38, 171–188.
Brandon-Jones D (1996) The Asian Colobinae (Mammalia:
Cercopithecidae) as indicators of Quaternary climatic
change. Biological Journal of the Linnean Society, 59, 327–350.
Brower A (1994) Rapid morphological radiation and convergence
among races of the butterfly Heliconius erato inferred from
patterns of mitochondrial DNA evolution. Proceedings of the
National Academy of Sciences, USA, 91, 6491–6495.
Carnaval AC, Hickerson MJ, Haddad CFB, Rodrigues MT,
Moritz C (2009) Stability predicts genetic diversity in the
Brazilian Atlantic forest hotspot. Science, 323, 785–789.
Chen B, Harbach RE, Butlin RK (2004) Genetic variation and
population structure of the mosquito Anopheles jeyporiensis in
southern China. Molecular Ecology, 13, 3051–3056.
Chen B, Pedro PM, Harbach RE, Somboon P, Walton C, Butlin
RK (2011) Mitochondrial DNA variation in the malaria
vector Anopheles minimus across China, Thailand and
Vietnam: evolutionary hypothesis, population structure and
population history. Heredity, 106, 241–252.
Clark PU, Dyke AS, Shakun JD et al. (2009) The last glacial
maximum. Nature, 325, 710–714.
Colinvaux PA, De Oliveira PE, Bush MB (2000) Amazonian
and neotropical plant communities on glacial time-scales: the
failure of the aridity and refuge hypotheses. Quaternary
Science Reviews, 19, 141–169.
Colinvaux PA, Irion G, Raesaenen ME, Bush MB (2001)
Geological and paleoecological data falsify the Haffer &
� 2011 Blackwell Publishing Ltd

PHYLOGEOGRAP HY OF ANOPHELES IN IND O-BURM A 4547
Prance refuge hypothesis of Amazonian speciation.
Amazoniana, 16, 609–646.
Covell G (1927) The Distribution of Anopheline Mosquitoes in
India and Ceylon. Indian Journal of Medical Research Memoirs,
5, 1–85.
Crisci JV, Katinas L, Posadas P (2003) Historical Biogeography:
An Introduction. Harvard University Press, Cambridge MA.
Currat M, Ray N, Excoffier L (2004) SPLATCHE: a program to
simulate genetic diversity taking into account environmental
heterogeneity. Molecular Ecology Notes, 4, 139–142.
Darsie RF, Pradhan SP (1990) The mosquitoes of Nepal: their
identification, distribution and biology. Mosquito Systematics,
22, 69–130.
Drummond AJ, Rambaut A (2007) BEAST: Bayesian
evolutionary analysis by sampling trees. BMC Evolutionary
Biology, 7, 214–221.
Endler JA (1982) Problems in distinguishing historical from
ecological factors in biogeography. American Zoologist, 22,
441–452.
Esselstyn JA, Timm RM, Brown RM (2009) Do geological or
climatic processes drive speciation in dynamic archipelagos?
The tempo and mode of diversification in Southeast Asia
shrews. Evolution, 63, 2595–2610.
Excoffier LGL, Schneider S (2005) Arlequin ver. 3.0: an
integrated software package for population genetics data
analysis. Evolutionary Bioinformatics Online, 1, 47–50.
Feldman CR, Spicer GS (2006) Comparative phylogeography of
woodland reptiles in California: repeated patterns of
cladogenesis and population expansion. Molecular Ecology,
15, 2201–2222.
Fjeldsa J (1994) Geographical patterns for relict and young
species of birds in Africa and South America and
implications for conservation priorities. Biodiversity and
Conservation, 3, 207–226.
Fjeldsa J, Lovett JC (1997) Geographical patterns of old and
young species in African forest biota: the significance of
specific montane areas as evolutionary centres. Biodiversity
and Conservation, 6, 325–346.
Fjeldsa J, Rahbek C (2006) Diversification of tanagers, a species
rich bird group, from lowlands to montane regions of South
America. Integrative and Comparative Biology, 46, 72–81.
Fuchs J, Ericson PGP, Pasquet E (2008) Mitochondrial
phylogeographic structure of the white-browed piculet (Sasia
ochracea): cryptic genetic differentiation and endemism in
Indochina. Journal of Biogeography, 35, 565–575.
Garros C, Harbach RE, Manguin S (2005) Systematics and
biogeographical implications of the phylogenetic
relationships between members of the Funestus and
Minimus Groups of Anopheles (Diptera: Culicidae). Journal of
Medical Entomology, 42, 7–18.
Gaston KJ (2000) Global Patterns in Biodiversity. Nature, 405,
220–227.
Gathorne-Hardy FJ, Syaukani, Davies RG, Eggleton P, Jones
DT (2002) Quaternary rainforest refugia in south-east Asia:
using termites (Isoptera) as indicators. Biological Journal of the
Linnean Society, 75, 453–466.
Haffer J (1969) Speciation in Amazonian forest birds. Science,
165, 131–137.
Haffer J, Prance GT (2001) Climatic forcing of evolution in
Amazonia during the Cenozoic: on the refuge theory of
biotic differentiation. Amazoniana, 16, 579–607.
� 2011 Blackwell Publishing Ltd
Hall R (2002) Cenozoic geological and plate tectonic evolution
of SE Asia and the SW Pacific: computer-based
reconstructions, model and animations. Journal of Asian Earth
Sciences, 20, 353–431.
Harbach RE, Kitching IJ (2005) Reconsideration of anopheline
mosquito phylogeny (Diptera: Culicidae: Anophelinae) based
on morphological data. Systematics and Biodiversity, 3, 345–
374.
Heaney LR (1991) A synopsis of climatic and vegetational
change in Southeast Asia. Climatic Change, 19, 53–61.
Heled J, Drummond A (2008) Bayesian inference of population
size history from multiple loci. BMC Evolutionary Biology, 8,
289.
Hewitt GM (1999) Post-glacial re-colonization of European
biota. Biological Journal of the Linnean Society, 68, 87–112.
Hewitt GM (2001) Speciation, hybrid zones and
phylogeography—or seeing genes in space and time.
Molecular Ecology, 10, 537–549.
Hewitt GM (2004) Genetic consequences of climatic oscillations
in the Quaternary. Proceedings of the Royal Society, B, 359,
183–195.
Hickerson MJ, Dolman G, Moritz C (2006) Comparative
phylogeographic summary statistics for testing simultaneous
vicariance. Molecular Ecology, 15, 209–223.
Hickerson MJ, Stahl E, Takebayashi N (2007) MsBayes:
pipeline for testing comparative phylogeographic histories
using hierarchical approximate Bayesian computation. BMC
Bioinformatics, 8, 268.
Hope G, Kershaw AP, van der Kaars S et al. (2004) History of
vegetation and habitat change in the Austral-Asian region.
Quaternary International, 118–119, 103–126.
Ihaka R, Gentleman R (1996) R: a language for data analysis
and graphics. Journal of Computational and Graphical Statistics,
5, 299–314.
Imbrie J, Boyle EA, Clemens SC, Duffy A, Howard WR et al.
(1992) On the structure and origin of major glaciation cycles
1. Linear responses to Milankovitch forcing. Paleoceanography,
7, 701–738.
Iyengar A, Babu VN, Hedges S, Venkataraman AB, Maclean N,
Morin PA (2005) Phylogeography, genetic structure, and
diversity in the dhole (Cuon alpinus). Molecular Ecology, 14,
2281–2297.
van der Kaars WA (1991) Palynology of eastern Indonesian
marine piston-cores: a Late Quaternary vegetational and
climatic record for Australasia. Palaeogeography,
Palaeoclimatology, Palaeoecology, 85, 239–302.
Kealhofer L, Penny D (1998) A combined pollen and phytolith
record for fourteen thousand years of vegetation change in
northeastern Thailand. Review of Palaeobotany and Palynology,
103, 83–93.
Knowles LL (2004) The burgeoning field of statistical
phylogeography. Journal of Evolutionary Biology, 17, 1–10.
Maharaj R (2003) Life table characteristics of Anopheles
arabiensis (Diptera: Culicidae) under simulated seasonal
conditions. Journal of Medical Entomology, 40, 737–742.
Manguin S, Garros C, Dusfour I, Harbach RE, Coosemans M
(2008) Bionomics, taxonomy, and distribution of the major
malaria vector taxa of Anopheles subgenus Cellia in Southeast
Asia: an updated review. Infection, Genetics and Evolution, 8,
489–503.
4548 K. MORGAN ET AL.
Mayle FE, Beerling DJ, Gosling WD, Bush MB (2004)
Responses of Amazonian ecosystems to climatic and
atmospheric carbon dioxide changes since the last glacial
maximum. Philosophical Transactions of the Royal Society B,
359, 499–514.
Morgan K, O’Loughlin SM, Mun-Yik F, Linton Y-M, Somboon
P et al. (2009) Molecular phylogenetics and biogeography of
the Neocellia Series of Anopheles mosquitoes in the Oriental
Region. Molecular Phylogenetics and Evolution, 52, 588–601.
Morgan K, Linton Y-M, Somboon P et al. (2010) Inter-specific
gene flow dynamics during the Pleistocene-dated speciation
of forest-dependent mosquitoes in Southeast Asia. Molecular
Ecology, 19, 2269–2285.
Moritz C (2002) Strategies to protect biological diversity and
the evolutionary processes that sustain it. Systematic Biology,
51, 238–254.
Moritz C, Patton JL, Schneider CJ, Smith TB (2000)
Diversification of rainforest faunas: an integrated molecular
approach. Annual Review of Ecology and Systematics, 31, 533–
563.
Moritz C, Richardson KS, Ferrier S et al. (2001)
Biogeographical concordance and efficiency of taxon
indicators for establishing conservation priority in a tropical
rainforest biota. Proceedings of the Royal Society, B, 268, 1875–
1881.
Moritz C, Hoskin CJ, MacKenzie JB et al. (2009) Identification
and dynamics of a cryptic suture zone in tropical rainforest.
Proceedings of the Royal Society B., 276, 1235–1244.
Myers N, Mittermeier RA, Mittermeier CG, da Fonseca GAB,
Kent J (2000) Biodiversity hotspots for conservation
priorities. Nature, 403, 853–858.
Nielsen R, Beaumont MA (2009) Statistical inferences in
phylogeography. Molecular Ecology, 18, 1034–1047.
O’Loughlin SM, Okabayashi T, Honda M, Kitazoe Y, Kishino
H et al. (2008) Complex population history of two Anopheles
dirus mosquito species in Southeast Asia suggests the
influence of Pleistocene climate change rather than human-
mediated effects. Journal of Evolutionary Biology, 21, 1555–
1569.
Overgaard HJ, Ekbom B, Suwonkerd W, Takagi M (2003)
Effect of landscape structure on anopheline mosquito
density and diversity in northern Thailand: implications for
malaria transmission and control. Landscape Ecology, 18,
605–619.
Penny D (2001) A 40,000 year palynological record from
north-east Thailand; implications for biogeography and
palaeo-environmental reconstruction. Palaeogeography Palae-
oclimatology Palaeoecology, 171, 97–128.
Posada D, Crandall KA (1998) MODELTEST: testing the model
of DNA substitution. Bioinformatics, 14, 817–818.
Pramual P, Kuvangkadilok C, Baimai V, Walton C (2005)
Phylogeography of the black fly Simulium tani (Diptera:
Simuliidae) from Thailand as inferred from mtDNA
sequences. Molecular Ecology, 14, 3989–4001.
Quek S-P, Davies SJ, Itino T, Pierce NE (2004) Codiversification
in an ant-plant mutualism: stem texture and the evolution of
host use in Crematogaster (FormicidaeL Myrmicinae) in
habitats of Macaranga (Euphorbiaceae. Evolution, 58, 554–
570.
Quek S-P, Davies SJ, Ashton PS, Itino T, Pierce NE (2007) The
geography of diversification in mutualistic ants: a gene’s-eye
view into the Neogene history of Sundaland rain forests.
Molecular Ecology, 16, 2045–2062.
Rattanarithikul R, Harrison BA, Harbach RE, Panthusiri P,
Coleman RE (2006) Illustrated keys to the mosquitoes of
Thailand IV. Anopheles. Southeast Asian Journal of Tropical
Medicine and Public Health, 37(Suppl. 2), 1–128.
Ray N, Currat M, Berthier P, Excoffier L (2005) Recovering the
geographic origin of early modern humans by realistic and
spatially explicit simulations. Genome Research, 15, 1161–1167.
Reddy S (2008) Systematics and biogeography of the shrike
babblers (Pteruthius): species limits, molecular phylogenetics,
and diversification patterns across southern Asia. Molecular
Phylogenetics and Evolution, 47, 54–72.
Reid JA (1968) Anopheline Mosquitoes of Malaya and Borneo.
Government of Malaysia, Malaysia.
Roy MS (1997) Recent diversification in African greenbuls
(Pycnonotidae: Andropadus) supports a montane speciation
model. Proceedings of the National Academy of Sciences, USA,
264, 1337–1344.
Rull V (2010) On microrefugia and cryptic refugia. Journal of
Biogeography, 37, 1623–1625.
Sambrook J (1989) Molecular Cloning: A Laboratory Manual. Cold
Spring Harbor Laboratory, Cold Spring Harbor, NY.
Schneider CJ, Cunningham M, Moritz C (1998) Comparative
phylogeography and the history of endemic vertebrates in
the Wet Tropics rainforests of Australia. Molecular Ecology, 7,
487–498.
Sharpe RG, Harbach RE, Butlin RK (2000) Molecular variation
and phylogeny of members of the Minimus Group of
Anopheles subgenus Cellia (Diptera: Culicidae). Systematic
Entomology, 25, 263–272.
Sodhi NS, Koh LP, Brook BW, Ng PKL (2004) Southeast Asian
biodiversity: an impending disaster. Trends in Ecology &
Evolution, 19, 654–660.
Steppan SJ, Zawadzki C, Heaney LR (2003) Molecular phylogeny
of the endemic Philippine rodent Apomys (Muridae) and the
dynamics of diversification in an oceanic archipelago.
Biological Journal of the Linnean Society, 80, 699–715.
Sterling EJ, Hurley MM (2005) Conserving biodiversity in
Vietnam: applying biogeography to conservation research.
Proceedings of the Californian Academy of Sciences, 56(Suppl. 1),
98–118.
Thompson J, Gibson T, Plewniak F, Jeanmougin F, Higgins D
(1997) The CLUSTAL_X windows interface: flexible
strategies for multiple sequence alignment aided by quality
analysis tools. Nucleic Acids Research, 25, 4876–4882.
Vidya TNC, Sukumar R, Melnick DJ (2009) Range-wide
mtDNA phylogeography yields insights into the origins of
Asian elephants. Proceedings of the Royal Society, B, 276, 893–
902.
Voris HK (2000) Maps of Pleistocene sea levels in Southeast
Asia: shorelines, river systems and time durations. Journal of
Biogeography, 27, 1153–1167.
White JC, Penny D, Kealhofer L, Maloney B (2004) Vegetation
changes from the late Pleistocene through the Holocene from
three areas of archaeological significance in Thailand.
Quaternary International: The Record of Human ⁄ Climate
Interaction in Lake Sediments, 113, 111–132.
Ying-shan P, Zhi-yi Z, Li-na P (2007) Strategic studies on the
biodiversity sustainability in Yunnan Province, Southwest
China. Forestry Studies in China, 9, 225–237.
� 2011 Blackwell Publishing Ltd

PHYLOGEOGRAP HY OF ANOPHELES IN IND O-BURM A 4549
Ziegler T, Abegg C, Meijaard E et al. (2007) Molecular
phylogeny and evolutionary history of Southeast Asian
macaques forming the M. silenus group. Molecular
Phylogenetics and Evolution, 42, 807–816.
This study forms part of the PhD thesis work of K.M. and
S.M.O’L. investigating the processes generating patterns of
genetic diversity in South-East Asia. B.C., D.T., P.S. and M.Y.F.
are mosquito biologists interested in the biodiversity of
mosquitoes in South-East Asia. Y-M.L. is a mosquito systema-
tist. R.B. is a population geneticist with research interests in
mechanisms of speciation. R.V. is currently studying for a PhD
in theoretical evolutionary genetics at Queen Mary, University
of London. A.P., P.T.H., T.H., S.N., D.S. and T.H.D. are inter-
ested in understanding mosquito biodiversity with respect to
the transmission of vector-borne disease in their respective
countries. C.W. is a population geneticist interested in under-
standing the processes generating and maintaining tropical
biodiversity.
Data accessibility
All sequence and sampling locality data, including GPS coordi-
nates, have been archived in Dryad with the reference
doi:10.5061/dryad.dc7m1. Sequence data generated in this
study are available from GenBank, under the accession num-
bers HQ403680–HQ404165.
� 2011 Blackwell Publishing Ltd
Supporting information
Additional supporting information may be found in the online
version of this article.
Fig. S1 Bayesian Skyline Plots, as constructed in BEAST v1.4
[49], showing changes in effective population size within each
species over time.
Fig. S2 Correlation coefficients for the FST matrices of each
intraspecific dataset to the matrices of the 1000 datasets simu-
lated under various evolutionary scenarios in SPLATCHE. Ver-
tical bars indicate means. The red histogram shows the
correlation coefficients between the real data and data simu-
lated under the best fitting evolutionary model; the blue histo-
gram shows the coefficients under the scenario that differs
from the best fitting scenario only in the range of glacial carry-
ing capacities (Figure 2a or b); the black histogram shows the
coefficients under the null model (see Table 1 for details).
Fig. S3 The relationship between genetic diversity, as repre-
sented by hp, and latitude, across the seven species included
within this study.
Table S1 Details of sample locations and numbers of speci-
mens obtained for each species.
Please note: Wiley-Blackwell are not responsible for the content
or functionality of any supporting information supplied by the
authors. Any queries (other than missing material) should be
directed to the corresponding author for the article.