Embed Size (px)
Citation preview
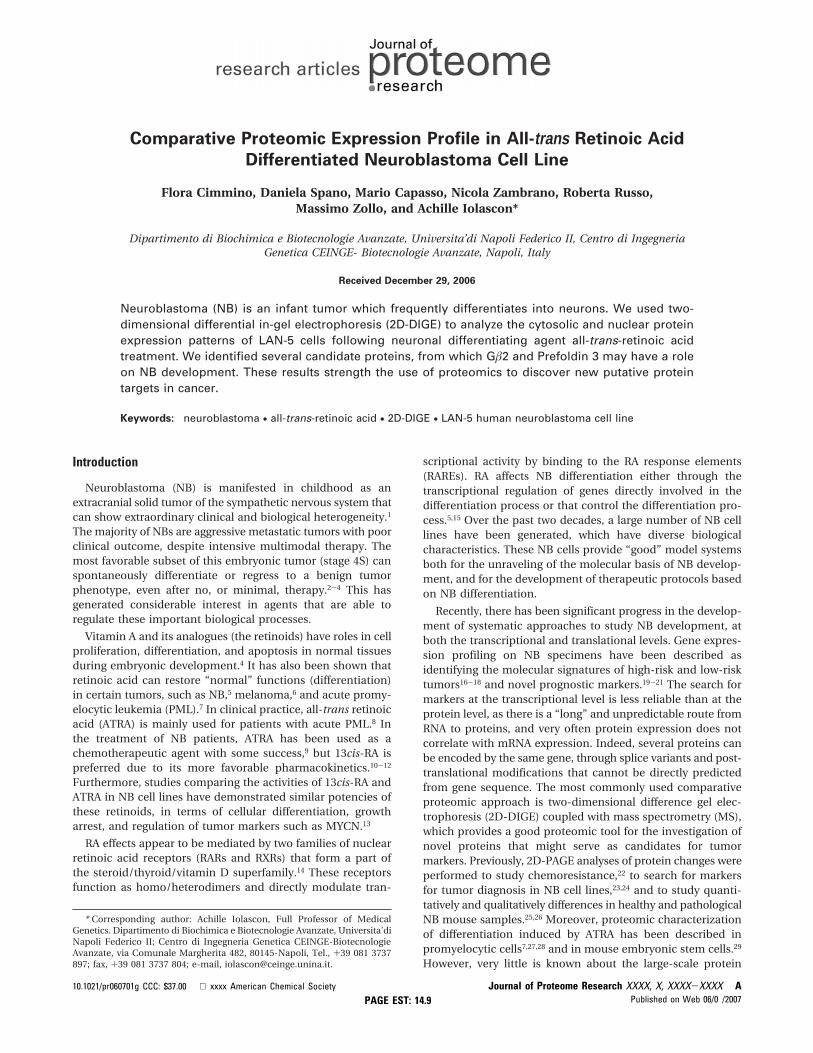
Comparative Proteomic Expression Profile in All-trans Retinoic Acid
Differentiated Neuroblastoma Cell Line
Flora Cimmino, Daniela Spano, Mario Capasso, Nicola Zambrano, Roberta Russo,Massimo Zollo, and Achille Iolascon*
Dipartimento di Biochimica e Biotecnologie Avanzate, Universita’di Napoli Federico II, Centro di IngegneriaGenetica CEINGE- Biotecnologie Avanzate, Napoli, Italy
Received December 29, 2006
Neuroblastoma (NB) is an infant tumor which frequently differentiates into neurons. We used two-dimensional differential in-gel electrophoresis (2D-DIGE) to analyze the cytosolic and nuclear proteinexpression patterns of LAN-5 cells following neuronal differentiating agent all-trans-retinoic acidtreatment. We identified several candidate proteins, from which Gâ2 and Prefoldin 3 may have a roleon NB development. These results strength the use of proteomics to discover new putative proteintargets in cancer.
Keywords: neuroblastoma • all-trans-retinoic acid • 2D-DIGE • LAN-5 human neuroblastoma cell line
Introduction
Neuroblastoma (NB) is manifested in childhood as anextracranial solid tumor of the sympathetic nervous system thatcan show extraordinary clinical and biological heterogeneity.1
The majority of NBs are aggressive metastatic tumors with poorclinical outcome, despite intensive multimodal therapy. Themost favorable subset of this embryonic tumor (stage 4S) canspontaneously differentiate or regress to a benign tumorphenotype, even after no, or minimal, therapy.2-4 This hasgenerated considerable interest in agents that are able toregulate these important biological processes.
Vitamin A and its analogues (the retinoids) have roles in cellproliferation, differentiation, and apoptosis in normal tissuesduring embryonic development.4 It has also been shown thatretinoic acid can restore “normal” functions (differentiation)in certain tumors, such as NB,5 melanoma,6 and acute promy-elocytic leukemia (PML).7 In clinical practice, all-trans retinoicacid (ATRA) is mainly used for patients with acute PML.8 Inthe treatment of NB patients, ATRA has been used as achemotherapeutic agent with some success,9 but 13cis-RA ispreferred due to its more favorable pharmacokinetics.10-12
Furthermore, studies comparing the activities of 13cis-RA andATRA in NB cell lines have demonstrated similar potencies ofthese retinoids, in terms of cellular differentiation, growtharrest, and regulation of tumor markers such as MYCN.13
RA effects appear to be mediated by two families of nuclearretinoic acid receptors (RARs and RXRs) that form a part ofthe steroid/thyroid/vitamin D superfamily.14 These receptorsfunction as homo/heterodimers and directly modulate tran-
scriptional activity by binding to the RA response elements(RAREs). RA affects NB differentiation either through thetranscriptional regulation of genes directly involved in thedifferentiation process or that control the differentiation pro-cess.5,15 Over the past two decades, a large number of NB celllines have been generated, which have diverse biologicalcharacteristics. These NB cells provide “good” model systemsboth for the unraveling of the molecular basis of NB develop-ment, and for the development of therapeutic protocols basedon NB differentiation.
Recently, there has been significant progress in the develop-ment of systematic approaches to study NB development, atboth the transcriptional and translational levels. Gene expres-sion profiling on NB specimens have been described asidentifying the molecular signatures of high-risk and low-risktumors16-18 and novel prognostic markers.19-21 The search formarkers at the transcriptional level is less reliable than at theprotein level, as there is a “long” and unpredictable route fromRNA to proteins, and very often protein expression does notcorrelate with mRNA expression. Indeed, several proteins canbe encoded by the same gene, through splice variants and post-translational modifications that cannot be directly predictedfrom gene sequence. The most commonly used comparativeproteomic approach is two-dimensional difference gel elec-trophoresis (2D-DIGE) coupled with mass spectrometry (MS),which provides a good proteomic tool for the investigation ofnovel proteins that might serve as candidates for tumormarkers. Previously, 2D-PAGE analyses of protein changes wereperformed to study chemoresistance,22 to search for markersfor tumor diagnosis in NB cell lines,23,24 and to study quanti-tatively and qualitatively differences in healthy and pathologicalNB mouse samples.25,26 Moreover, proteomic characterizationof differentiation induced by ATRA has been described inpromyelocytic cells7,27,28 and in mouse embryonic stem cells.29
However, very little is known about the large-scale protein
* Corresponding author: Achille Iolascon, Full Professor of MedicalGenetics. Dipartimento di Biochimica e Biotecnologie Avanzate, Universita’diNapoli Federico II; Centro di Ingegneria Genetica CEINGE-BiotecnologieAvanzate, via Comunale Margherita 482, 80145-Napoli, Tel., +39 081 3737897; fax, +39 081 3737 804; e-mail, [email protected].
10.1021/pr060701g CCC: $37.00 xxxx American Chemical Society Journal of Proteome Research XXXX, X, XXXX-XXXX APAGE EST: 14.9 Published on Web 06/09/2007
components of early stage differentiation of NB cell lines intoneural cells by ATRA.
Recently, 2D-DIGE has shown advantages over traditional2D-PAGE for several aspects: (1) multiple pre-labeling ofsamples; (2) introducing a pooled internal standard; (3) co-detection; and (4) a wider dynamic range. This technology30
has been successfully applied to identify potential biomarkersof various cancers, such as colon cancer,31 oesophageal carci-noma,32 and breast cancer.33 In spite of this, one of thelimitations of DIGE-based proteomics is the low identificationrate of low-abundance proteins.34
To gain further insight into the molecular mechanisms ofNB differentiation induced by ATRA, we have combined the2D-DIGE proteomic approach and the advantages of subcel-lular fractionation of the LAN-5 cell line proteome in cytosolicand nuclear fractions, in response to ATRA treatment in a timecourse analysis. We detected significantly modulated expressionof 126 protein spots: 58 in the cytosolic fraction and 68 in thenuclear fraction. We identified 33 differentially expressedproteins from 38 picked spots and have validated some proteinexpression patterns in biologically different NB cell lines,indicating a common pattern of regulation. Further investiga-tions of these candidate markers using functional assays andcareful studies of many patients should lead to the identifica-tion of markers that can be used clinically and may provideinsights into the mechanisms of NB differentiation.
Materials and Methods
Cell Culture and Neuronal Differentiation. The humanLAN-5 NB cell line was grown in RPMI medium supplementedwith 10% heat-inactivated fetal bovine serum (FBS), 100 kU/Lpenicillin, and 100 mg/L streptomycin, at 37 °C, in 5% CO2 ina humidified atmosphere. The human SK-N-BE and SH-SY5YNB cell lines were grown in Dulbecco’s modified Eagle’smedium supplemented with 10% heat-inactivated FBS, 100kU/L penicillin and 100 mg/L streptomycin, at 37 °C, in 5%CO2 in a humidified atmosphere. The cells were passaged 1:4twice weekly and routinely fed 24 h before each experiment.
Neuronal differentiation was induced in cells at 80% con-fluence by 5 µM ATRA (Sigma) dissolved in dimethyl sulfoxide(DMSO). All experiments were performed under dim light, andthe tubes containing retinoids were wrapped in aluminum foil.
The cells were washed three times in 10 mL ice-coldphosphate-buffered saline (PBS) and harvested 0, 8, 24, and48 h after RA treatment, using a cell scraper. This time coursewas chosen to reflect primary or early responses of NB cell linesto the RA treatment. Each experiment was performed intriplicate. Three cellular plates for each experimental point (0,8, 24, and 48 h) were harvested, pooled, and centrifuged for 5min at 2000g at 4 °C. The pellets were frozen at -80 °C untilsample preparation.
Sample Preparation. 1. Cytosolic Protein Fraction Prepara-tion. The cell pellets were incubated on ice in ice-cold lysisbuffer (250 mM sucrose, 3 mM imidazole, pH 7.4, and 1 mMEDTA) in the presence of a protease inhibitor cocktail (Com-plete Mini EDTA-free, Roche). The cellular pellets were dis-rupted by 8-10 passes through a 22-guage needle, and thencentrifuged at 16 000g for 20 min at 4 °C. The pellets obtainedwere considered as the nuclear fraction, while the post-nuclearsupernatant (PNS) contained the cytosolic fraction and cellmembranes. The nuclear pellet was used for preparation of thenuclear extract.
The PNS was ultracentrifuged at 100 000g for 45 min at 4°C. The supernatant obtained here was used as the cytosolicfraction. The cytosolic fraction was solubilized in 7 M urea, 2M tiourea, 40 mM Tris-HCl, and 4% CHAPS and incubated for30 min under agitation at room temperature.
2. Nuclear Protein Fraction Preparation. The nuclear pelletobtained above was resuspended in 7 M urea, 2 M tiourea, 40mM Tris-HCl, pH 8.5, 0.24% Triton X-100, and 4% CHAPS. After30 min of incubation at room temperature, 10 mM sperminewas added, and the solution was incubated for 1 h at roomtemperature. The precipitated material was removed by ultra-centrifugation at 100 000g for 45 min at 4 °C.
The solubilized cytosolic and nuclear fractions were reducedby 5 mM tributylphosphine (TBP) for 90 min and were alkylatedby 10 mM iodacetamide (IAA) for 90 min, in tubes wrapped inaluminum foil. After, the samples were precipitated for 90 minin a mix of acetone/methanol (8:1) at -20 °C and centrifugedat 13 400g for 30 min, at 4 °C. The pellets were air-dried andsolubilized in 7 M urea, 2 M tiourea, 3% CHAPS, and 30 mMTris-HCl.
Protein concentrations were determined using the Bradfordmethod (Bio-Rad).
Cy-Dye Labeling of Cytosolic and Nuclear Fraction Ex-tracts. The pH of the samples was adjusted to pH 8.5 with 0.1M NaOH or HCl. Typically, 50 µg of extract was labeled with400 pmol Cy2 (standard mixture of extracts), Cy3, and Cy5(untreated and RA-treated cells). The labeling reaction wascarried out on ice in the dark for 30 min, and was stopped with1 mM lysine (final concentration). The samples were thenmixed, and supplemented with 0.5% carrier ampholytes pH3-10 (Bio-Rad) and 1% bromophenol blue. The final volumewas adjusted to 380 µL with 7 M urea, 2 M tiourea, and 3%CHAPS.
2-D Gel Electrophoresis, Imaging, and DIGE Analysis. Theimmobilized pH gradient IPG gel strips (length, 17 cm; thick-ness, 0.5 mm), nonlinear pH gradient range (NL) pH 3-10 (Bio-Rad) were passively rehydrated with 150 µg of tripartite-labeledsample (50 µg for each labeled sample and 50 µg internalstandard) in the dark overnight. Isoelectric focusing (IEF) wascarried out with a Protean IEF Cell (Bio-Rad), with a low initiallinear voltage up to 1000 V in 5 h, and then by applying avoltage gradient up to 10 000 V with a limiting current of 50µA/strip. The total product time × voltage applied was 76 000V/h for each strip, and the temperature was set to 20 °C. Thestrips were equilibrated in 6 M urea, 2% SDS, 20% glycerol,and 0.375 M Tris-HCl (pH 8.8), for 30 min in the dark.
Equilibrated IPG strips were transferred onto 18 × 20-cm11% polyacrilamide gels, within low-fluorescence glass plates(ETTAN-DALT, GE Healthcare). The second-dimension SDS-PAGE was performed using a Peltier-cooled DALT II electro-phoresis unit (GE Healthcare) at 1 W/gel overnight. The gelswere scanned with a Typhoon 9400 variable mode imager (GEHealthcare) using mutually exclusive excitation/emission wave-lengths for Cy2 (488 nm/520 nm), Cy3 (532 nm/580 nm), andCy5 (633 nm/670 nm). Images were normalized and analyzedfor statistics, and differentially expressed spots were quantifiedusing the DeCyder 5.0 software (GE Healthcare).
A DeCyder differential in-gel-analysis (DIA) module was usedfor pairwise comparisons of each sample (Cy3 and Cy5) to theCy2 mixed standard present in each gel. The DeCyder biologicalvariation analysis (BVA) module was then used to simulta-neously match all of the protein-spot maps from the gels, andto calculate average abundance ratios across triplicate samples.
research articles Cimmino et al.
B Journal of Proteome Research
Proteins with molecular masses from approximately 20-150kDa were resolved, and approximately 3000 spots/gel weredetected using the DeCyder image analysis software. To avoidfalse positives, only spots with a fold change equal or above1.3 and a p value e0.075 (Student’s t test) were taken inaccount. A manual sorting based on the quality of the proteinspots was also performed.
Protein Identification by MS. For preparative protein sepa-rations, 1 mg of unlabeled sample was used to passivelyrehydrate the IPG strips. The first and second dimension runswere conducted as described above. After 2-D electrophoresis,the separated proteins were visualized using the universalstaining methods of anionic dyes (Coomassie Colloidal Blue;Pierce). The resolved polypeptides were fixed in 10% aceticacid/40% methanol solution for 12-16 h before staining. Thestaining in Colloidal Coomassie was performed for 3 days, andthen the gels were washed three times in deionized H2O.Selected protein spots were excised from the gels and washedin 50 mM ammonium bicarbonate, pH 8.0, in 50% acetonitrileuntil completely distained. The gel pieces were re-suspendedin 50 mM ammonium bicarbonate, pH 8.0, containing 100 ngof trypsin, and incubated for 2 h at 4 °C and overnight at 37°C. The supernatants containing the resulting peptide mixtureswere removed, and the gel pieces were re-extracted withacetonitrile. The two fractions were then collected and freeze-dried.
1. MALDI MS Analysis. MALDI mass spectra were recordedon an Applied Biosystem Voyager DE-PRO mass spectrometerequipped with a reflectron analyzer and used in delayedextraction mode. One microliter of peptide sample was mixed
with an equal volume of R-cyano-4-hydroxycynnamic acid asmatrix (10 mg/mL in 0.2% trifluoroacetic acid (TFA) in 70%acetonitrile), applied to the metallic sample plate, and air-dried.Mass calibration was performed using the standard mixtureprovided by the manufacturer. Mass signals were then usedfor database searching using the MASCOT peptide fingerprint-ing search program (Matrix Science, Boston, MA), available onthe Internet.
2. LC-MS/MS Analysis. The unknown protein spots frompeptide mass fingerprinting were further analyzed by LC-MS/MS using a Q-TOF Ultima hybrid mass spectrometer (Micro-mass, Waters) equipped with a Z-spray source and coupled on-line with a capillary chromatography system (CapLC, Waters).The peptide mixture (10 µL) was first loaded onto a reverse-phase trap-column (Waters) at 10 µL/min using 0.2% formicacid as eluent. The sample was then transferred to a C18 reverse-
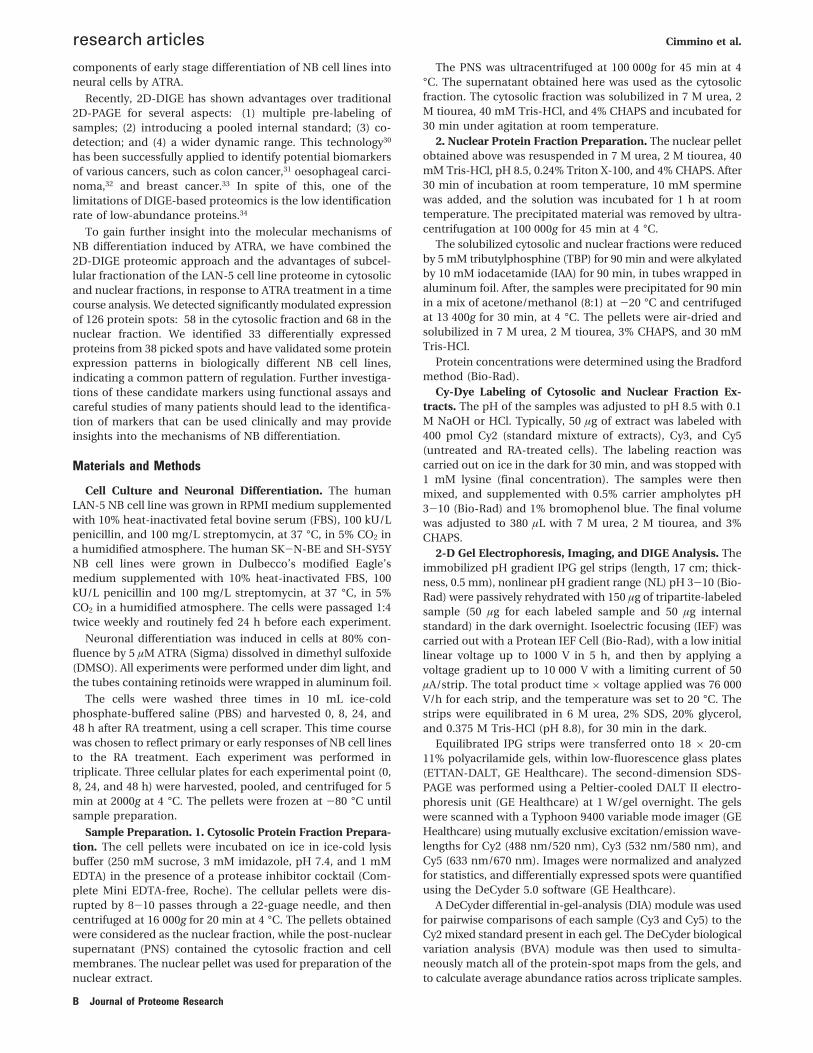
Figure 1. Western blotting was performed to test the cross-contamination of cytosolic (lane 1) and nuclear (lane 2) proteinextracts from the LAN-5 NB cell line. (A) The biochemical proteinmarkers used for the nuclei were anti-LMâ and anti-SP1 antibod-ies, and an anti-ENO antibody was used for the cytosolic fraction.(B) To check organelles enrichment in both fractions, cytochromeP450 and LAMP-2 proteins were used as marker of mitochondriaand lysosomes, respectively.
Table 1. Experimental Design of 2D-DIGEa
gel nï. Cy2 Cy3 Cy5
1 Experiment { 1 pooled standard 0 h 8 h2 pooled standard 24 h 48 h
2 Experiment { 3 pooled standard 0 h 8 h4 pooled standard 24 h 48 h
3 Experiment { 5 pooled standard 8 h 0 h6 pooled standard 48 h 24 h
a Scheme of labeling used for cytosolic and nuclear extracts.
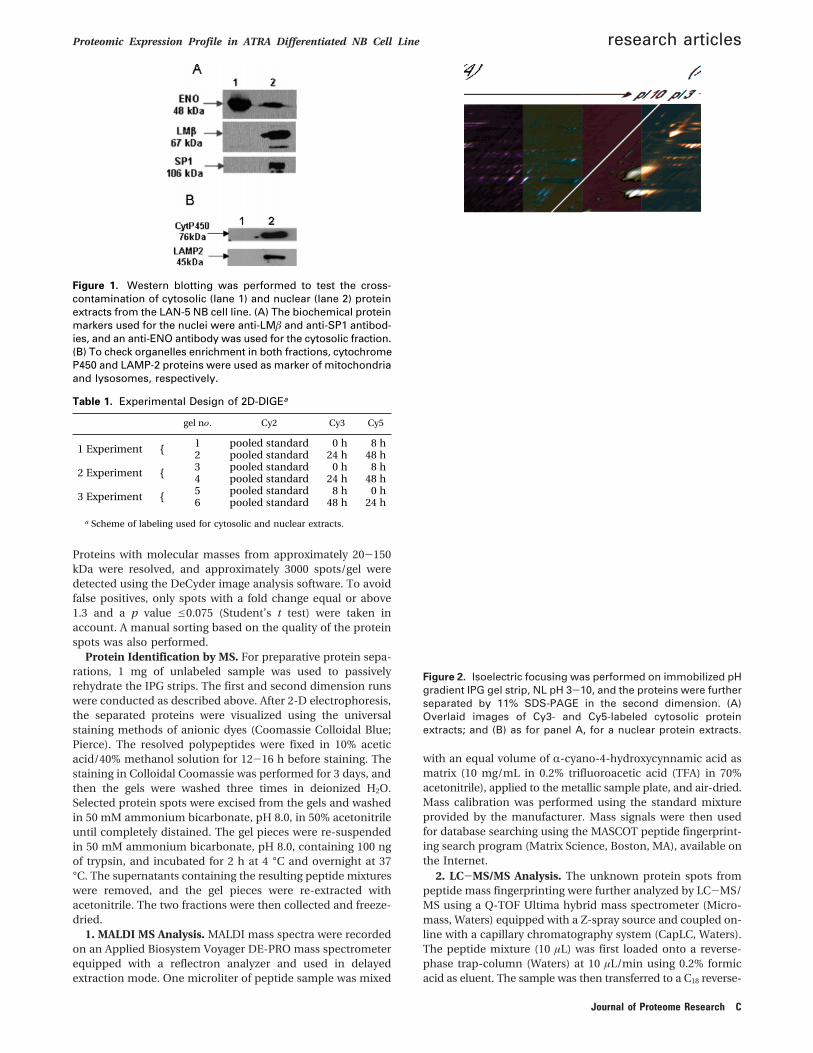
Figure 2. Isoelectric focusing was performed on immobilized pHgradient IPG gel strip, NL pH 3-10, and the proteins were furtherseparated by 11% SDS-PAGE in the second dimension. (A)Overlaid images of Cy3- and Cy5-labeled cytosolic proteinextracts; and (B) as for panel A, for a nuclear protein extracts.
Proteomic Expression Profile in ATRA Differentiated NB Cell Line research articles
Journal of Proteome Research C
phase capillary column (75 µm × 20 mm) at a flow rate of 280nL/min and fractionated using a linear gradient of runningbuffer B (0.2% formic acid in 95% acetonitrile) in running bufferA (0.2% formic acid in 5% acetonitrile) from 7% to 60% in 50min. The mass spectrometer was set up in the data-dependentMS/MS mode to alternatively acquire a full scan (m/z acquisi-tion range from 400 to 1600 Da/e) and a tandem mass spectrum(m/z acquisition range from 100 to 2000 Da/e). The three mostintense peaks in any full scan were selected as precursor ionsand fragmented by collision energy. Raw MS and MS/MSspectra were elaborated by the ProteinLynx software, providedby the manufacturers that generated a peak list containing allof the fragmentation data that was used for database searchingusing the MASCOT MS/MS ion search software for proteinidentification. The list of matched peptides is reported in Table4.
3. Protein Identification by Bionformatic Tools. Raw datafrom nanoLC-ESI-MS/MS analyses were converted into a
Mascot format text to identify proteins by means of a Mascotsoftware version 2.1 in home, MatrixScience.30 The proteinsearch both from nanoLC-ESI-MS/MS and MALDI MS analy-ses was governed by the following parameters: nonredundantprotein sequence data base (NCBInr -20061017 database with4 051 787 sequences and 1 396 484 404 residues downloaded;Sprot- 50.9 database with 235 673 sequences and 86 495 188residues downloaded); specificity of the proteolytic enzymeused for hydrolysis (trypsin); taxonomic category of the sample(Homo sapiens); no protein molecular weight was considered;up to 1 missed cleavage; cysteines as S-carbamidomethylcys-teines; unmodified N- and C-terminal ends; methionines bothunmodified and oxidized; putative pyroGlu formation by Gln;precursor peptide maximum mass tolerance of 150 ppm anda maximum fragment mass tolerance of 100 ppm.
Data Mining. Hierarchical cluster analysis was performedusing a tool available on the Internet (http://gepas.bioinfo.cnio.es/). The distance between protein expression profiles was
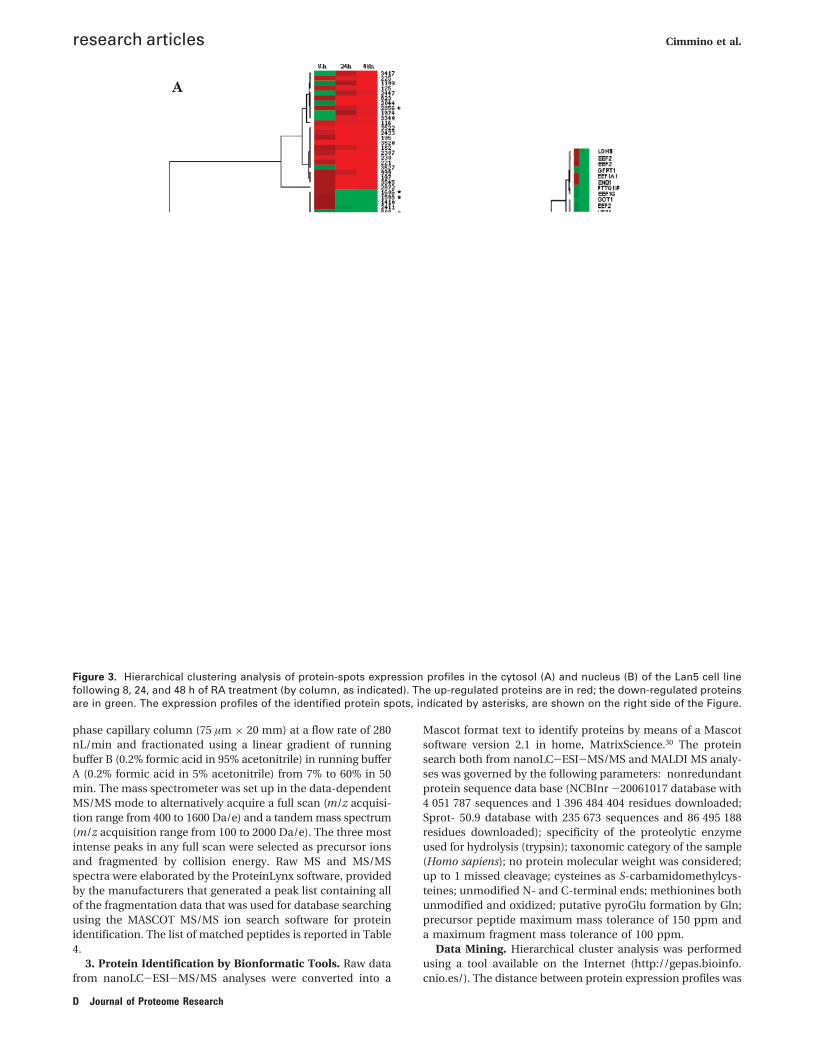
Figure 3. Hierarchical clustering analysis of protein-spots expression profiles in the cytosol (A) and nucleus (B) of the Lan5 cell linefollowing 8, 24, and 48 h of RA treatment (by column, as indicated). The up-regulated proteins are in red; the down-regulated proteinsare in green. The expression profiles of the identified protein spots, indicated by asterisks, are shown on the right side of the Figure.
research articles Cimmino et al.
D Journal of Proteome Research
calculated using Correlation Coefficient (linear), and the UP-GMA algorithm was used to construct dendrograms.35,36
The proteins were classified according to the DAVID 2.1 betaannotation system (http://david.niaid.nih.gov/david/ease.htm).This tool adopts the Fisher exact test to measure the protein-enrichment in annotation terms. A Fisher exact test P ) 0represents perfect enrichment. If the P-value is equal to orsmaller than 0.05, a protein would be considered stronglyenriched in the annotation categories.
Western Blotting. Cells were washed three times with ice-cold PBS and scraped into extraction buffer (50 mM Tris-HCl,pH 7.5, 150 mM NaCl, 1% (v/v) Triton X-100, 10% (v/v) glycerol,and complete protease inhibitor cocktail (Roche)), transferredto 1.5 mL microcentrifuge tubes, vortexed for 15 min at 4 °C,and centrifuged at 16 100g for 30 min at 4 °C.
Proteins extract concentrations were determined by theBradford assay (Bio-Rad). Thirty micrograms of total proteinlysates was diluted 1:1 with Laemmli SDS-PAGE sample buffer,loaded onto 12% polyacrylamide gels, and blotted onto poly-vinylidene difluoride membranes (PVDF; Bio-Rad). Membraneswere blocked with 5% non-fat milk (Bio-Rad) in PBS, pH 7.6,and 0.2% Tween-20 (PBS-T), and then incubated with specificcommercial goat anti-PRX II (peroxyredoxin-2), SgII (secretog-ranin II), NF-L (68 kDa neurofilament), EF-2 (elongation factor-2), prefoldin subunit 3 and Gâ2 (guanine-nucleotide-bindingprotein beta subunit 2) antibodies, a mouse anti-PCNA (pro-liferating cell nuclear antigen) antibody (1:100) (Santa CruzBiotechnology, Santa Cruz, CA), and a rabbit anti-EF1R (eu-karyotic elongation factor) antibody (1:100) (Upstate) at 4 °Covernight.
After a washing step in PBS-T, the membranes were incu-bated with a horseradish peroxidase (HRP)-conjugated anti-goat, anti-mouse, anti-rabbit antibody (1:10 000) (Santa Cruz
Biotechnology), and the immunoblots were visualized usingECL detection kits, with enhanced chemiluminescence (Pierce).A mouse â-actin antibody (1:1000) (Santa Cruz Biotechnology,Santa Cruz, CA) was used as the control for equal loading. Theprotein bands images on X-ray films were acquired with theGelDoc 2000 system (Bio-Rad). The densitometric measure-ments were performed by Quantity One 4.5 tool (Bio-Rad).
Results
DIGE Analysis of Differentially Expressed Proteins Follow-ing ATRA Treatment in the LAN-5 NB Cell Line. To determinethe molecular mechanisms involved in ATRA-induced dif-ferentiation in NB, we examined changes in the proteome ofLAN-5 NB cells. We analyzed the proteome in two differentcellular fractions, enriched in either cytosolic or nuclearproteins. We checked the quality of these fractions by Westernblotting using specific markers (Figure 1). The biochemicalprotein markers for nuclei included lamin â (LMâ), a markerof structural components of the nuclear matrix, and thetranscriptional factor SP1, a marker of the soluble nuclearfraction. As Figure 1 shows, LMâ and SP1 were mostly detectedin the nuclear fraction; on the contrary, the cytosolic biochemi-cal protein marker enolase (ENO) is mostly present in thecytosolic fraction, and only seen at low levels in the nuclearextract (Figure 1A). Moreover, we checked the enrichment ofsome organelles in both fractions. We used cytochrome P450reductase as a marker of mitochondria and lysosome-associ-ated membrane glycoprotein 2 (LAMP-2) as a marker oflysosomes. We observed that the nuclear fraction was alsoenriched in these organelles (Figure 1B).
The differential expression of the LAN-5 cytosolic andnuclear proteins as a function of ATRA treatment was analyzedat 8, 24, and 48 h of ATRA treatment using DIGE in a pH range
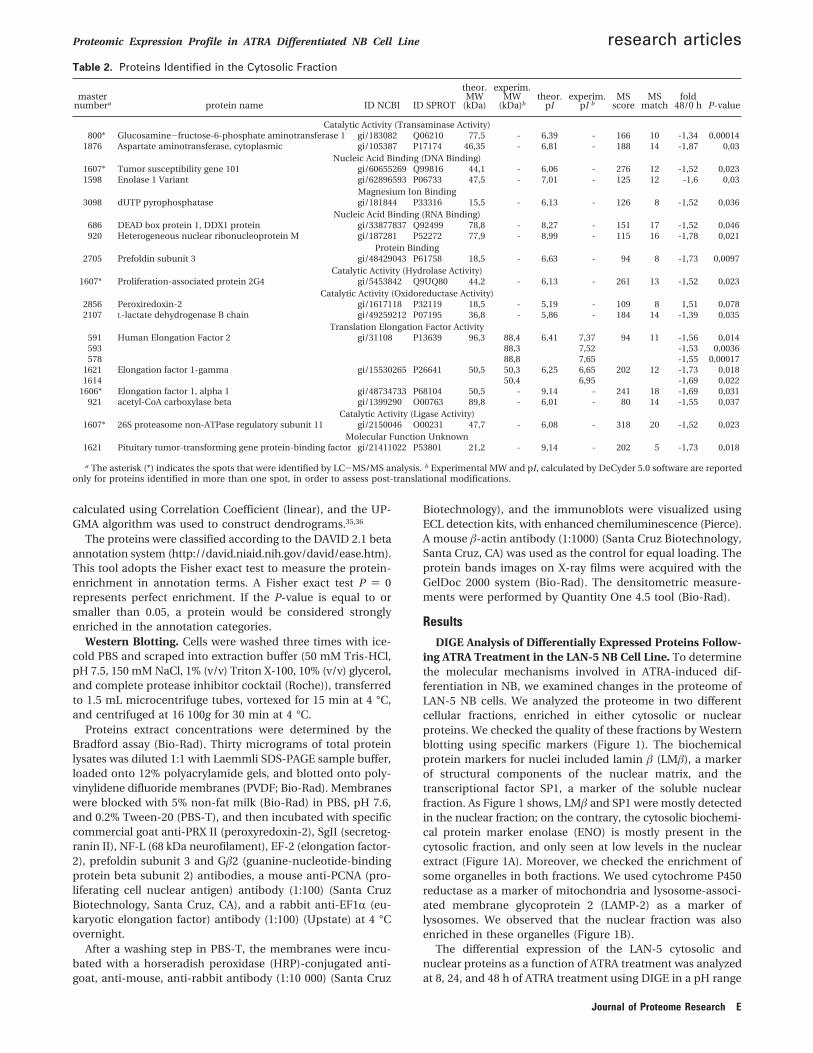
Table 2. Proteins Identified in the Cytosolic Fraction
masternumbera protein name ID NCBI ID SPROT
theor.MW
(kDa)
experim.MW
(kDa)btheor.
pIexperim.
pI bMS
scoreMS
matchfold
48/0 h P-value
Catalytic Activity (Transaminase Activity)800* Glucosamine-fructose-6-phosphate aminotransferase 1 gi/183082 Q06210 77,5 - 6,39 - 166 10 -1,34 0,00014
1876 Aspartate aminotransferase, cytoplasmic gi/105387 P17174 46,35 - 6,81 - 188 14 -1,87 0,03Nucleic Acid Binding (DNA Binding)
1607* Tumor susceptibility gene 101 gi/60655269 Q99816 44,1 - 6,06 - 276 12 -1,52 0,0231598 Enolase 1 Variant gi/62896593 P06733 47,5 - 7,01 - 125 12 -1,6 0,03
Magnesium Ion Binding3098 dUTP pyrophosphatase gi/181844 P33316 15,5 - 6,13 - 126 8 -1,52 0,036
Nucleic Acid Binding (RNA Binding)686 DEAD box protein 1, DDX1 protein gi/33877837 Q92499 78,8 - 8,27 - 151 17 -1,52 0,046920 Heterogeneous nuclear ribonucleoprotein M gi/187281 P52272 77,9 - 8,99 - 115 16 -1,78 0,021
Protein Binding2705 Prefoldin subunit 3 gi/48429043 P61758 18,5 - 6,63 - 94 8 -1,73 0,0097
Catalytic Activity (Hydrolase Activity)1607* Proliferation-associated protein 2G4 gi/5453842 Q9UQ80 44,2 - 6,13 - 261 13 -1,52 0,023
Catalytic Activity (Oxidoreductase Activity)2856 Peroxiredoxin-2 gi/1617118 P32119 18,5 - 5,19 - 109 8 1,51 0,0782107 L-lactate dehydrogenase B chain gi/49259212 P07195 36,8 - 5,86 - 184 14 -1,39 0,035
Translation Elongation Factor Activity591 Human Elongation Factor 2 gi/31108 P13639 96,3 88,4 6,41 7,37 94 11 -1,56 0,014593 88,3 7,52 -1,53 0,0036578 88,8 7,65 -1,55 0,00017
1621 Elongation factor 1-gamma gi/15530265 P26641 50,5 50,3 6,25 6,65 202 12 -1,73 0,0181614 50,4 6,95 -1,69 0,022
1606* Elongation factor 1, alpha 1 gi/48734733 P68104 50,5 - 9,14 - 241 18 -1,69 0,031921 acetyl-CoA carboxylase beta gi/1399290 O00763 89,8 - 6,01 - 80 14 -1,55 0,037
Catalytic Activity (Ligase Activity)1607* 26S proteasome non-ATPase regulatory subunit 11 gi/2150046 O00231 47,7 - 6,08 - 318 20 -1,52 0,023
Molecular Function Unknown1621 Pituitary tumor-transforming gene protein-binding factor gi/21411022 P53801 21,2 - 9,14 - 202 5 -1,73 0,018
a The asterisk (*) indicates the spots that were identified by LC-MS/MS analysis. b Experimental MW and pI, calculated by DeCyder 5.0 software are reportedonly for proteins identified in more than one spot, in order to assess post-translational modifications.
Proteomic Expression Profile in ATRA Differentiated NB Cell Line research articles
Journal of Proteome Research E
of 3.0-10.0. The samples were labeled according to the schemeshown in Table 1. To increase biological and statistical signifi-cance of the results, we prepared the protein lysates from threeindependent treatments of LAN-5 NB cultures. Accordingly,each experiment required two sets of gels (see Table 1).
The protein extracts to compare were prelabeled with eitherCy3 or Cy5 fluorescent dyes. Each Cy3/Cy5-labeled sample pairwas co-mixed with a Cy2-labeled pooled standard samplecontaining an equal amount of all 12 samples analyzed bothfor cytosolic and nuclear fractions. The Cy2/Cy3/Cy5 labeledsamples run together on the same gel. Furthermore, weinterchanged the labeling design in the third experiment toreduce the effects of preferential binding of dyes to proteins.For each gel, the Cy3, Cy5, and Cy2 images were imported intothe DeCyder DIA (difference in-gel analysis) module to revealthe differentially expressed protein spots featured in each gel.To identify the differentially expressed protein spots across thesix gels, both for cytosolic and nuclear fractions, the resultsfrom the intra-gel comparison (six DIA files) were importedinto the BVA module of DeCyder Software. For the cytosolicand nuclear fractions, one Cy2 image was selected as the masterimage, and the other five internal standard images werematched sequentially to it (Figure 2).
Approximately, 3000 protein spots were detected for boththe cytosolic and the nuclear fractions. The protein spots werethen filtered for the statistically relevant trend of regulation (pe 0.075; Student’s paired t test) among the various ATRAtreatment time points used. The analysis allowed us to find126 statistically relevant and differentially expressed spots: 58from the cytosolic fraction, and 68 from the nuclear fraction,with fold changes >1.3 or e1.3 (48 vs 0 h). In particular, 24
spots were more highly expressed and 34 spots were lessexpressed in the cytosolic fractions, with 43 spots and 25 inthe nuclear fractions, respectively.
The RA-induced proteome changes were classified on thebasis of the expression profiles of these 126 protein spots usinghierarchical clustering. As shown in Figure 3, the DeCyderanalysis data from both the cytosolic and nuclear fractionsdivide along two main branches, with each dividing further intotwo branches, showing evidence of four major categories: twoup-regulated categories in the upper dendrogram, and twodown-regulated categories in the lower dendrogram. Weobserved that in the two cellular compartments there are twosubclusters denoting proteins highly expressed at the 8 h andthen lower expressed at 48 h, and proteins that are lowerexpressed at 8 h and then highly expressed at 48 h.
To identify the differentially expressed proteins, 38 spots ofinterest were excised from the preparative gels, and in-geltrypsin digestion and mass spectrometry (MS/MS) analysiswere performed for protein identification. Successful identifica-tion was achieved if at least five peptides of experimental MS/MS data matched the internal sequence of the theoreticalcandidate protein. Mass spectrometric analysis identified 33proteins corresponding to 17 protein spots from the cytosolicfraction, and 16 from the nuclear fraction. The results of theprotein identification are given in Tables 2 and 3, and thepositions of the differentially expressed spots picked in the 2Dgel are shown in Figure 4.
In this study, we were not able to determine the identitiesof the protein components of other differentially expressedspots using either the MALDI-TOF or LC-MS/MS mass spec-trometric techniques. This may in part be due to insufficient
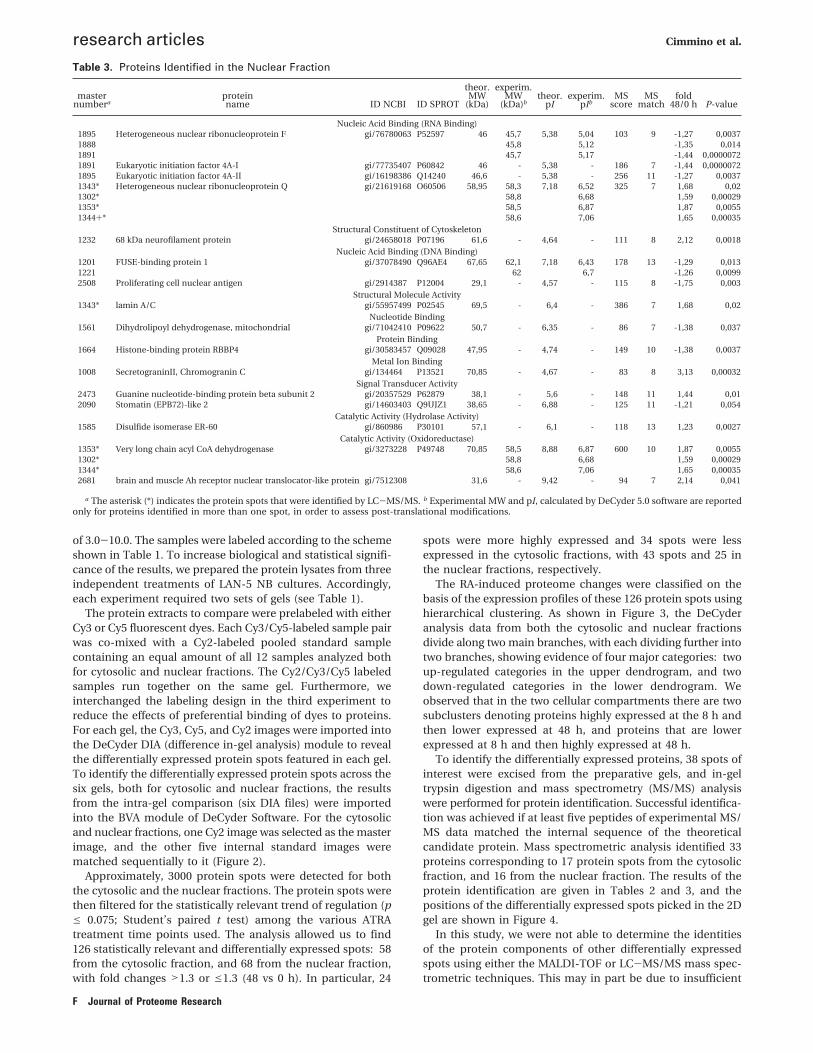
Table 3. Proteins Identified in the Nuclear Fraction
masternumbera
proteinname ID NCBI ID SPROT
theor.MW
(kDa)
experim.MW
(kDa)btheor.
pIexperim.
pIbMS
scoreMS
matchfold
48/0 h P-value
Nucleic Acid Binding (RNA Binding)1895 Heterogeneous nuclear ribonucleoprotein F gi/76780063 P52597 46 45,7 5,38 5,04 103 9 -1,27 0,00371888 45,8 5,12 -1,35 0,0141891 45,7 5,17 -1,44 0,00000721891 Eukaryotic initiation factor 4A-I gi/77735407 P60842 46 - 5,38 - 186 7 -1,44 0,00000721895 Eukaryotic initiation factor 4A-II gi/16198386 Q14240 46,6 - 5,38 - 256 11 -1,27 0,00371343* Heterogeneous nuclear ribonucleoprotein Q gi/21619168 O60506 58,95 58,3 7,18 6,52 325 7 1,68 0,021302* 58,8 6,68 1,59 0,000291353* 58,5 6,87 1,87 0,00551344+* 58,6 7,06 1,65 0,00035
Structural Constituent of Cytoskeleton1232 68 kDa neurofilament protein gi/24658018 P07196 61,6 - 4,64 - 111 8 2,12 0,0018
Nucleic Acid Binding (DNA Binding)1201 FUSE-binding protein 1 gi/37078490 Q96AE4 67,65 62,1 7,18 6,43 178 13 -1,29 0,0131221 62 6,7 -1,26 0,00992508 Proliferating cell nuclear antigen gi/2914387 P12004 29,1 - 4,57 - 115 8 -1,75 0,003
Structural Molecule Activity1343* lamin A/C gi/55957499 P02545 69,5 - 6,4 - 386 7 1,68 0,02
Nucleotide Binding1561 Dihydrolipoyl dehydrogenase, mitochondrial gi/71042410 P09622 50,7 - 6,35 - 86 7 -1,38 0,037
Protein Binding1664 Histone-binding protein RBBP4 gi/30583457 Q09028 47,95 - 4,74 - 149 10 -1,38 0,0037
Metal Ion Binding1008 SecretograninII, Chromogranin C gi/134464 P13521 70,85 - 4,67 - 83 8 3,13 0,00032
Signal Transducer Activity2473 Guanine nucleotide-binding protein beta subunit 2 gi/20357529 P62879 38,1 - 5,6 - 148 11 1,44 0,012090 Stomatin (EPB72)-like 2 gi/14603403 Q9UJZ1 38,65 - 6,88 - 125 11 -1,21 0,054
Catalytic Activity (Hydrolase Activity)1585 Disulfide isomerase ER-60 gi/860986 P30101 57,1 - 6,1 - 118 13 1,23 0,0027
Catalytic Activity (Oxidoreductase)1353* Very long chain acyl CoA dehydrogenase gi/3273228 P49748 70,85 58,5 8,88 6,87 600 10 1,87 0,00551302* 58,8 6,68 1,59 0,000291344* 58,6 7,06 1,65 0,000352681 brain and muscle Ah receptor nuclear translocator-like protein gi/7512308 31,6 - 9,42 - 94 7 2,14 0,041
a The asterisk (*) indicates the protein spots that were identified by LC-MS/MS. b Experimental MW and pI, calculated by DeCyder 5.0 software are reportedonly for proteins identified in more than one spot, in order to assess post-translational modifications.
research articles Cimmino et al.
F Journal of Proteome Research
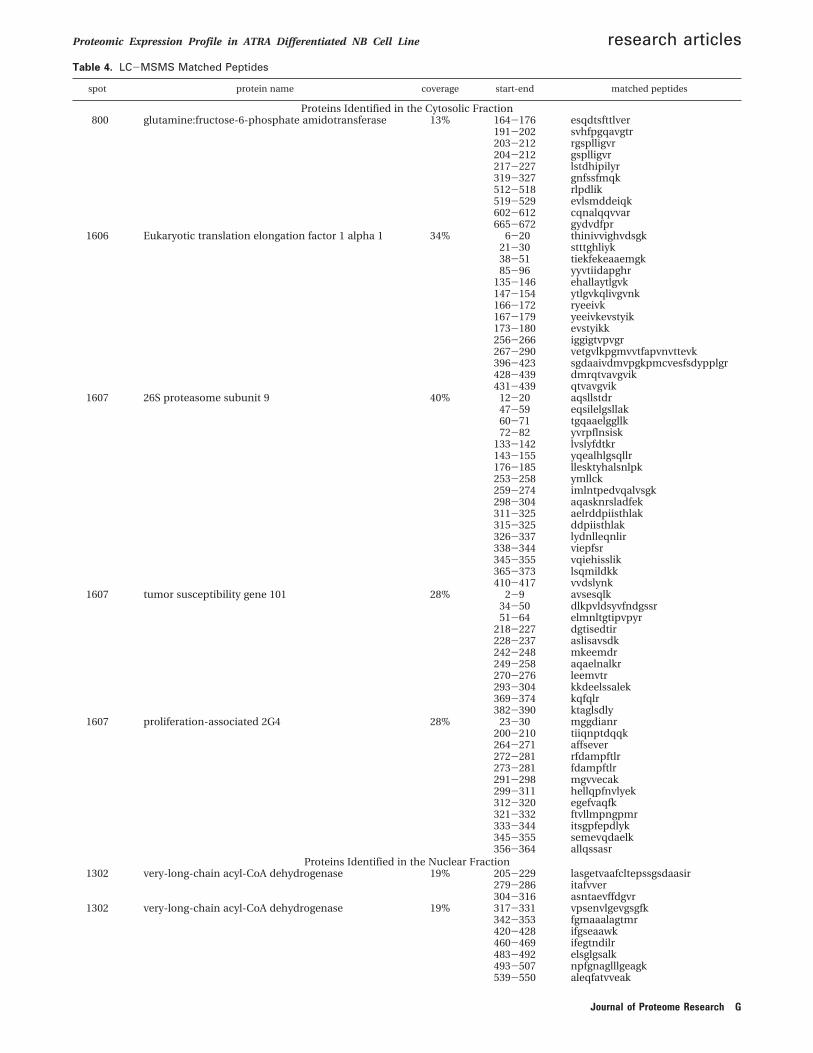
Table 4. LC-MSMS Matched Peptides
spot protein name coverage start-end matched peptides
Proteins Identified in the Cytosolic Fraction800 glutamine:fructose-6-phosphate amidotransferase 13% 164-176 esqdtsfttlver
191-202 svhfpgqavgtr203-212 rgsplligvr204-212 gsplligvr217-227 lstdhipilyr319-327 gnfssfmqk512-518 rlpdlik519-529 evlsmddeiqk602-612 cqnalqqvvar665-672 gydvdfpr
1606 Eukaryotic translation elongation factor 1 alpha 1 34% 6-20 thinivvighvdsgk21-30 stttghliyk38-51 tiekfekeaaemgk85-96 yyvtiidapghr
135-146 ehallaytlgvk147-154 ytlgvkqlivgvnk166-172 ryeeivk167-179 yeeivkevstyik173-180 evstyikk256-266 iggigtvpvgr267-290 vetgvlkpgmvvtfapvnvttevk396-423 sgdaaivdmvpgkpmcvesfsdypplgr428-439 dmrqtvavgvik431-439 qtvavgvik
1607 26S proteasome subunit 9 40% 12-20 aqsllstdr47-59 eqsilelgsllak60-71 tgqaaelggllk72-82 yvrpflnsisk
133-142 lvslyfdtkr143-155 yqealhlgsqllr176-185 llesktyhalsnlpk253-258 ymllck259-274 imlntpedvqalvsgk298-304 aqasknrsladfek311-325 aelrddpiisthlak315-325 ddpiisthlak326-337 lydnlleqnlir338-344 viepfsr345-355 vqiehisslik365-373 lsqmildkk410-417 vvdslynk
1607 tumor susceptibility gene 101 28% 2-9 avsesqlk34-50 dlkpvldsyvfndgssr51-64 elmnltgtipvpyr
218-227 dgtisedtir228-237 aslisavsdk242-248 mkeemdr249-258 aqaelnalkr270-276 leemvtr293-304 kkdeelssalek369-374 kqfqlr382-390 ktaglsdly
1607 proliferation-associated 2G4 28% 23-30 mggdianr200-210 tiiqnptdqqk264-271 affsever272-281 rfdampftlr273-281 fdampftlr291-298 mgvvecak299-311 hellqpfnvlyek312-320 egefvaqfk321-332 ftvllmpngpmr333-344 itsgpfepdlyk345-355 semevqdaelk356-364 allqssasr
Proteins Identified in the Nuclear Fraction1302 very-long-chain acyl-CoA dehydrogenase 19% 205-229 lasgetvaafcltepssgsdaasir
279-286 itafvver304-316 asntaevffdgvr
1302 very-long-chain acyl-CoA dehydrogenase 19% 317-331 vpsenvlgevgsgfk342-353 fgmaaalagtmr420-428 ifgseaawk460-469 ifegtndilr483-492 elsglgsalk493-507 npfgnaglllgeagk539-550 aleqfatvveak
Proteomic Expression Profile in ATRA Differentiated NB Cell Line research articles
Journal of Proteome Research G
amounts of protein in the spots, and also to the scarcity oftryptic digestion sites. In several cases, some well-separatedspots of similar mass but different charge were identified asthe same proteins. This may imply alternative post-translational
modifications, such as phosphorylation or multiple expressionforms. These possibilities have not been studied further to date.Similarly, some different proteins comigrated in the same spotunder our experimental conditions, and the identified pituitary
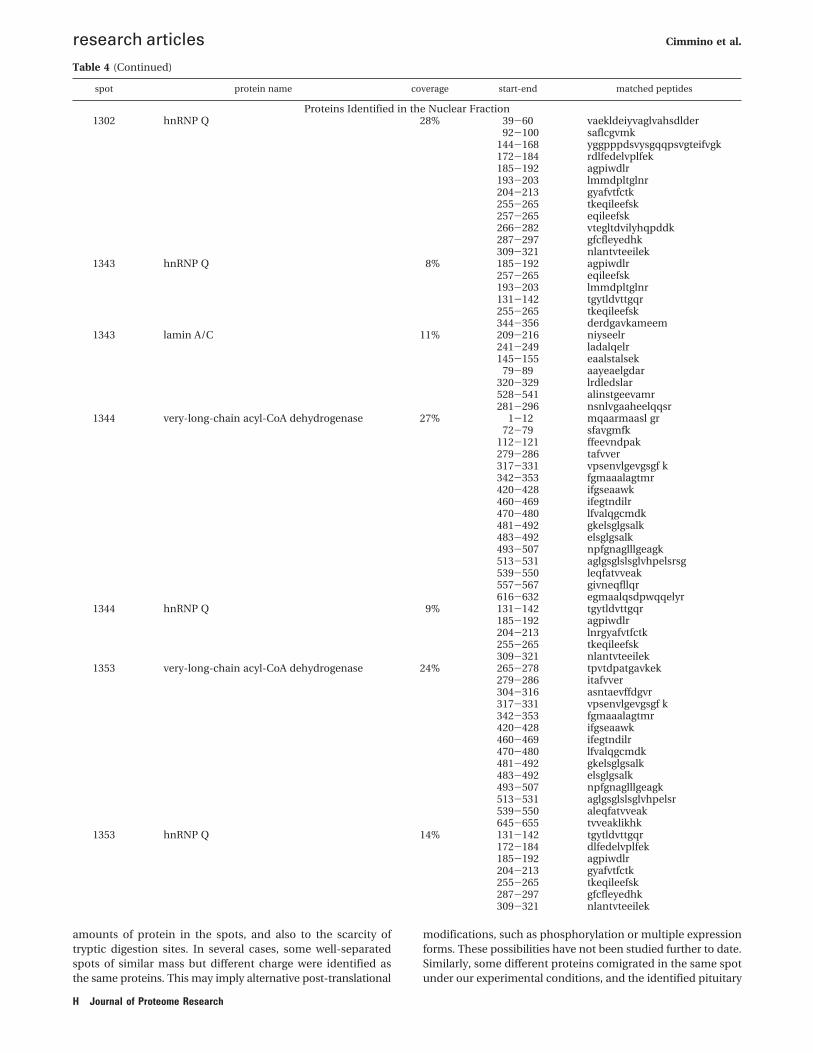
Table 4 (Continued)
spot protein name coverage start-end matched peptides
Proteins Identified in the Nuclear Fraction1302 hnRNP Q 28% 39-60 vaekldeiyvaglvahsdlder
92-100 saflcgvmk144-168 yggpppdsvysgqqpsvgteifvgk172-184 rdlfedelvplfek185-192 agpiwdlr193-203 lmmdpltglnr204-213 gyafvtfctk255-265 tkeqileefsk257-265 eqileefsk266-282 vtegltdvilyhqpddk287-297 gfcfleyedhk309-321 nlantvteeilek
1343 hnRNP Q 8% 185-192 agpiwdlr257-265 eqileefsk193-203 lmmdpltglnr131-142 tgytldvttgqr255-265 tkeqileefsk344-356 derdgavkameem
1343 lamin A/C 11% 209-216 niyseelr241-249 ladalqelr145-155 eaalstalsek
79-89 aayeaelgdar320-329 lrdledslar528-541 alinstgeevamr281-296 nsnlvgaaheelqqsr
1344 very-long-chain acyl-CoA dehydrogenase 27% 1-12 mqaarmaasl gr72-79 sfavgmfk
112-121 ffeevndpak279-286 tafvver317-331 vpsenvlgevgsgf k342-353 fgmaaalagtmr420-428 ifgseaawk460-469 ifegtndilr470-480 lfvalqgcmdk481-492 gkelsglgsalk483-492 elsglgsalk493-507 npfgnaglllgeagk513-531 aglgsglslsglvhpelsrsg539-550 leqfatvveak557-567 givneqfllqr616-632 egmaalqsdpwqqelyr
1344 hnRNP Q 9% 131-142 tgytldvttgqr185-192 agpiwdlr204-213 lnrgyafvtfctk255-265 tkeqileefsk309-321 nlantvteeilek
1353 very-long-chain acyl-CoA dehydrogenase 24% 265-278 tpvtdpatgavkek279-286 itafvver304-316 asntaevffdgvr317-331 vpsenvlgevgsgf k342-353 fgmaaalagtmr420-428 ifgseaawk460-469 ifegtndilr470-480 lfvalqgcmdk481-492 gkelsglgsalk483-492 elsglgsalk493-507 npfgnaglllgeagk513-531 aglgsglslsglvhpelsr539-550 aleqfatvveak645-655 tvveaklikhk
1353 hnRNP Q 14% 131-142 tgytldvttgqr172-184 dlfedelvplfek185-192 agpiwdlr204-213 gyafvtfctk255-265 tkeqileefsk287-297 gfcfleyedhk309-321 nlantvteeilek
research articles Cimmino et al.
H Journal of Proteome Research
tumor-transforming gene protein-binding factor PTTG1IP wasdetected in a spot which differed from its theoretical molecularmass and pI. This could reflect proteolytic degradation of theprotein or post-translational modifications, such as glycosyl-ation.
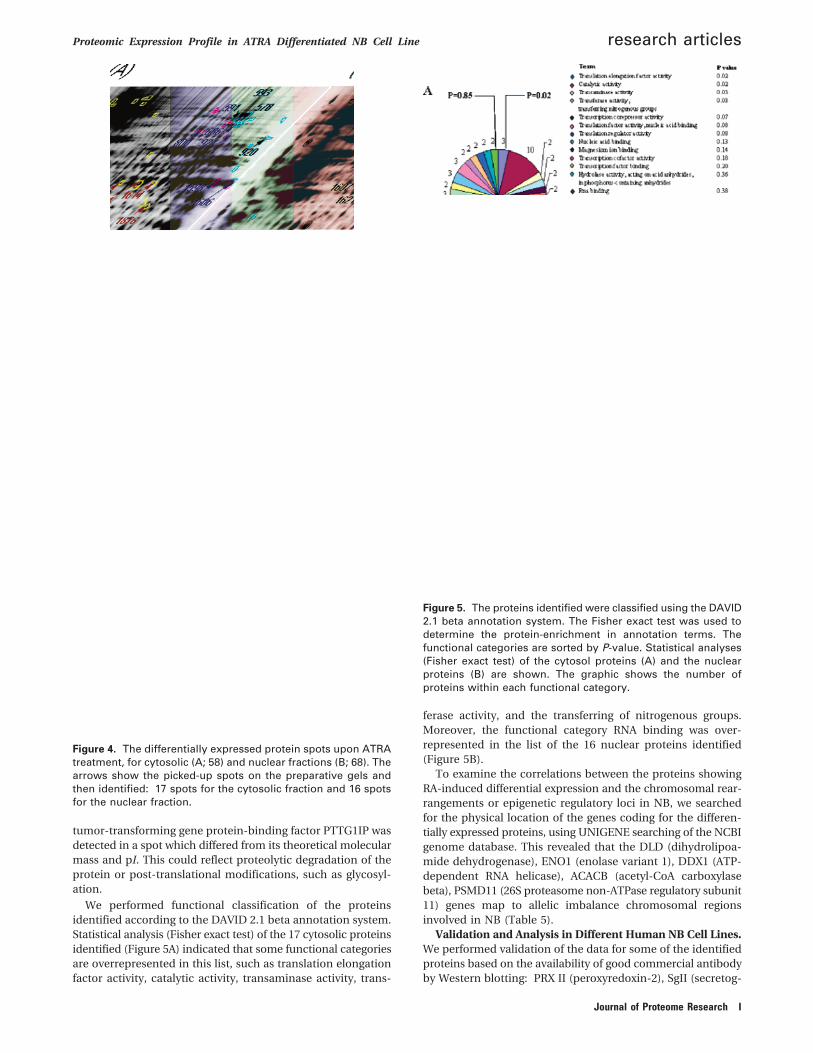
We performed functional classification of the proteinsidentified according to the DAVID 2.1 beta annotation system.Statistical analysis (Fisher exact test) of the 17 cytosolic proteinsidentified (Figure 5A) indicated that some functional categoriesare overrepresented in this list, such as translation elongationfactor activity, catalytic activity, transaminase activity, trans-
ferase activity, and the transferring of nitrogenous groups.Moreover, the functional category RNA binding was over-represented in the list of the 16 nuclear proteins identified(Figure 5B).
To examine the correlations between the proteins showingRA-induced differential expression and the chromosomal rear-rangements or epigenetic regulatory loci in NB, we searchedfor the physical location of the genes coding for the differen-tially expressed proteins, using UNIGENE searching of the NCBIgenome database. This revealed that the DLD (dihydrolipoa-mide dehydrogenase), ENO1 (enolase variant 1), DDX1 (ATP-dependent RNA helicase), ACACB (acetyl-CoA carboxylasebeta), PSMD11 (26S proteasome non-ATPase regulatory subunit11) genes map to allelic imbalance chromosomal regionsinvolved in NB (Table 5).
Validation and Analysis in Different Human NB Cell Lines.We performed validation of the data for some of the identifiedproteins based on the availability of good commercial antibodyby Western blotting: PRX II (peroxyredoxin-2), SgII (secretog-
Figure 4. The differentially expressed protein spots upon ATRAtreatment, for cytosolic (A; 58) and nuclear fractions (B; 68). Thearrows show the picked-up spots on the preparative gels andthen identified: 17 spots for the cytosolic fraction and 16 spotsfor the nuclear fraction.
Figure 5. The proteins identified were classified using the DAVID2.1 beta annotation system. The Fisher exact test was used todetermine the protein-enrichment in annotation terms. Thefunctional categories are sorted by P-value. Statistical analyses(Fisher exact test) of the cytosol proteins (A) and the nuclearproteins (B) are shown. The graphic shows the number ofproteins within each functional category.
Proteomic Expression Profile in ATRA Differentiated NB Cell Line research articles
Journal of Proteome Research I
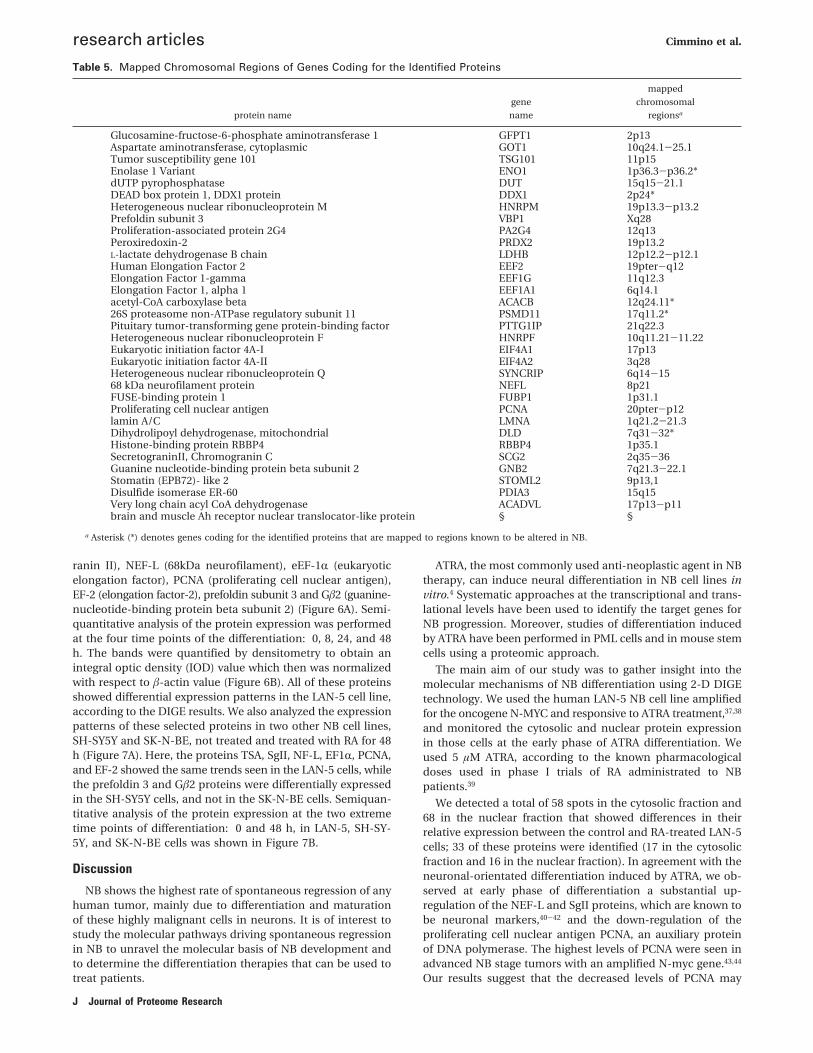
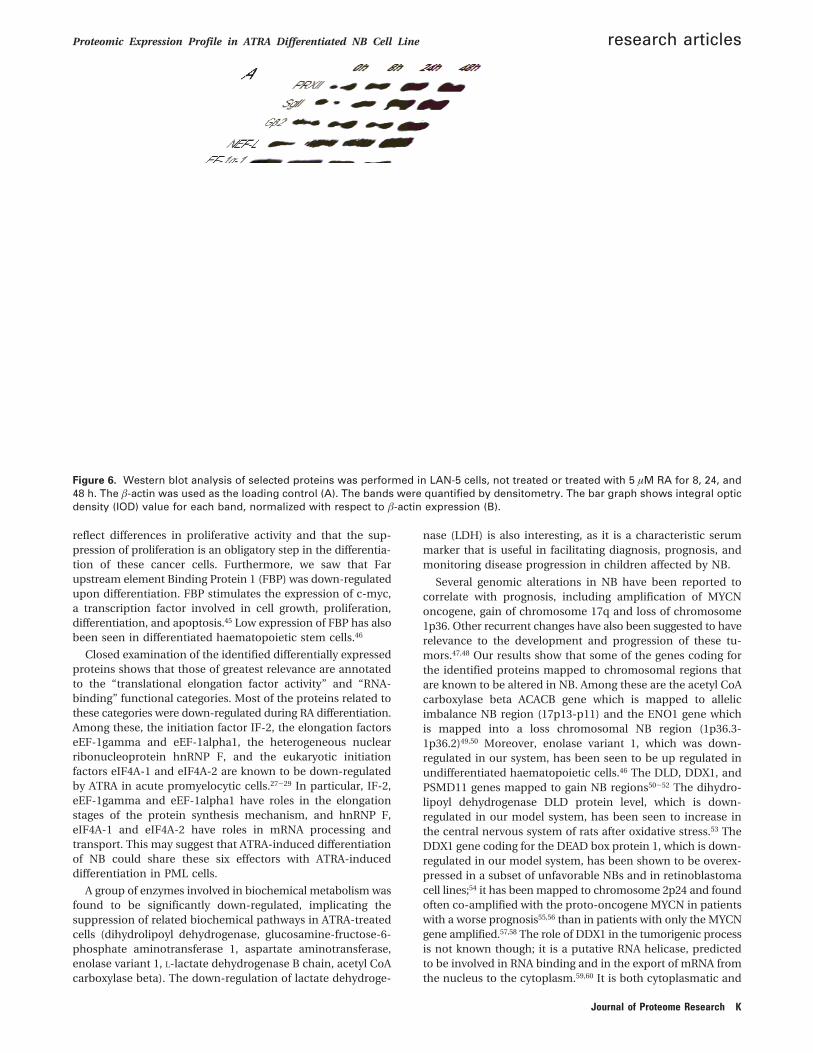
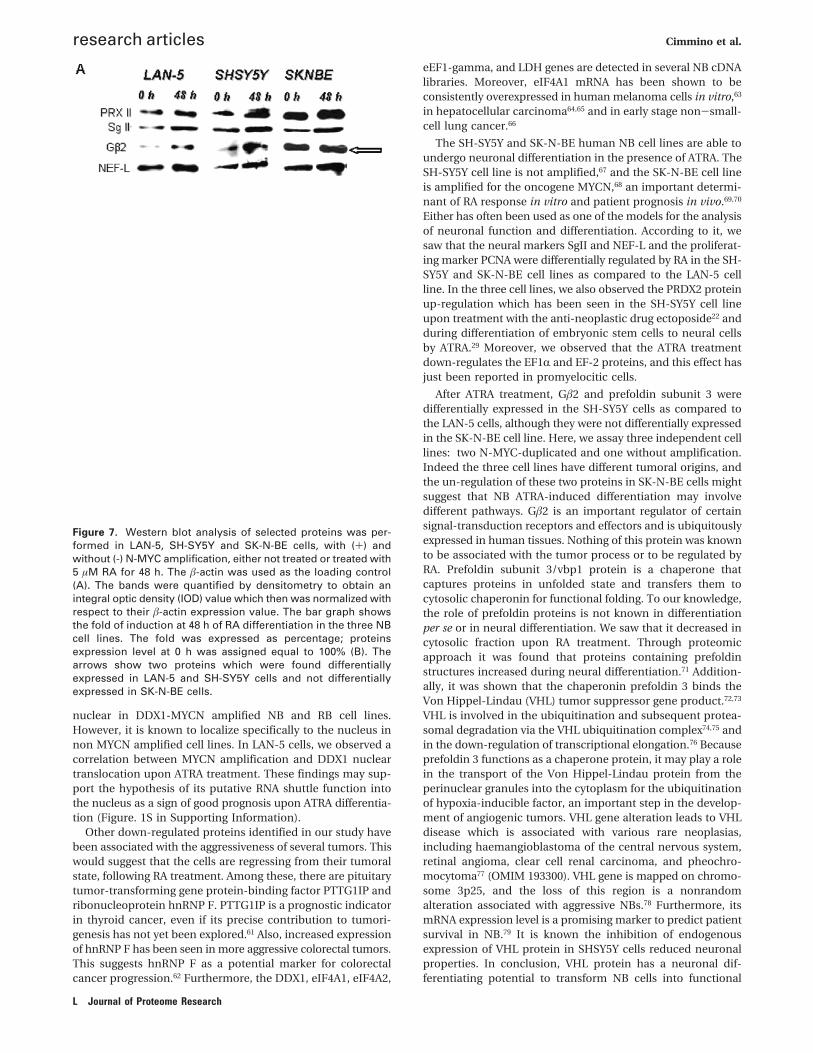
ranin II), NEF-L (68kDa neurofilament), eEF-1R (eukaryoticelongation factor), PCNA (proliferating cell nuclear antigen),EF-2 (elongation factor-2), prefoldin subunit 3 and Gâ2 (guanine-nucleotide-binding protein beta subunit 2) (Figure 6A). Semi-quantitative analysis of the protein expression was performedat the four time points of the differentiation: 0, 8, 24, and 48h. The bands were quantified by densitometry to obtain anintegral optic density (IOD) value which then was normalizedwith respect to â-actin value (Figure 6B). All of these proteinsshowed differential expression patterns in the LAN-5 cell line,according to the DIGE results. We also analyzed the expressionpatterns of these selected proteins in two other NB cell lines,SH-SY5Y and SK-N-BE, not treated and treated with RA for 48h (Figure 7A). Here, the proteins TSA, SgII, NF-L, EF1R, PCNA,and EF-2 showed the same trends seen in the LAN-5 cells, whilethe prefoldin 3 and Gâ2 proteins were differentially expressedin the SH-SY5Y cells, and not in the SK-N-BE cells. Semiquan-titative analysis of the protein expression at the two extremetime points of differentiation: 0 and 48 h, in LAN-5, SH-SY-5Y, and SK-N-BE cells was shown in Figure 7B.
Discussion
NB shows the highest rate of spontaneous regression of anyhuman tumor, mainly due to differentiation and maturationof these highly malignant cells in neurons. It is of interest tostudy the molecular pathways driving spontaneous regressionin NB to unravel the molecular basis of NB development andto determine the differentiation therapies that can be used totreat patients.
ATRA, the most commonly used anti-neoplastic agent in NBtherapy, can induce neural differentiation in NB cell lines invitro.4 Systematic approaches at the transcriptional and trans-lational levels have been used to identify the target genes forNB progression. Moreover, studies of differentiation inducedby ATRA have been performed in PML cells and in mouse stemcells using a proteomic approach.
The main aim of our study was to gather insight into themolecular mechanisms of NB differentiation using 2-D DIGEtechnology. We used the human LAN-5 NB cell line amplifiedfor the oncogene N-MYC and responsive to ATRA treatment,37,38
and monitored the cytosolic and nuclear protein expressionin those cells at the early phase of ATRA differentiation. Weused 5 µM ATRA, according to the known pharmacologicaldoses used in phase I trials of RA administrated to NBpatients.39
We detected a total of 58 spots in the cytosolic fraction and68 in the nuclear fraction that showed differences in theirrelative expression between the control and RA-treated LAN-5cells; 33 of these proteins were identified (17 in the cytosolicfraction and 16 in the nuclear fraction). In agreement with theneuronal-orientated differentiation induced by ATRA, we ob-served at early phase of differentiation a substantial up-regulation of the NEF-L and SgII proteins, which are known tobe neuronal markers,40-42 and the down-regulation of theproliferating cell nuclear antigen PCNA, an auxiliary proteinof DNA polymerase. The highest levels of PCNA were seen inadvanced NB stage tumors with an amplified N-myc gene.43,44
Our results suggest that the decreased levels of PCNA may
Table 5. Mapped Chromosomal Regions of Genes Coding for the Identified Proteins
protein name
gene
name
mapped
chromosomal
regionsa
Glucosamine-fructose-6-phosphate aminotransferase 1 GFPT1 2p13Aspartate aminotransferase, cytoplasmic GOT1 10q24.1-25.1Tumor susceptibility gene 101 TSG101 11p15Enolase 1 Variant ENO1 1p36.3-p36.2*dUTP pyrophosphatase DUT 15q15-21.1DEAD box protein 1, DDX1 protein DDX1 2p24*Heterogeneous nuclear ribonucleoprotein M HNRPM 19p13.3-p13.2Prefoldin subunit 3 VBP1 Xq28Proliferation-associated protein 2G4 PA2G4 12q13Peroxiredoxin-2 PRDX2 19p13.2L-lactate dehydrogenase B chain LDHB 12p12.2-p12.1Human Elongation Factor 2 EEF2 19pter-q12Elongation Factor 1-gamma EEF1G 11q12.3Elongation Factor 1, alpha 1 EEF1A1 6q14.1acetyl-CoA carboxylase beta ACACB 12q24.11*26S proteasome non-ATPase regulatory subunit 11 PSMD11 17q11.2*Pituitary tumor-transforming gene protein-binding factor PTTG1IP 21q22.3Heterogeneous nuclear ribonucleoprotein F HNRPF 10q11.21-11.22Eukaryotic initiation factor 4A-I EIF4A1 17p13Eukaryotic initiation factor 4A-II EIF4A2 3q28Heterogeneous nuclear ribonucleoprotein Q SYNCRIP 6q14-1568 kDa neurofilament protein NEFL 8p21FUSE-binding protein 1 FUBP1 1p31.1Proliferating cell nuclear antigen PCNA 20pter-p12lamin A/C LMNA 1q21.2-21.3Dihydrolipoyl dehydrogenase, mitochondrial DLD 7q31-32*Histone-binding protein RBBP4 RBBP4 1p35.1SecretograninII, Chromogranin C SCG2 2q35-36Guanine nucleotide-binding protein beta subunit 2 GNB2 7q21.3-22.1Stomatin (EPB72)- like 2 STOML2 9p13,1Disulfide isomerase ER-60 PDIA3 15q15Very long chain acyl CoA dehydrogenase ACADVL 17p13-p11brain and muscle Ah receptor nuclear translocator-like protein § §
a Asterisk (*) denotes genes coding for the identified proteins that are mapped to regions known to be altered in NB.
research articles Cimmino et al.
J Journal of Proteome Research
reflect differences in proliferative activity and that the sup-pression of proliferation is an obligatory step in the differentia-tion of these cancer cells. Furthermore, we saw that Farupstream element Binding Protein 1 (FBP) was down-regulatedupon differentiation. FBP stimulates the expression of c-myc,a transcription factor involved in cell growth, proliferation,differentiation, and apoptosis.45 Low expression of FBP has alsobeen seen in differentiated haematopoietic stem cells.46
Closed examination of the identified differentially expressedproteins shows that those of greatest relevance are annotatedto the “translational elongation factor activity” and “RNA-binding” functional categories. Most of the proteins related tothese categories were down-regulated during RA differentiation.Among these, the initiation factor IF-2, the elongation factorseEF-1gamma and eEF-1alpha1, the heterogeneous nuclearribonucleoprotein hnRNP F, and the eukaryotic initiationfactors eIF4A-1 and eIF4A-2 are known to be down-regulatedby ATRA in acute promyelocytic cells.27-29 In particular, IF-2,eEF-1gamma and eEF-1alpha1 have roles in the elongationstages of the protein synthesis mechanism, and hnRNP F,eIF4A-1 and eIF4A-2 have roles in mRNA processing andtransport. This may suggest that ATRA-induced differentiationof NB could share these six effectors with ATRA-induceddifferentiation in PML cells.
A group of enzymes involved in biochemical metabolism wasfound to be significantly down-regulated, implicating thesuppression of related biochemical pathways in ATRA-treatedcells (dihydrolipoyl dehydrogenase, glucosamine-fructose-6-phosphate aminotransferase 1, aspartate aminotransferase,enolase variant 1, L-lactate dehydrogenase B chain, acetyl CoAcarboxylase beta). The down-regulation of lactate dehydroge-
nase (LDH) is also interesting, as it is a characteristic serummarker that is useful in facilitating diagnosis, prognosis, andmonitoring disease progression in children affected by NB.
Several genomic alterations in NB have been reported tocorrelate with prognosis, including amplification of MYCNoncogene, gain of chromosome 17q and loss of chromosome1p36. Other recurrent changes have also been suggested to haverelevance to the development and progression of these tu-mors.47,48 Our results show that some of the genes coding forthe identified proteins mapped to chromosomal regions thatare known to be altered in NB. Among these are the acetyl CoAcarboxylase beta ACACB gene which is mapped to allelicimbalance NB region (17p13-p11) and the ENO1 gene whichis mapped into a loss chromosomal NB region (1p36.3-1p36.2)49,50 Moreover, enolase variant 1, which was down-regulated in our system, has been seen to be up regulated inundifferentiated haematopoietic cells.46 The DLD, DDX1, andPSMD11 genes mapped to gain NB regions50-52 The dihydro-lipoyl dehydrogenase DLD protein level, which is down-regulated in our model system, has been seen to increase inthe central nervous system of rats after oxidative stress.53 TheDDX1 gene coding for the DEAD box protein 1, which is down-regulated in our model system, has been shown to be overex-pressed in a subset of unfavorable NBs and in retinoblastomacell lines;54 it has been mapped to chromosome 2p24 and foundoften co-amplified with the proto-oncogene MYCN in patientswith a worse prognosis55,56 than in patients with only the MYCNgene amplified.57,58 The role of DDX1 in the tumorigenic processis not known though; it is a putative RNA helicase, predictedto be involved in RNA binding and in the export of mRNA fromthe nucleus to the cytoplasm.59,60 It is both cytoplasmatic and
Figure 6. Western blot analysis of selected proteins was performed in LAN-5 cells, not treated or treated with 5 µM RA for 8, 24, and48 h. The â-actin was used as the loading control (A). The bands were quantified by densitometry. The bar graph shows integral opticdensity (IOD) value for each band, normalized with respect to â-actin expression (B).
Proteomic Expression Profile in ATRA Differentiated NB Cell Line research articles
Journal of Proteome Research K
nuclear in DDX1-MYCN amplified NB and RB cell lines.However, it is known to localize specifically to the nucleus innon MYCN amplified cell lines. In LAN-5 cells, we observed acorrelation between MYCN amplification and DDX1 nucleartranslocation upon ATRA treatment. These findings may sup-port the hypothesis of its putative RNA shuttle function intothe nucleus as a sign of good prognosis upon ATRA differentia-tion (Figure. 1S in Supporting Information).
Other down-regulated proteins identified in our study havebeen associated with the aggressiveness of several tumors. Thiswould suggest that the cells are regressing from their tumoralstate, following RA treatment. Among these, there are pituitarytumor-transforming gene protein-binding factor PTTG1IP andribonucleoprotein hnRNP F. PTTG1IP is a prognostic indicatorin thyroid cancer, even if its precise contribution to tumori-genesis has not yet been explored.61 Also, increased expressionof hnRNP F has been seen in more aggressive colorectal tumors.This suggests hnRNP F as a potential marker for colorectalcancer progression.62 Furthermore, the DDX1, eIF4A1, eIF4A2,
eEF1-gamma, and LDH genes are detected in several NB cDNAlibraries. Moreover, eIF4A1 mRNA has been shown to beconsistently overexpressed in human melanoma cells in vitro,63
in hepatocellular carcinoma64,65 and in early stage non-small-cell lung cancer.66
The SH-SY5Y and SK-N-BE human NB cell lines are able toundergo neuronal differentiation in the presence of ATRA. TheSH-SY5Y cell line is not amplified,67 and the SK-N-BE cell lineis amplified for the oncogene MYCN,68 an important determi-nant of RA response in vitro and patient prognosis in vivo.69,70
Either has often been used as one of the models for the analysisof neuronal function and differentiation. According to it, wesaw that the neural markers SgII and NEF-L and the proliferat-ing marker PCNA were differentially regulated by RA in the SH-SY5Y and SK-N-BE cell lines as compared to the LAN-5 cellline. In the three cell lines, we also observed the PRDX2 proteinup-regulation which has been seen in the SH-SY5Y cell lineupon treatment with the anti-neoplastic drug ectoposide22 andduring differentiation of embryonic stem cells to neural cellsby ATRA.29 Moreover, we observed that the ATRA treatmentdown-regulates the EF1R and EF-2 proteins, and this effect hasjust been reported in promyelocitic cells.
After ATRA treatment, Gâ2 and prefoldin subunit 3 weredifferentially expressed in the SH-SY5Y cells as compared tothe LAN-5 cells, although they were not differentially expressedin the SK-N-BE cell line. Here, we assay three independent celllines: two N-MYC-duplicated and one without amplification.Indeed the three cell lines have different tumoral origins, andthe un-regulation of these two proteins in SK-N-BE cells mightsuggest that NB ATRA-induced differentiation may involvedifferent pathways. Gâ2 is an important regulator of certainsignal-transduction receptors and effectors and is ubiquitouslyexpressed in human tissues. Nothing of this protein was knownto be associated with the tumor process or to be regulated byRA. Prefoldin subunit 3/vbp1 protein is a chaperone thatcaptures proteins in unfolded state and transfers them tocytosolic chaperonin for functional folding. To our knowledge,the role of prefoldin proteins is not known in differentiationper se or in neural differentiation. We saw that it decreased incytosolic fraction upon RA treatment. Through proteomicapproach it was found that proteins containing prefoldinstructures increased during neural differentiation.71 Addition-ally, it was shown that the chaperonin prefoldin 3 binds theVon Hippel-Lindau (VHL) tumor suppressor gene product.72,73
VHL is involved in the ubiquitination and subsequent protea-somal degradation via the VHL ubiquitination complex74,75 andin the down-regulation of transcriptional elongation.76 Becauseprefoldin 3 functions as a chaperone protein, it may play a rolein the transport of the Von Hippel-Lindau protein from theperinuclear granules into the cytoplasm for the ubiquitinationof hypoxia-inducible factor, an important step in the develop-ment of angiogenic tumors. VHL gene alteration leads to VHLdisease which is associated with various rare neoplasias,including haemangioblastoma of the central nervous system,retinal angioma, clear cell renal carcinoma, and pheochro-mocytoma77 (OMIM 193300). VHL gene is mapped on chromo-some 3p25, and the loss of this region is a nonrandomalteration associated with aggressive NBs.78 Furthermore, itsmRNA expression level is a promising marker to predict patientsurvival in NB.79 It is known the inhibition of endogenousexpression of VHL protein in SHSY5Y cells reduced neuronalproperties. In conclusion, VHL protein has a neuronal dif-ferentiating potential to transform NB cells into functional
Figure 7. Western blot analysis of selected proteins was per-formed in LAN-5, SH-SY5Y and SK-N-BE cells, with (+) andwithout (-) N-MYC amplification, either not treated or treated with5 µM RA for 48 h. The â-actin was used as the loading control(A). The bands were quantified by densitometry to obtain anintegral optic density (IOD) value which then was normalized withrespect to their â-actin expression value. The bar graph showsthe fold of induction at 48 h of RA differentiation in the three NBcell lines. The fold was expressed as percentage; proteinsexpression level at 0 h was assigned equal to 100% (B). Thearrows show two proteins which were found differentiallyexpressed in LAN-5 and SH-SY5Y cells and not differentiallyexpressed in SK-N-BE cells.
research articles Cimmino et al.
L Journal of Proteome Research
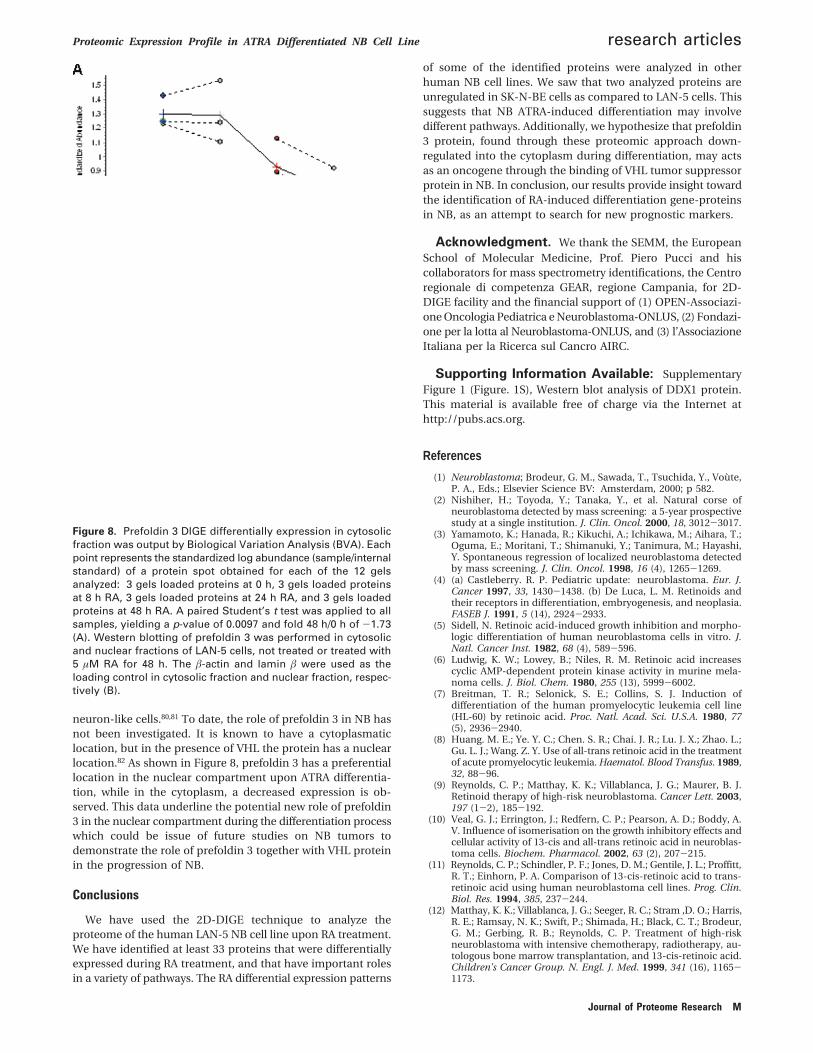
neuron-like cells.80,81 To date, the role of prefoldin 3 in NB hasnot been investigated. It is known to have a cytoplasmaticlocation, but in the presence of VHL the protein has a nuclearlocation.82 As shown in Figure 8, prefoldin 3 has a preferentiallocation in the nuclear compartment upon ATRA differentia-tion, while in the cytoplasm, a decreased expression is ob-served. This data underline the potential new role of prefoldin3 in the nuclear compartment during the differentiation processwhich could be issue of future studies on NB tumors todemonstrate the role of prefoldin 3 together with VHL proteinin the progression of NB.
Conclusions
We have used the 2D-DIGE technique to analyze theproteome of the human LAN-5 NB cell line upon RA treatment.We have identified at least 33 proteins that were differentiallyexpressed during RA treatment, and that have important rolesin a variety of pathways. The RA differential expression patterns
of some of the identified proteins were analyzed in otherhuman NB cell lines. We saw that two analyzed proteins areunregulated in SK-N-BE cells as compared to LAN-5 cells. Thissuggests that NB ATRA-induced differentiation may involvedifferent pathways. Additionally, we hypothesize that prefoldin3 protein, found through these proteomic approach down-regulated into the cytoplasm during differentiation, may actsas an oncogene through the binding of VHL tumor suppressorprotein in NB. In conclusion, our results provide insight towardthe identification of RA-induced differentiation gene-proteinsin NB, as an attempt to search for new prognostic markers.
Acknowledgment. We thank the SEMM, the EuropeanSchool of Molecular Medicine, Prof. Piero Pucci and hiscollaborators for mass spectrometry identifications, the Centroregionale di competenza GEAR, regione Campania, for 2D-DIGE facility and the financial support of (1) OPEN-Associazi-one Oncologia Pediatrica e Neuroblastoma-ONLUS, (2) Fondazi-one per la lotta al Neuroblastoma-ONLUS, and (3) l’AssociazioneItaliana per la Ricerca sul Cancro AIRC.
Supporting Information Available: SupplementaryFigure 1 (Figure. 1S), Western blot analysis of DDX1 protein.This material is available free of charge via the Internet athttp://pubs.acs.org.
References
(1) Neuroblastoma; Brodeur, G. M., Sawada, T., Tsuchida, Y., Voute,P. A., Eds.; Elsevier Science BV: Amsterdam, 2000; p 582.
(2) Nishiher, H.; Toyoda, Y.; Tanaka, Y., et al. Natural corse ofneuroblastoma detected by mass screening: a 5-year prospectivestudy at a single institution. J. Clin. Oncol. 2000, 18, 3012-3017.
(3) Yamamoto, K.; Hanada, R.; Kikuchi, A.; Ichikawa, M.; Aihara, T.;Oguma, E.; Moritani, T.; Shimanuki, Y.; Tanimura, M.; Hayashi,Y. Spontaneous regression of localized neuroblastoma detectedby mass screening. J. Clin. Oncol. 1998, 16 (4), 1265-1269.
(4) (a) Castleberry. R. P. Pediatric update: neuroblastoma. Eur. J.Cancer 1997, 33, 1430-1438. (b) De Luca, L. M. Retinoids andtheir receptors in differentiation, embryogenesis, and neoplasia.FASEB J. 1991, 5 (14), 2924-2933.
(5) Sidell, N. Retinoic acid-induced growth inhibition and morpho-logic differentiation of human neuroblastoma cells in vitro. J.Natl. Cancer Inst. 1982, 68 (4), 589-596.
(6) Ludwig, K. W.; Lowey, B.; Niles, R. M. Retinoic acid increasescyclic AMP-dependent protein kinase activity in murine mela-noma cells. J. Biol. Chem. 1980, 255 (13), 5999-6002.
(7) Breitman, T. R.; Selonick, S. E.; Collins, S. J. Induction ofdifferentiation of the human promyelocytic leukemia cell line(HL-60) by retinoic acid. Proc. Natl. Acad. Sci. U.S.A. 1980, 77(5), 2936-2940.
(8) Huang. M. E.; Ye. Y. C.; Chen. S. R.; Chai. J. R.; Lu. J. X.; Zhao. L.;Gu. L. J.; Wang. Z. Y. Use of all-trans retinoic acid in the treatmentof acute promyelocytic leukemia. Haematol. Blood Transfus. 1989,32, 88-96.
(9) Reynolds, C. P.; Matthay, K. K.; Villablanca, J. G.; Maurer, B. J.Retinoid therapy of high-risk neuroblastoma. Cancer Lett. 2003,197 (1-2), 185-192.
(10) Veal, G. J.; Errington, J.; Redfern, C. P.; Pearson, A. D.; Boddy, A.V. Influence of isomerisation on the growth inhibitory effects andcellular activity of 13-cis and all-trans retinoic acid in neuroblas-toma cells. Biochem. Pharmacol. 2002, 63 (2), 207-215.
(11) Reynolds, C. P.; Schindler, P. F.; Jones, D. M.; Gentile, J. L.; Proffitt,R. T.; Einhorn, P. A. Comparison of 13-cis-retinoic acid to trans-retinoic acid using human neuroblastoma cell lines. Prog. Clin.Biol. Res. 1994, 385, 237-244.
(12) Matthay, K. K.; Villablanca, J. G.; Seeger, R. C.; Stram ,D. O.; Harris,R. E.; Ramsay, N. K.; Swift, P.; Shimada, H.; Black, C. T.; Brodeur,G. M.; Gerbing, R. B.; Reynolds, C. P. Treatment of high-riskneuroblastoma with intensive chemotherapy, radiotherapy, au-tologous bone marrow transplantation, and 13-cis-retinoic acid.Children’s Cancer Group. N. Engl. J. Med. 1999, 341 (16), 1165-1173.
Figure 8. Prefoldin 3 DIGE differentially expression in cytosolicfraction was output by Biological Variation Analysis (BVA). Eachpoint represents the standardized log abundance (sample/internalstandard) of a protein spot obtained for each of the 12 gelsanalyzed: 3 gels loaded proteins at 0 h, 3 gels loaded proteinsat 8 h RA, 3 gels loaded proteins at 24 h RA, and 3 gels loadedproteins at 48 h RA. A paired Student’s t test was applied to allsamples, yielding a p-value of 0.0097 and fold 48 h/0 h of -1.73(A). Western blotting of prefoldin 3 was performed in cytosolicand nuclear fractions of LAN-5 cells, not treated or treated with5 µM RA for 48 h. The â-actin and lamin â were used as theloading control in cytosolic fraction and nuclear fraction, respec-tively (B).
Proteomic Expression Profile in ATRA Differentiated NB Cell Line research articles
Journal of Proteome Research M
(13) Yuza, Y.; Agawa, M.; Matsuzaki, M.; Yamada, H.; Urashima, M.Gene and protein expression profiling during differentiation ofneuroblastoma cells triggered by 13-cis retinoic acid. J. Pediatr.Hematol. Oncol. 2003, 25 (9), 715-720.
(14) Sucov, H. M.; Evans, R. M. Retinoic acid and retinoic acidreceptors in development. Mol. Neurobiol. 1995, 10 (2-3), 169-184.
(15) Reynolds, C. P.; Kane, D. J.; Einhorn, P. A.; Matthay, K. K.; Crouse,V. L.; Wilbur, J. R.; Shurin, S. B.; Seeger, R. C. Response ofneuroblastoma to retinoic acid in vitro and in vivo. Prog. Clin.Biol. Res. 1991, 366, 203-211.
(16) Ohira, M.; Morohashi, A.; Inuzuka, H.; Shishikura, T.; Kawamoto,T.; Kageyama, H.; Nakamura, Y.; Isogai, E.; Takayasu, H.; Sak-iyama, S.; Suzuki, Y.; Sugano, S.; Goto, T.; Sato, S.; Nakagawara,A. Expression profiling and characterization of 4200 genes clonedfrom primary neuroblastomas: identification of 305 genes dif-ferentially expressed between favorable and unfavorable subsets.Oncogene 2003, 22 (35), 5525-5536.
(17) Hiyama, E.; Hiyama, K.; Yamaoka, H.; Sueda, T.; Reynolds, C. P.;Yokoyama, T. Expression profiling of favorable and unfavorableneuroblastomas. Pediatr. Surg. Int. 2004, 20 (1), 33-38.
(18) Ohira, M.; Oba, S.; Nakamura, Y.; Isogai, E.; Kaneko, S.; Nakagawa,A.; Hirata, T.; Kubo, H.; Goto, T.; Yamada, S.; Yoshida, Y.;Fuchioka, M.; Ishii, S.; Nakagawara, A. Expression profiling usinga tumor-specific cDNA microarray predicts the prognosis ofintermediate risk neuroblastomas. Cancer Cell 2005, 7 (4), 337-350.
(19) Riley, R. D.; Heney, D.; Jones, D. R.; Sutton, A. J.; Lambert, P. C.;Abrams, K. R.; Young, B.; Wailoo, A. J.; Burchill, S. A. A systematicreview of molecular and biological tumor markers in neuroblas-toma. Clin. Cancer Res. 2004, 10 (1 Pt 1), 4-12.
(20) Wei, J. S.; Greer, B. T.; Westermann, F.; Steinberg, S. M.; Son, C.G.; Chen, Q. R.; Whiteford, C. C.; Bilke, S.; Krasnoselsky, A. L.;Cenacchi, N.; Catchpoole, D.; Berthold, F.; Schwab, M.; Khan, J.Prediction of clinical outcome using gene expression profilingand artificial neural networks for patients with neuroblastoma.Cancer Res. 2004, 64 (19), 6883-6891.
(21) Takita, J.; Ishii, M.; Tsutsumi, S.; Tanaka, Y.; Kato, K.; Toyoda, Y.;Hanada, R.; Yamamoto, K.; Hayashi, Y.; Aburatani, H. Geneexpression profiling and identification of novel prognostic markergenes in neuroblastoma. Genes, Chromosomes Cancer 2004, 40(2), 120-132.
(22) Urbani, A.; Poland, J.; Bernardini, S.; Bellincampi, L.; Biroccio,A.; Schnolzer, M.; Sinha, P.; Federici, G. A proteomic investigationinto etoposide chemo-resistance of neuroblastoma cell lines.Proteomics 2005, 5, (3), 796-804.
(23) Escobar, M. A.; Hoelz, D. J.; Sandoval, J. A.; Hickey, R. J.; Grosfeld,J. L.; Malkas, L. H. Profiling of nuclear extract proteins fromhuman neuroblastoma cell lines: the search for fingerprints. J.Pediatr. Surg. 2005, 40 (2), 349-358.
(24) Afjehi-Sadat, L.; Shin, J. H.; Felizardo, M.; Lee, K.; Slavc, I.; Lubec,G. Detection of hypothetical proteins in 10 individual humantumor cell lines. Biochim. Biophys. Acta 2005, 1747 (1), 67-80.
(25) Marengo, E.; Robotti, E.; Righetti, P. G.; Campostrini, N.; Pascali,J.; Ponzoni, M.; Hamdan, M.; Astner, H. Study of proteomicchanges associated with healthy and tumoral murine samplesin neuroblastoma by principal component analysis and clas-sification methods. Clin. Chim. Acta 2004, 345, (1-2), 55-67.
(26) Campostrini, N.; Pascali, J.; Hamdan, M.; Astner, H.; Marimpietri,D.; Pastorino, F.; Ponzoni, M.; Righetti, P. G. Proteomic analysisof an orthotopic neuroblastoma xenograft animal model. J.Chromatogr., B: Anal. Technol. Biomed. Life Sci. 2004, 808 (2),279-286.
(27) Harris, M. N.; Ozpolat, B.; Abdi, F.; Gu, S.; Legler, A.; Mawuenyega,K. G.; Tirado-Gomez, M.; Lopez-Berestein, G.; Chen, X. Compara-tive proteomic analysis of all-trans-retinoic acid treatment revealssystematic posttranscriptional control mechanisms in acutepromyelocytic leukemia. Blood 2004, 104 (5), 1314-1323.
(28) Zheng, P. Z.; Wang, K. K.; Zhang, Q. Y.; Huang, Q. H.; Du, Y. Z.;Zhang, Q. H.; Xiao, D. K.; Shen, S. H.; Imbeaud, S.; Eveno, E.;Zhao, C. J.; Chen, Y. L.; Fan, H. Y. Waxman, S.; Auffray, C.; Jin,G.; Chen, S. J.; Chen, Z.; Zhang, J. Systems analysis of transcrip-tome and proteome in retinoic acid/arsenic trioxide-induced celldifferentiation/apoptosis of promyelocytic leukemia. Proc. Natl.Acad. Sci. U.S.A. 2005, 102 (21), 7653-7658.
(29) Guo, X.; Ying, W.; Wan, J.; Hu, Z.; Qian, X.; Zhang, H.; He, F.Proteomic characterization of early-stage differentiation of mouseembryonic stem cells into neural cells induced by all-transretinoic acid in vitro. Electrophoresis 2001, (14), 3067-3075.
(30) Tonge, R.; Shaw, J.; Middleton, B.; Rowlinson, R.; Rayner, S.;Young, J.; Pognan, F.; Hawkins, E.; Currie, I.; Davison, M.Validation and development of fluorescence two-dimensionaldifferential gel electrophoresis proteomics technology. Proteomics2001, 1 (3), 377-396.
(31) Friedman, D. B.; Hill, S.; Keller, J. W.; Merchant, N. B.; Levy, S.E.; Coffey, R. J.; Caprioli, R. M. Proteome analysis of human coloncancer by two-dimensional difference gel electrophoresis andmass spectrometry. Proteomics 2004, 4 (3), 793-811.
(32) Zhou, G.; Li, H.; DeCamp, D.; Chen, S.; Shu, H.; Gong, Y.; Flaig,M.; Gillespie, J. W.; Hu, N.; Taylor, P. R.; Emmert-Buck, M. R.;Liotta, L. A.; Petricoin, E. F., 3rd; Zhao, Y. 2D differential in-gelelectrophoresis for the identification of esophageal scans cellcancer-specific protein markers. Mol. Cell. Proteomics 2002, 1 (2),117-124.
(33) Somiari, R. I.; Sullivan, A.; Russell, S.; Somiari, S.; Hu, H.; Jordan,R.; George, A.; Katenhusen, R.; Buchowiecka, A.; Arciero, C.;Brzeski, H.; Hooke, J.; Shriver, C. High-throughput proteomicanalysis of human infiltrating ductal carcinoma of the breast.Proteomics 2003, 3 (10), 1863-1873.
(34) Hoorn, E. J.; Hoffert, J. D.; Knepper, M. A. The application ofDIGE-based proteomics to renal physiology. Nephron Physiol.2006, 104 (1), 61-72.
(35) Herrero, J.; Al-Shahrour, F.; Dıaz-Uriarte, R.; Mateos, AÄ .; Vaque-rizas, J. M.; Santoyo, J.; Dopazo, J. GEPAS, a web-based resourcefor microarray gene expression data analysis. Nucleic Acids Res.2003, 31 (13), 3461-3467.
(36) Herrero, J.; Vaquerizas, J. M.; Al-Shahrour, F.; Conde, L.; Mateos,AÄ .; Santoyo, J.; Dıaz-Uriarte, R.; Dopazo, J. New challenges in geneexpression data analysis and the extended GEPAS. Nucleic AcidsRes. 2004, 32 (W485-W491).
(37) Cesi, V.; Tanno, B.; Vitali, R.; Mancini, C.; Giuffrida, M. L.;Calabretta, B.; Raschella, G. Cyclin D1-dependent regulation ofB-myb activity in early stages of neuroblastoma differentiation.Cell Death Differ. 2002, 9 (11), 1232-1239.
(38) Hettmer, S.; McCarter, R.; Ladisch, S.; Kaucic, K. Alterations inneuroblastoma ganglioside synthesis by induction of GD1bsynthase by retinoic acid. Br. J. Cancer 2004, 91 (2), 389-397.
(39) Villablanca, J. G.; Khan, A. A.; Avramis, V. I.; Seeger, R. C.; Matthay,K. K.; Ramsay, N. K.; Reynolds, C. P. Phase I trial of 13-cis-retinoicacid in children with neuroblastoma following bone marrowtransplantation. J. Clin. Oncol. 1995, 13 (4), 894-901.
(40) Pagani, A.; Forni, M.; Tonini, G. P.; Papotti, M.; Bussolati, G.Expression of members of the chromogranin family in primaryneuroblastomas. Diagn. Mol. Pathol. 1992, 1 (1), 16-24.
(41) Giudici, A. M.; Sher, E.; Pelagi, M.; Clementi, F.; Zanini, A.Immunolocalization of secretogranin II, chromogranin A, andchromogranin B in differentiating human neuroblastoma cells.Eur. J. Cell Biol. 1992, 58 (2), 383-389.
(42) Jang, Y. K.; Park, J. J.; Lee, M. C.; Yoon, B. H.; Yang, Y. S.; Yang,S. E.; Kim, S. U. Retinoic acid-mediated induction of neurons andglial cells from human umbilical cord-derived hematopoieticstem cells. J. Neurosci. Res. 2004, 75 (4), 573-584.
(43) Keim, D. R.; Hailat, N.; Kuick, R.; Reynolds, C. P.; Brodeur, G.M.; Seeger, R. C.; Hanash, S. M. PCNA levels in neuroblastomaare increased in tumors with an amplified N-myc gene and inmetastatic stage tumors. Clin. Exp. Metastasis 1993, 11 (1), 83-90.
(44) Mejia, C.; Navarro, S.; Pellin, A.; Ruiz, A.; Castel, V.; Llombart-Bosch, A. Prognostic significance of cell proliferation in humanneuroblastoma: comparison with other prognostic factors. Oncol.Rep. 2003, 10 (1), 243-247.
(45) Duncan, R.; Bazar, L.; Michelotti, G.; Tomonaga, T.; Krutzsch, H.;Avigan, M.; Levens, D. A sequence-specific, single-strand bindingprotein activates the far upstream element of c-myc and definesa new DNA-binding motif. Genes Dev. 1994, 8 (4), 465-480.
(46) Tao, W.; Wang, M.; Voss, E. D.; Cocklin, R. R.; Smith, J. A.; Cooper,S. H.; Broxmeyer, H. E. Comparative proteomic analysis of humanCD34+ stem/progenitor cells and mature CD15+ myeloid cells.Stem Cells 2004, 22 (6), 1003-1014.
(47) Bown, N. Neuroblastoma tumour genetics: clinical and biologicalaspects. J. Clin. Pathol. 2001, 54 (12), 897-910.
(48) Maris, J. M.; Matthay, K. K. Molecular biology of neuroblastoma.J. Clin. Oncol. 1999, 17 (7), 2264-2279.
(49) Mora, J.; Cheung, N. K.; Oplanich, S.; Chen, L.; Gerald, W. L. Novelregions of allelic imbalance identified by genome-wide analysisof neuroblastoma. Cancer Res. 2002, 62 (6), 1761-1767.
research articles Cimmino et al.
N Journal of Proteome Research
(50) Mosse, Y. P.; Greshock, J.; Margolin, A.; Naylor, T.; Cole, K.; Khazi,D.; Hii, G.; Winter, C.; Shahzad, S.; Asziz, M. U.; Biegel, J. A.;Weber, B. L.; Maris, J. M. High-resolution detection and mappingof genomic DNA alterations in neuroblastoma. Genes, Chromo-somes Cancer 2005, 43 (4), 390-403.
(51) Chen, Q. R.; Bilke, S.; Wei, J. S.; Whiteford, C. C.; Cenacchi, N.;Krasnoselsky, A. L.; Greer, B. T.; Son, C. G.; Westermann, F.;Berthold, F.; Schwab, M.; Catchpoole, D.; Khan, J. cDNA array-CGH profiling identifies genomic alterations specific to stage andMYCN-amplification in neuroblastoma. BMC Genomics 2004, 5(1), 7.
(52) Hackett, C. S.; Hodgson, J. G.; Law, M. E.; Fridly, J.; Osoegawa,K.; de Jong, P. J.; Nowak, N. J.; Pinkel, D.; Albertson, D. G.; Jain,A.; Jenkins, R.; Gray, J. W.; Weiss, W. A. Genome-wide array CGHanalysis of murine neuroblastoma reveals distinct genomicaberrations which parallel those in human tumors. Cancer Res.2003, 63 (17), 5266-5273.
(53) Poon, H. F.; Shepherd, H. M.; Reed, T. T.; Calabrese, V.; Stella, A.M.; Pennisi, G.; Cai, J.; Pierce, W. M.; Klein, J. B.; Butterfield, D.A. Proteomics analysis provides insight into caloric restrictionmediated oxidation and expression of brain proteins associatedwith age-related impaired cellular processes: Mitochondrialdysfunction, glutamate dysregulation and impaired protein syn-thesis. Neurobiol. Aging 2006, 27 (7), 1020-1034.
(54) Godbout, R.; Packer, M.; Bie, W. Overexpression of a DEAD boxprotein (DDX1) in neuroblastoma and retinoblastoma cell lines.J. Biol. Chem. 1998, 273 (33), 21161-21168.
(55) Pandita, A.; Godbout, R.; Zielenska, M.; Thorner, P.; Bayani, J.;Squire, J. A. Relational mapping of MYCN and DDXI in band 2p24and analysis of amplicon arrays in double minute chromosomesand homogeneously staining regions by use of free chromatinFISH. Genes, Chromosomes Cancer 1997, 20 (3), 243-252.
(56) Manohar, C. F.; Salwen, H. R.; Brodeur, G. M.; Cohn, S. L. Co-amplification and concomitant high levels of expression of aDEAD box gene with MYCN in human neuroblastoma. Genes,Chromosomes Cancer 1995, 14 (3), 196-203.
(57) Squire, J. A.; Thorner, P. S.; Weitzman, S.; Maggi, J. D.; Dirks, P.;Doyle, J.; Hale, M.; Godbout, R. Co-amplification of MYCN anda DEAD box gene (DDX1) in primary neuroblastoma. Oncogene1995, 10 (7), 1417-1422.
(58) George, R. E.; Kenyon, R. M.; McGuckin, A. G.; Malcolm, A. J.;Pearson, A. D.; Lunec, J. Investigation of co-amplification of thecandidate genes ornithine decarboxylase, ribonucleotide reduc-tase, syndecan-1 and a DEAD box gene, DDX1, with N-myc inneuroblastoma. United Kingdom Children’s Cancer Study Group.Oncogene 1996, 12 (7), 1583-1587.
(59) Scott, D.; Elsden, J.; Pearson, A.; Lunec, J. Genes co-amplifiedwith MYCN in neuroblastoma: silent passengers or co-determi-nants of phenotype? Cancer Lett. 2003, 197 (1-2), 81-86.
(60) Bleoo, S.; Sun, X.; Hendzel, M. J.; Rowe, J. M.; Packer, M.;Godbout, R. Association of human DEAD box protein DDX1 witha cleavage stimulation factor involved in 3′-end processing of pre-MRNA. Mol. Biol. Cell. 2001, 12 (10), 3046-3059.
(61) Stratford, A. L.; Boelaert, K.; Tannahill, L. A.; Kim, D. S.; Warfield,A.; Eggo, M. C. Gittoes, N. J.; Young, L. S.; Franklyn, J. A.; McCabe,C. J. Pituitary tumor transforming gene binding factor: a noveltransforming gene in thyroid tumorigenesis. J. Clin. Endocrinol.Metab. 2005, 90 (7), 4341-4349.
(62) Balasubramani, M.; Day, B. W.; Schoen, R. E.; Getzenberg, R. H.Altered expression and localization of creatine kinase B, hetero-geneous nuclear ribonucleoprotein F, and high mobility groupbox 1 protein in the nuclear matrix associated with colon cancer.Cancer Res. 2006, 66 (2), 763-769.
(63) Eberle, J.; Krasagakis, K.; Orfanos, C. E. Translation initiationfactor eIF-4A1 mRNA is consistently overexpressed in humanmelanoma cells in vitro. Int. J. Cancer 1997, 71 (3), 396-401.
(64) Shuda, M.; Kondoh, N.; Tanaka, K.; Ryo, A.; Wakatsuki, T.; Hada,A.; Goseki, N.; Igari, T.; Hatsuse, K.; Aihara, T.; Horiuchi, S.;Shichita, M.; Yamamoto, N.; Yamamoto, M. Enhanced expressionof translation factor mRNAs in hepatocellular carcinoma. Anti-cancer Res. 2000, 20 (4), 2489-2489.
(65) Yoon, S. Y.; Kim, J. M.; Oh, J. H.; Jeon, Y. J.; Lee, D. S.; Kim, J. H.;Choi, J. Y.; Ahn, B. M.; Kim, S.; Yoo, H. S.; Kim, Y. S.; Kim, N. S.Gene expression profiling of human HBV- and/or HCV-associatedhepatocellular carcinoma cells using expressed sequence tags.Int. J. Oncol. 2006, 29 (2), 315-327.
(66) Ji, P.; Diederichs, S.; Wang, W.; Boing, S.; Metzger, R.; Schneider,P. M.; Tidow, N.; Brandt, B.; Buerger, H.; Bulk, E.; Thomas, M.;Berdel, W. E.; Serve, H.; Muller-Tidow, C. MALAT-1, a novelnoncoding RNA, and thymosin beta4 predict metastasis andsurvival in early-stage non-small cell lung cancer. Oncogene 2003,22 (39), 8031-8041.
(67) Biedler, J. L.; Helson, L.; Spengler, B. A. Morphology and growth,tumorigenicity, and cytogenetics of human neuroblastoma cellsin continuous culture. Cancer Res. 1973, 33 (11), 2643-2652.
(68) Biedler, J. L.; Spengler, B. A. A novel chromosome abnormalityin human neuroblastoma and antifolate-resistant Chinese ham-ster cell lives in culture. J. Natl. Cancer Inst. 1976, 57 (3), 683-695.
(69) Bordow, S. B.; Norris, M. D.; Haber, P. S.; Marshall, G. M.; Haber,M. Prognostic significance of MYCN oncogene expression inchildhood neuroblastoma. J. Clin. Oncol. 1998, 16 (10), 3286-3294
(70) Nguyen, T.; Hocker, J. E.; Thomas, W.; Smith, S. A.; Norris, M.D.; Haber, M.; Cheung, B.; Marshall, G. M. Combined RAR alpha-and RXR-specific ligands overcome N-myc-associated retinoidresistance in neuroblastoma cells. Biochem. Biophys. Res. Com-mun. 2003, 302 (3), 462-468.
(71) Oh, J. E.; Karlmark, K. R.; Shin, J.; Hengstschlager, M.; Lubec, G.Differentiation-dependent expression of hypothetical proteins inthe neuroblastoma cell line N1E-115. Proteins 2006, 63 (3), 671-680.
(72) Woodward, E. R.; Buchberger, A.; Clifford, S. C.; Hurst, L. D.;Affara, N. A.; Maher, E. R. Comparative sequence analysis of theVHL tumor suppressor gene. Genomics 2000, 65 (3) 253-265.
(73) Brinke, A.; Green, P. M.; Giannelli, F. Characterization of the gene(VBP1) and transcript for the von Hippel-Lindau binding proteinand isolation of the highly conserved murine homologue. Ge-nomics 19971, 45 (1), 105-112.
(74) Iwai, K.; Yamanaka, K.; Kamura, T.; Minato, N.; Conaway, R. C.;Conaway, J. W.; Klausner, R. D.; Pause, A. Identification of thevon Hippel-lindau tumor-suppressor protein as part of an activeE3 ubiquitin ligase complex. Proc. Natl. Acad. Sci. U.S.A. 1999,96 (22), 12436-12441.
(75) Lisztwan, J.; Imbert, G.; Wirbelauer, C.; Gstaiger, M.; Krek, W. Thevon Hippel-Lindau tumor suppressor protein is a component ofan E3 ubiquitin-protein ligase activity. Genes Dev. 1999, 13 (14),1822-1833.
(76) Maxwell, P. H.; Wiesener, M. S.; Chang, G. W.; Clifford, S. C.; Vaux,E. C.; Cockman, M. E.; Wykoff, C. C.; Pugh, C. W.; Maher, E. R.;Ratcliffe, P. J. Hypoxia-inducible factors for oxygen-dependentproteolysis. Nature 1999, 399 (6733), 271-275.
(77) Gnarra, J. R.; Duan, D. R.; Weng, Y.; Humphrey, J. S.; Chen, D.Y.; Lee, S.; Pause, A.; Dudley, C. F.; Latif, F.; Kuzmin, I.; Schmidt,L.; Duh, F. M.; Stackhouse, T.; Chen, F.; Kishida, T.; Wei, M. H.;Lerman, M. I.; Zbar, B.; Klausner, R. D.; Linehan, W. M. Molecularcloning of the von Hippel-Lindau tumor suppressor gene andits role in renal carcinoma. Biochim. Biophys. Acta 1996, 1242(3), 201-210.
(78) Spitz, R.; Hero, B.; Ernestus, K.; Berthold, F. FISH analyses foralterations in chromosomes 1, 2, 3, and 11 define high-risk groupsin neuroblastoma. Med. Pediatr. Oncol. 2003, 41 (1), 30-35.
(79) Hoebeeck, J.; Vandesompele, J.; Nilsson, H.; De Preter, K.; VanRoy, N.; De Smet, E.; Yigit, N.; De Paepe, A.; Laureys, G.; Pahlman,S.; Speleman, F. The von Hippel-Lindau tumor suppressor geneexpression level has prognostic value in neuroblastoma. Int. J.Cancer 2006, 119 (3), 624-629.
(80) Murata, H.; Tajima, N.; Nagashima, Y.; Yao, M.; Baba, M.; Goto,M.; Kawamoto, S.; Yamamoto, I.; Okuda, K.; Kanno, H. VonHippel-Lindau tumor suppressor protein transforms humanneuroblastoma cells into functional neuron-like cells. Cancer Res.2002, 62 (23), 7004-7011.
(81) Kanno, H.; Saljooque, F.; Yamamoto, I.; Hattori, S.; Yao, M.; Shuin,T.; U, H. S. Role of the von Hippel-Lindau tumor suppressorprotein during neuronal differentiation. Cancer Res. 2000, 60 (11),2820-2824.
(82) Tsuchiya, H.; Iseda, T.; Hino, O. Identification of a novel protein(VBP-1) binding to the von Hippel-Lindau (VHL) tumor suppres-sor gene product. Cancer Res. 1996, 56 (13), 2881-2885.
PR060701G
Proteomic Expression Profile in ATRA Differentiated NB Cell Line research articles
PAGE EST: 14.9 Journal of Proteome Research O