Embed Size (px)
Citation preview
1
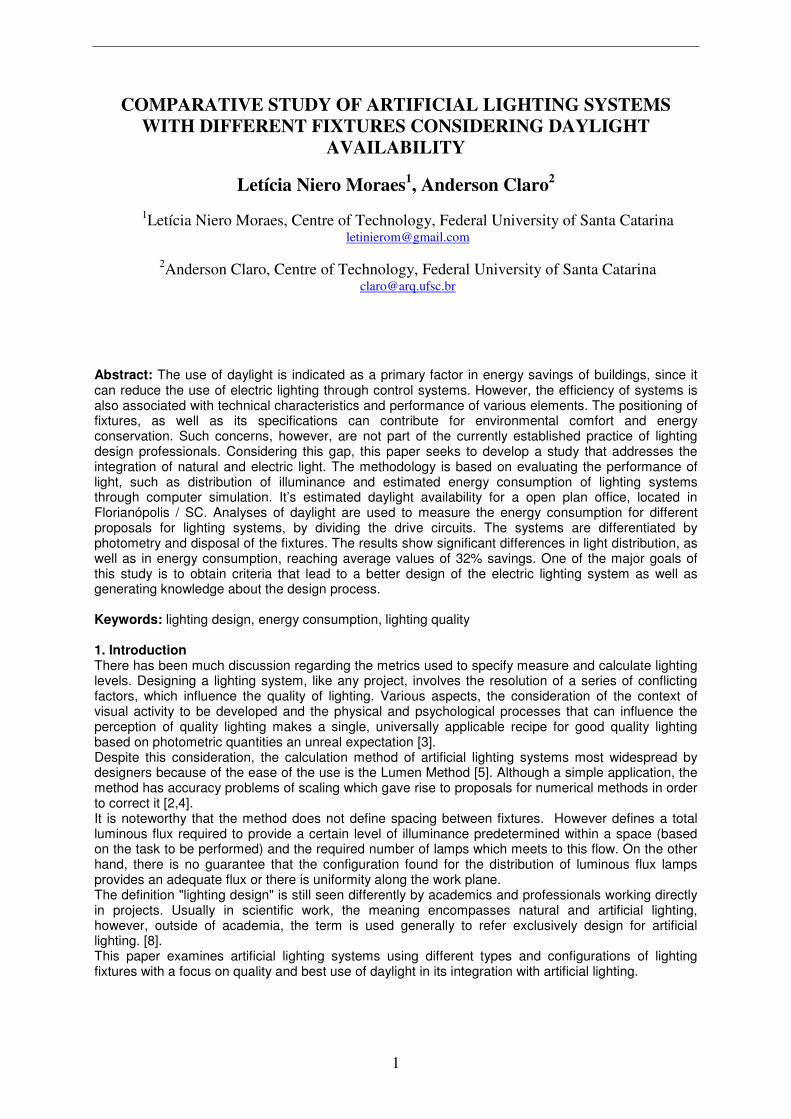
COMPARATIVE STUDY OF ARTIFICIAL LIGHTING SYSTEMS
WITH DIFFERENT FIXTURES CONSIDERING DAYLIGHT
AVAILABILITY
Letícia Niero Moraes1, Anderson Claro
2
1Letícia Niero Moraes, Centre of Technology, Federal University of Santa Catarina
2Anderson Claro, Centre of Technology, Federal University of Santa Catarina
Abstract: The use of daylight is indicated as a primary factor in energy savings of buildings, since it can reduce the use of electric lighting through control systems. However, the efficiency of systems is also associated with technical characteristics and performance of various elements. The positioning of fixtures, as well as its specifications can contribute for environmental comfort and energy conservation. Such concerns, however, are not part of the currently established practice of lighting design professionals. Considering this gap, this paper seeks to develop a study that addresses the integration of natural and electric light. The methodology is based on evaluating the performance of light, such as distribution of illuminance and estimated energy consumption of lighting systems through computer simulation. It’s estimated daylight availability for a open plan office, located in Florianópolis / SC. Analyses of daylight are used to measure the energy consumption for different proposals for lighting systems, by dividing the drive circuits. The systems are differentiated by photometry and disposal of the fixtures. The results show significant differences in light distribution, as well as in energy consumption, reaching average values of 32% savings. One of the major goals of this study is to obtain criteria that lead to a better design of the electric lighting system as well as generating knowledge about the design process. Keywords: lighting design, energy consumption, lighting quality 1. Introduction There has been much discussion regarding the metrics used to specify measure and calculate lighting levels. Designing a lighting system, like any project, involves the resolution of a series of conflicting factors, which influence the quality of lighting. Various aspects, the consideration of the context of visual activity to be developed and the physical and psychological processes that can influence the perception of quality lighting makes a single, universally applicable recipe for good quality lighting based on photometric quantities an unreal expectation [3]. Despite this consideration, the calculation method of artificial lighting systems most widespread by designers because of the ease of the use is the Lumen Method [5]. Although a simple application, the method has accuracy problems of scaling which gave rise to proposals for numerical methods in order to correct it [2,4]. It is noteworthy that the method does not define spacing between fixtures. However defines a total luminous flux required to provide a certain level of illuminance predetermined within a space (based on the task to be performed) and the required number of lamps which meets to this flow. On the other hand, there is no guarantee that the configuration found for the distribution of luminous flux lamps provides an adequate flux or there is uniformity along the work plane. The definition "lighting design" is still seen differently by academics and professionals working directly in projects. Usually in scientific work, the meaning encompasses natural and artificial lighting, however, outside of academia, the term is used generally to refer exclusively design for artificial lighting. [8]. This paper examines artificial lighting systems using different types and configurations of lighting fixtures with a focus on quality and best use of daylight in its integration with artificial lighting.
2
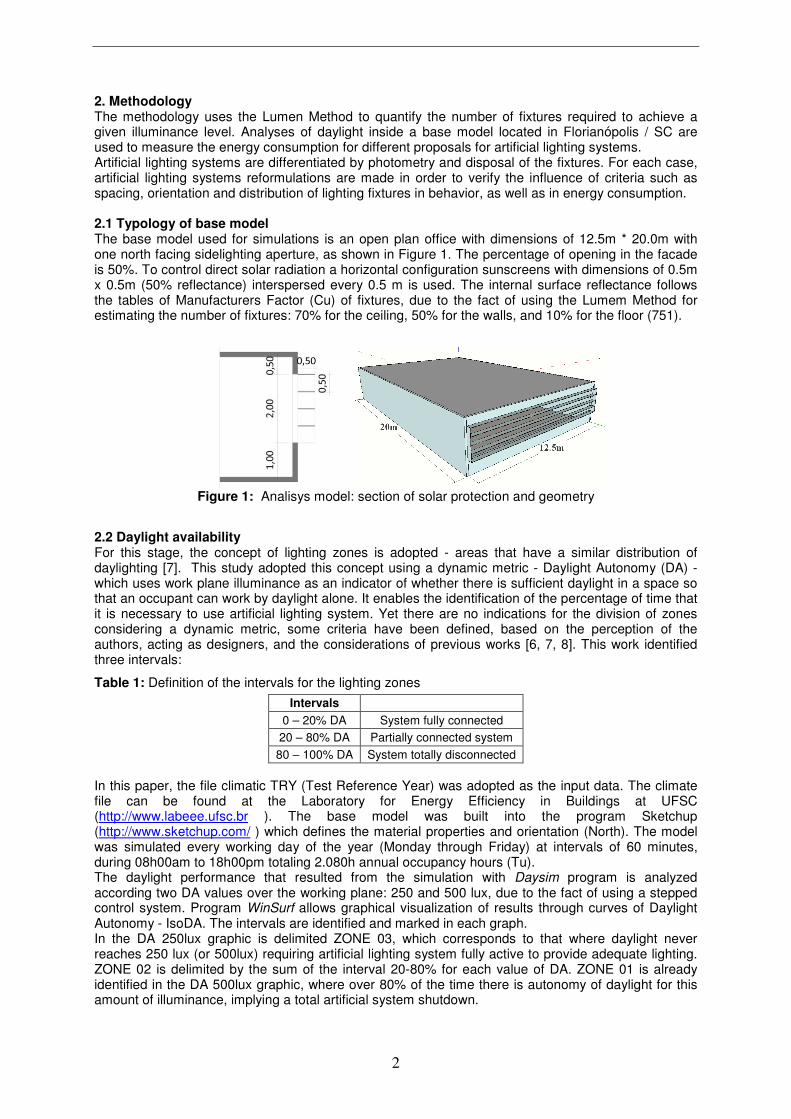
2. Methodology The methodology uses the Lumen Method to quantify the number of fixtures required to achieve a given illuminance level. Analyses of daylight inside a base model located in Florianópolis / SC are used to measure the energy consumption for different proposals for artificial lighting systems. Artificial lighting systems are differentiated by photometry and disposal of the fixtures. For each case, artificial lighting systems reformulations are made in order to verify the influence of criteria such as spacing, orientation and distribution of lighting fixtures in behavior, as well as in energy consumption. 2.1 Typology of base model The base model used for simulations is an open plan office with dimensions of 12.5m * 20.0m with one north facing sidelighting aperture, as shown in Figure 1. The percentage of opening in the facade is 50%. To control direct solar radiation a horizontal configuration sunscreens with dimensions of 0.5m x 0.5m (50% reflectance) interspersed every 0.5 m is used. The internal surface reflectance follows the tables of Manufacturers Factor (Cu) of fixtures, due to the fact of using the Lumem Method for estimating the number of fixtures: 70% for the ceiling, 50% for the walls, and 10% for the floor (751).
Figure 1: Analisys model: section of solar protection and geometry
2.2 Daylight availability For this stage, the concept of lighting zones is adopted - areas that have a similar distribution of daylighting [7]. This study adopted this concept using a dynamic metric - Daylight Autonomy (DA) - which uses work plane illuminance as an indicator of whether there is sufficient daylight in a space so that an occupant can work by daylight alone. It enables the identification of the percentage of time that it is necessary to use artificial lighting system. Yet there are no indications for the division of zones considering a dynamic metric, some criteria have been defined, based on the perception of the authors, acting as designers, and the considerations of previous works [6, 7, 8]. This work identified three intervals:
Table 1: Definition of the intervals for the lighting zones
Intervals
0 – 20% DA System fully connected
20 – 80% DA Partially connected system
80 – 100% DA System totally disconnected
In this paper, the file climatic TRY (Test Reference Year) was adopted as the input data. The climate file can be found at the Laboratory for Energy Efficiency in Buildings at UFSC (http://www.labeee.ufsc.br ). The base model was built into the program Sketchup (http://www.sketchup.com/ ) which defines the material properties and orientation (North). The model was simulated every working day of the year (Monday through Friday) at intervals of 60 minutes, during 08h00am to 18h00pm totaling 2.080h annual occupancy hours (Tu). The daylight performance that resulted from the simulation with Daysim program is analyzed according two DA values over the working plane: 250 and 500 lux, due to the fact of using a stepped control system. Program WinSurf allows graphical visualization of results through curves of Daylight Autonomy - IsoDA. The intervals are identified and marked in each graph. In the DA 250lux graphic is delimited ZONE 03, which corresponds to that where daylight never reaches 250 lux (or 500lux) requiring artificial lighting system fully active to provide adequate lighting. ZONE 02 is delimited by the sum of the interval 20-80% for each value of DA. ZONE 01 is already identified in the DA 500lux graphic, where over 80% of the time there is autonomy of daylight for this amount of illuminance, implying a total artificial system shutdown.
3
Energy consumption (kWh) is calculated by multiplying the installed capacity of the artificial lighting system (Pz) in each daylighting zone by the time when the artificial lighting system needs to be connected during the year. This was considered a control system of three steps, allowing connecting or disconnecting the circuit totally or half of it in each zone. The time of utilization of artificial lighting system (Tart) in each zone is obtained by means of average values of each DA zone. These averages show the time that will be necessary to use artificial illumination throughout the year, compared to occupancy hours, 2080h (Tu). The installed power (measured in kW) is checked in each zone and the system fully connected, allowing the analysis of energy consumption when daylight is utilized by zoning system. For the calculation, it is counted only the powers of the luminaries present in each zone. Thus, the consumption calculations for each zone are given by Equation 1, where Pz refers to the installed power for each zone. Situation 1 is used for half of the installed capacity in each zone, since this situation uses half circuit, whereas for Situation 2, the total power is accounted for each zone. For each zone are calculated both situations.
Consumption = Pz * Tart Zone (Situation 2) + Pz/2* Tart Zone (Situation 1) (1) 2.2 Artificial light systems First, the fixtures are positioned in the room in a conventional rectangular grid, using only one type of luminaire. At this stage, the standard for distribution of fixtures consider some criteria: the distance between the fixtures is twice the distance between them and the side walls, not exceeding 1.5 times the mounting height of the luminaire and work plan. The fixtures have longitudinal orientation (0 degree). For this first stage, projects are identified by the nomenclature "ORIGINAL". A summary of the parameters used in the simulation is shown in Table 2. Table 2: Parameters for simulation - artificial lighting
Illuminance project Depreciation factor (Fd) Maintenance factor Utilization factor (Cu)
600 lux 1 100% Catalog
The equipments are selected through manufacturer's catalog LightGroup due to the compatibility of photometric files with program LightTool, used for simulations of artificial lighting systems. For this study are used two lines of fixtures with fins (BNI and DLB), a line with diffuser element (DIF) and other with reflectors (OCT), resulting in thirteen tubular fluorescent lamps T8 lighting fixtures (Table 3).
Table 3: Description of fixtures selected
Fixtures Luminous flux (lm) Efficiency (lm/W) Power (W)
BNI 3312 2x16W 1200 75 32
BNI 3312 2x32W 2600 81,3 64
BNI 3312 4x16W 1200 75 64
BNI3312 4x32W 2700 84.3 128
DBL 3391 2x16W 1200 75 32
DBL 3391 2x32W 2700 84.3 64
DBL 3391 4x16W 1200 75 64
DBL2391 4x32W 2700 84.3 128
OCT 1369 2x16W 1200 75 32
OCT 1369 2x32W 2700 84.3 64
OCT 1369 1x32W 2700 84.3 32
DIF2351 2x16W 1200 75 32
DIF2351 2x32W 2700 84.3 64
2.3 Reformulations Based on observations carried out on the Originals systems, characteristics were identified that could be investigated for better lighting design. Therefore, are proposed eight reformulations of artificial lighting systems, seeking to verify the influence of criteria such as spacing, orientation, and distribution of lighting fixtures in behavior. Eight projects have been developed for artificial lighting (Table 4).
4
In this step, we try to maintain some uniformity of distribution, while recognizing that the best distribution pointed implies the use of different light fixtures on the same project and random distributions [2,4]. This consideration is due to the fact that in practice, distributions as indicated in studies to become unworkable and visually unpleasant.
Table 4: Description of reformulations for artificial lighting systems
R01_90 Change fixtures direction by 90 degrees
R01_45 Change fixtures direction by 45 degrees
R02 Uniform distribution in each day light zone
R03 Disregard the criteria used in the original design:e=1,5L
R04 Alternate system, reducing the distances between the lines to half
R05 Reduction of distances of fixtures near the walls in 1/3 of the distance between them
R05_2 Increasing the distance of the fixtures in the center of the environment
R06 Circular distributions
2.4 Analysis variables To analyze lighting quality, light intervals over a defined minimum level of illumination are used. In Brazil, the available reference that establishes the minimum average illuminances (Em) for interior lighting is the NBR 5413 of ABNT [1]. For this study, an illuminance level of 600 lux was used as a minimum average illuminance. As shown in Table 5, as example, the classification adopts 70% Em as the top limit for the interval classified as “bad”; the interval classified as “sufficient” comprehends illuminance levels that go from 70%Em to 120% Em. This one was used as parameter for the analyses of light quality. Table 5: Lighting levels: Definition of analysis intervals - Em = 600 lux
Illuminance range Interval Classification
Values below 70% Em 0 - 420 lux Bad
Values between 70% Em until Em 420 - 600 lux Regular
Values between 70%Em until 120%Em 600 - 720 lux Sufficient
Values between 120% Em until 150%Em 720 - 900 lux Good
Values above 150%E m Above 900 lux Excessive
Another criteria used for quality analysis is the uniformity of lighting (U), which is important for comfort and visual performance. This parameter is the ratio of minimum illuminance (Emin) and the average (Emed) obtained for the points of the environment. Ratios were calculated for each project, however, was not defined a baseline for comparison. 3. Results analysis The first part of analysis is performed seeking to identify the best solutions for each project in relation to interval considered sufficient (600-720 lux) and greater uniformity, as well as to analyze the influence of reformulations in each type of luminaire. Table 6 shows an example of the results for the projects that had higher values for the uniformity and area in the range of 600 to 720 lux.
Table 6: Example of selected projects with the best solutions for each parameter – line BNI
Higher U Higher area (600 a 720 lux) Better distribution
BNI 2x16w R05_2 R01_90 R01_45 Original R01_90
2x32w R05_2 R05_2 R05_2
4x16w R05_2 R01_45 R06 R01_45
4x32w R05_2 R2 R3 R2
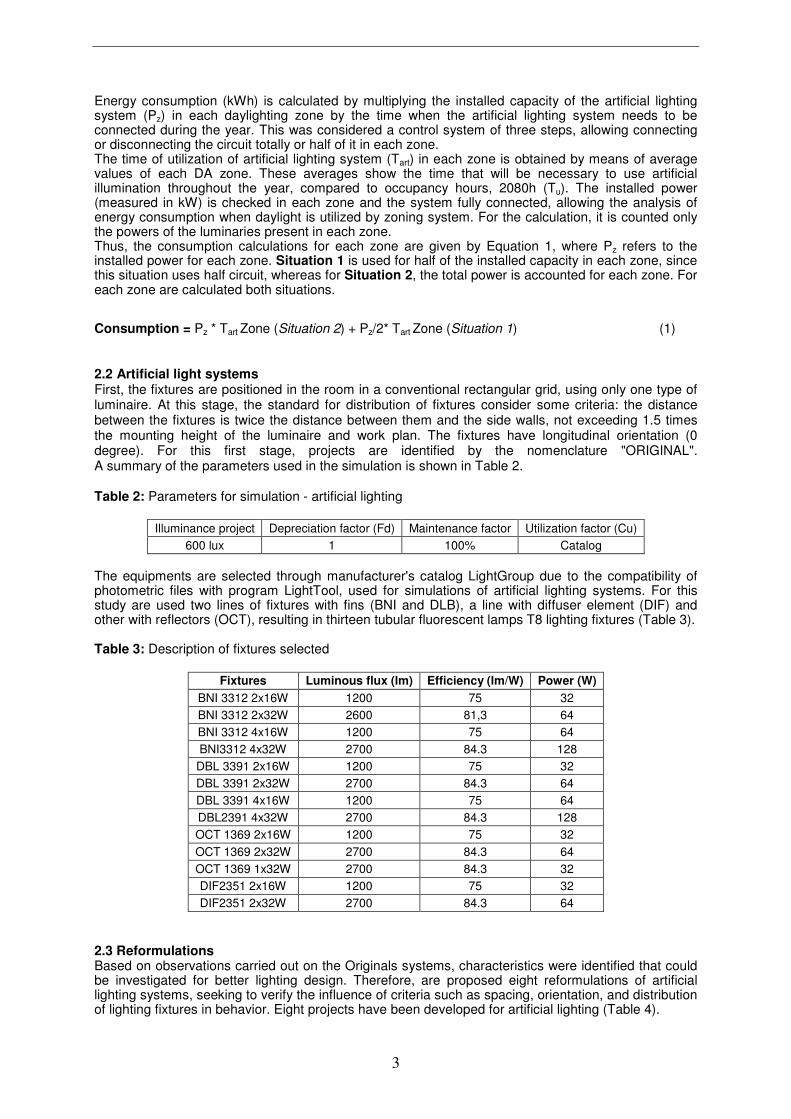
It is at this point there is a difficulty in defining the quality of the project- not always the greatest uniformity coincides with larger areas within a range analysis. As a proposal to complement the analysis, the projects selected in the first stage are also evaluated in relation to the distribution of light on the work plan, through luminous zone maps (Figure 2). This analysis allows visualization of how the light is distributed in the work plan. The selection procedure to determine the best design among
5
those selected in Table 6, for each type of lamp, follows the procedure adopted in Figure 2 for the luminaire 4x16W BNI.
R01_45 U =0.34
R05_2 U =0.48
R06 U =0.30
Figure 2: Example of selecting the best design for luminaire BNI 4x16W by lighting levels
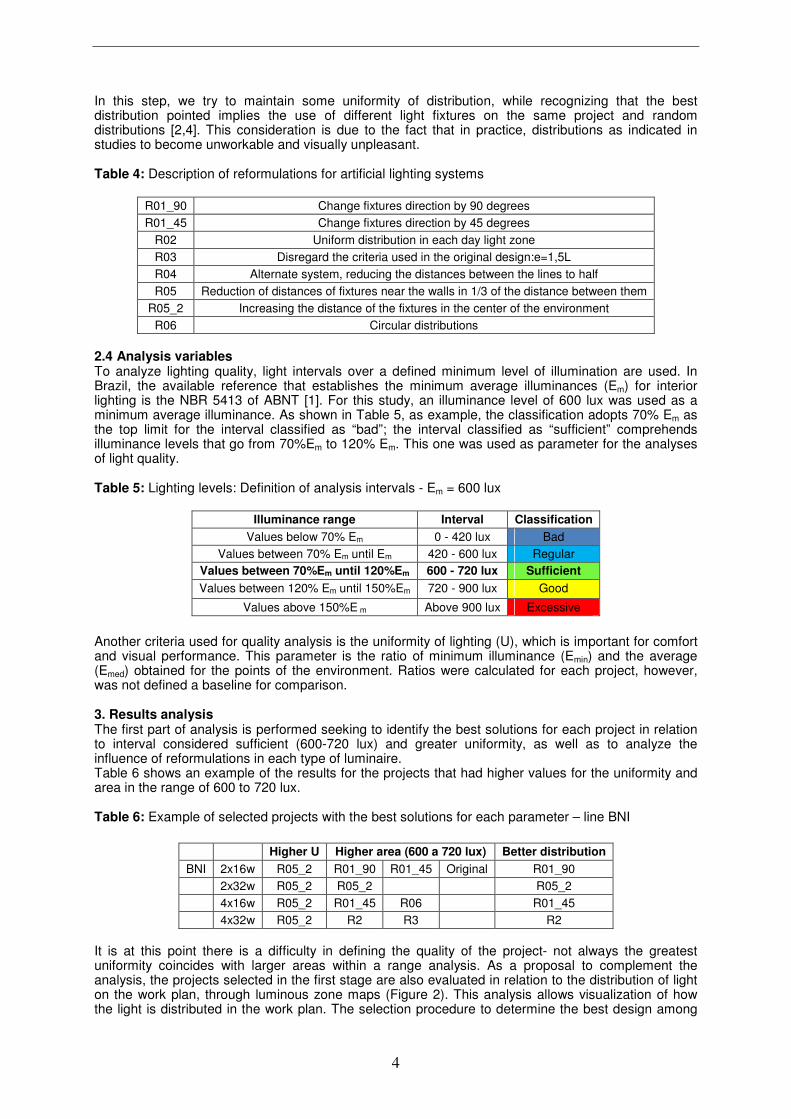
According to Table 6, it is seen that the reformulation R05_2 presents greater uniformity and smaller area in the range 600 a 720 lux, approximately- 45.7% lux – less than the other solutions selected. However the mapping of isolux curves shows that the distribution in the range 600-720 lux is not homogenous. The observation of Table 6 and Figure 2 shows that R01_45 presents lower uniformity (0.34), better distribution of the light on work plane and 63.7% of area in the range examined. R06 shows 61.6% in the range, however there is the presence of areas with excessive lighting (yellow areas in Figure 2). Thus, the best reformulation chosen, which combines larger area and better distribution in the area, is R01_45. This procedure was repeated for each line type and luminaire. Figure 3 shows the final results for the best solutions, linking the parameter of uniformity with percentages ranging in area from 600 to 720lux and intervals above 900 lux.
Figure 3: Graph comparing the best solutions
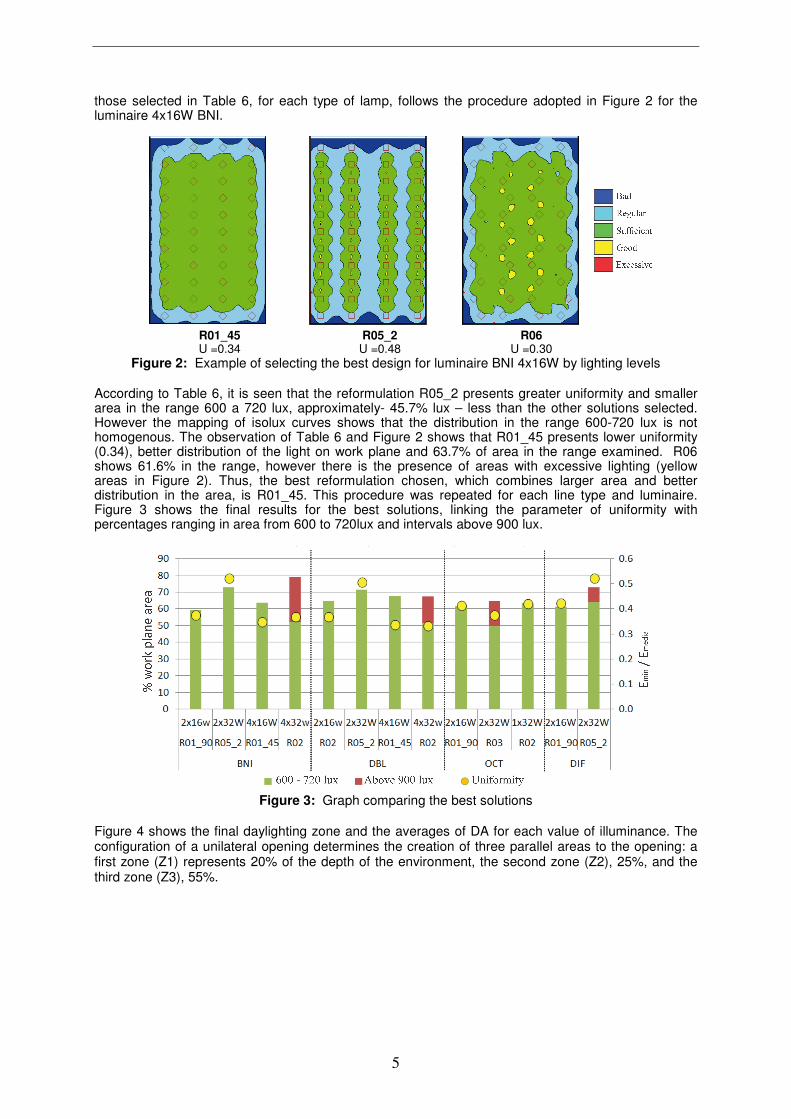
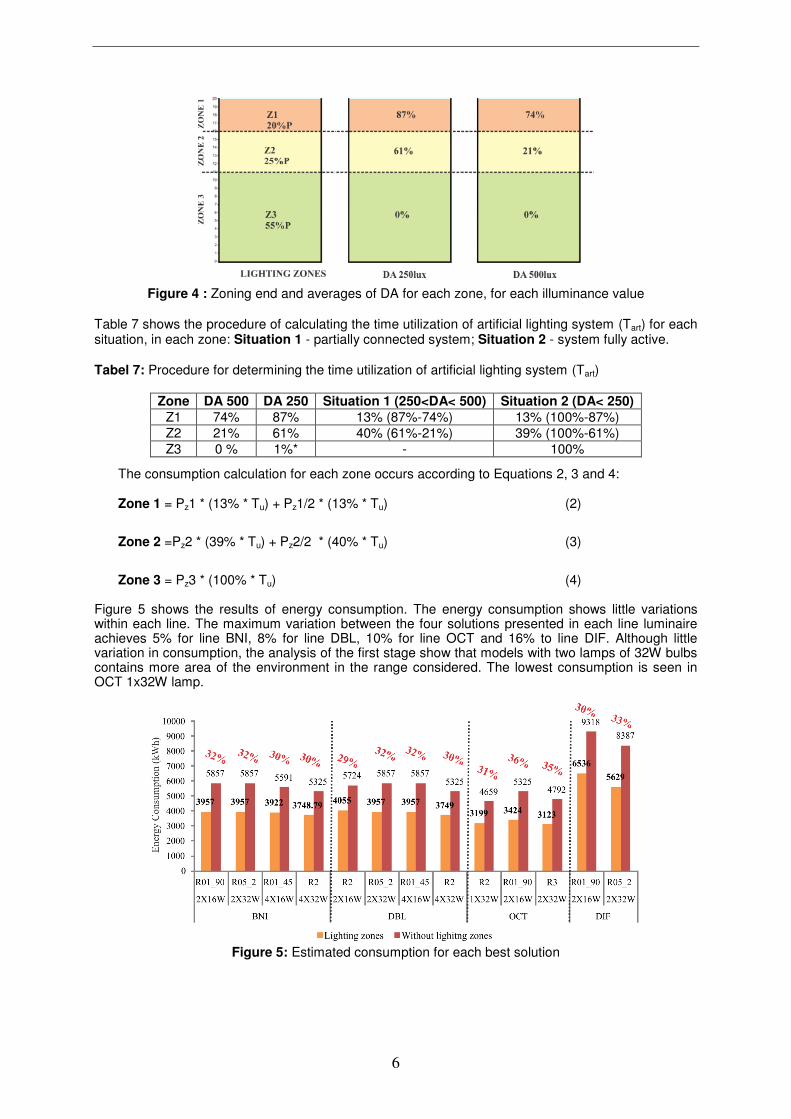
Figure 4 shows the final daylighting zone and the averages of DA for each value of illuminance. The configuration of a unilateral opening determines the creation of three parallel areas to the opening: a first zone (Z1) represents 20% of the depth of the environment, the second zone (Z2), 25%, and the third zone (Z3), 55%.
6
Figure 4 : Zoning end and averages of DA for each zone, for each illuminance value
Table 7 shows the procedure of calculating the time utilization of artificial lighting system (Tart) for each situation, in each zone: Situation 1 - partially connected system; Situation 2 - system fully active. Tabel 7: Procedure for determining the time utilization of artificial lighting system (Tart)
Zone DA 500 DA 250 Situation 1 (250<DA< 500) Situation 2 (DA< 250)
Z1 74% 87% 13% (87%-74%) 13% (100%-87%)
Z2 21% 61% 40% (61%-21%) 39% (100%-61%)
Z3 0 % 1%* - 100%
The consumption calculation for each zone occurs according to Equations 2, 3 and 4:
Zone 1 = Pz1 * (13% * Tu) + Pz1/2 * (13% * Tu) (2)
Zone 2 =Pz2 * (39% * Tu) + Pz2/2 * (40% * Tu) (3)
Zone 3 = Pz3 * (100% * Tu) (4)
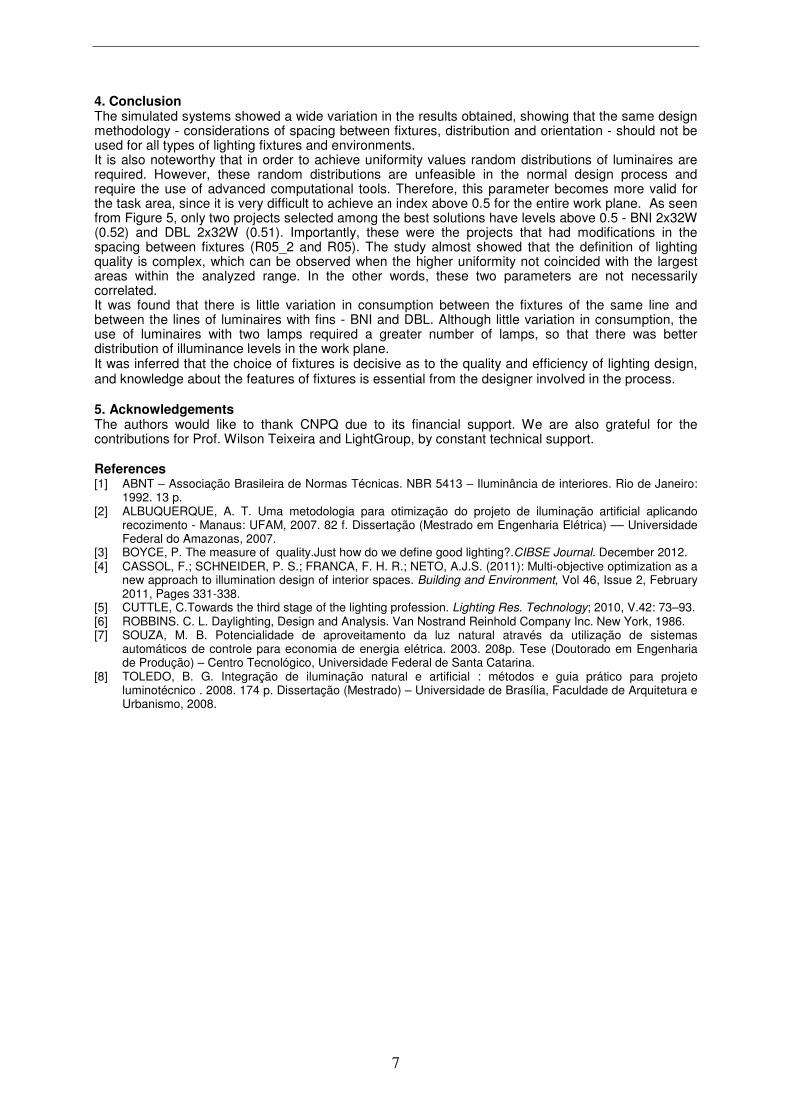
Figure 5 shows the results of energy consumption. The energy consumption shows little variations within each line. The maximum variation between the four solutions presented in each line luminaire achieves 5% for line BNI, 8% for line DBL, 10% for line OCT and 16% to line DIF. Although little variation in consumption, the analysis of the first stage show that models with two lamps of 32W bulbs contains more area of the environment in the range considered. The lowest consumption is seen in OCT 1x32W lamp.
Figure 5: Estimated consumption for each best solution
7
4. Conclusion The simulated systems showed a wide variation in the results obtained, showing that the same design methodology - considerations of spacing between fixtures, distribution and orientation - should not be used for all types of lighting fixtures and environments. It is also noteworthy that in order to achieve uniformity values random distributions of luminaires are required. However, these random distributions are unfeasible in the normal design process and require the use of advanced computational tools. Therefore, this parameter becomes more valid for the task area, since it is very difficult to achieve an index above 0.5 for the entire work plane. As seen from Figure 5, only two projects selected among the best solutions have levels above 0.5 - BNI 2x32W (0.52) and DBL 2x32W (0.51). Importantly, these were the projects that had modifications in the spacing between fixtures (R05_2 and R05). The study almost showed that the definition of lighting quality is complex, which can be observed when the higher uniformity not coincided with the largest areas within the analyzed range. In the other words, these two parameters are not necessarily correlated. It was found that there is little variation in consumption between the fixtures of the same line and between the lines of luminaires with fins - BNI and DBL. Although little variation in consumption, the use of luminaires with two lamps required a greater number of lamps, so that there was better distribution of illuminance levels in the work plane. It was inferred that the choice of fixtures is decisive as to the quality and efficiency of lighting design, and knowledge about the features of fixtures is essential from the designer involved in the process. 5. Acknowledgements The authors would like to thank CNPQ due to its financial support. We are also grateful for the contributions for Prof. Wilson Teixeira and LightGroup, by constant technical support. References [1] ABNT – Associação Brasileira de Normas Técnicas. NBR 5413 – Iluminância de interiores. Rio de Janeiro:
1992. 13 p. [2] ALBUQUERQUE, A. T. Uma metodologia para otimização do projeto de iluminação artificial aplicando
recozimento - Manaus: UFAM, 2007. 82 f. Dissertação (Mestrado em Engenharia Elétrica) –– Universidade Federal do Amazonas, 2007.
[3] BOYCE, P. The measure of quality.Just how do we define good lighting?.CIBSE Journal. December 2012. [4] CASSOL, F.; SCHNEIDER, P. S.; FRANCA, F. H. R.; NETO, A.J.S. (2011): Multi-objective optimization as a
new approach to illumination design of interior spaces. Building and Environment, Vol 46, Issue 2, February 2011, Pages 331-338.
[5] CUTTLE, C.Towards the third stage of the lighting profession. Lighting Res. Technology; 2010, V.42: 73–93. [6] ROBBINS. C. L. Daylighting, Design and Analysis. Van Nostrand Reinhold Company Inc. New York, 1986. [7] SOUZA, M. B. Potencialidade de aproveitamento da luz natural através da utilização de sistemas
automáticos de controle para economia de energia elétrica. 2003. 208p. Tese (Doutorado em Engenharia de Produção) – Centro Tecnológico, Universidade Federal de Santa Catarina.
[8] TOLEDO, B. G. Integração de iluminação natural e artificial : métodos e guia prático para projeto luminotécnico . 2008. 174 p. Dissertação (Mestrado) – Universidade de Brasília, Faculdade de Arquitetura e Urbanismo, 2008.