Embed Size (px)
Citation preview

FIG Working Week 2015 1
• COMPARATIVE STUDY OF PIXEL-BASED AND OBJECT-BASED IMAGE ANALYSIS
IN LANDCOVER AND LANDUSE MAPPING OF ABA Main Township For
Environmental Sustainability .
BY
• Njike CHIGBU, Joel Izuchukwu Igbokwe, Innocent Bello, Kingsley Idhoko & Michael Apeh(Nigeria)
Presentation outline• INTRODUCTION• THEORITICAL FRAME WORK• METHODOLOGY• DATA ANALYSIS, RESULTS AND DISCUSSIONS• SUMMARY,CONCLUSION AND RECOMMENDATIONS• BIBLIOGRAPHICAL NOTES

FIG Working Week 2015 2
INTRODUCTION
An important condition that will guarantee effectivemanagement of any nation’s development is the ability of thenation to monitor and control environmental trends and hernatural resources potential in both time and space.Remote sensing, especially by Earth observation satellitescomplemented by Navigation and telecommunication satellitesplays very important roles in generation and distribution ofgeoinformation in a timely manner and at the required scaleand quality(Igbokwe,2010).
INTRODUCTION CONTD
• Remote Sensing information or data are acquired by means ofphotographic, mechanical, numerical or visual sensors located mainly onmobile platforms.
• The information so acquired is capable of being transformedinto physicalparameters that can contribute to the evaluation or characterization of theearth’s surface or man’s environment (Ndukwe, 2009).
• Remote sensing image analysis is a very important and challenging task however; a popular and commonly used approach to image analysis is digital image classification.
• The purposeof image classification is to label the pixels in the image with meaningful information of the real world.

FIG Working Week 2015 3
Introduction Contd.
• Through classification of digital remote sensing image,thematic maps bearing the information such as the landcover type; vegetation type, etc., can be obtained andanalyzed. Typical method of classification of Remote Sensingimagery has beenpixel-based.
• In the Pixel- based Image Analysis, the multispectral dataare used to perform the classification and the spectral patternpresent within the data in question for each pixel is used asthe numerical basis for categorization.
Introd Contd.
• Pixel-based approach is based on conventionalstatistical techniques(BINARY METHOD), such assupervised and unsupervised classification.
• In supervised classification the image is analyzed bypixel categorization process by specifying to thecomputer algorithm, numerical description of thevarious land cover types present in a scene.

FIG Working Week 2015 4
Introd Contd.
• Digital image classification techniques group pixels to
represent land cover features. Land cover could be
forested, urban, agricultural and other types of features.
• There are three main image classification techniques in
Remote Sensing:
• (1) Unsupervised image classification
• (2) Supervised image classification
• (3) Object-based image analysis• 1 & 2 are PIXEL-BASED Classifications.
SPECTRAL SIGNATURE OF LAND COVER CLASS
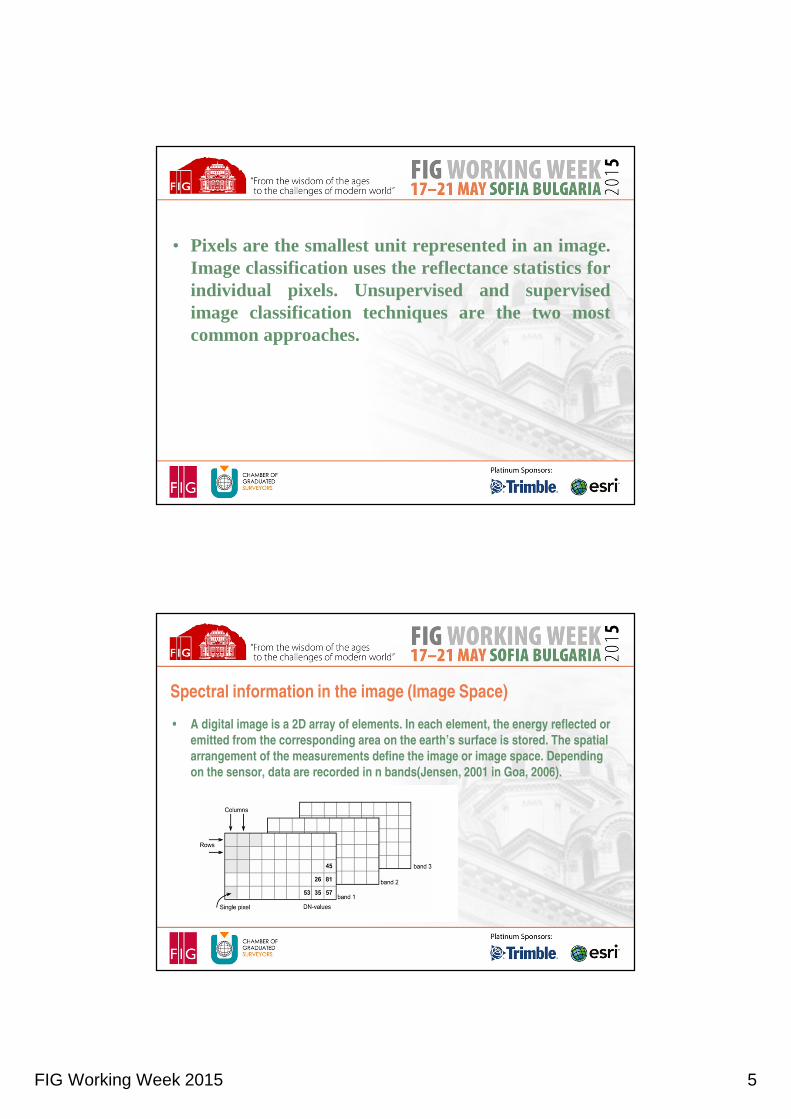
FIG Working Week 2015 5
• Pixels are the smallest unit represented in an image.Image classification uses the reflectance statistics forindividual pixels. Unsupervised and supervisedimage classification techniques are the two mostcommon approaches.
Spectral information in the image (Image Space)
• A digital image is a 2D array of elements. In each element, the energy reflected or
emitted from the corresponding area on the earth’s surface is stored. The spatial
arrangement of the measurements define the image or image space. Depending
on the sensor, data are recorded in n bands(Jensen, 2001 in Goa, 2006).

FIG Working Week 2015 6
Feature Space
• In one pixel, the values in two bands can be regarded as components of a two
dimensional vector, the feature vector. The following is the plotting of the values
of a pixel in the feature space for a two and three band image.
UNSUPERVISED CLASSIFICATION
• Here the Pixels are grouped based on the reflectance properties ofpixels(Features). These groupings are called “clusters”.The useridentifies the number of clusters to generate and which bands to use. Withthis information, the image classification software generates clusters.There are different image clustering algorithms such as K-means andISODATA.
• The user manually identifies each cluster with land cover classes. It’soften the case that multiple clusters represent a single land cover class.The user merges clusters into a land cover type. The unsupervisedclassification image classification technique is commonly used when nosample sites exist.

FIG Working Week 2015 7
SUPERVISED CLASSIFICATION• The user selects representative samples for each land coverclass in the
digital image. These sample land cover classes are called “training sites”.The image classification software uses the training sites to identify theland cover classes in the entire image(TRAINING STAGE).
• The classification of land cover is based on the spectral signature definedin the training set. The digital image classification software determineseach class on what it resembles most in the training set. The commonsupervised classification algorithms are maximum likelihood andminimum-distance classification(CLASSIFICATION STAGE).
• Here the MAXIMUM LIKELIHOOD Classifier decision rule based on anormalized (GAUSSIAN) estimate of probability density function eachclass was used.
SUPERVISED CLASSIFICATION CONTD.
• After evaluating the probability in each category, the pixel would be assigned to
the one with highest probability value or be labelled “unknown” of the
probability values are all below a threshold set by the analyst.
• (Maximum likelihood Method, Jenson 2001 in Goa, 2006).

FIG Working Week 2015 8
SUPERVISED CLASSIFICATION STEPS
OBJECT-BASED IMAGE CLASSIFICATION
• Traditional pixel-based processing generates square classifiedpixels. Object-based image classification is very different inthat it generates objects of different shape and scale.
• This process is called multi-resolution segmentation.Multiresolution segmentation produces homogenous imageobjects by grouping pixels.
• Objects are generated with different scales in an imagesimultaneously. These objects are more meaningful than thetraditional pixel-based segmentation because they can beclassified based on texture, context and geometry.

FIG Working Week 2015 9
Early Attempts at pixel-based classification
• Land cover map of Great Britain 1990 used Multi-temporal Landsat 5 Thematic
Mapper data to produce a 25M spatial resolution pixel-based recording of land
cover type(Area approximately 1.5 x 1.0 km in Agric. region of East
Anglia)(Fuller, et al. 1994).
• Draw backs of the pixel-based method:
• Pixel’s spatial extent may not match the extent of the land cover feature interest
• Problems of mixed classification is well known , whereby a pixel represents
more than a single type of land cover often leading to
misclassification(Fisher,1997).
• Another problem is where object of interest is considerably larger than the pixel
size leads to inappropriate classification because of the problem of within field
variation(Agricultural field)
Early Attempts at Object-Based Classification
• Developed as part of the classification of the Environment with Vector and
Raster-Mapping (CLEVER-MAPPing) project (Dean and Smith, 2003) and used
for the production of the 1997 Land cover Map of Jersey(Smith and Fuller, 2001)
and Land cover Map 2000(LCM 2000) of the UK, Fuller et al. 2002).
• Strong points for Object-based Classification:
• Removing the possibility of misclassifying individual pixels( can be more
accurate than pixel-based method).
• By focusing on real-world objects, maps produced in this way may be more
recognisable and directly usable by analysts(Benz et al. 2004).
• Objects-based information may be integrated with other spatial data in vector-
based geographical information system(GIS) environment.

FIG Working Week 2015 10
OBJECT-BASED CONTD.
• Segmentation is the main process in the object-basedclassification and its aim is to create meaningfulobjects.
• This means that an image object should ideallyrepresent the shape of each object in question.
• This shape combined with further derivatives suchas color and texture properties can be used toinitially classify the image by classifying thegenerated image-objects
Different Segmentation Approaches in object-based
classification
• (A) Direct Method
• (i) Region Growing technique: Can be employed to group adjacent pixels with
similar spectral values into individual objects(Goa et al. 2006).
• (ii) Edge Detection Technique: Can be used to identify discontinuities( object
boundaries or edges) throughout the image, These boundaries can be used to
build polygons for object-based classification(Carlaer et al. 2005).
• (B) Indirect Method
• Here, the imagery is supplemented with another spatial data, often, digital vector
map data. The objects characterised by the vector polygons are assigned land
cover values derived from the imagery. This is done by calculating the modal
land cover class for each object.,

FIG Working Week 2015 11
Image - Object Hierarchy
• In performing the segmentation of the Quickbird imagery ofAba different scales and other parameters were used. Basedon these parameters, the segmentation process wasperformed.
• Using Nearest Neighbor as the classifier which is similar tosupervised classification and training areas selected, thetraining areas are training objects; one sample object coversmany typical pixel samples and their variation

FIG Working Week 2015 12
STATEMENT OF PROBLEM
• Classical algorithms of pixel-based image analysis are becoming lessimportant for high resolution imagery classification.
• Alternatives to a pixel-based classification are being currently developed forinstance the object-based approach that takes into accountthe form,textures and spectral information.
• The traditional pixel-based algorithm is based on binary theory.
• Based on this binary theory, one pixel is labeled to a class oris not assignedor remains unknown or not classified. For overlapping pixels, by the binarytheory, such pixels will be labeled in one or two classes showing affinity
MIXED- PIXEL PROBLEM OF TRADITIONAL PIXEL-BASED
CLASSIFICATION

FIG Working Week 2015 13
• The traditional per pixel-based classification algorithm does not have the capability to solve the above problem because the image is classified according to the spectral information and the pixels in the overlapping region will be misclassified or incorrectly classified.
• Object-based image classification is believed to have a solution to the problems by combing spectral and spatial information in its analysis.
• Object-based image classification is based on the assumption that imageobjects provide a more appropriate scale to map environmental featuresat multiple spatial scales.
• The statement above is based on fuzzy theory, which assigns membershipfunction of 1 or more (between 0 to 1) classes (Gao, 2003).
STATEMENT OF PROBLEM CONTD.
• Object-based image classification typically consists of three main steps:
• (1) Image segmentation
• (2) Development of an image object hierarchy
• (3) Classification (Benz et al., 2004).
• Aba is one of the fastest growing towns in Nigeria and also thecommercial nerve center of Abia State.
• Despite the strategic location and importance of the town inthe socio-economic development of Nigeria, no concerted effort has been made todocument at regular intervals the land use and land cover changes forsustainability.

FIG Working Week 2015 14
JUSTIFICATION FOR THE STUDY
• This study, therefore, will add to the use of remotesensing and GIS in land use and land cover changesstudies of Aba Main Township and also provide aguide for future physical development andsustainable planning of the town.
THE STUDY AREA(Nigeria Showing South-Easthern States)

FIG Working Week 2015 15
ABIA STATE SHOWING ABA-TOWNSHIP
STUDY AREA CONTD.
• This research area is Aba Main Township comprising Aba North, AbaSouth and part of Osisioma local Government Areas in Abia State ofNigeria.
• Aba is predominantly a commercial and industrial town, which owes itsrapid growth to the functional transformation of pre-Briti sh villages intoadministrative headquarters of the various political units, which werecreated in Nigeria during the colonial period (Okoye, 2012).
• Okoye (2012), posited that Aba was simply a market village onthe routefrom Bende to Bonny town which was a route for slave trade.
• Owing to the slave trade expedition and the centrality of thetown, amilitary post was established in 1901 while a court was also established in1904 for justice dispensation.

FIG Working Week 2015 16
STUDY AREA CONTD
• Okoye (2012) noted further that the position of Aba as an urban center was
strengthened by the fact the town served as the seat of administration for Ngwa
District in all Igbo land then. This lead then to the establishment of a hospital,
post office, prisons and also emergence of housing needs due to population
increase.
• Ogbonna (2008) in Okoye (2012) also buttressed that Aba assumed fully an
urban status during the early 1970 when the then Imo state was created as one
of the twelve states in Nigeria.
• Aba main town is in the South-eastern geo-political zone of Nigeria and is
located between latitudes 05o 2’ 30” N and 5o 08’ 00” N of equator and longitudes
07o 20’ 00” E and 07o 26’ 00” E of Greenwich meridian. The town lies within the
tropical rain forest zone of West Africa.
METHODOLOGY
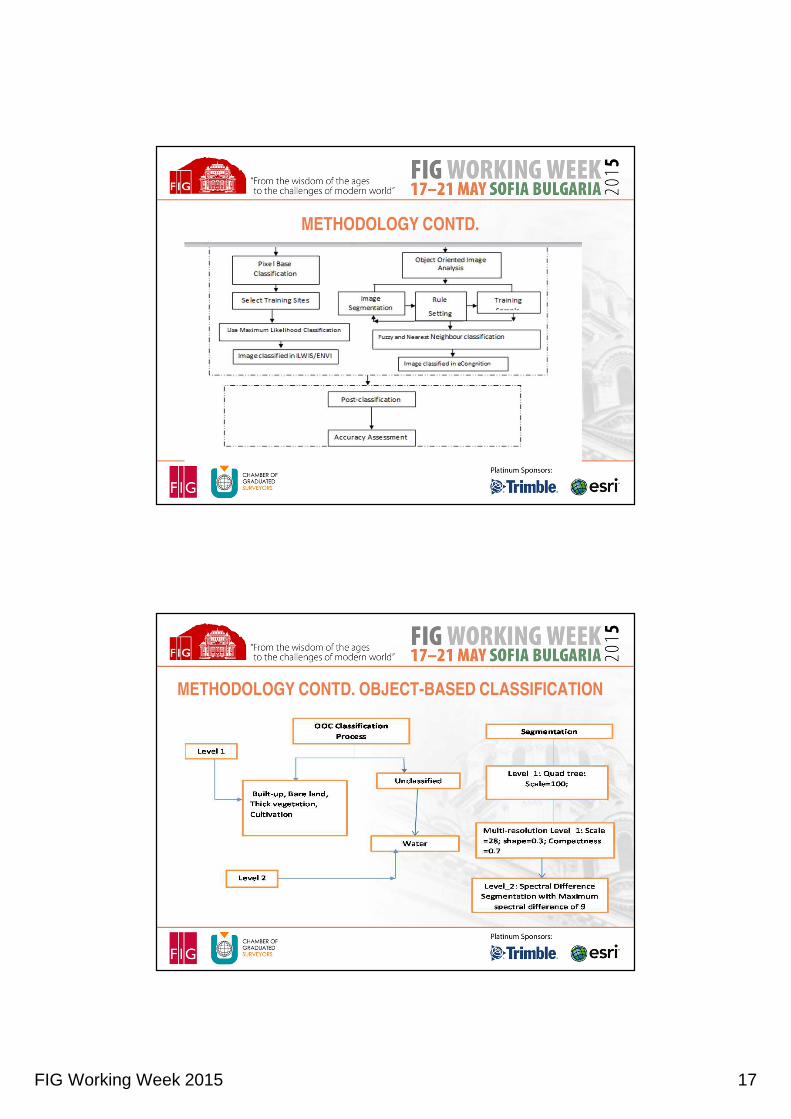
FIG Working Week 2015 17
METHODOLOGY CONTD.
METHODOLOGY CONTD. OBJECT-BASED CLASSIFICATION

FIG Working Week 2015 18
RUL-BASEDLEVELS RULE SET Features
LEVEL 1 Unclassified with brightness >=130 and =<140 at
level_1:Built_Up_Area
Unclassified with Rectangular fit => 0.6 and
<=0.8 at level_1: Built_up_Area
Built_Up Area
Unclassified with Red_band =>70 and <=90 at
level_1: Thick_Vegetation
Thick_Vegetation
Unclassified with Red_band =>90 and =< 100 at
level_1: Cultivated_Area
Cultivated_Area
Unclassified with Brightness >=110 and =< 130 at
Level_1: Bare_Surfaces
Bare Surfaces
LEVEL 2 Nearest Neighbour classifier Water
Tidy Merge and tidy classes
DATA REQUIREMENTS AND SOURCES
• The datasets used this study consists of two types:• Primary Data: This includes GPS data obtained using Garmin 76 x
handheld GPS Receiver during field completion and Groundtruthing exercise for image geo-referencing and different scenephotographs of the study area captured with canon digital camera.
• Secondary Data: Administrative map of Abia State at the scale of1:10000,Quickbird Satellite images of Aba of September, 2007 &2012 (0.5m resolution).
• The Quickbird images of Aba was obtained from the Global LandCover Facility (GLCF) through the Nigerian space agency(NASRDA) at Abuja.

FIG Working Week 2015 19
SYSTEM REQUIREMENTS• These include all the hardware and software used
HARDWARE: The following hardware was used in the work:
• A Pentium V personal computer that has the following specifications;40 GB
Hard Disk(HDD),256 MB Random Access Memory (RAM),1.6 Giga Hertz
Speed(Microprocessor speed),Mouse and Keyboard,512 MB USB Flash Disk For
data Storage and back up,500 G External hard Disk for data storage and back up,
HP 500 Digital AO Plotter, HP Design Jet Scanner 4200 for Vector to Raster
conversion, HP Laser/ Desk-Jet Printers, Garmin Handheld GPS 76 X for spatial
data capture, etc.
• SOFTWARE:
• This includes :eCognition 8.8 professional software, AutoCAD 2010, ArcGIS 9.2,
ILWIS software and Microsoft office 2010.
• The stages shown in Figure 4 were adopted in the imageprocessing, thematic image extraction/land use and landcover classifications were carried using pixel and object-based algorithms.
• For the pixel-based classification in ILWIS environment theSupervised Maximum likelihood classifier was used for theclassification of 2007 and 2012 images while for object-basedclassification the Multi-resolution Minimum Distance toMean classifier was used.
• Thereafter, Post classification processing and integrationwith GIS, overlay operation was undertaken to generatechange statistics and comparative accuracy analysis of Pixel-based and object- based methods were equally done.
FIG Working Week 2015 20
PIXEL-BASED CLASSIFICATION USING QUICKBIRD IMAGERY• The Maximum likelihood supervised classification algorithm is applied in pixel-
based classification.
• Based on the ground truth data, five land use and land cover classes wereidentified.
• These are Built-up/Settlements, Thick forest, CultivatedVegetation, Waterbody and Bare Surfaces.
• For ease of comparison for each method of classification, same training siteshave been represented with the same color coding
CLASSIFICATION RESULTS 2007 AND 2012 IMAGES (PIXEL-BASED)

FIG Working Week 2015 21
CREATING HISTOGTAM FOR CLASSIFIED IMAGE 2007
CREATING HISTOGTAM FOR CLASSIFIED IMAGE 2012

FIG Working Week 2015 22
ACCURACY ASSESSMENT FOR 2007 IMAGERY
ACCURACY ASSESSMENT FOR 2012 IMAGERY

FIG Working Week 2015 23
OVERLAY RESULT OF ABA-MAIN 2007-2012 CHANGE MAP (PIXEL-BASED)
ABA LULC 2007-2012 Change Table (Pixel-Based)
• While other land cover decreases, only Built-up land cover increased as a result
of urban growth of Aba.
LULC 2007 (area m2) 2012 (area m2) Changes (area m2)
Built-up 16527063.8 25191876.4 +8664812.6
Cultivation (Agric.) 10343363.0 8545762.4 -1797600.6
Water 934780.5 366277.4 -568503.1
Thick Vegetation (Forest) 17751196.9 15030490.8 -2720706.1
Bare-land 6817644.1 3192467.3 -3625176.8
TOTAL Classified 52374048.3 52326874.3 -47174.5 unclassified (mixed)

FIG Working Week 2015 24
2007/2012 OVERLAY GRAPH
296 Mixed6,782,621 Builtup
990,541 Cultivation543,865 Bareland930,236 Thick Vegetation46,435 Water
Graph of 2007- 2012 LULC Overlay
USEMixed Builtup Cultivation Bareland Thick Vegetation Water
COUNT
6,500,000
6,000,000
5,500,000
5,000,000
4,500,000
4,000,000
3,500,000
3,000,000
2,500,000
2,000,000
1,500,000
1,000,000
500,000
0
OBJECT –BASED CLASSIFICATION OF 2007 AND 2012 IMAGERIES in e-Cognition

FIG Working Week 2015 25
Image Layer Mixing with 1% Linear Equalizing For imagery 2007 & 2012
MULTIRESOLUTION SEGMENTATION
The scale value of 28, shape value of 0.3 and Compactness value of 0.7 show how
the rooftops and road network were segmented very well

FIG Working Week 2015 26
DEVELOPING RULESET FOR EXTRACTING LULC CLASSES
• Symbolizing object with Colour
• Extracting thick vegetation at level_1 using ruleset
Result of Multi-resolution segmentation
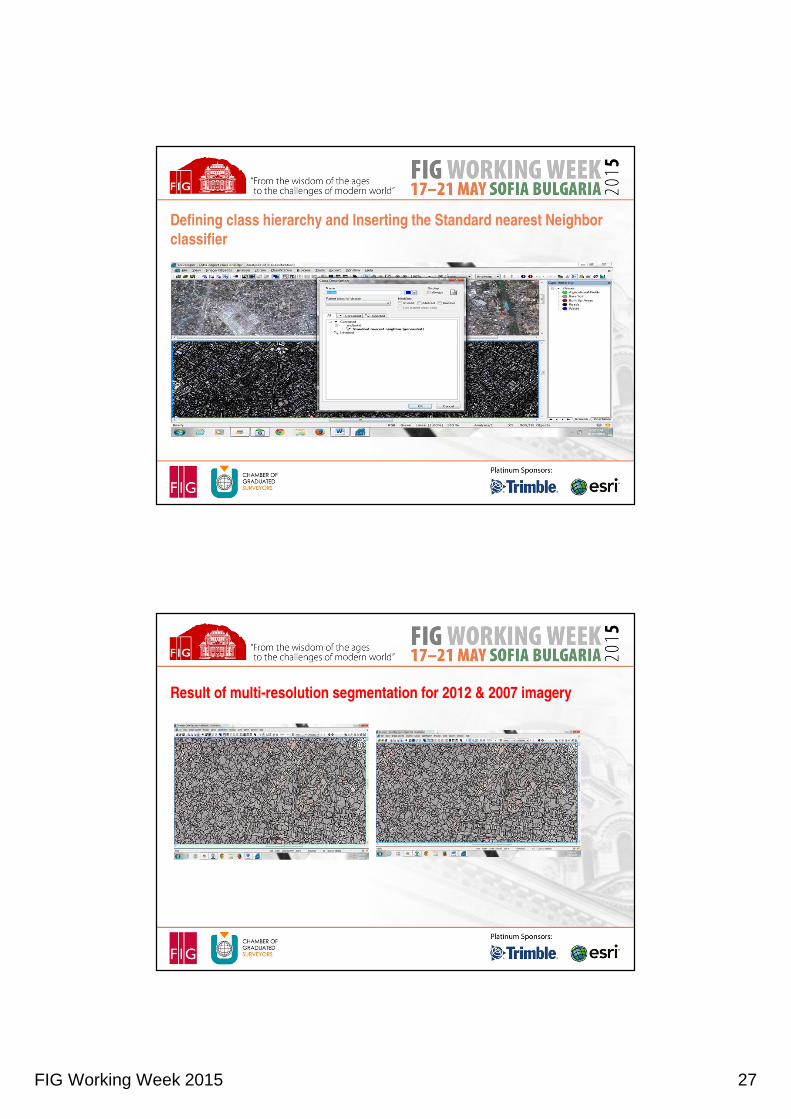
FIG Working Week 2015 27
Defining class hierarchy and Inserting the Standard nearest Neighbor
classifier
Result of multi-resolution segmentation for 2012 & 2007 imagery

FIG Working Week 2015 28
OBJECT-BASED CLASSIFICATION RESULT 2007 & 2012
Object Based Tabular analysis of change between 2007 and 2012 in Aba
• Class results:
LULC Type 2007(Area)
2012 (Area) LULC Change (2007 - 2012)
2007 (%) coverage
20012 (%)coverage
1 Builtup 16499824 25099242 +8599418 increased 31 48 +17
2 Forest (Thick Vegetation)
17752044 14622829 -3129215 decreased 33 28 -5
3 Bareland 6817702 3182542 -3635160 decreased 13 6.1 -6.9
4 Water 934680 364686 -569994 decreased 1.7 0.7 -1
5 Agric (Cultivation) 11257304 9057575 -2199729 decreased 21.3 17 -4.3
TOTAL 52326874 52326874 100 100 0

FIG Working Week 2015 29
HISTOGRAM OF CHANGES FOR LULC OF 2007 & 2008
• Histogram
ERROR MATRIX/ACCURACY ASSESSMENT FOR 2007 LULC
• Producer’s accuracy = 99.93%
• User’s accuracy = 99.87%
• Overall accuracy = 99.91%
Builtup Thick vegetation
Bareland Water Cultivation User’s accuracy
Built-up 16425902 95 11314 0 704 99.93Thick vegetation
19 17742998 190 3 7986 99.95
Bare land 11104 513 6805314 11 702 99.82Water 16 87 15 934664 14 100.00Cultivation 22 2504 711 8 1034220 99.69Producer’s accuracy
99.93 99.98 99.82 100.00 99.91 99.91

FIG Working Week 2015 30
ERROR MATRIX/ACCURACY ASSESSMENT FOR 2012 LULC
• User’s accuracy = 99.93%
• Producer’s accuracy = 99.93%
• Overall accuracy = 99.93%
Built-up Thick vegetation
Bare land Water Cultivation User’s accuracy
Built-up 25009928 321 1268 0 359 99.99
Thick vegetation
304 14601002 392 126 7002 99.95
Bare land 1148 562 3178247 0 2510 99.87
Water 0 282 0 364489 158 99.89
Cultivation 496 833 2560 0 8534383 99.95
Producer’s accuracy
99.99 99.99 99.82 99.97 99.88 99.93
LAND USE AND LAND COVER MAP OF ABA MAIN TOWN

FIG Working Week 2015 31
DISCUSSION ON THE CLASSIFICATION ACCURACIES
• From the results of the confusion matrixes shown in the tables above, the overall
accuracy of the object-based classification was better than that of the Pixel-
based classification.
• While the object-based classification from eCognition had an overall accuracy of
99.91% (the producer’s and user’s accuracies were 99.93% and 99.88%
respectively for 2007 while the producer’s and user’s accuracy were 99.93% and
99.93 % for 2012 respectively), the pixel-based classification accuracies
obtained with ILWIS software for 2007were ( overall accuracy 85.92%, average
accuracy 81.03%) and 2012 were Average accuracy of 86.85% and overall
accuracy of 91.34% respectively..
• Their overall kappa was 0.859 and 0.913 for 2007 and 2012 classified imageries
(pixel-based) using ILWIS software while the kappa statistic for object based
2007 and 2012 were also 0.999 and o.998 respectively..
ANALYSIS OF CHANGE FOR LULC OF ABA (2007-2012)
• From the Pixel–based & Object-based Classifications 2007-2012
• ILwis(pixel) 2007-2012 Object 2007-2012
Built-up + 16.54
increase
+ 17
increase
Forest -5.13
decrease
5 decrease
Bare land -6.092
decrease
-6 decrease
Water -0.694
decrease
-1 decrease
Agric. -3.42
Decrease
4.3
Decrease
unclassified -1 none

FIG Working Week 2015 32
DISCUSSION CONTD
• The land cover classes classified using pixel-based in ILWIS, though,showed its inherent limitations of mixed pixel classification problems.
• In summary, the user’s and producer’s accuracies and kappa ineCognition results were on the average approximately 100% and 1respectively
• This result also calls for further research especially on the integration ofPixel-based and object-based methods of classifications for optimalresults.
CONTD
• Hence, a conclusion is drawn that the classification accuracies obtainedfrom the pixel-based classification and the object-based classificationwere distinctively different and significant, hence, elucidates existingliterature on the preference of object-based method of classification overthe pixel-based method(Goa,2003, SEGE,2011,Manandhar etal.2009,Aplin et al. 2012).
• Recently, object-based image analysis has been applied frequently forremote sensing image classification, than pixel-based classification (Fulleret al. 2002; Blaschke, 2010).

FIG Working Week 2015 33
summary• The application or use of spatial or contextual information from
neighborhood or adjacent pixels remains a critical drawback to pixel-based image processing (Luo et al, 2011).
• Conversely, object-based methods allow integration of different objectfeatures, such as spectral values, shape and texture.
• The strength of the object-based method is derived from its ability tocombine spectral information and spatial information in extracting earthsurface features (Baatz et al, 2000, Definiens, 2009, Manakos, et al., 2000).
• State of Land use / Land Cover (LULC) changes a total five (5) LULCtypes were extracted in the study area for 2007 and 2012 built-up.
Summary contd.
• In 2007 vegetation forest were the prevailing LULC type, contributing toabout 70% of the study landscape, water body had about 15%contribution while bare surface contributed about 5%. In 2012, thenumber of built-up area increased astronomically with marked decreasein bare surface, vegetal surface and water.
• This is due to population increase caused by influx of peopleto Aba MainTownship and the increased need for housing and shelter. Thechangeresults revealed a considerable reduction in farm land too,vegetation andforest from 2007 to 2012.

FIG Working Week 2015 34
summary
• The total vegetation / forest converted to built-up area amounts to about25% of surface features which existed in 2012. Built-up increased at therate of 5% annually for the period of 2007 to 2012.
• Similarly, bare lands decreased by 15% for the period under review.Water bodies also showed a marked decrease during the period of study(2007 – 2012).
• The change Matrix analysis show that as a whole, about (70%) ofthe landwithin the study landscape experienced LULC changes in one way oranother between 2007 – 2012.
CONCLUSION AND RECOMMENDATION
• The drawback for pixel-based image processing routines is the relatively
unsophiscated use of spatial information. Object based approaches may offer a
better alternative for many standard image processing tasks.
• The method of object-based classification is supported by rule-based
classification.
• The rules can be defined based on the spectral statistics, spatial and pattern.
• It is recommended that further research is needed in developing rule-based data
models that can be used to identify remote sensed data for more accurate
classification

FIG Working Week 2015 35
Contd.• The land use pattern and change dynamics of Aba urban showed marked and
phenomenal increase in Built-up areas and water body while the vegetal surface
decreased remarkably in both the pixel-based and object-based analysis.
• It is also observed that the object-based classification algorithm showed better
accuracy results in eCognition software than that achieved ILWIS software.
However, the limiting factor in the use of very robust software like eCognition is
the high cost of acquiring and renewal of license.
• There is also need to investigate the efficacy of open source software like spring
in object-based image classification especially for academic research work.
• From the research findings, it is imperative that there is appreciable andastronomical increase in built-up areas due to commercial activities andhigh rate of influx of people to Aba urban area. This challenge is hugeand massive to the planning authorities and other stakeholderenvironmental agencies.
• The increased population of the town occasioned by the commercialactivities has given room to astronomical increase in solidwastegeneration in the town. Thus the government agency in chargeof wastemanagement is overwhelmed by the rate of waste generation inAba.
• Therefore, there is need to implement all relevant town planning laws inthe town to abate the ugly consequences of slump growth and also carefulwaste disposal system planning which should be based on goodsite androute selection amongst other considerations.

FIG Working Week 2015 36
BIBLIOGRAPHICAL NOTES• CHIGBU NJIKE (mnis, M.Sc.)
• Presently the HEAD Surveying and Geoinformatics Dept. Abia State Polytechnic Aba,
NIGERIA. The DEPT. is an academic MEMBER of FIG.
• IGBOKWE, J.I.(fnis)
• Prof. of Surveying & Geoinformatics and Dean of Faculty of Environmental Sciences,
Nnamdi Azikiwe University, Awka, Nigeria.
• Bello Innocent(M.Sc.)
• Researcher National Remote Sensing Development Agency(NARSDA), Abuja, Nigeria.
• Idhoko, K.E.(Ph.D.) Dept. of Surveying& Geoinformatics, Nnamdi Azikiwe University, Awka,
Nigeria.
• Apeh Michael Dept. of Surveying and Geoinformatics, Idah Polytechnics,
• Kogi State.
• THANKS FOR LISTENING
• 5D GEOSPATIAL DUKE


![Efficient Object-Based Software Transactions · Ananian/Rinard: Efficient Object-Based Software Transactions, SCOOL '05 [3] Why object-based transactions? Synchronization abstraction](https://img.pdfslide.net/doc/110x75/5e77d0f8466d33505011f7b6/efficient-object-based-software-transactions-ananianrinard-efficient-object-based.jpg)