Embed Size (px)
Citation preview
International Journal of Research in all Subjects in Multi Languages
[Author: Manojkumar V. Patel] [Subject: Commerce/Account]
Vol. 5, Issue: 11, November: 2017
(IJRSML) ISSN: 2321 - 2853
18 Print, International, UGC Approved, Reviewed & Indexed Monthly Journal www.raijmr.com RET Academy for International Journals of Multidisciplinary Research (RAIJMR)
Comparative Study of Ratio Analysis of selected Textile
Companies of India
MANOJKUMAR VISHNUBHAI PATEL
Assistant Professor,
Shree Krishna Commerce College, Shankhalpur, Bechraji
Gujarat (India)
Abstract:
The Indian textile industry is one of the largest in the world with a massive raw material and textiles
manufacturing base. Our economy is largely dependent on the textile manufacturing and trade in
addition to other major industries. About 27% of the foreign exchange earnings are on account of
export of textiles and clothing alone. The textiles and clothing sector contributes about 14% to the
industrial production and 3% to the gross domestic product of the country. Around 8% of the total
excise revenue collection is contributed by the textile industry. So much so, the textile industry
accounts for as large as 21% of the total employment generated in the economy. Around 35 million
people are directly employed in the textile manufacturing activities.
Keywords: Ratio analysis, Textile company
1. Introduction
A textile is the largest single industry in India (and amongst the biggest in the worlds ). It provides
direct employment to around 20 million people. Textile and clothing exports account for one third of
the total value of exports from the country. There are 1,227 textile mills with a spinning capacity of
about 29 million spindles. While yarn is mostly produced in the mills, fabrics are produced in the
powerloom and handloom sectors as well. The Indian textile industry continues to be predominantly
based on cotton, with about 65% of row materials consumed being cotton. The yearly output of cotton
cloth was about 12.8 billion. The manufacture of jute products (1.1 million metric tons) ranks next in
importance to cotton weaving.
2. Overview of Research Unit
2.1 Reliance textile industry
Reliance Textiles is a sister company of Asco Textile Group that was established in 1950. As a small
family business, the company, at its infancy period, traded only printed fabric to various international
markets. Within a short period of time, the group had established a strong business links, with trading
partners from countries like Saudi Arabia, Dubai, and with other Gulf Countries.
2.2 Raymond Ltd.
Years ago, When the Singhania family was building, Consolidating and expanding its various
businesses in Kanpur(India), one Mr. Wadia was in a similar manner setting up a small woollen mill
in the area around Thane creek, 40 km away from Mumbai, India. The Sassoon’s a well Known
industrialist family of Mumbai, Soon acquired this mill and renamed it as The Raymond Woollen
Mills. A Acquisition of the Raymond Woollen Mills in the year 1925.
International Journal of Research in all Subjects in Multi Languages
[Author: Manojkumar V. Patel] [Subject: Commerce/Account]
Vol. 5, Issue: 11, November: 2017
(IJRSML) ISSN: 2321 - 2853
19 Print, International, UGC Approved, Reviewed & Indexed Monthly Journal www.raijmr.com RET Academy for International Journals of Multidisciplinary Research (RAIJMR)
2.3 Bombay Dyeing & Mfg. Co. Ltd.
The Bombay Dyeing & Mfg. Co. Ltd., established 1879 is the flagship company of the wadia Group,
engaged mainly into the business of textiles. Bombay Dyeing is one of India’s largest producer of
textiles. From a small cotton yarn operating unit established by Nowrosjee Wadia in 1879, Bombay
Dyeing has now grown to be one of the most powerful brands in the country.
2.4 Grasim Bhiwami Textile Ltd.
Grasim Bhiwami Textile Ltd is a subsidiary of Grasim industries Ltd having strong presence in
manufacturing of polyester Viscose fabric catering the market under brands GRASIM & GRAVIERA
as also exporting it’s fabric to various reputed brands. The company has its manufacturing facility in
Bhiwani Haryana and its Marketing & Sales Office at New Delhi. The company is spread across the
geography through a large network of dealers, agents and retail company outlets.
3. Review of Literature
Rakesh and Kulkarni (2012) analyzed the Gujarat textile industry working capital evaluating on
selected five company for the eleven years and performed ratio analysis, descriptive statistics etc. The
Study conducted with all the company financial performance with sound effective as well as current
and quick ratio, current assets on total asset, sales, turnover etc. are analyzed with the help of
hypothesis and used ANOVA. In this research also researcher followed this attributes. Zahid and
nanik (2011) concludes the overall performance of the textile sector was adversely affected by crisis
through analysis of income statement, debt payment ability, management and inventory sales,
receivable, productivity, fixed assets, etc.
Nusrat and Assocham(2008) analyzed the performance of sector analysis on 28 textile companies
from BSE with the attributes of net sales, Net profit, interest cost, raw material, power and fuel cost.
Virambhai (2010) textile industry productivity and financial efficiency focused on industry’s current
position and its performance. It concluded the company/management should try to increase the
production, minimize the cost and operating expenses, excise proper control on liquidity position,
reduction of power, fuel, borrowing funds, overheads, interest burden , etc.
4. Research Methodology
The present research paper is mainly based on secondly data obtained from the annual reports of the
sample units. To supplement the data different publications, various books, journals and different
websites related in textile industry have been used for better reliability.
5. Tools & Techniques of Analysis
The Collected data are daily edited, classified analyzed types of relevant accounting ratios; statically
techniques. The data are presented through simple classification and with the help of percentage,
average and the hypothesis are tested at 5% level of significance of employ in F Test.
6. Hypothesis of the Study
1. Profit before depreciation, interest and tax to gross sales of selected units are same during the
period of study.
2. Profit after tax to gross sales ratio of all units is same during the period of study.
3. PBDIT to net sales ratio of all units are same during the period of study.
4. PAT to net sales ratio of all units are same during the period of study.
6.1 PBDIT to gross sales ratio
This ratio shows the relationship between gross profits and sales. The first profitability ratio in
relation to sales is the gross profits margin. PBDIT to gross sales reflects the efficiency with which
management produces each unit of product. This ratio indicates the average spread between the cost
International Journal of Research in all Subjects in Multi Languages
[Author: Manojkumar V. Patel] [Subject: Commerce/Account]
Vol. 5, Issue: 11, November: 2017
(IJRSML) ISSN: 2321 - 2853
20 Print, International, UGC Approved, Reviewed & Indexed Monthly Journal www.raijmr.com RET Academy for International Journals of Multidisciplinary Research (RAIJMR)
of goods sold and the sales revenue. This ratio show profits relative to sales after the deduction of
production costs. And indicate the relation between production costs and selling price.
6.1.1 Formula
Gross Profit margin = PBDIT/gross sales*100
Table 1 PBDIT to Gross Sales Ratio
Year Reliance
Textile
Raymand
Ltd
Bombay
dyeing &
Mfg.Co.Ltd
Grasim
Bhiwani
textile ltd
Alok
ind.ltd
Overall
trade
2008 16.67% 12.08% 7.36% 15.21% 25.13% 15.29
2009 17.67% -15.00% -22.56% 11.71% 27.42% 19.24
2010 16.05% 9.5% 7.3% 16.74% 29.11% 15.74
2011 15.67% -3.37% 5.00% 14.32% 27.56% 11.84
2012 11.03% 9.96% 6.00% 11.86% 24.67% 12.76
Average 15.47 2.63 3.1 13.97 26.78
Above the Table indicates the PBDIT to gross sales ratio of textile industry? It indicates the
relationship between production cost and selling price. The data was for Five Years. For reliance
industry it was mixed trend. In 2008 it was 16.67%,in 2009 it was 17.67%,in 2010 it was 16.05%,in
years 2011 it was 15.67% , and in year 2012 it was 15.47%. Raymond ltd ratio shows the uptown
situation during year 2008 to 2012. In Bombay dyeing Mfg. Co. Ltd it was down in year 2009 and it
was down in year 2009 and it was -22.56% then in year 2010 it was raise to 7.3% and again in year
2011 it was down 5% and in year 2012 it was 6%. Biwani textile ltd it was mixed trend. It neither
more down or nor more increase during year 2008 to 2012 in Alok ltd it was
25.13%,24.42%,29.11%,27.56%and 24.67% respective years of 2008,2009,2010,2011,and 2012.
Among all the five companies the highest average was Alok ltd and it was 26.78 and in overall trend
it was highest in year 2009 and it was 19.24.
Table 2 ANOVA for PBDIT to Gross Sales
Source of
Variation
SS Df MS F P-value F crit
BSS 2257.356 4 564.3389 8.893416 0.00027 2.866081
WSS 1269.116 20 63.45581
TSS 3526.472 24
Above table indicates the calculate value of “F”. The calculated value of “F” is less than the table
value of 5% levels of significance which is 2.866. it indicates that the null hypothesis is accepted and
alternate hypothesis will rejected. It indicates that there is no significance difference in the PBDIT
ratio in the units undertaken for the study for the period of the study.
6.2 PAT to Gross Sales
Net profit is obtained when operating expenses, interest and taxes are subtracted from the gross profit.
The net profit margin ratio is measured by dividing profit after tax by sales. Net profit margin ratio
establishes a relationship between net profit and gross sales and indicates management’s efficiency in
manufacturing , administering and selling the selling the products. This Ratio is overall measure of
the firm’s ability to turn each rupee sales into net profit. If the net profit is inadequate, the firm will
fail to achive satisfactory return on shareholders’ funds.
6.2.1 Formula
Net profit margin = profit after tax (PAT)/gross sales * 100
International Journal of Research in all Subjects in Multi Languages
[Author: Manojkumar V. Patel] [Subject: Commerce/Account]
Vol. 5, Issue: 11, November: 2017
(IJRSML) ISSN: 2321 - 2853
21 Print, International, UGC Approved, Reviewed & Indexed Monthly Journal www.raijmr.com RET Academy for International Journals of Multidisciplinary Research (RAIJMR)
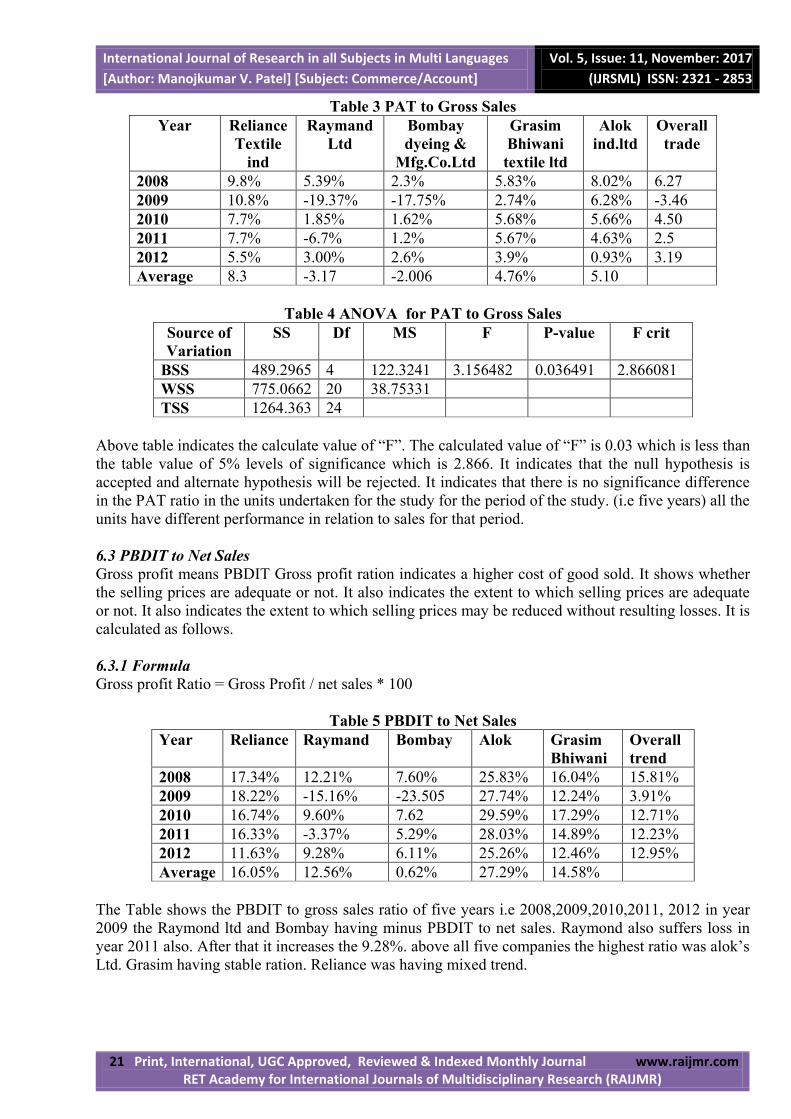
Table 3 PAT to Gross Sales
Year Reliance
Textile
ind
Raymand
Ltd
Bombay
dyeing &
Mfg.Co.Ltd
Grasim
Bhiwani
textile ltd
Alok
ind.ltd
Overall
trade
2008 9.8% 5.39% 2.3% 5.83% 8.02% 6.27
2009 10.8% -19.37% -17.75% 2.74% 6.28% -3.46
2010 7.7% 1.85% 1.62% 5.68% 5.66% 4.50
2011 7.7% -6.7% 1.2% 5.67% 4.63% 2.5
2012 5.5% 3.00% 2.6% 3.9% 0.93% 3.19
Average 8.3 -3.17 -2.006 4.76% 5.10
Table 4 ANOVA for PAT to Gross Sales
Source of
Variation
SS Df MS F P-value F crit
BSS 489.2965 4 122.3241 3.156482 0.036491 2.866081
WSS 775.0662 20 38.75331
TSS 1264.363 24
Above table indicates the calculate value of “F”. The calculated value of “F” is 0.03 which is less than
the table value of 5% levels of significance which is 2.866. It indicates that the null hypothesis is
accepted and alternate hypothesis will be rejected. It indicates that there is no significance difference
in the PAT ratio in the units undertaken for the study for the period of the study. (i.e five years) all the
units have different performance in relation to sales for that period.
6.3 PBDIT to Net Sales
Gross profit means PBDIT Gross profit ration indicates a higher cost of good sold. It shows whether
the selling prices are adequate or not. It also indicates the extent to which selling prices are adequate
or not. It also indicates the extent to which selling prices may be reduced without resulting losses. It is
calculated as follows.
6.3.1 Formula
Gross profit Ratio = Gross Profit / net sales * 100
Table 5 PBDIT to Net Sales
Year Reliance Raymand Bombay Alok Grasim
Bhiwani
Overall
trend
2008 17.34% 12.21% 7.60% 25.83% 16.04% 15.81%
2009 18.22% -15.16% -23.505 27.74% 12.24% 3.91%
2010 16.74% 9.60% 7.62 29.59% 17.29% 12.71%
2011 16.33% -3.37% 5.29% 28.03% 14.89% 12.23%
2012 11.63% 9.28% 6.11% 25.26% 12.46% 12.95%
Average 16.05% 12.56% 0.62% 27.29% 14.58%
The Table shows the PBDIT to gross sales ratio of five years i.e 2008,2009,2010,2011, 2012 in year
2009 the Raymond ltd and Bombay having minus PBDIT to net sales. Raymond also suffers loss in
year 2011 also. After that it increases the 9.28%. above all five companies the highest ratio was alok’s
Ltd. Grasim having stable ration. Reliance was having mixed trend.
International Journal of Research in all Subjects in Multi Languages
[Author: Manojkumar V. Patel] [Subject: Commerce/Account]
Vol. 5, Issue: 11, November: 2017
(IJRSML) ISSN: 2321 - 2853
22 Print, International, UGC Approved, Reviewed & Indexed Monthly Journal www.raijmr.com RET Academy for International Journals of Multidisciplinary Research (RAIJMR)
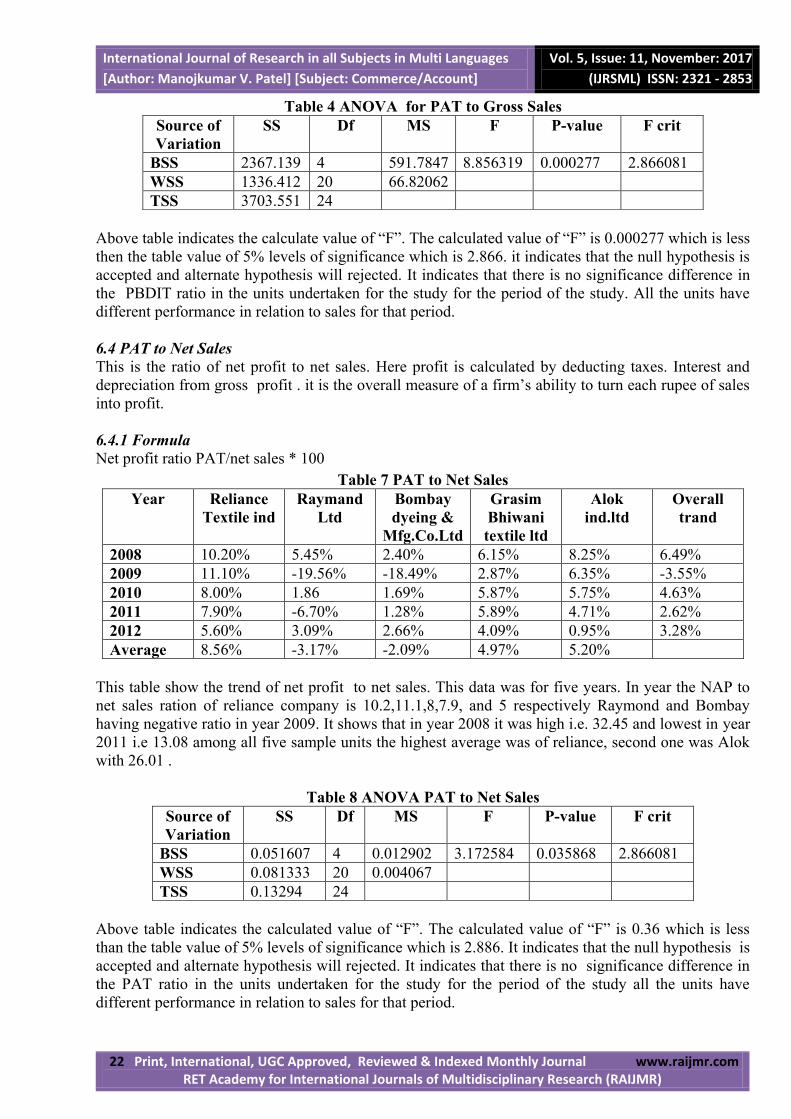
Table 4 ANOVA for PAT to Gross Sales
Source of
Variation
SS Df MS F P-value F crit
BSS 2367.139 4 591.7847 8.856319 0.000277 2.866081
WSS 1336.412 20 66.82062
TSS 3703.551 24
Above table indicates the calculate value of “F”. The calculated value of “F” is 0.000277 which is less
then the table value of 5% levels of significance which is 2.866. it indicates that the null hypothesis is
accepted and alternate hypothesis will rejected. It indicates that there is no significance difference in
the PBDIT ratio in the units undertaken for the study for the period of the study. All the units have
different performance in relation to sales for that period.
6.4 PAT to Net Sales
This is the ratio of net profit to net sales. Here profit is calculated by deducting taxes. Interest and
depreciation from gross profit . it is the overall measure of a firm’s ability to turn each rupee of sales
into profit.
6.4.1 Formula
Net profit ratio PAT/net sales * 100
Table 7 PAT to Net Sales
Year Reliance
Textile ind
Raymand
Ltd
Bombay
dyeing &
Mfg.Co.Ltd
Grasim
Bhiwani
textile ltd
Alok
ind.ltd
Overall
trand
2008 10.20% 5.45% 2.40% 6.15% 8.25% 6.49%
2009 11.10% -19.56% -18.49% 2.87% 6.35% -3.55%
2010 8.00% 1.86 1.69% 5.87% 5.75% 4.63%
2011 7.90% -6.70% 1.28% 5.89% 4.71% 2.62%
2012 5.60% 3.09% 2.66% 4.09% 0.95% 3.28%
Average 8.56% -3.17% -2.09% 4.97% 5.20%
This table show the trend of net profit to net sales. This data was for five years. In year the NAP to
net sales ration of reliance company is 10.2,11.1,8,7.9, and 5 respectively Raymond and Bombay
having negative ratio in year 2009. It shows that in year 2008 it was high i.e. 32.45 and lowest in year
2011 i.e 13.08 among all five sample units the highest average was of reliance, second one was Alok
with 26.01 .
Table 8 ANOVA PAT to Net Sales
Source of
Variation
SS Df MS F P-value F crit
BSS 0.051607 4 0.012902 3.172584 0.035868 2.866081
WSS 0.081333 20 0.004067
TSS 0.13294 24
Above table indicates the calculated value of “F”. The calculated value of “F” is 0.36 which is less
than the table value of 5% levels of significance which is 2.886. It indicates that the null hypothesis is
accepted and alternate hypothesis will rejected. It indicates that there is no significance difference in
the PAT ratio in the units undertaken for the study for the period of the study all the units have
different performance in relation to sales for that period.
International Journal of Research in all Subjects in Multi Languages
[Author: Manojkumar V. Patel] [Subject: Commerce/Account]
Vol. 5, Issue: 11, November: 2017
(IJRSML) ISSN: 2321 - 2853
23 Print, International, UGC Approved, Reviewed & Indexed Monthly Journal www.raijmr.com RET Academy for International Journals of Multidisciplinary Research (RAIJMR)
7. Findings
Indian Textile Industry is one of the leading textile industries in the world. Through was
predominantly unorganized industry even a few years back, but the seenario started changing after the
economic liberalization of Indian economy in 1991. The opening up of economy gave the much –
needed thrust to the Indian textile industry, which has now successfully become one of the largest in
the world.
India textile industry is one of the leading in the world. Currently it is estimated to be around US$ 52
billion and is also projected to be around US$ 115 billion by the year 2012. The current domestic
market of textile in India is expected to be increased to US$ 60 billion by 2012 from the current US$
34.6 billion. The textile export of the country was around US$ 19.14 billion in 2006-07, which saw a
stiff rise to reach US$ 22.13 in 2007-08. The share of exports is also expected to increase from 4% to
7% within 2012.
Profits are the soul of the business body without which the body becomes lifeless. Finance is the heart
of the business body and profit is the soul of the business body. Profits have now become a
measurement test to measure financial efficiency of the business firm. Generally profits are the net
surplus of revenue over the expenditure.
8. Suggestions
India contributes to about 25% share in the world trade of cotton yarn. India the world’s third largest
producer of cotton and second –largest producer of cotton yarns and textiles, is poised to play an
increasingly important role in global cotton and textile markets as a result of domestic and multilateral
policy reform.
Bombay and Raymond have to focus on the profitability and to improve the profitability both the
company have either increased the sales or reduces the cost. By maintaining the cost and increasing
the sales both the company can improve their profitability to satisfy their shareholder and stand in
good position in the market.
9. Limitations
Secondary data collected for the research study is collected from the annual reports, websites and
various published reports and as such finding will depend entirely on the accuracy of such data.
Financial statements are normally prepared on the concept of historical cost. They do not reflect value
in term of current cost. Thus, financial analysis on such financial statements or accounting would not
portray the effect of price level changing over the period.
10. Conclusion
The Textile industry in India traditionally, after agriculture, is the only industry that has generated
huge employment for both skilled and unskilled labor in textiles. The Textile industry continues to be
the second largest employment generating sector in India. It can be concluded that the textile industry
has wide scope in the international market. The industry’s has to focus on their parts and quality
design. Quality products with the advance technology which make it easy possibility to get better
international market.
References
1. Annual reports of research unit
2. Home Fashion India (2007). Vol.6, Issue.3,pp.19
3. IBEF,ICRA Management Consulting Services I Limited (2006). “Indian textile industry”
4. Overview of the textile industry in India (2007). The Indo-Italian Chamber of Commerce and
industry.
5. www.cci.in/pdfs/surveys-reports/Textile-industry-in-india.pdf

![BOMBAY DYEING · 2019-07-10 · ANNUAL THE BOMBAY DYEING AND REPORT 2018-19 MANUFACTURING COMPANY LIMITED [ Established 1879 ] The Bombay Dyeing and Manufacturing Company Limited](https://img.pdfslide.net/doc/110x75/5e9886331be0ee33cf78d74a/bombay-dyeing-2019-07-10-annual-the-bombay-dyeing-and-report-2018-19-manufacturing.jpg)