Embed Size (px)
Citation preview
HAL Id: hal-01578971https://hal.archives-ouvertes.fr/hal-01578971
Submitted on 30 Aug 2017
HAL is a multi-disciplinary open accessarchive for the deposit and dissemination of sci-entific research documents, whether they are pub-lished or not. The documents may come fromteaching and research institutions in France orabroad, or from public or private research centers.
L’archive ouverte pluridisciplinaire HAL, estdestinée au dépôt et à la diffusion de documentsscientifiques de niveau recherche, publiés ou non,émanant des établissements d’enseignement et derecherche français ou étrangers, des laboratoirespublics ou privés.
Comparative study of the cooling of a hot temperaturesurface using sprays and liquid jets
Alexandre Labergue, Michel Gradeck, Fabrice Lemoine
To cite this version:Alexandre Labergue, Michel Gradeck, Fabrice Lemoine. Comparative study of the cooling of a hottemperature surface using sprays and liquid jets. International Journal of Heat and Mass Transfer,Elsevier, 2014, �10.1016/j.ijheatmasstransfer.2014.11.018�. �hal-01578971�
International Journal of Heat and Mass Transfer 81 (2015) 889–900
Contents lists available at ScienceDirect
International Journal of Heat and Mass Transfer
journal homepage: www.elsevier .com/locate / i jhmt
Comparative study of the cooling of a hot temperature surface usingsprays and liquid jets
http://dx.doi.org/10.1016/j.ijheatmasstransfer.2014.11.0180017-9310/� 2014 Elsevier Ltd. All rights reserved.
⇑ Corresponding author at: Université de Lorraine, LEMTA, UMR 7563, Vandoeu-vre-lès-Nancy, France.
E-mail address: [email protected] (A. Labergue).
A. Labergue ⇑, M. Gradeck, F. LemoineUniversité de Lorraine, LEMTA, UMR 7563, Vandoeuvre-lès-Nancy, FranceCNRS, LEMTA, UMR 7563, Vandoeuvre-lès-Nancy, France
a r t i c l e i n f o
Article history:Received 28 August 2014Received in revised form 28 October 2014Accepted 4 November 2014Available online 22 November 2014
Keywords:Spray coolingSpray heat transferInfrared thermographyInverse conduction problemPhase Doppler analysis
a b s t r a c t
This experimental work aims at investigating the cooling of hot surfaces by using full cone sprays; com-parison with the use of a liquid jet is also considered. The wall is a 175 mm diameter nickel disk and5 mm thickness heated by electromagnetic induction up to about 800 �C. In the case of the sprays, thegoal is to link the spray properties with the heat flux removed from the heated surface. For the spray,the influence of the mass flux distribution as well as the droplets properties on the cooling are studiedby using three different spray nozzles. The mass flux distribution for each of the sprays is measured withthe help of a patternator. The heat removed during the cooling phase is investigated with the use ofinfrared thermography while the droplet properties are characterized simultaneously by a Phase Dopplersystem. The Phase Doppler technique is mainly applied to study the statistical properties of the outcom-ing droplets in the vicinity of the heated surface. A decrease of the outcoming droplets size compared tothe incoming one is well observed. Moreover, Phase Doppler device has also highlighted that the presenceof the surface may have a significant influence on the upstream spray flow. Compared to the liquid jet,heat flux measurements have clearly demonstrated that the sprays lead a more spatial uniformity ofthe extracted heat flux and a better cooling efficiency. When spray cooling is considered, the influenceof the mass flux on the heat flux and the cooling efficiency is in qualitative agreement with previousstudies performed in similar conditions. In addition, a comparative study of performances, in term ofliquid consumption and cooling duration, is performed by considering a similar surface temperaturedecrease for the three sprays and the liquid jet. Among the four experiments, the liquid jet has the longestcooling time as well as the highest liquid consumption. Furthermore, the best performances are reachedfor the spray having the highest mass flux value.
� 2014 Elsevier Ltd. All rights reserved.
1. Introduction
The use of water for cooling of hot surfaces in industry isunavoidable when high heat flux dissipation is required. Someemblematic examples are related to nuclear safety issues or tothe thermal processing of alloys in steel industry. Coolingprocesses include pool boiling, impingement of liquid jets orsprays. In steel industry, pool boiling and liquid jets are widelyused because they provide high dissipation rates but they havegenerally failed to ensure uniform cooling. Thus the homogeneityof the metallurgical phase can suffer from defaults.
The use of sprays seems attractive for several reasons: a betterspatial uniformity of the cooling can be achieved associated with
lower water consumption for the same efficiency in term of heattransfer. Furthermore, lower water consumption involves lessenergy requirements for pumping and recycling the cooling waterand thus an increase of the overall energy efficiency of the process.The experimental studies devoted to water spray cooling cover awide range of cooling conditions. For practical reasons, the caseof deposited droplets [1,2] single or multiple droplets was widelystudied and well documented [3–10]. When sprays were used,several configurations where found, such as mono-sized sprays(impulse-jet technique to produce uniform size droplets) [11–15]or sprays polydispersed in size [16–26]. Furthermore, severalcategories of nozzles are available to generate various sprays withdifferent geometries and liquid densities, droplet size and velocitydistributions: full cone, hollow cone, flat fan or air-mist nozzles.However, only few authors have performed quantitativecomparisons between the different spraying nozzles [4,21,26].
Nomenclature
We We number (–)cp specific capacity (J/kg K)d droplet diameter (m)h enthalpy (J/kg)_m liquid mass flux (kg/m2 s)_M flow rate (l/mn)
q00 heat flux (W/m2)u, v, w droplet velocity component (m/s)p liquid pressure (bar)r disk radius (m)T temperature (K)
Greek symbolsa thermal diffusivity (m2/s)b spray angle (�)e emissivity (–)k laser wavelength (m)
q mass density (kg/m3)l dynamic viscosity (Pa s)r surface tension (kg/m2)n cooling efficiency (–)
Subscriptsb laser beamd dropletl property of liquid phaseLeid temperature at which minimum film boiling heat flux
occurss spraysat liquid saturation propertiessub surface subcoolingv property of vapor phasew conditions at front disk wall
0 50 100 150 200 250 300
10
100
1000
10000
100000
Previous studies of the litterature
Web
er n
umbe
r
Mass flux (kg/m²/s)
Operating conditions for the present study
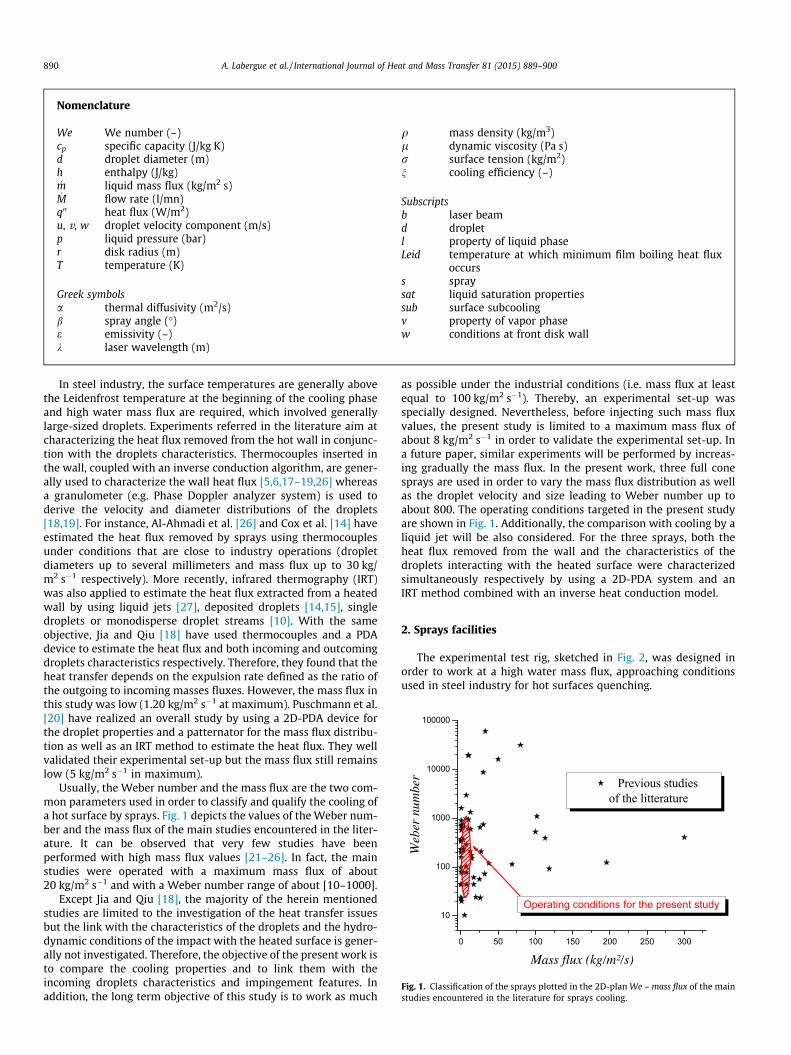
Fig. 1. Classification of the sprays plotted in the 2D-plan We – mass flux of the mainstudies encountered in the literature for sprays cooling.
890 A. Labergue et al. / International Journal of Heat and Mass Transfer 81 (2015) 889–900
In steel industry, the surface temperatures are generally abovethe Leidenfrost temperature at the beginning of the cooling phaseand high water mass flux are required, which involved generallylarge-sized droplets. Experiments referred in the literature aim atcharacterizing the heat flux removed from the hot wall in conjunc-tion with the droplets characteristics. Thermocouples inserted inthe wall, coupled with an inverse conduction algorithm, are gener-ally used to characterize the wall heat flux [5,6,17–19,26] whereasa granulometer (e.g. Phase Doppler analyzer system) is used toderive the velocity and diameter distributions of the droplets[18,19]. For instance, Al-Ahmadi et al. [26] and Cox et al. [14] haveestimated the heat flux removed by sprays using thermocouplesunder conditions that are close to industry operations (dropletdiameters up to several millimeters and mass flux up to 30 kg/m2 s�1 respectively). More recently, infrared thermography (IRT)was also applied to estimate the heat flux extracted from a heatedwall by using liquid jets [27], deposited droplets [14,15], singledroplets or monodisperse droplet streams [10]. With the sameobjective, Jia and Qiu [18] have used thermocouples and a PDAdevice to estimate the heat flux and both incoming and outcomingdroplets characteristics respectively. Therefore, they found that theheat transfer depends on the expulsion rate defined as the ratio ofthe outgoing to incoming masses fluxes. However, the mass flux inthis study was low (1.20 kg/m2 s�1 at maximum). Puschmann et al.[20] have realized an overall study by using a 2D-PDA device forthe droplet properties and a patternator for the mass flux distribu-tion as well as an IRT method to estimate the heat flux. They wellvalidated their experimental set-up but the mass flux still remainslow (5 kg/m2 s�1 in maximum).
Usually, the Weber number and the mass flux are the two com-mon parameters used in order to classify and qualify the cooling ofa hot surface by sprays. Fig. 1 depicts the values of the Weber num-ber and the mass flux of the main studies encountered in the liter-ature. It can be observed that very few studies have beenperformed with high mass flux values [21–26]. In fact, the mainstudies were operated with a maximum mass flux of about20 kg/m2 s�1 and with a Weber number range of about [10–1000].
Except Jia and Qiu [18], the majority of the herein mentionedstudies are limited to the investigation of the heat transfer issuesbut the link with the characteristics of the droplets and the hydro-dynamic conditions of the impact with the heated surface is gener-ally not investigated. Therefore, the objective of the present work isto compare the cooling properties and to link them with theincoming droplets characteristics and impingement features. Inaddition, the long term objective of this study is to work as much
as possible under the industrial conditions (i.e. mass flux at leastequal to 100 kg/m2 s�1). Thereby, an experimental set-up wasspecially designed. Nevertheless, before injecting such mass fluxvalues, the present study is limited to a maximum mass flux ofabout 8 kg/m2 s�1 in order to validate the experimental set-up. Ina future paper, similar experiments will be performed by increas-ing gradually the mass flux. In the present work, three full conesprays are used in order to vary the mass flux distribution as wellas the droplet velocity and size leading to Weber number up toabout 800. The operating conditions targeted in the present studyare shown in Fig. 1. Additionally, the comparison with cooling by aliquid jet will be also considered. For the three sprays, both theheat flux removed from the wall and the characteristics of thedroplets interacting with the heated surface were characterizedsimultaneously respectively by using a 2D-PDA system and anIRT method combined with an inverse heat conduction model.
2. Sprays facilities
The experimental test rig, sketched in Fig. 2, was designed inorder to work at a high water mass flux, approaching conditionsused in steel industry for hot surfaces quenching.
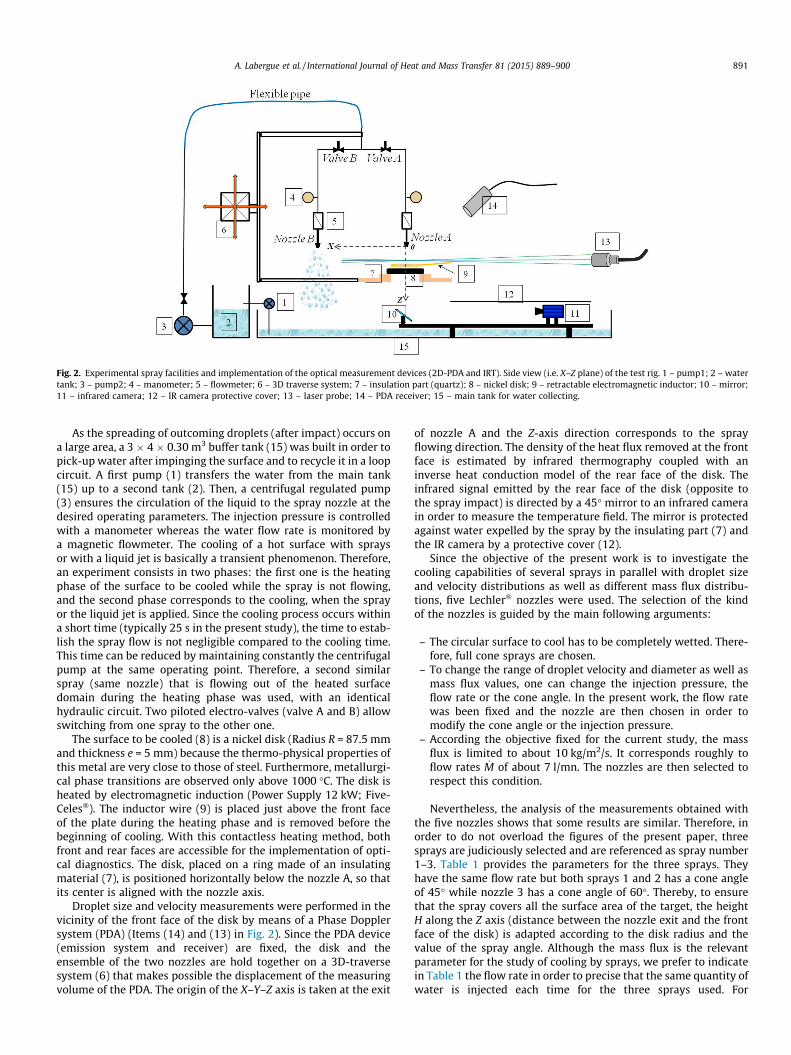
Fig. 2. Experimental spray facilities and implementation of the optical measurement devices (2D-PDA and IRT). Side view (i.e. X–Z plane) of the test rig. 1 – pump1; 2 – watertank; 3 – pump2; 4 – manometer; 5 – flowmeter; 6 – 3D traverse system; 7 – insulation part (quartz); 8 – nickel disk; 9 – retractable electromagnetic inductor; 10 – mirror;11 – infrared camera; 12 – IR camera protective cover; 13 – laser probe; 14 – PDA receiver; 15 – main tank for water collecting.
A. Labergue et al. / International Journal of Heat and Mass Transfer 81 (2015) 889–900 891
As the spreading of outcoming droplets (after impact) occurs ona large area, a 3 � 4 � 0.30 m3 buffer tank (15) was built in order topick-up water after impinging the surface and to recycle it in a loopcircuit. A first pump (1) transfers the water from the main tank(15) up to a second tank (2). Then, a centrifugal regulated pump(3) ensures the circulation of the liquid to the spray nozzle at thedesired operating parameters. The injection pressure is controlledwith a manometer whereas the water flow rate is monitored bya magnetic flowmeter. The cooling of a hot surface with spraysor with a liquid jet is basically a transient phenomenon. Therefore,an experiment consists in two phases: the first one is the heatingphase of the surface to be cooled while the spray is not flowing,and the second phase corresponds to the cooling, when the sprayor the liquid jet is applied. Since the cooling process occurs withina short time (typically 25 s in the present study), the time to estab-lish the spray flow is not negligible compared to the cooling time.This time can be reduced by maintaining constantly the centrifugalpump at the same operating point. Therefore, a second similarspray (same nozzle) that is flowing out of the heated surfacedomain during the heating phase was used, with an identicalhydraulic circuit. Two piloted electro-valves (valve A and B) allowswitching from one spray to the other one.
The surface to be cooled (8) is a nickel disk (Radius R = 87.5 mmand thickness e = 5 mm) because the thermo-physical properties ofthis metal are very close to those of steel. Furthermore, metallurgi-cal phase transitions are observed only above 1000 �C. The disk isheated by electromagnetic induction (Power Supply 12 kW; Five-Celes�). The inductor wire (9) is placed just above the front faceof the plate during the heating phase and is removed before thebeginning of cooling. With this contactless heating method, bothfront and rear faces are accessible for the implementation of opti-cal diagnostics. The disk, placed on a ring made of an insulatingmaterial (7), is positioned horizontally below the nozzle A, so thatits center is aligned with the nozzle axis.
Droplet size and velocity measurements were performed in thevicinity of the front face of the disk by means of a Phase Dopplersystem (PDA) (Items (14) and (13) in Fig. 2). Since the PDA device(emission system and receiver) are fixed, the disk and theensemble of the two nozzles are hold together on a 3D-traversesystem (6) that makes possible the displacement of the measuringvolume of the PDA. The origin of the X–Y–Z axis is taken at the exit
of nozzle A and the Z-axis direction corresponds to the sprayflowing direction. The density of the heat flux removed at the frontface is estimated by infrared thermography coupled with aninverse heat conduction model of the rear face of the disk. Theinfrared signal emitted by the rear face of the disk (opposite tothe spray impact) is directed by a 45� mirror to an infrared camerain order to measure the temperature field. The mirror is protectedagainst water expelled by the spray by the insulating part (7) andthe IR camera by a protective cover (12).
Since the objective of the present work is to investigate thecooling capabilities of several sprays in parallel with droplet sizeand velocity distributions as well as different mass flux distribu-tions, five Lechler� nozzles were used. The selection of the kindof the nozzles is guided by the main following arguments:
– The circular surface to cool has to be completely wetted. There-fore, full cone sprays are chosen.
– To change the range of droplet velocity and diameter as well asmass flux values, one can change the injection pressure, theflow rate or the cone angle. In the present work, the flow ratewas been fixed and the nozzle are then chosen in order tomodify the cone angle or the injection pressure.
– According the objective fixed for the current study, the massflux is limited to about 10 kg/m2/s. It corresponds roughly toflow rates _M of about 7 l/mn. The nozzles are then selected torespect this condition.
Nevertheless, the analysis of the measurements obtained withthe five nozzles shows that some results are similar. Therefore, inorder to do not overload the figures of the present paper, threesprays are judiciously selected and are referenced as spray number1–3. Table 1 provides the parameters for the three sprays. Theyhave the same flow rate but both sprays 1 and 2 has a cone angleof 45� while nozzle 3 has a cone angle of 60�. Thereby, to ensurethat the spray covers all the surface area of the target, the heightH along the Z axis (distance between the nozzle exit and the frontface of the disk) is adapted according to the disk radius and thevalue of the spray angle. Although the mass flux is the relevantparameter for the study of cooling by sprays, we prefer to indicatein Table 1 the flow rate in order to precise that the same quantity ofwater is injected each time for the three sprays used. For
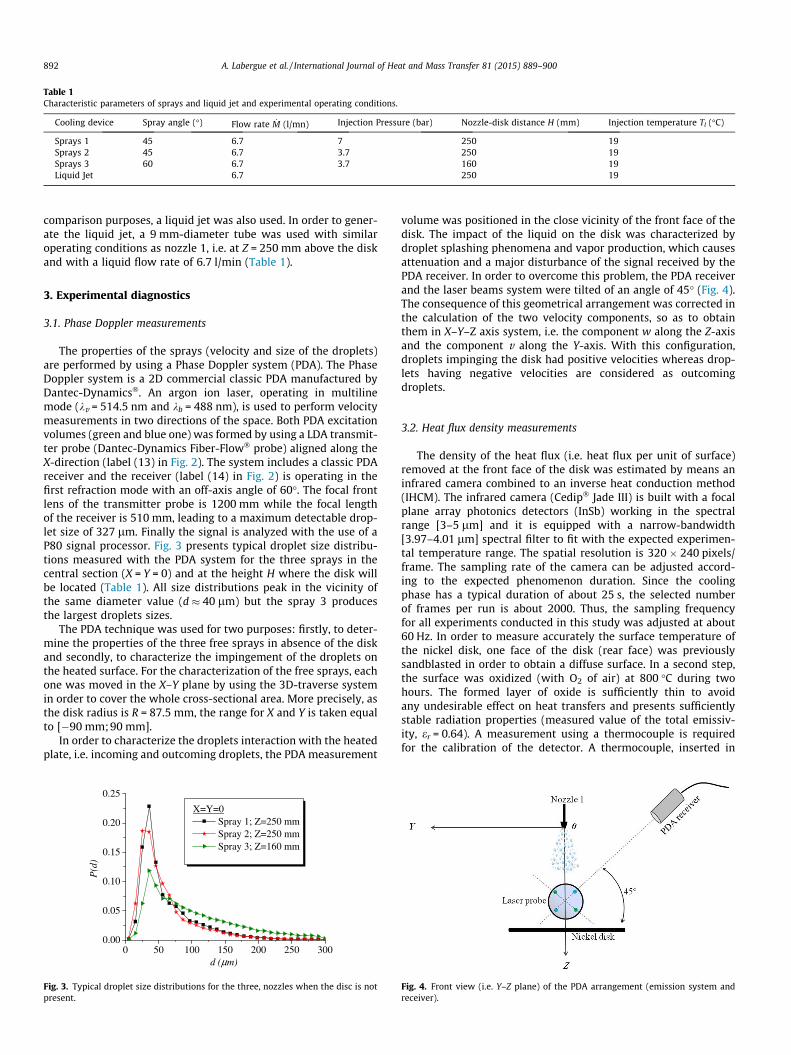
Table 1Characteristic parameters of sprays and liquid jet and experimental operating conditions.
Cooling device Spray angle (�) Flow rate _M (l/mn) Injection Pressure (bar) Nozzle-disk distance H (mm) Injection temperature Tl (�C)
Sprays 1 45 6.7 7 250 19Sprays 2 45 6.7 3.7 250 19Sprays 3 60 6.7 3.7 160 19Liquid Jet 6.7 250 19
892 A. Labergue et al. / International Journal of Heat and Mass Transfer 81 (2015) 889–900
comparison purposes, a liquid jet was also used. In order to gener-ate the liquid jet, a 9 mm-diameter tube was used with similaroperating conditions as nozzle 1, i.e. at Z = 250 mm above the diskand with a liquid flow rate of 6.7 l/min (Table 1).
3. Experimental diagnostics
3.1. Phase Doppler measurements
The properties of the sprays (velocity and size of the droplets)are performed by using a Phase Doppler system (PDA). The PhaseDoppler system is a 2D commercial classic PDA manufactured byDantec-Dynamics�. An argon ion laser, operating in multilinemode (kv = 514.5 nm and kb = 488 nm), is used to perform velocitymeasurements in two directions of the space. Both PDA excitationvolumes (green and blue one) was formed by using a LDA transmit-ter probe (Dantec-Dynamics Fiber-Flow� probe) aligned along theX-direction (label (13) in Fig. 2). The system includes a classic PDAreceiver and the receiver (label (14) in Fig. 2) is operating in thefirst refraction mode with an off-axis angle of 60�. The focal frontlens of the transmitter probe is 1200 mm while the focal lengthof the receiver is 510 mm, leading to a maximum detectable drop-let size of 327 lm. Finally the signal is analyzed with the use of aP80 signal processor. Fig. 3 presents typical droplet size distribu-tions measured with the PDA system for the three sprays in thecentral section (X = Y = 0) and at the height H where the disk willbe located (Table 1). All size distributions peak in the vicinity ofthe same diameter value (d � 40 lm) but the spray 3 producesthe largest droplets sizes.
The PDA technique was used for two purposes: firstly, to deter-mine the properties of the three free sprays in absence of the diskand secondly, to characterize the impingement of the droplets onthe heated surface. For the characterization of the free sprays, eachone was moved in the X–Y plane by using the 3D-traverse systemin order to cover the whole cross-sectional area. More precisely, asthe disk radius is R = 87.5 mm, the range for X and Y is taken equalto [�90 mm;90 mm].
In order to characterize the droplets interaction with the heatedplate, i.e. incoming and outcoming droplets, the PDA measurement
0 50 100 150 200 250 3000.00
0.05
0.10
0.15
0.20
0.25
P(d
)
d (μm)
X=Y=0 Spray 1; Z=250 mm Spray 2; Z=250 mm Spray 3; Z=160 mm
Fig. 3. Typical droplet size distributions for the three, nozzles when the disc is notpresent.
volume was positioned in the close vicinity of the front face of thedisk. The impact of the liquid on the disk was characterized bydroplet splashing phenomena and vapor production, which causesattenuation and a major disturbance of the signal received by thePDA receiver. In order to overcome this problem, the PDA receiverand the laser beams system were tilted of an angle of 45� (Fig. 4).The consequence of this geometrical arrangement was corrected inthe calculation of the two velocity components, so as to obtainthem in X–Y–Z axis system, i.e. the component w along the Z-axisand the component v along the Y-axis. With this configuration,droplets impinging the disk had positive velocities whereas drop-lets having negative velocities are considered as outcomingdroplets.
3.2. Heat flux density measurements
The density of the heat flux (i.e. heat flux per unit of surface)removed at the front face of the disk was estimated by means aninfrared camera combined to an inverse heat conduction method(IHCM). The infrared camera (Cedip� Jade III) is built with a focalplane array photonics detectors (InSb) working in the spectralrange [3–5 lm] and it is equipped with a narrow-bandwidth[3.97–4.01 lm] spectral filter to fit with the expected experimen-tal temperature range. The spatial resolution is 320 � 240 pixels/frame. The sampling rate of the camera can be adjusted accord-ing to the expected phenomenon duration. Since the coolingphase has a typical duration of about 25 s, the selected numberof frames per run is about 2000. Thus, the sampling frequencyfor all experiments conducted in this study was adjusted at about60 Hz. In order to measure accurately the surface temperature ofthe nickel disk, one face of the disk (rear face) was previouslysandblasted in order to obtain a diffuse surface. In a second step,the surface was oxidized (with O2 of air) at 800 �C during twohours. The formed layer of oxide is sufficiently thin to avoidany undesirable effect on heat transfers and presents sufficientlystable radiation properties (measured value of the total emissiv-ity, er = 0.64). A measurement using a thermocouple is requiredfor the calibration of the detector. A thermocouple, inserted in
Fig. 4. Front view (i.e. Y–Z plane) of the PDA arrangement (emission system andreceiver).
A. Labergue et al. / International Journal of Heat and Mass Transfer 81 (2015) 889–900 893
the centerline of the rear face of the disk, was used to provide areference temperature: this measurement is required to calibratethe whole measurement chain, i.e. to account for the mirrortransmission and of the environment. The calibration isperformed by heating the disk up to 800 �C and by recordingsimultaneously the infrared signal and the temperature measuredby the thermocouple, while the disk is cooled naturally (radia-tive, convective heat transfer and residual conduction throughthe insulating parts).
Knowing the temperature field at the rear face (Z = H + e), aninverse heat conduction model is used to estimate the heat fluxdensity removed by the sprays or the liquid jet on the front face(Z = H). The 3D internal conduction problem can be reduced to a2D one by applying angular averaging, in order to obtain an esti-mate of the averaged value of the heat flux density q00spray(r,Z, t).Then, the 2D internal transient conduction reduced problemwithin the nickel circular disk is solved assuming the followinghypothesis: constant nickel thermophysical properties, no conduc-tion losses due to the disk holder (item (7) in Fig. 2) and no lossesat the edge of the disk. A full description of the IHCM is available inprevious papers [27–30]. Due to the presence of the insulation part,the disk area that is visualized by the camera is truncated. Thus,following heat flux results are presented for an area having a max-imum radius of 70 mm.
3.3. Measurements of the mass flux distributions
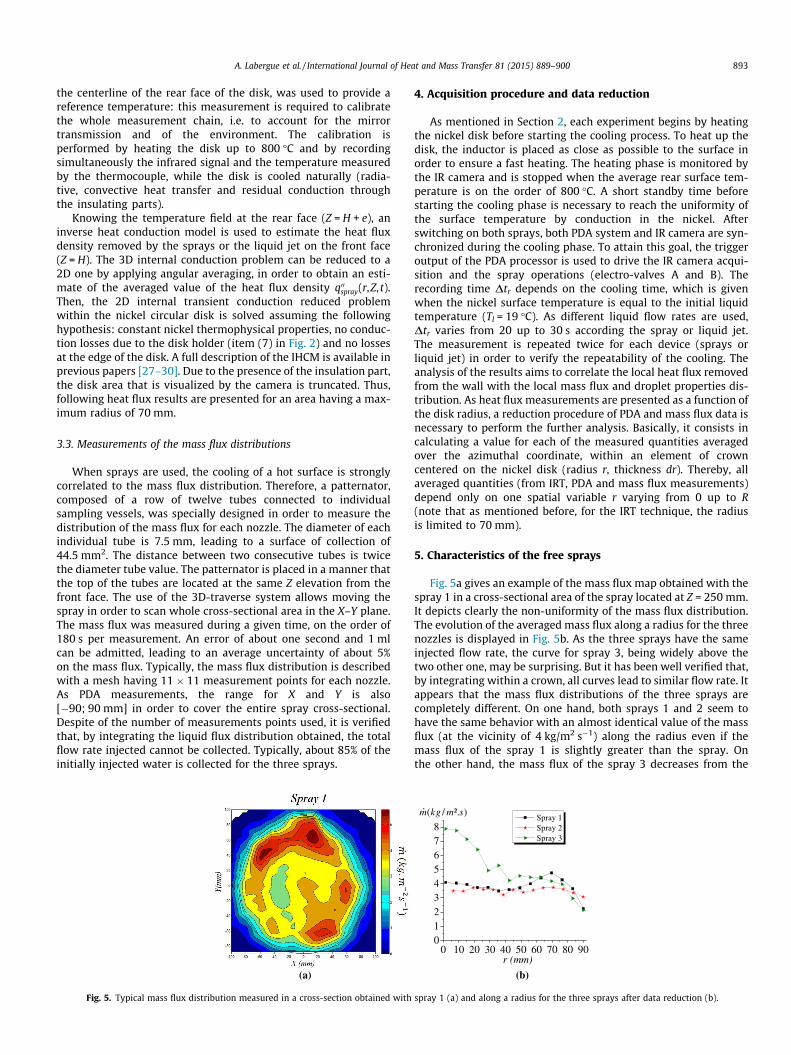
When sprays are used, the cooling of a hot surface is stronglycorrelated to the mass flux distribution. Therefore, a patternator,composed of a row of twelve tubes connected to individualsampling vessels, was specially designed in order to measure thedistribution of the mass flux for each nozzle. The diameter of eachindividual tube is 7.5 mm, leading to a surface of collection of44.5 mm2. The distance between two consecutive tubes is twicethe diameter tube value. The patternator is placed in a manner thatthe top of the tubes are located at the same Z elevation from thefront face. The use of the 3D-traverse system allows moving thespray in order to scan whole cross-sectional area in the X–Y plane.The mass flux was measured during a given time, on the order of180 s per measurement. An error of about one second and 1 mlcan be admitted, leading to an average uncertainty of about 5%on the mass flux. Typically, the mass flux distribution is describedwith a mesh having 11 � 11 measurement points for each nozzle.As PDA measurements, the range for X and Y is also[�90; 90 mm] in order to cover the entire spray cross-sectional.Despite of the number of measurements points used, it is verifiedthat, by integrating the liquid flux distribution obtained, the totalflow rate injected cannot be collected. Typically, about 85% of theinitially injected water is collected for the three sprays.
(a)
Fig. 5. Typical mass flux distribution measured in a cross-section obtained with
4. Acquisition procedure and data reduction
As mentioned in Section 2, each experiment begins by heatingthe nickel disk before starting the cooling process. To heat up thedisk, the inductor is placed as close as possible to the surface inorder to ensure a fast heating. The heating phase is monitored bythe IR camera and is stopped when the average rear surface tem-perature is on the order of 800 �C. A short standby time beforestarting the cooling phase is necessary to reach the uniformity ofthe surface temperature by conduction in the nickel. Afterswitching on both sprays, both PDA system and IR camera are syn-chronized during the cooling phase. To attain this goal, the triggeroutput of the PDA processor is used to drive the IR camera acqui-sition and the spray operations (electro-valves A and B). Therecording time Dtr depends on the cooling time, which is givenwhen the nickel surface temperature is equal to the initial liquidtemperature (Tl = 19 �C). As different liquid flow rates are used,Dtr varies from 20 up to 30 s according the spray or liquid jet.The measurement is repeated twice for each device (sprays orliquid jet) in order to verify the repeatability of the cooling. Theanalysis of the results aims to correlate the local heat flux removedfrom the wall with the local mass flux and droplet properties dis-tribution. As heat flux measurements are presented as a function ofthe disk radius, a reduction procedure of PDA and mass flux data isnecessary to perform the further analysis. Basically, it consists incalculating a value for each of the measured quantities averagedover the azimuthal coordinate, within an element of crowncentered on the nickel disk (radius r, thickness dr). Thereby, allaveraged quantities (from IRT, PDA and mass flux measurements)depend only on one spatial variable r varying from 0 up to R(note that as mentioned before, for the IRT technique, the radiusis limited to 70 mm).
5. Characteristics of the free sprays
Fig. 5a gives an example of the mass flux map obtained with thespray 1 in a cross-sectional area of the spray located at Z = 250 mm.It depicts clearly the non-uniformity of the mass flux distribution.The evolution of the averaged mass flux along a radius for the threenozzles is displayed in Fig. 5b. As the three sprays have the sameinjected flow rate, the curve for spray 3, being widely above thetwo other one, may be surprising. But it has been well verified that,by integrating within a crown, all curves lead to similar flow rate. Itappears that the mass flux distributions of the three sprays arecompletely different. On one hand, both sprays 1 and 2 seem tohave the same behavior with an almost identical value of the massflux (at the vicinity of 4 kg/m2 s�1) along the radius even if themass flux of the spray 1 is slightly greater than the spray. Onthe other hand, the mass flux of the spray 3 decreases from the
(b)
0 10 20 30 40 50 60 70 80 90012345678
r (mm)
Spray 1 Spray 2 Spray 3
)²./( smkgm
spray 1 (a) and along a radius for the three sprays after data reduction (b).
(b)(a)
(d)(c)
0 10 20 30 40 50 60 70 80 908
10
12
14
16
18
20
w(m
/s)
r (mm)
Spray 1 Spray 2 Spray 3
0 10 20 30 40 50 60 70 80 90-0.5
0.0
0.5
1.0
1.5
2.0
2.5
3.0
r (mm)
Spray 1 Spray 2 Spray 3
v (m
/s)
0 10 20 30 40 50 60 70 80 90100
120
140
160
180
200
r (mm)
Spray 1 Spray 2 Spray 3
d 32(μ
m)
0 20 40 60 80 1000
100
200
300
400 Spray 1 Spray 3 Spray 2
r (mm)
We
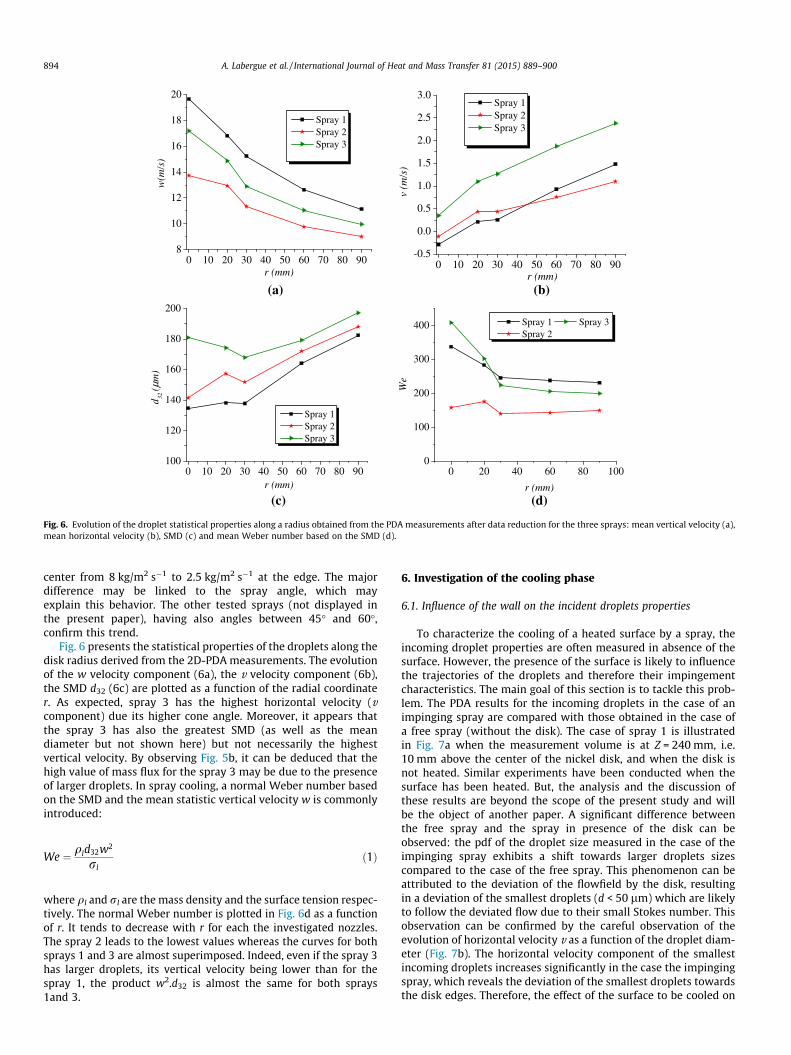
Fig. 6. Evolution of the droplet statistical properties along a radius obtained from the PDA measurements after data reduction for the three sprays: mean vertical velocity (a),mean horizontal velocity (b), SMD (c) and mean Weber number based on the SMD (d).
894 A. Labergue et al. / International Journal of Heat and Mass Transfer 81 (2015) 889–900
center from 8 kg/m2 s�1 to 2.5 kg/m2 s�1 at the edge. The majordifference may be linked to the spray angle, which mayexplain this behavior. The other tested sprays (not displayed inthe present paper), having also angles between 45� and 60�,confirm this trend.
Fig. 6 presents the statistical properties of the droplets along thedisk radius derived from the 2D-PDA measurements. The evolutionof the w velocity component (6a), the v velocity component (6b),the SMD d32 (6c) are plotted as a function of the radial coordinater. As expected, spray 3 has the highest horizontal velocity (vcomponent) due its higher cone angle. Moreover, it appears thatthe spray 3 has also the greatest SMD (as well as the meandiameter but not shown here) but not necessarily the highestvertical velocity. By observing Fig. 5b, it can be deduced that thehigh value of mass flux for the spray 3 may be due to the presenceof larger droplets. In spray cooling, a normal Weber number basedon the SMD and the mean statistic vertical velocity w is commonlyintroduced:
We ¼ qld32w2
rlð1Þ
where ql and rl are the mass density and the surface tension respec-tively. The normal Weber number is plotted in Fig. 6d as a functionof r. It tends to decrease with r for each the investigated nozzles.The spray 2 leads to the lowest values whereas the curves for bothsprays 1 and 3 are almost superimposed. Indeed, even if the spray 3has larger droplets, its vertical velocity being lower than for thespray 1, the product w2.d32 is almost the same for both sprays1and 3.
6. Investigation of the cooling phase
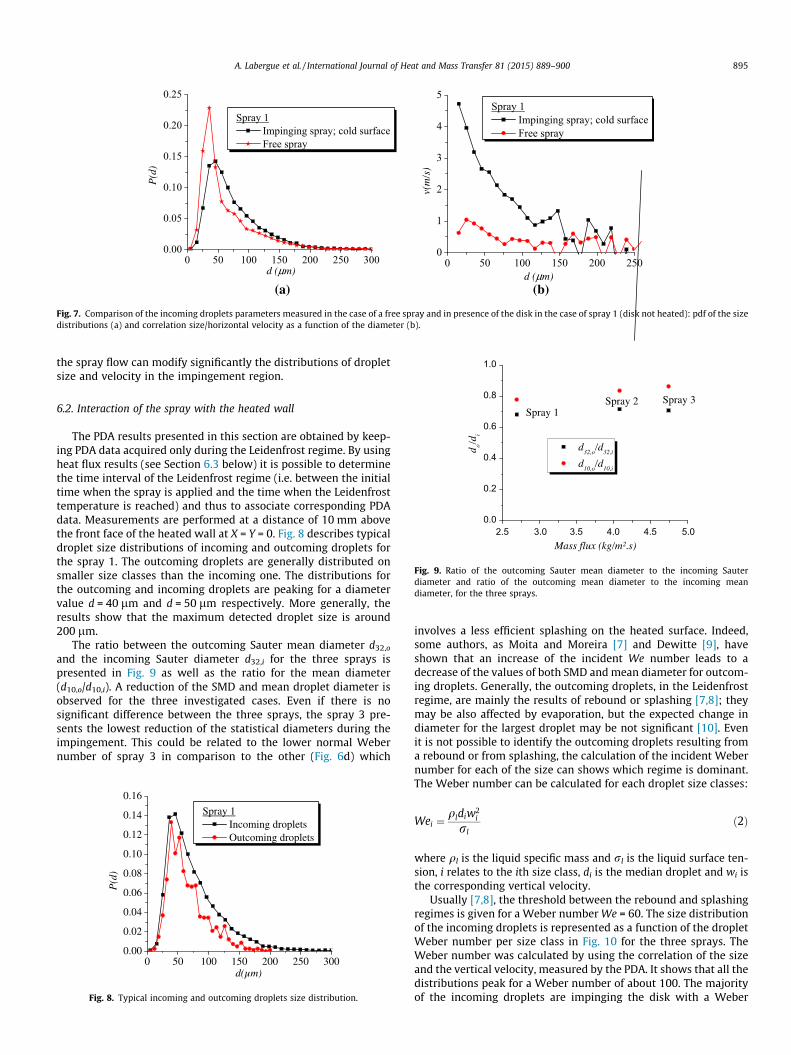
6.1. Influence of the wall on the incident droplets properties
To characterize the cooling of a heated surface by a spray, theincoming droplet properties are often measured in absence of thesurface. However, the presence of the surface is likely to influencethe trajectories of the droplets and therefore their impingementcharacteristics. The main goal of this section is to tackle this prob-lem. The PDA results for the incoming droplets in the case of animpinging spray are compared with those obtained in the case ofa free spray (without the disk). The case of spray 1 is illustratedin Fig. 7a when the measurement volume is at Z = 240 mm, i.e.10 mm above the center of the nickel disk, and when the disk isnot heated. Similar experiments have been conducted when thesurface has been heated. But, the analysis and the discussion ofthese results are beyond the scope of the present study and willbe the object of another paper. A significant difference betweenthe free spray and the spray in presence of the disk can beobserved: the pdf of the droplet size measured in the case of theimpinging spray exhibits a shift towards larger droplets sizescompared to the case of the free spray. This phenomenon can beattributed to the deviation of the flowfield by the disk, resultingin a deviation of the smallest droplets (d < 50 lm) which are likelyto follow the deviated flow due to their small Stokes number. Thisobservation can be confirmed by the careful observation of theevolution of horizontal velocity v as a function of the droplet diam-eter (Fig. 7b). The horizontal velocity component of the smallestincoming droplets increases significantly in the case the impingingspray, which reveals the deviation of the smallest droplets towardsthe disk edges. Therefore, the effect of the surface to be cooled on
(b)(a)
0 50 100 150 200 250 3000.00
0.05
0.10
0.15
0.20
0.25
P(d
)
d (μm)
Spray 1 Impinging spray; cold surface Free spray
0 50 100 150 200 2500
1
2
3
4
5Spray 1
Impinging spray; cold surface Free spray
d (μm)
v(m
/s)
Fig. 7. Comparison of the incoming droplets parameters measured in the case of a free spray and in presence of the disk in the case of spray 1 (disk not heated): pdf of the sizedistributions (a) and correlation size/horizontal velocity as a function of the diameter (b).
2.5 3.0 3.5 4.0 4.5 5.00.0
0.2
0.4
0.6
0.8
1.0
Spray 2 Spray 3
d o/di
d32,o
/d32,i
d10,o
/d10,i
Mass flux (kg/m².s)
Spray 1
Fig. 9. Ratio of the outcoming Sauter mean diameter to the incoming Sauterdiameter and ratio of the outcoming mean diameter to the incoming meandiameter, for the three sprays.
A. Labergue et al. / International Journal of Heat and Mass Transfer 81 (2015) 889–900 895
the spray flow can modify significantly the distributions of dropletsize and velocity in the impingement region.
6.2. Interaction of the spray with the heated wall
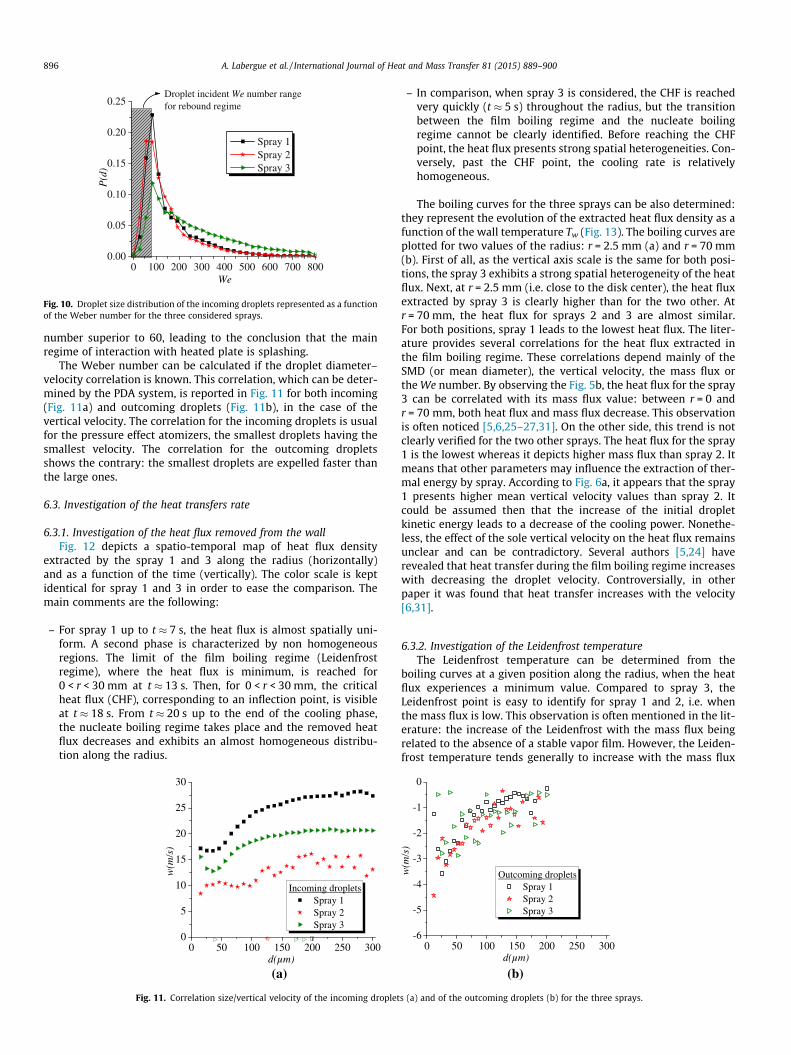
The PDA results presented in this section are obtained by keep-ing PDA data acquired only during the Leidenfrost regime. By usingheat flux results (see Section 6.3 below) it is possible to determinethe time interval of the Leidenfrost regime (i.e. between the initialtime when the spray is applied and the time when the Leidenfrosttemperature is reached) and thus to associate corresponding PDAdata. Measurements are performed at a distance of 10 mm abovethe front face of the heated wall at X = Y = 0. Fig. 8 describes typicaldroplet size distributions of incoming and outcoming droplets forthe spray 1. The outcoming droplets are generally distributed onsmaller size classes than the incoming one. The distributions forthe outcoming and incoming droplets are peaking for a diametervalue d = 40 lm and d = 50 lm respectively. More generally, theresults show that the maximum detected droplet size is around200 lm.
The ratio between the outcoming Sauter mean diameter d32,o
and the incoming Sauter diameter d32,i for the three sprays ispresented in Fig. 9 as well as the ratio for the mean diameter(d10,o/d10,i). A reduction of the SMD and mean droplet diameter isobserved for the three investigated cases. Even if there is nosignificant difference between the three sprays, the spray 3 pre-sents the lowest reduction of the statistical diameters during theimpingement. This could be related to the lower normal Webernumber of spray 3 in comparison to the other (Fig. 6d) which
0 50 100 150 200 250 3000.00
0.02
0.04
0.06
0.08
0.10
0.12
0.14
0.16
P(d
)
d(µm)
Spray 1 Incoming droplets Outcoming droplets
Fig. 8. Typical incoming and outcoming droplets size distribution.
involves a less efficient splashing on the heated surface. Indeed,some authors, as Moita and Moreira [7] and Dewitte [9], haveshown that an increase of the incident We number leads to adecrease of the values of both SMD and mean diameter for outcom-ing droplets. Generally, the outcoming droplets, in the Leidenfrostregime, are mainly the results of rebound or splashing [7,8]; theymay be also affected by evaporation, but the expected change indiameter for the largest droplet may be not significant [10]. Evenit is not possible to identify the outcoming droplets resulting froma rebound or from splashing, the calculation of the incident Webernumber for each of the size can shows which regime is dominant.The Weber number can be calculated for each droplet size classes:
Wei ¼qldiw2
i
rlð2Þ
where ql is the liquid specific mass and rl is the liquid surface ten-sion, i relates to the ith size class, di is the median droplet and wi isthe corresponding vertical velocity.
Usually [7,8], the threshold between the rebound and splashingregimes is given for a Weber number We = 60. The size distributionof the incoming droplets is represented as a function of the dropletWeber number per size class in Fig. 10 for the three sprays. TheWeber number was calculated by using the correlation of the sizeand the vertical velocity, measured by the PDA. It shows that all thedistributions peak for a Weber number of about 100. The majorityof the incoming droplets are impinging the disk with a Weber
0 100 200 300 400 500 600 700 8000.00
0.05
0.10
0.15
0.20
0.25P
(d)
We
Spray 1 Spray 2 Spray 3
Droplet incident We number range for rebound regime
Fig. 10. Droplet size distribution of the incoming droplets represented as a functionof the Weber number for the three considered sprays.
896 A. Labergue et al. / International Journal of Heat and Mass Transfer 81 (2015) 889–900
number superior to 60, leading to the conclusion that the mainregime of interaction with heated plate is splashing.
The Weber number can be calculated if the droplet diameter–velocity correlation is known. This correlation, which can be deter-mined by the PDA system, is reported in Fig. 11 for both incoming(Fig. 11a) and outcoming droplets (Fig. 11b), in the case of thevertical velocity. The correlation for the incoming droplets is usualfor the pressure effect atomizers, the smallest droplets having thesmallest velocity. The correlation for the outcoming dropletsshows the contrary: the smallest droplets are expelled faster thanthe large ones.
6.3. Investigation of the heat transfers rate
6.3.1. Investigation of the heat flux removed from the wallFig. 12 depicts a spatio-temporal map of heat flux density
extracted by the spray 1 and 3 along the radius (horizontally)and as a function of the time (vertically). The color scale is keptidentical for spray 1 and 3 in order to ease the comparison. Themain comments are the following:
– For spray 1 up to t � 7 s, the heat flux is almost spatially uni-form. A second phase is characterized by non homogeneousregions. The limit of the film boiling regime (Leidenfrostregime), where the heat flux is minimum, is reached for0 < r < 30 mm at t � 13 s. Then, for 0 < r < 30 mm, the criticalheat flux (CHF), corresponding to an inflection point, is visibleat t � 18 s. From t � 20 s up to the end of the cooling phase,the nucleate boiling regime takes place and the removed heatflux decreases and exhibits an almost homogeneous distribu-tion along the radius.
(a)
0 50 100 150 200 250 3000
5
10
15
20
25
30
d(µm)
w(m
/s)
Incoming droplets Spray 1 Spray 2 Spray 3
Fig. 11. Correlation size/vertical velocity of the incoming droplet
– In comparison, when spray 3 is considered, the CHF is reachedvery quickly (t � 5 s) throughout the radius, but the transitionbetween the film boiling regime and the nucleate boilingregime cannot be clearly identified. Before reaching the CHFpoint, the heat flux presents strong spatial heterogeneities. Con-versely, past the CHF point, the cooling rate is relativelyhomogeneous.
The boiling curves for the three sprays can be also determined:they represent the evolution of the extracted heat flux density as afunction of the wall temperature Tw (Fig. 13). The boiling curves areplotted for two values of the radius: r = 2.5 mm (a) and r = 70 mm(b). First of all, as the vertical axis scale is the same for both posi-tions, the spray 3 exhibits a strong spatial heterogeneity of the heatflux. Next, at r = 2.5 mm (i.e. close to the disk center), the heat fluxextracted by spray 3 is clearly higher than for the two other. Atr = 70 mm, the heat flux for sprays 2 and 3 are almost similar.For both positions, spray 1 leads to the lowest heat flux. The liter-ature provides several correlations for the heat flux extracted inthe film boiling regime. These correlations depend mainly of theSMD (or mean diameter), the vertical velocity, the mass flux orthe We number. By observing the Fig. 5b, the heat flux for the spray3 can be correlated with its mass flux value: between r = 0 andr = 70 mm, both heat flux and mass flux decrease. This observationis often noticed [5,6,25–27,31]. On the other side, this trend is notclearly verified for the two other sprays. The heat flux for the spray1 is the lowest whereas it depicts higher mass flux than spray 2. Itmeans that other parameters may influence the extraction of ther-mal energy by spray. According to Fig. 6a, it appears that the spray1 presents higher mean vertical velocity values than spray 2. Itcould be assumed then that the increase of the initial dropletkinetic energy leads to a decrease of the cooling power. Nonethe-less, the effect of the sole vertical velocity on the heat flux remainsunclear and can be contradictory. Several authors [5,24] haverevealed that heat transfer during the film boiling regime increaseswith decreasing the droplet velocity. Controversially, in otherpaper it was found that heat transfer increases with the velocity[6,31].
6.3.2. Investigation of the Leidenfrost temperatureThe Leidenfrost temperature can be determined from the
boiling curves at a given position along the radius, when the heatflux experiences a minimum value. Compared to spray 3, theLeidenfrost point is easy to identify for spray 1 and 2, i.e. whenthe mass flux is low. This observation is often mentioned in the lit-erature: the increase of the Leidenfrost with the mass flux beingrelated to the absence of a stable vapor film. However, the Leiden-frost temperature tends generally to increase with the mass flux
(b)
0 50 100 150 200 250 300-6
-5
-4
-3
-2
-1
0
d(µm)
w(m
/s)
Outcoming droplets Spray 1 Spray 2 Spray 3
s (a) and of the outcoming droplets (b) for the three sprays.
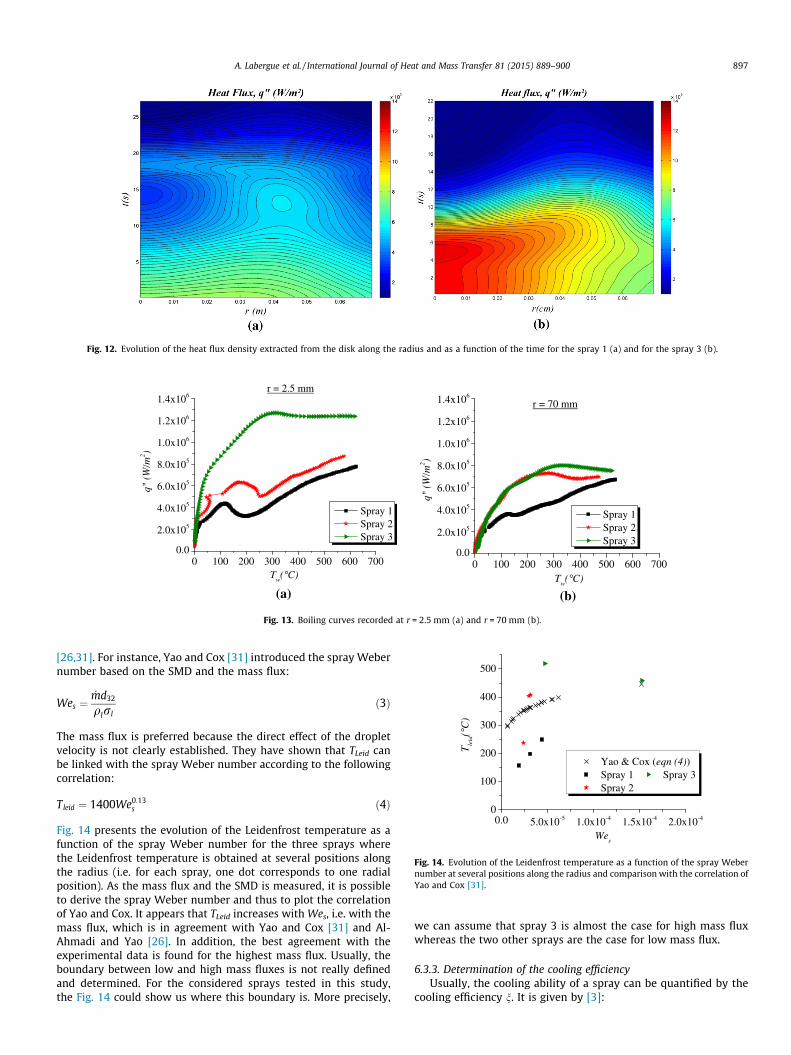
Fig. 12. Evolution of the heat flux density extracted from the disk along the radius and as a function of the time for the spray 1 (a) and for the spray 3 (b).
(b)(a)
0 100 200 300 400 500 600 7000.0
2.0x10⁵
4.0x10⁵
6.0x10⁵
8.0x10⁵
1.0x10⁶
1.2x10⁶
1.4x10⁶r = 2.5 mm
Spray 1 Spray 2 Spray 3
Tw(°C)
q" (
W/m
2 )
0 100 200 300 400 500 600 7000.0
2.0x10⁵
4.0x10⁵
6.0x10⁵
8.0x10⁵
1.0x10⁶
1.2x10⁶
1.4x10⁶
r = 70 mm
Spray 1 Spray 2 Spray 3
Tw(°C)
q" (
W/m
2 )
Fig. 13. Boiling curves recorded at r = 2.5 mm (a) and r = 70 mm (b).
0.0 5.0x10⁻⁵ 1.0x10⁻⁴ 1.5x10⁻⁴ 2.0x10-40
100
200
300
400
500
Wes
Yao & Cox (eqn (4)) Spray 1 Spray 3 Spray 2
Tle
id(°
C)
Fig. 14. Evolution of the Leidenfrost temperature as a function of the spray Webernumber at several positions along the radius and comparison with the correlation ofYao and Cox [31].
A. Labergue et al. / International Journal of Heat and Mass Transfer 81 (2015) 889–900 897
[26,31]. For instance, Yao and Cox [31] introduced the spray Webernumber based on the SMD and the mass flux:
Wes ¼_md32
qlrlð3Þ
The mass flux is preferred because the direct effect of the dropletvelocity is not clearly established. They have shown that TLeid canbe linked with the spray Weber number according to the followingcorrelation:
Tleid ¼ 1400We0:13s ð4Þ
Fig. 14 presents the evolution of the Leidenfrost temperature as afunction of the spray Weber number for the three sprays wherethe Leidenfrost temperature is obtained at several positions alongthe radius (i.e. for each spray, one dot corresponds to one radialposition). As the mass flux and the SMD is measured, it is possibleto derive the spray Weber number and thus to plot the correlationof Yao and Cox. It appears that TLeid increases with Wes, i.e. with themass flux, which is in agreement with Yao and Cox [31] and Al-Ahmadi and Yao [26]. In addition, the best agreement with theexperimental data is found for the highest mass flux. Usually, theboundary between low and high mass fluxes is not really definedand determined. For the considered sprays tested in this study,the Fig. 14 could show us where this boundary is. More precisely,
we can assume that spray 3 is almost the case for high mass fluxwhereas the two other sprays are the case for low mass flux.
6.3.3. Determination of the cooling efficiencyUsually, the cooling ability of a spray can be quantified by the
cooling efficiency n. It is given by [3]:
0 10 20 30 40 50 600.00
0.01
0.02
0.03
0.04
0.05
0.06
0.07
Spray 1 at Tw
= 560°C
Yao & Cox at Tw
= 560°C
Spray 1 at Tw
= 400°C
Yao & Cox at Tw
= 400°C
ξ
r (mm)
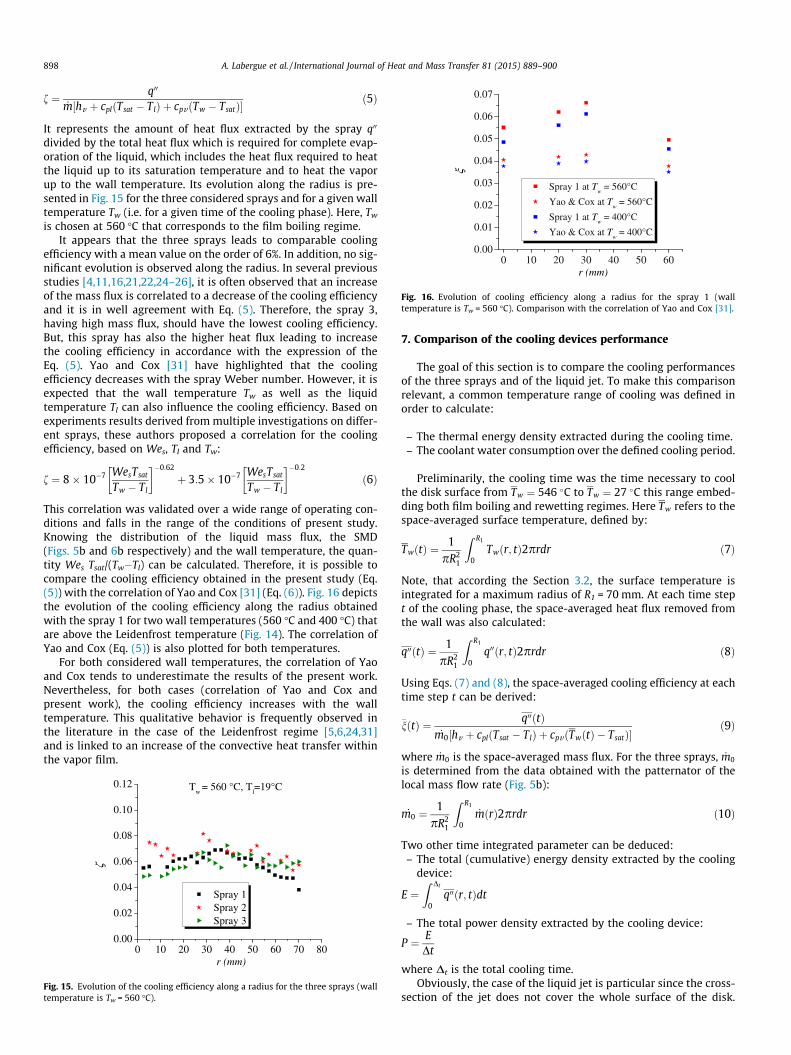
Fig. 16. Evolution of cooling efficiency along a radius for the spray 1 (walltemperature is Tw = 560 �C). Comparison with the correlation of Yao and Cox [31].
898 A. Labergue et al. / International Journal of Heat and Mass Transfer 81 (2015) 889–900
f ¼ q00
_m½hv þ cplðTsat � TlÞ þ cpvðTw � TsatÞ�ð5Þ
It represents the amount of heat flux extracted by the spray q00
divided by the total heat flux which is required for complete evap-oration of the liquid, which includes the heat flux required to heatthe liquid up to its saturation temperature and to heat the vaporup to the wall temperature. Its evolution along the radius is pre-sented in Fig. 15 for the three considered sprays and for a given walltemperature Tw (i.e. for a given time of the cooling phase). Here, Tw
is chosen at 560 �C that corresponds to the film boiling regime.It appears that the three sprays leads to comparable cooling
efficiency with a mean value on the order of 6%. In addition, no sig-nificant evolution is observed along the radius. In several previousstudies [4,11,16,21,22,24–26], it is often observed that an increaseof the mass flux is correlated to a decrease of the cooling efficiencyand it is in well agreement with Eq. (5). Therefore, the spray 3,having high mass flux, should have the lowest cooling efficiency.But, this spray has also the higher heat flux leading to increasethe cooling efficiency in accordance with the expression of theEq. (5). Yao and Cox [31] have highlighted that the coolingefficiency decreases with the spray Weber number. However, it isexpected that the wall temperature Tw as well as the liquidtemperature Tl can also influence the cooling efficiency. Based onexperiments results derived from multiple investigations on differ-ent sprays, these authors proposed a correlation for the coolingefficiency, based on Wes, Tl and Tw:
f ¼ 8� 10�7 WesTsat
Tw � Tl
� ��0:62
þ 3:5� 10�7 WesTsat
Tw � Tl
� ��0:2
ð6Þ
This correlation was validated over a wide range of operating con-ditions and falls in the range of the conditions of present study.Knowing the distribution of the liquid mass flux, the SMD(Figs. 5b and 6b respectively) and the wall temperature, the quan-tity Wes Tsat/(Tw�Tl) can be calculated. Therefore, it is possible tocompare the cooling efficiency obtained in the present study (Eq.(5)) with the correlation of Yao and Cox [31] (Eq. (6)). Fig. 16 depictsthe evolution of the cooling efficiency along the radius obtainedwith the spray 1 for two wall temperatures (560 �C and 400 �C) thatare above the Leidenfrost temperature (Fig. 14). The correlation ofYao and Cox (Eq. (5)) is also plotted for both temperatures.
For both considered wall temperatures, the correlation of Yaoand Cox tends to underestimate the results of the present work.Nevertheless, for both cases (correlation of Yao and Cox andpresent work), the cooling efficiency increases with the walltemperature. This qualitative behavior is frequently observed inthe literature in the case of the Leidenfrost regime [5,6,24,31]and is linked to an increase of the convective heat transfer withinthe vapor film.
0 10 20 30 40 50 60 70 800.00
0.02
0.04
0.06
0.08
0.10
0.12
ζ
r (mm)
Spray 1 Spray 2 Spray 3
Tw
= 560 °C, Tl=19°C
Fig. 15. Evolution of the cooling efficiency along a radius for the three sprays (walltemperature is Tw = 560 �C).
7. Comparison of the cooling devices performance
The goal of this section is to compare the cooling performancesof the three sprays and of the liquid jet. To make this comparisonrelevant, a common temperature range of cooling was defined inorder to calculate:
– The thermal energy density extracted during the cooling time.– The coolant water consumption over the defined cooling period.
Preliminarily, the cooling time was the time necessary to coolthe disk surface from Tw ¼ 546 �C to Tw ¼ 27 �C this range embed-ding both film boiling and rewetting regimes. Here Tw refers to thespace-averaged surface temperature, defined by:
TwðtÞ ¼1
pR21
Z R1
0Twðr; tÞ2prdr ð7Þ
Note, that according the Section 3.2, the surface temperature isintegrated for a maximum radius of R1 = 70 mm. At each time stept of the cooling phase, the space-averaged heat flux removed fromthe wall was also calculated:
q00ðtÞ ¼ 1pR2
1
Z R1
0q00ðr; tÞ2prdr ð8Þ
Using Eqs. (7) and (8), the space-averaged cooling efficiency at eachtime step t can be derived:
�nðtÞ ¼ q00ðtÞ_m0½hv þ cplðTsat � TlÞ þ cpvðTwðtÞ � TsatÞ�
ð9Þ
where _m0 is the space-averaged mass flux. For the three sprays, _m0
is determined from the data obtained with the patternator of thelocal mass flow rate (Fig. 5b):
_m0 ¼1
pR21
Z R1
0_mðrÞ2prdr ð10Þ
Two other time integrated parameter can be deduced:– The total (cumulative) energy density extracted by the cooling
device:
E ¼Z Dt
0q00ðr; tÞdt
– The total power density extracted by the cooling device:
P ¼ EDt
where Dt is the total cooling time.Obviously, the case of the liquid jet is particular since the cross-
section of the jet does not cover the whole surface of the disk.
0 5 10 15 20 25
3x10⁵
4x10⁵
5x10⁵
6x10⁵
7x10⁵
8x10⁵
9x10⁵
1x10⁶ Spray 1 Spray 2 Spray 3 Liquid jet
time (s)
²)/("
mWq
Fig. 17. Evolution of the space-averaged heat flux as a function of the time for thethree sprays and the liquid jet and for a similar surface temperature range.
0 5 10 15 20 250.00
0.01
0.02
0.03
0.04
0.05
0.06
0.07
0.08ξ
time (s)
Spray 1 Spray 2 Spray 3 Liquid jet
Fig. 18. Evolution of the space-averaged cooling efficiency as a function of the timefor the three sprays and the liquid jet and for a similar surface temperature range.
0 5 10 15 20 250.0
5.0x10⁴
1.0x10⁵
1.5x10⁵
2.0x10⁵
2.5x10⁵
time (s)
Spray 1 Spray 2 Spray 3 Liquid jet
E (J/m²)
Fig. 19. Evolution cumulative energy density extracted by the three sprays and theliquid jet and for similar wall temperature range.
A. Labergue et al. / International Journal of Heat and Mass Transfer 81 (2015) 889–900 899
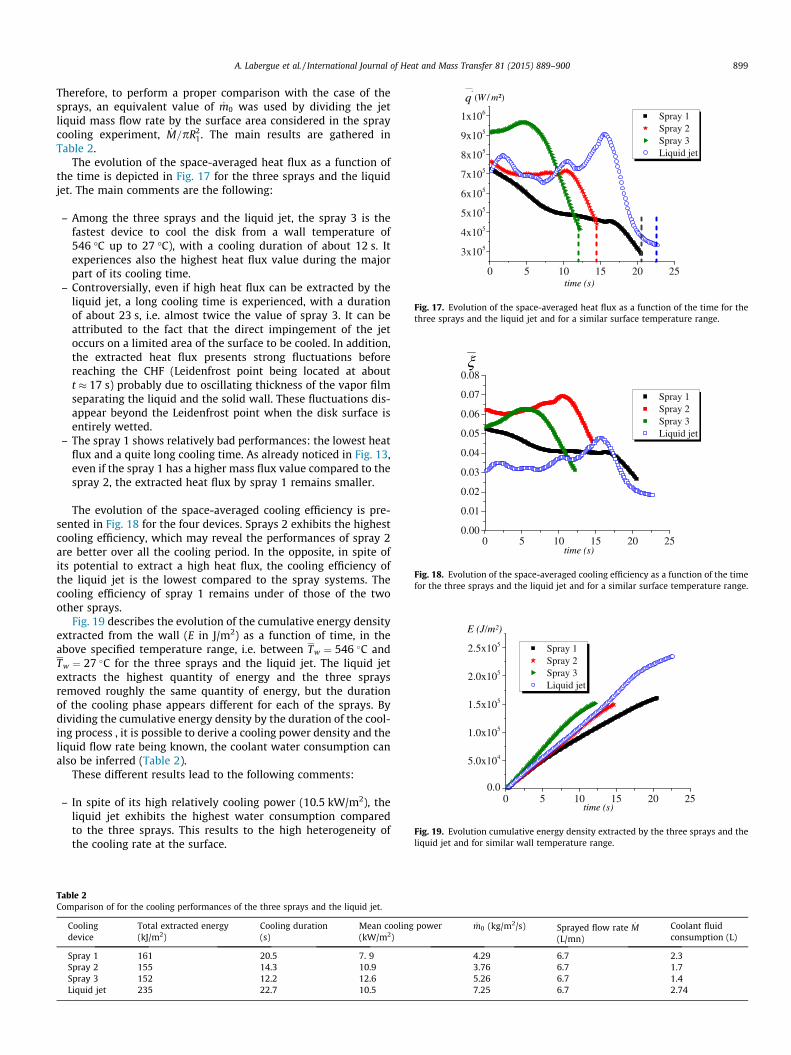
Therefore, to perform a proper comparison with the case of thesprays, an equivalent value of _m0 was used by dividing the jetliquid mass flow rate by the surface area considered in the spraycooling experiment, _M=pR2
1. The main results are gathered inTable 2.
The evolution of the space-averaged heat flux as a function ofthe time is depicted in Fig. 17 for the three sprays and the liquidjet. The main comments are the following:
– Among the three sprays and the liquid jet, the spray 3 is thefastest device to cool the disk from a wall temperature of546 �C up to 27 �C), with a cooling duration of about 12 s. Itexperiences also the highest heat flux value during the majorpart of its cooling time.
– Controversially, even if high heat flux can be extracted by theliquid jet, a long cooling time is experienced, with a durationof about 23 s, i.e. almost twice the value of spray 3. It can beattributed to the fact that the direct impingement of the jetoccurs on a limited area of the surface to be cooled. In addition,the extracted heat flux presents strong fluctuations beforereaching the CHF (Leidenfrost point being located at aboutt � 17 s) probably due to oscillating thickness of the vapor filmseparating the liquid and the solid wall. These fluctuations dis-appear beyond the Leidenfrost point when the disk surface isentirely wetted.
– The spray 1 shows relatively bad performances: the lowest heatflux and a quite long cooling time. As already noticed in Fig. 13,even if the spray 1 has a higher mass flux value compared to thespray 2, the extracted heat flux by spray 1 remains smaller.
The evolution of the space-averaged cooling efficiency is pre-sented in Fig. 18 for the four devices. Sprays 2 exhibits the highestcooling efficiency, which may reveal the performances of spray 2are better over all the cooling period. In the opposite, in spite ofits potential to extract a high heat flux, the cooling efficiency ofthe liquid jet is the lowest compared to the spray systems. Thecooling efficiency of spray 1 remains under of those of the twoother sprays.
Fig. 19 describes the evolution of the cumulative energy densityextracted from the wall (E in J/m2) as a function of time, in theabove specified temperature range, i.e. between Tw ¼ 546 �C andTw ¼ 27 �C for the three sprays and the liquid jet. The liquid jetextracts the highest quantity of energy and the three spraysremoved roughly the same quantity of energy, but the durationof the cooling phase appears different for each of the sprays. Bydividing the cumulative energy density by the duration of the cool-ing process , it is possible to derive a cooling power density and theliquid flow rate being known, the coolant water consumption canalso be inferred (Table 2).
These different results lead to the following comments:
– In spite of its high relatively cooling power (10.5 kW/m2), theliquid jet exhibits the highest water consumption comparedto the three sprays. This results to the high heterogeneity ofthe cooling rate at the surface.
Table 2Comparison of for the cooling performances of the three sprays and the liquid jet.
Coolingdevice
Total extracted energy(kJ/m2)
Cooling duration(s)
Mean cooling power(kW/m2)
_m0 (kg/m2/s) Sprayed flow rate _M(L/mn)
Coolant fluidconsumption (L)
Spray 1 161 20.5 7. 9 4.29 6.7 2.3Spray 2 155 14.3 10.9 3.76 6.7 1.7Spray 3 152 12.2 12.6 5.26 6.7 1.4Liquid jet 235 22.7 10.5 7.25 6.7 2.74
900 A. Labergue et al. / International Journal of Heat and Mass Transfer 81 (2015) 889–900
– Among the four devices, the spray 3 leads to the best trade-off,since it exhibits the highest cooling power (12.6 kW/m2) andthe lowest water consumption. This probably could be relatedto its high mass flux value as well as to its droplets propertieswhen they impinge the heated surface. Spray 3 is singularizedby the largest spreading angle, the highest horizontal velocityand the lowest vertical velocity. But it has not the highest cool-ing efficiency. It could be linked to its higher mass flux in thevicinity of the center of the heated disk, which can thus resultin a kind of heterogeneity of the cooling.
– Among the three sprays, it appears that the spray 1 presents theworst performances with the lowest cooling power (7.9 kW/m2)and the highest water consumption. This can be related to itshigh impingement vertical velocity, trend already observed inthe locally results (Fig. 13).
8. Conclusions
An experimental set-up was developed in order to investigatewater cooling of high-temperature surfaces under conditions thatare representative to an industrial situation encountered in steelprocessing. The cooling by a liquid jet and three polydisperse fullcone sprays are compared. The wall, a 175 mm diameter nickeldisk, is heated by an induction device up to 800 �C before to bequenched. The heat flux was estimated with infrared thermogra-phy combined with an inverse conduction method and synchro-nized to a Phase-Doppler system. In first, the effect of thepresence of the wall on the motion of the incoming droplets washighlighted. The trajectories of the smallest droplets, which behaveas passive tracers, are deviated by the plate, which reduce theirimpingement probability on the heated target. The comparisonbetween the statistics of the incoming and outcoming dropletsshows a slight decrease of the mean Sauter diameter, which isattributed to the disintegration of the largest droplets into to smal-ler one and to some evaporation of the liquid.
When spray cooling is considered, the cooling efficiencydecreases with the mass flux and the Leidenfrost temperatureincreases, which is in qualitative agreement with other studies ofthe literature. Nevertheless, the role of the mass flux on the heatflux removed is still unclear. In the present work, the heat fluxseems better correlated with the impingement vertical velocity,where an increase of this parameter leads to a decrease of the heatflux. Finally, a comparative study of performances, in term of liquidconsumption and cooling duration, is performed by considering asimilar surface temperature decrease for the three sprays and theliquid jet. Among the four devices, the liquid jet has the longestcooling time and the highest liquid consumption. On the contrary,the best performances are reached for the spray having the highestmass flux value together with the highest horizontal velocity.
Future works will be devoted to investigate the case of sprays ofhigher mass flux with an extended range of injection conditions. Inaddition, high speed camera visualisation will be performed inorder to describe more thoroughly the interactions of the spraywith the heated plate and to identify the different hydrodynamicregime (rebound, splashing, and film deposition).
Conflict of interest
None declared.
Acknowledgment
This work has been supported by the French National Agency(ANR) in the frame of the research program IDHEAS (ANR NT09432160).
References
[1] L. Tarozzi, A. Muscio, P. Tartarini, Experimental tests of dropwise cooling oninfrared-transparent media, Exp. Therm. Fluid Sci. 31 (2007) 857–865.
[2] P. Tartarini, M.A. Corticceli, L. Tarozzi, Dropwise cooling: experimental tests byinfrared thermography and numerical simulations, Appl. Therm. Eng. 29(2009) 1391–1397.
[3] C.O. Pederson, An experimental study of the dynamic behavior and heattransfer characteristics of water droplets impinging upon a heated surface, Int.J. Heat Mass Transfer 13 (1970) 369–381.
[4] S.C. Yao, K.J. Choi, Heat transfer mechanisms of mono-dispersed verticallyimpacting sprays, Int. J. Heat Mass Transfer 13 (2) (1987) 639–648.
[5] J.D. Bernardin, I. Mudawar, Film boiling heat transfer of droplets streams andsprays, Int. J. Heat Mass Transfer 40 (11) (1997) 2579–2593.
[6] J.D. Bernardin, C.J. Stebbins, I. Mudawar, Mapping of impact and heat transferregimes of water drops impinging on a polished surface, Int. J. Heat MassTransfer 40 (2) (1997) 247–267.
[7] J. Dewitte, P. Berthoumieu, G. Lavergne, An experimental study of droplet hotwall interactions and a survey of the splashing regime, in: Proceedings of the5th International Symposium on Multiphase Flow, 2005.
[8] G.E. Cossali, M. Marengo, M. Santini, Single-drop empirical models for sprayimpact on solid walls: a review, Atomization Sprays 15 (2005) 699–736.
[9] A. Moita, A. Moreira, Development of empirical correlations to predict thesecondary droplet size of impacting droplets onto heated surfaces, Exp. Fluids47 (2008) 167–177.
[10] P. Dunand, G. Castanet, M. Gradeck, F. Lemoine, D. Maillet, Energy balance ofdroplets impinging onto a wall heated above the Leidenfrost temperature, Int.J. Heat Fluid Flows 44 (2013) 170–180.
[11] K.J. Choi, S.C. Yao, Heat transfer mechanisms of horizontally impacting sprays,Int. J. Heat Mass Transfer 30 (2) (1987) 1291–1296.
[12] S. Deb, S.C. Yao, Analysis on film boiling heat transfer of impacting sprays, Int.J. Heat Mass Transfer 32 (11) (1987) 2099–2112.
[13] T. Cox, Heat transfer experiments and general correlation for spraysof very large droplets (Ph.D. Thesis), Carnegie Mellon University, Pittsburgh,1998.
[14] G.P. Celata, M. Cumo, C. Lombardo, A. Mariani, L. Saraceno, Experimental resulton rewetting of hot surfaces by droplet impingement, Exp. Therm. Fluid Sci. 29(2005) 275–285.
[15] G.P. Celata, M. Cumo, A. Mariani, L. Saraceno, A comparison between spraycooling and film flow cooling during the rewetting of a hot surface, Int. J. HeatMass Transfer 45 (2009) 1029–1035.
[16] T.L. Cox, S.C. Yao, Heat transfer of sprays of large water drops impinging onhigh temperature surfaces, J. Heat Transfer 121 (2) (1999) 446–450.
[17] I. Mudawar, W.S. Valentine, Determination of the local quench curve forsprays-cooled metallic surfaces, J. Heat Treat. 7 (1989) 107–121.
[18] W. Jia, H.H. Qiu, Experimental investigation of droplet dynamics and heattransfer in spray cooling, Exp. Therm. Fluids Sci. 27 (2003) 829–838.
[19] R.H. Chen, L.C. Chow, J.E. Navedo, Effects of sprays characteristics on criticalheat flux in subcooled water sprays cooling, Int. J. Heat Mass Transfer 45(2002) 4033–4043.
[20] F. Puschmann, E. Specht, J. Schmidt, Measurements of sprays cooling heattransfer using an infrared technique in combination with the Phase Dopplertechnique and a patternator, Int. J. Heat Technology 19 (2001) 51–56.
[21] R.E. Gaugler, Experimental investigation of spray cooling of high temperaturesurfaces (Ph.D. Thesis), Carnegie Mellon University, Pittsburgh, 1966.
[22] E. Mizikar, Spray cooling investigation for continuous casting of billets andblooms, Iron Steel Eng. (1970) 53–70.
[23] C.J. Hoogendoorn, W.S. Valentine, Leidenfrost temperature and heat transfercoefficients for water sprays impinging on a hot surface, in: Proceedings of the5th International Heat Transfer Conference, vol. 4, 1974, 135–138.
[24] L. Bolle, J.C. Moureau, Spray cooling of hot surfaces, Int. J. Heat Mass Transfer 1(1982) 1–97.
[25] W.P. Klinzing, J.C. Rozzi, I. Mudawar, Film transition boiling correlations forquenching of hot surfaces with water sprays, J. Heat Treat. 9 (2) (1992) 91–103.
[26] H.M. Al-Ahmadi, S.C. Yao, Spray cooling of high temperature metals using highmass flux industrial nozzles, Exp. Heat Transfer 21 (2008) 38–51.
[27] M. Gradeck, J.A. Ouattara, B. Rémy, D. Maillet, Solution of an inverse problemin the hankel space – infrared thermography applied to estimation of atransient cooling flux, Exp. Therm. Fluids Sci. 36 (2012) 56–64.
[28] A. Ouattara, M. Gradeck, D. Maillet, B. Remy, M. Lebouché, Solution of IHCPestimation of a nonuniform source using an inverse heat conduction methodbased on an analytical solution, Proc. Eurotherm (2008).
[29] M. Gradeck, A. Ouattara, D. Maillet, P. Gardin, M. Lebouché, Heat transferassociated to a hot surface quenched by a jet oil in water emulsion, Exp.Therm. Fluids Sci. 35 (5) (2011) 841–847.
[30] D. Maillet, S. André, J. Barsale, A. Degiovanni, C. Moyne, Thermal Quadrupoles –Solving the Heat Equation through Integral Transforms, Wiley, Chisester, NewYork, 2000.
[31] S.C. Yao, T.L. Cox, A general heat transfer correlation for impactingwater sprays on high-temperature surfaces, Exp. Heat Transfer 15 (2002)207–219.