Embed Size (px)
Citation preview
R
Co
DLA
a
ARRAA
Cwcsssbagse
KSGRNM
1
toaRpiAi(C
h0
Carbohydrate Polymers 176 (2017) 345–355
Contents lists available at ScienceDirect
Carbohydrate Polymers
j ourna l ho me page: www.elsev ier .com/ locate /carbpol
esearch Paper
omparative study of the effect of starches from five different sourcesn the rheological properties of gluten-free model doughs
uqin Zhang, Taihua Mu ∗, Hongnan Sunaboratory of Food Chemistry and Nutrition Science, Institute of Food Science and Technology, Chinese Academy of Agricultural Sciences, Key Laboratory ofgro-Products Processing, Ministry of Agriculture, No. 1 Nongda South Rd., Xi Beiwang, Haidian District, Beijing, 100193, PR China
r t i c l e i n f o
rticle history:eceived 6 April 2017eceived in revised form 24 July 2017ccepted 3 August 2017vailable online 9 August 2017
hemical compounds studied in this article:ater (Pubchem CID: 962)
opper sulfate (PubChem CID: 24462)ulfuric acid (PubChem CID: 1118)odium acetate (PubChem CID: 517045)odium hydroxide (PubChem CID: 14798)oric acid (PubChem CID: 7628)cetic acid (PubChem CID: 176)lucose (PubChem CID: 79025)odium chloride (PubChem CID: 5234)thanol (PubChem CID: 702)
a b s t r a c t
We investigated the effect of wheat (WS), corn (CS), tapioca (TS), sweet potato (SS) and potato (PS)starches on the rheological properties of starch–hydroxypropylmethylcellulose (HPMC) model doughs.Significant differences were found among model doughs made with different starches in terms of waterabsorption, development time, and strength. The PS-HPMC dough presented higher maximum creepcompliance, followed successively by SS–, TS–, CS–, and WS–HPMC doughs, and the same order was foundfor the degree of dependence of G′ on frequency sweep, suggesting that the resistance to deformationdepends on network structure stability. More water distributed between hydration sites of HPMC andstarch surface, leading to more hydrogen bonds and the formation of stable network. In conclusion, therheological properties of model doughs are largely due to variation in structural and physicochemicalproperties of different starches, as well as varying interactions between different starches and HPMC.
© 2017 Published by Elsevier Ltd.
eywords:tarchluten-free model doughheological propertiesetwork structure
oisture distribution. Introduction
Celiac disease is related to the inflammation of the small intes-ine, and leads to intestinal mucosa damage and malabsorptionf several important nutrients such as iron, folic acid, calcium,nd fat-soluble vitamins (Kelly, Feighery, Gallagher, & Weir, 1990).eports from recent epidemiological studies have shown that therevalence of celiac disease has been significantly underestimated
n a number of countries, including China (Gallagher, Gormley, &rendt, 2004; Yuan, Jiang, Hu, Gao, & Chen, 2015). Gluten has been
dentified as the responsible pathogenic factor in celiac diseaseSivaramakrishnan, Senge, & Chattopadhyay, 2004; Ronda, Gómez,aballero, Oliete, & Blanco, 2009), and for the patients with celiac
∗ Corresponding author.E-mail addresses: [email protected] (D. Zhang), [email protected] (T. Mu).
ttp://dx.doi.org/10.1016/j.carbpol.2017.08.025144-8617/© 2017 Published by Elsevier Ltd.
disease, the only effective treatment is a strictly gluten-free diet(Witczak, Juszczak, Ziobro, & Korus, 2016). Therefore, the develop-ment of gluten-free products that are suitable for people sufferingfrom celiac disease is highly important.
Starch and hydrocolloids are major ingredients in gluten-freediets (Shi & Bemiller, 2002). Hydrocolloids can be used as a substi-tute for gluten, and have been widely studied in gluten-free doughs(Mancebo, Picón, & Gómez, 2015). Hydroxypropylmethylcellulose(HPMC) was found to be one of the best improver for gluten-freeproducts (Hager & Arendt, 2013). Much research has focused on thedevelopment of the gluten-free diet (Demirkesen et al., 2014; Hager& Arendt, 2013; Moreira, Chenlo, & Torres, 2013; Mancebo, Picónet al., 2015; Mariotti, Pagani, & Lucisano, 2013). Apart from hydro-colloids, starches, which are another major ingredient (ranged from
60% to 90%) in the gluten-free diet, also play an important role in thegluten-free diet (Witczak et al., 2016). For instance, wheat, corn andtapioca starches could make gluten-free bread with great volume
3 te Pol
aaPptCacahs
iBinasuDBooccAP2
dssmtfsir
2
2
WaBLiscS
2s
itmgTa
a
46 D. Zhang et al. / Carbohydra
nd overall acceptability including crumb texture, cell structurend color (Mancebo, Merino, Martínez, & Gómez, 2015; López,ereira, & Junqueira, 2004). Sweet potato starch is widely used toroduce gluten-free noodle with preferable firmness and rehydra-ion characteristic when compared with other starches (Collado &orke, 1997). Potato starch is often used in gluten-free pasta, and itsddition could increase the overall quality (including appearance,olor, odor, and hardness) of gluten-free pasta made from corn, rice,nd sorghum flours (Ferreira et al., 2016). However, compared toydrocolloids, the importance of starch in the gluten-free diet istill undervalued (Witczak et al., 2016).
Dough is a viscoelastic material with a high degree of elastic-ty, as well as considerable plasticity and viscosity (Schofield &lair, 1933). The rheological properties of doughs are extremely
mportant because they can influence the mechanical and tech-ological properties of doughs, including extensibility, moldingnd shaping capacities, mixing behavior, gas-holding capacity,teaming and baking performance, and the quality of the prod-cts (Van Bockstaele, de Leyn, Eeckhout, & Dewettinck, 2011;obraszczyk & Morgenstern, 2003; Lazaridou, Duta, Papageorgiou,elc, & Biliaderis, 2007). In recent years, many studies have focusedn the rheological properties of gluten-free doughs. However, mostf the tested doughs were made with whole flours (e.g., rice flour,orn flour, etc.) containing a variety of ingredients, making it diffi-ult to find the role of starch on the rheological properties (Aprodu,lexandra Badiu, & Banu, 2016; Mancebo, Picón et al., 2015;ongjaruvat, Methacanon, Seetapan, Fuongfuchat, & Gamonpilas,014; Witczak et al., 2016).
Therefore, in order to exclude the interference of other ingre-ients, starches from five different sources (wheat, corn, tapioca,weet potato, and potato) were used, respectively, to maketarch–HPMC model doughs, and the rheological properties of theodel doughs were investigated. In addition, the moisture dis-
ributions of the starch–HPMC model doughs were analyzed tourther explore the mechanism of how the starches with differenttructures influence the rheological properties and starch–HPMCnteractions in gluten-free doughs. This study could provide theo-etical support for the manufacture of gluten-free products.
. Materials and methods
.1. Materials
The starches from five different botanical sources (wheat starch,S; corn starch, CS; tapioca starch, TS; sweet potato starch, SS;
nd potato starch, PS) were purchased from a local market ineijing. HPMC was obtained from Henan Zhongxin Chemical Co.,td. (Zhengzhou, Henan, China). The molecular weight of HPMCs 166,700 kDa, and its degrees of methoxyl and hydroxypropylubstitution are 27.2% and 6.8%, respectively. All other chemi-al reagents were of analytical grade, and were purchased frominopharm Chemical Reagent Beijing Co., Ltd (Beijing, China).
.2. Proximate composition and amylose/amylopectin ratio oftarches
The starches from the five different sources were re-suspendedn distilled water and centrifuged (5000g, 20 ◦C, 20 min) at leasthree times, and dried in a hot air dryer (DGG-9240B; Senxin Instru-
ents, Shanghai, China) at 45 ◦C for 24 h. The dried starch was finelyround using a high-speed universal hand mill (FW100; Tianjin
aiSiTe Instrument Co. Ltd., Tianjin, China) and then sieved with100-�m screen to obtain starches of uniform particle size.The proximate composition of the starch was determined
ccording to the following methods: The moisture content of the
ymers 176 (2017) 345–355
samples was determined by drying them in triplicate in an ovenat 105 ◦C overnight until the weight remained constant (AOAC925.09). The crude protein content was determined by the man-ual Kjeldahl method, and the total nitrogen was converted to theprotein content by using a factor of 6.25. Crude fat was deter-mined by the Soxhlet extraction method (AOAC 960.36). The ashcontent was determined by carbonizing the sample in a mufflefurnace for 8 h at 550 ◦C (AOAC, 923.03). The starch content wasdetermined by using a Total Starch Assay Kit according to themanufacturer’s instructions (Megazyme, Wicklow, Ireland). Theamylose/amylopectin ratio of the starch was determined using anAmylose/Amylopectin Assay Kit according to the manufacturer’sinstructions (Megazyme, Wicklow, Ireland).
2.3. Dough preparation
Based on the results of our previous study, 2.0% HPMC was addedto the starch (WS, CS, TS, SS and PS) to prepare the gluten-freemodel doughs. An appropriate amount of water (according to thewater absorption results obtained from the Mixolab apparatus; seeSection 2.4.) was added, and the dough was mixed for 15 min.
The starch–HPMC doughs were packaged using a fresh-keepingfilm and allowed to rest for 25 min before further analysis.
2.4. Thermomechanical properties of the model doughs
The mixing and pasting behaviors of the starch–HPMC doughswere studied using a Mixolab apparatus (Chopin Technologies,Villeneuve-la-Garenne, France), which determines the rheologicalproperties of dough during the process of mixing at a constant tem-perature as well as during periods of constant heating and cooling(Hadna –dev, Dokic, Hadna –dev, Pojic, & Torbica, 2014). Measure-ments were performed using the Mixolab “Chopin + 90” protocol(ICC 173, ICC Standards, 2008). The following settings were used inthe test: 30 ◦C for 8 min, heating at a rate of 4 ◦C/min to 90 ◦C; atthis point, there was an 8-min holding period at 90 ◦C, followed bycooling at 4 ◦C/min until the mixture reached 50 ◦C, and then 6 minof holding at 50 ◦C. The stirring speed during the entire test was73 rpm. The process was repeated twice for each sample.
The parameters from the Mixolab recorded curve included themaximum dough consistency at the initial mixing stage, C1 (inNewton meter, Nm); minimum torque or the minimum value oftorque produced by the dough passage subjected to mechanical andthermal constraints, C2 (Nm); peak torque or the maximum torqueduring the heating stage, C3 (Nm); the minimum torque during theheating period (C4, Nm) and the torque obtained after cooling at50 ◦C (C5, Nm) (Kahraman et al., 2008).
Additionally, the following parameters were calculated from theMixolab recorded curve: the amount of water absorption requiredfor the dough to produce a torque of 1.10 ± 0.07 Nm for “Chopin+90”, Wabs (%); dough development time for gluten-free doughs orthe time required to form uniform network structure via hydrogenbonds and entanglements between starch and HPMC, DDT (min);dough strength against mixing or the difference between the max-imum dough consistency at the initial mixing stage (C1) and theminimum value of torque produced by the dough passage subjectedto mechanical and thermal constraints (C2), C1–C2 (Nm); and set-back or the difference between the torque obtained after cooling at50 ◦C (C5) and the minimum torque during the heating period (C4),C5–C4 (Nm).
2.5. Dynamic rheological characterization of the model doughs
The dynamic rheological characteristics of the doughs weremeasured in triplicate using a controlled stress rheometer (PhysicaMCR301; Anton Paar, Graz, Austria) operated with parallel-plate

te Pol
gmbdct
2
da2tatrl
2
tGGss
G
wrr
2
ios(
2
TesavierA
2
roseitr
2
f
D. Zhang et al. / Carbohydra
eometry, with a 25-mm diameter and a gap of 1 mm. After beingixed and resting for 25 min, each dough sample was placed
etween the plates, and the test was started after allowing theough to rest for another 10 min. The rim of the dough sample wasoated with silicone oil to prevent water evaporation during theest.
.5.1. Dynamic strain sweepThe linear viscoelasticity region (LVR) of the model doughs was
etermined by dynamic strain sweep, which was performed over strain range of 0.01–10% at an angular frequency of 10 s−1 and5 ◦C. The strain sweep provided information relating to the rela-ive strength of the junction zones formed within model doughs,s well as their relative resistances to flow. The relative strength ofhe junction zones formed within model doughs and their relativeesistance to flow were assessed by the storage modulus (G′) andoss modulus (G′′).
.5.2. Dynamic frequency sweepFrequency sweep tests were performed on the dough from 0.1
o 100 s−1 at a strain of 0.1% and temperature of 25 ◦C to determine′ and G′′ as functions of frequency. The degree of dependence of′ on the frequency sweep (z′) and the inter- or intramoleculartrength of interaction (K) were obtained by fitting the frequencyweep data into the power law model:
′ = K′(�)z′
here � is the angular frequency, and the values of z′ and K′
eflect the type and strength of molecular interactions of the dough,espectively.
.5.3. Temperature sweepA temperature sweep was performed from 25 to 90 ◦C at a heat-
ng rate of 5 ◦C/min. During the temperature sweep, the G′ and G′′
f the mixtures were recorded at a constant frequency of 1 Hz andtrain of 0.05%. The complex shear modulus (|G*|) and the loss factortan �) were also recorded during the temperature sweep.
.5.4. Creep and recovery measurementsCreep and recovery measurements were carried out as follows:
he creep phase was recorded at a shear stress of 250 MPa, whichxceeds the LVR for 300 s, followed by a recovery phase of 300 s at atress of 0 MPa. Measurements were performed at 25 ± 0.1 ◦C. Creepnd recovery curves were recorded and analyzed by RHEOPLUS/32ersion 3.21 software to obtain the parameters, including the max-mum creep compliance (Jmax), zero shear viscosity (�0), relativelastic part of the maximum creep compliance (Je/Jmax), and theelative viscous part of the maximum creep compliance (Jv/Jmax).ll rheological measurements were performed in triplicate.
.6. Moisture distribution analysis of the model doughs
Proton relaxation studies were carried out using a low-esolution MesoMR spectrometer (Niumag, Shanghai, China)perating at a 1H resonance frequency of 23 MHz. In thistudy, Carr–Purcell–Meiboom–Gill (CPMG) pulse sequences weremployed to measure the spin–spin relaxation time, T2. The typ-cal pulse parameters were as follows: dwell time, 17 �s; echoime, 400 �s; recycle time, 1500 ms; echo count, 5000; and scanepetitions, 4. Each measurement was performed in duplicate.
.7. Statistical analysis
Statistical analysis was performed by means of one-way ANOVAollowed by a Duncan multiple-comparison test with the SAS ver-
ymers 176 (2017) 345–355 347
sion 9.2 software (SAS Institute Inc., Cary, NC, USA). P < 0.05 wasconsidered statistically significant. The results were expressed asmean ± standard deviation (S.D.).
3. Results and discussion
3.1. Proximate composition and the amylose/amylopectin ratio ofthe starches
Table 1 shows the proximate composition and amy-lose/amylopectin ratio of the starches from the five differentsources. The starch content of WS, CS, TS, SS and PS was 86.87%,87.63%, 88.95%, 89.97%, and 86.0%, respectively.
WS and CS are cereal starches, and are classified as A-typestarches, with the highest amylose content (26.40% and 28.49%,respectively), followed by PS (24.16%), which is a B-type starch. SSand TS exhibited the lowest amylose content (18.82% and 17.71%,respectively), and are classified as C-type starches.
3.2. Thermomechanical properties of the model doughs
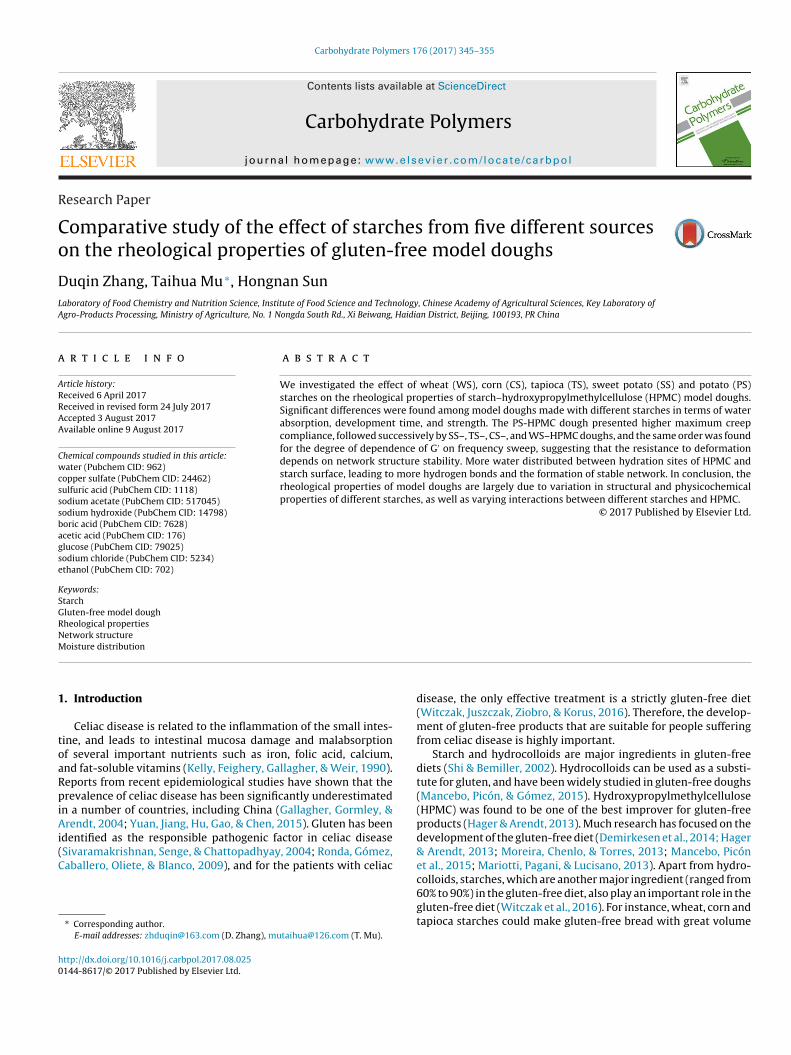
The Mixolab apparatus measures the torque that is produced bythe passage of dough between two kneading arms in real time, thusallowing the study of physicochemical behavior. Thermomechani-cal graphs of the starch–HPMC model doughs are shown in Fig. 1,and the parameters derived from the thermomechanical graphs aresummarized in Table 2.
As can be seen in Fig. 1, the starch–HPMC dough presented onesharp peak at the very beginning of the kneading process. HPMC hasexcellent swelling capacity because of the presence of hydrophilicreactive functional groups such as hydroxypropyl (Wach, Mitomo,Yoshii, & Kume, 2002). The rapid water absorption of HPMC resultsin the swelling of the dough and increases the torque during thekneading of the dough (Lazaridou et al., 2007). In general, wefound significant differences in the thermomechanical behavior ofthe gluten-free model doughs made with starches from differentbotanical sources (Fig. 1). C3 and C5 are the maximum torque of thedough during the heating stage and the torque obtained after cool-ing at 50 ◦C, respectively. The WS– and PS–HPMC doughs showedsignificantly higher C3 and C5 than the other doughs, indicatinghigher strength and viscosity during the processes of starch gela-tinization and retrogradation. Starch with high swelling power canresult in high maximum viscosity of the dough (Tipples et al., 1980).Christianson (1982) proposed that the effect of hydrocolloids on themaximum viscosity is mainly caused by two phenomena: 1) theirinteraction with solubilized starch and 2) an increase of the effectof this interaction on the granules, which affects the breakdownof the granule and the amount of solubilized starch (especially theamylose in the starch). Bahnassey and Breene (1994) also foundthe presence of synergistic interactions between starch and hydro-colloids, which are dependent on the properties of the starch andthe structure of the hydrocolloid. Therefore, during the gelatiniza-tion of the dough, not only the swelling power of the starch, butalso the interactions between the starch and HPMC affect the max-imum viscosity of the PS– and WS–HPMC doughs. The higher C3value of the PS–HPMC dough could be attributed to the swellingpower of PS, which was higher than that of the other four starches(Supplementary Table 1). Although the swelling power of WS wasclearly lower than that of PS (Supplementary Table 1), the C3 valueof the WS–HPMC dough was similar to that of the PS–HPMC dough,which indicates stronger interactions between WS and HPMC dur-
ing starch gelatinization. Previous studies have shown that thisis because it is easier for the amylose to dissolve out of the WSgranule and interact with HPMC during the heating of the dough(Christianson, 1982; Jekle, Mühlberger, & Becker, 2016). Another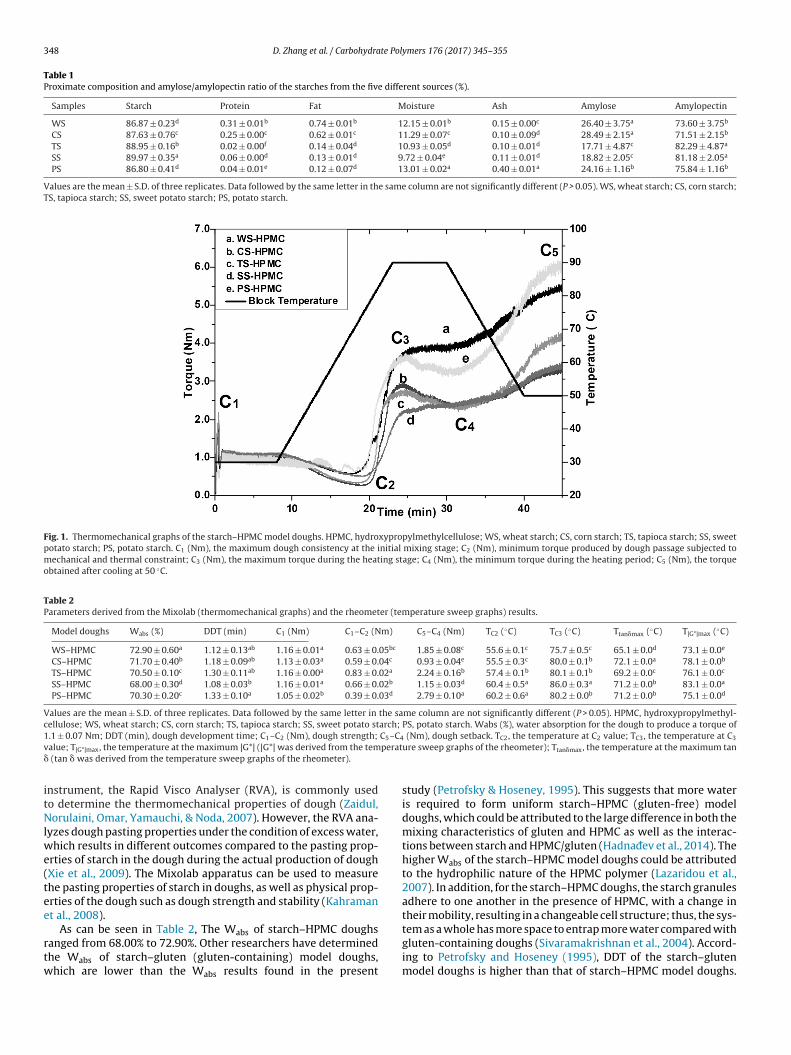
348 D. Zhang et al. / Carbohydrate Polymers 176 (2017) 345–355
Table 1Proximate composition and amylose/amylopectin ratio of the starches from the five different sources (%).
Samples Starch Protein Fat Moisture Ash Amylose Amylopectin
WS 86.87 ± 0.23d 0.31 ± 0.01b 0.74 ± 0.01b 12.15 ± 0.01b 0.15 ± 0.00c 26.40 ± 3.75a 73.60 ± 3.75b
CS 87.63 ± 0.76c 0.25 ± 0.00c 0.62 ± 0.01c 11.29 ± 0.07c 0.10 ± 0.09d 28.49 ± 2.15a 71.51 ± 2.15b
TS 88.95 ± 0.16b 0.02 ± 0.00f 0.14 ± 0.04d 10.93 ± 0.05d 0.10 ± 0.01d 17.71 ± 4.87c 82.29 ± 4.87a
SS 89.97 ± 0.35a 0.06 ± 0.00d 0.13 ± 0.01d 9.72 ± 0.04e 0.11 ± 0.01d 18.82 ± 2.05c 81.18 ± 2.05a
PS 86.80 ± 0.41d 0.04 ± 0.01e 0.12 ± 0.07d 13.01 ± 0.02a 0.40 ± 0.01a 24.16 ± 1.16b 75.84 ± 1.16b
Values are the mean ± S.D. of three replicates. Data followed by the same letter in the same column are not significantly different (P > 0.05). WS, wheat starch; CS, corn starch;TS, tapioca starch; SS, sweet potato starch; PS, potato starch.
Fig. 1. Thermomechanical graphs of the starch–HPMC model doughs. HPMC, hydroxypropylmethylcellulose; WS, wheat starch; CS, corn starch; TS, tapioca starch; SS, sweetpotato starch; PS, potato starch. C1 (Nm), the maximum dough consistency at the initial mixing stage; C2 (Nm), minimum torque produced by dough passage subjected tomechanical and thermal constraint; C3 (Nm), the maximum torque during the heating stage; C4 (Nm), the minimum torque during the heating period; C5 (Nm), the torqueobtained after cooling at 50 ◦C.
Table 2Parameters derived from the Mixolab (thermomechanical graphs) and the rheometer (temperature sweep graphs) results.
Model doughs Wabs (%) DDT (min) C1 (Nm) C1–C2 (Nm) C5–C4 (Nm) TC2 (◦C) TC3 (◦C) Ttan�max (◦C) T|G*|max (◦C)
WS–HPMC 72.90 ± 0.60a 1.12 ± 0.13ab 1.16 ± 0.01a 0.63 ± 0.05bc 1.85 ± 0.08c 55.6 ± 0.1c 75.7 ± 0.5c 65.1 ± 0.0d 73.1 ± 0.0e
CS–HPMC 71.70 ± 0.40b 1.18 ± 0.09ab 1.13 ± 0.03a 0.59 ± 0.04c 0.93 ± 0.04e 55.5 ± 0.3c 80.0 ± 0.1b 72.1 ± 0.0a 78.1 ± 0.0b
TS–HPMC 70.50 ± 0.10c 1.30 ± 0.11ab 1.16 ± 0.00a 0.83 ± 0.02a 2.24 ± 0.16b 57.4 ± 0.1b 80.1 ± 0.1b 69.2 ± 0.0c 76.1 ± 0.0c
SS–HPMC 68.00 ± 0.30d 1.08 ± 0.03b 1.16 ± 0.01a 0.66 ± 0.02b 1.15 ± 0.03d 60.4 ± 0.5a 86.0 ± 0.3a 71.2 ± 0.0b 83.1 ± 0.0a
PS–HPMC 70.30 ± 0.20c 1.33 ± 0.10a 1.05 ± 0.02b 0.39 ± 0.03d 2.79 ± 0.10a 60.2 ± 0.6a 80.2 ± 0.0b 71.2 ± 0.0b 75.1 ± 0.0d
Values are the mean ± S.D. of three replicates. Data followed by the same letter in the same column are not significantly different (P > 0.05). HPMC, hydroxypropylmethyl-cellulose; WS, wheat starch; CS, corn starch; TS, tapioca starch; SS, sweet potato starch; PS, potato starch. Wabs (%), water absorption for the dough to produce a torque of1 C5–C4
v perat�
itNlwe(tee
rtw
.1 ± 0.07 Nm; DDT (min), dough development time; C1–C2 (Nm), dough strength;
alue; T|G*|max, the temperature at the maximum |G*| (|G*| was derived from the tem (tan � was derived from the temperature sweep graphs of the rheometer).
nstrument, the Rapid Visco Analyser (RVA), is commonly usedo determine the thermomechanical properties of dough (Zaidul,orulaini, Omar, Yamauchi, & Noda, 2007). However, the RVA ana-
yzes dough pasting properties under the condition of excess water,hich results in different outcomes compared to the pasting prop-
rties of starch in the dough during the actual production of doughXie et al., 2009). The Mixolab apparatus can be used to measurehe pasting properties of starch in doughs, as well as physical prop-rties of the dough such as dough strength and stability (Kahramant al., 2008).
As can be seen in Table 2, The W of starch–HPMC doughs
absanged from 68.00% to 72.90%. Other researchers have determinedhe Wabs of starch–gluten (gluten-containing) model doughs,hich are lower than the Wabs results found in the present(Nm), dough setback. TC2, the temperature at C2 value; TC3, the temperature at C3
ure sweep graphs of the rheometer); Ttan�max, the temperature at the maximum tan
study (Petrofsky & Hoseney, 1995). This suggests that more wateris required to form uniform starch–HPMC (gluten-free) modeldoughs, which could be attributed to the large difference in both themixing characteristics of gluten and HPMC as well as the interac-tions between starch and HPMC/gluten (Hadna –dev et al., 2014). Thehigher Wabs of the starch–HPMC model doughs could be attributedto the hydrophilic nature of the HPMC polymer (Lazaridou et al.,2007). In addition, for the starch–HPMC doughs, the starch granulesadhere to one another in the presence of HPMC, with a change intheir mobility, resulting in a changeable cell structure; thus, the sys-tem as a whole has more space to entrap more water compared with
gluten-containing doughs (Sivaramakrishnan et al., 2004). Accord-ing to Petrofsky and Hoseney (1995), DDT of the starch–glutenmodel doughs is higher than that of starch–HPMC model doughs.
te Pol
Tgbtshb&
siPSpasttlarBnsuahs7cadsttdwbbAdtrltaCt1csreTtwTit(tl(sd
D. Zhang et al. / Carbohydra
his could be attributed to the fact that the network structure inluten-containing doughs mainly forms through disulfide bondsetween different protein polymers, which need plenty of mixingime to develop (Singh & MacRitchie, 2001). In contrast, uniformtarch–HPMC doughs form via hydrogen bonds resulting from theydroxyl groups in the HPMC structure and the entanglementsetween starch and HPMC, which form more easily (Rosell, Collar,
Haros, 2007).Parameters derived from the thermomechanical graphs of
tarch–HPMC model doughs were strongly influenced by the botan-cal source of the starch (Table 2). We observed that the TS– andS–HPMC doughs presented higher DDT than the CS–, WS– andS–HPMC doughs. This might have been ascribed to the texturalroperties of the PS (the peak viscosity and water-binding capacityre 2700 BU and 0.38 g H2O/g dry starch, respectively), which istringy, cohesive, long-bodied, viscoelastic, and fluid; the charac-eristics of the TS (1000 BU and 0.34 g H2O/g dry starch) are similaro those of the PS, although the former is generally less stringy andess cohesive. However, the texture of the CS (the peak viscositynd water-binding capacity are 600 BU and 0.30 g H2O/g dry starch,espectively), WS (300 BU and 0.33 g H2O/g dry starch) and SS (480U and 0.32 g H2O/g dry starch) is short, soft, heavy-bodied andon-cohesive (Swinkels, 1985). When mixing with HPMC, moretringy and cohesive starches (PS and TS) take more time to formniform doughs, while less stringy and cohesive starches (CS, WSnd SS) take less time to form uniform doughs. The Wabs wasighest for the WS–HPMC model dough (72.90%), followed succes-ively by the CS–, TS–, PS– and SS–HPMC model douhgs (71.70%.0.50%, 70.30% and 68.00%, respectively). This indicates that theereal starches (WS and CS) requires more water than the tubernd root starches (TS, PS and SS) to form uniform starch–HPMCoughs. C1–C2 is the difference between the maximum dough con-istency at the initial mixing stage (C1) and the minimum value oforque produced by dough passage subjected to mechanical andhermal constraint (C2). The higher the C1–C2 values, the lower theough strength against mixing (Rosell et al., 2007). Doughs madeith SS and TS presented lower strength against mixing, followed
y WS, CS and PS. Dough strength against mixing might closelye related to the amylose content in starch (Christianson, 1982).mylose is dissolved out of starch granules in the presence of wateruring initial heating, and entangles or forms hydrogen bonds withhe HPMC polymer, reducing the weakening effect of the doughesulted from the water swelling of the starch and HPMC. Thus, theower amylose content of SS and TS (18.82% and 17.71%, respec-ively) resulted in lower dough strength against mixing. However,lthough the amylose content of PS was lower than that of WS andS, the more stringy and cohesive textural properties of the PS madehe PS–HPMC model dough more stable against mixing (Swinkels,985). C5–C4 is the difference between the torque produced afterooling and the torque after the period of heating, and reflects theetback of the dough. The higher the C5–C4 values, the faster theetrogradation rate. The dough made with CS presented the low-st C5–C4 values (0.93 Nm), followed successively by the SS–, WS–,S–, and PS–HPMC doughs (1.15, 1.85, 2.24 and 2.79 Nm, respec-ively). Thus, the CS–HPMC had the slowest retrogradation rate,hereas the PS–HPMC doughs had the fastest retrogradation rate.
hese results could be attributed to the fact that the amylopectinsn A-type starches (such as CS and WS) retrograde more slowlyhan those in B-type starches (such as PS) and C-type starchessuch as TS) (Chung, Han, Yoo, Seib, & Lim, 2008). As an excep-ion, model dough made with SS (C-type starch) exhibited a relativeower C5–C4 value compared to those of TS (C-type starch) and WS
A-type starch), attributing to the higher content of water-solubleugars in SS, which delayed the retrogradation rate of the modelough (Galliard & Bowler, 1987).ymers 176 (2017) 345–355 349
3.3. Dynamic rheological characterization of the model doughs
3.3.1. Dynamic strain sweepThe effect of the starches source on the rheological proper-
ties of the model doughs was determined by the viscoelasticchanges. The LVRs for the starch–HPMC model doughs, as estab-lished by the strain sweep experiments, are shown in Fig. 2. Ingeneral, the LVRs were limited up to a strain of 0.05% for thestarch–HPMC model doughs; the drop in the elastic modulus, G′,started to occur at 0.05% strain and increased at above 0.05%,indicating the structural breakdown of the starch–HPMC modeldoughs beyond this deformation level. Previously studies haveshown that wheat flour–water doughs exhibit LVRs at a strain levelof 0.1–0.25% (Phan-Thien and Safari-Ardi, 1998; Phan-Thien, Safari-Ardi, & Morales-Patino, 1997). The starch–HPMC model doughsexhibited lower LVRs limits, which could be attributed to the factthat the wheat flour dough generally consisted of a strong andstable gluten network, whereas the starch–HPMC model doughsgenerally comprised a weak and fragile polysaccharide network.The abovementioned results imply that gluten-free doughs aremore prone to shear-thinning and that it is more difficult forthem to hold their shape than gluten-containing dough, which isthe major technological challenge for the production of gluten-free products (Lazaridou et al., 2007). The doughs made with CSpresented the highest LVRs limits (0.123% for CS–HPMC doughs),followed by the WS–, SS–, TS– and PS–HPMC doughs (0.104%,0.106%, 0.104% and 0.077%, respectively, see Supplementary Table2). This suggests that different structural and physicochemicalproperties of the starches cause discrepancies in the viscoelasticproperties of the HPMC matrix, which might be mainly becausethe embedded starch granules could affected the stability of theHPMC network’s structure in the model doughs. The PS–HPMCdough showed a significantly higher G′ in the LVR; however, theG′ sharply decreased when the strain value was higher than 0.077%(Supplementary Table 2). The results indicate that, in the PS–HPMCdough, PS and HPMC formed stronger microstructural interactionsin the relatively low strain range, but that the stability of this net-work decreased quickly at higher strain values in comparison withthe other starch–HPMC doughs.
3.3.2. Dynamic frequency sweepIn a frequency sweep, frequency (�) varies while the strain
remains constant. Frequency sweep experiments performed in theLVR do not disturb or destroy the inherent structure of the dough,and are of great value for studying the influence and action ofstarch in starch–HPMC dough systems because dynamic mechan-ical parameters are highly sensitive to the properties of the starch(Weipert, 1990).
Supplementary Fig. 1 shows the plot of G′ and G′′ as functionsof �. For all the dough formulations in this study, the frequencysweep experiments showed that the elastic/storage modulus (G′)was greater than the viscous/loss modulus (G′′) over the whole fre-quency range, and both moduli slightly increased with increasingfrequency, which suggests a solid elastic-like behavior in the modeldoughs. Bonds between the particles in a sample may be made andbroken over the observation time, either spontaneously or fromapplied forces. Bond-breaking and bond-making lead to structuralchanges that affect rheological properties (Renard, van de Velde,& Visschers, 2006). Entanglement networks are usually charac-terized by G′ ∼ �2 and G′′ ∼ �1 at low frequency and a crossoverbetween G′ and G′′ at high frequency; further, covalent linkage isfrequency independent, whereas physical linkage is slightly fre-
quency dependent (Doucet, Gauthier, & Foegeding, 2001; Kavanagh& Ross-Murphy, 1998). The dependence of G′ on frequency can bedetermined from the logarithmic plot of G′ = K′(�)z′(log G′ = z′ log� + K) as proposed by Egelandsdal, Fretheim, and Harbitz (1986).
350 D. Zhang et al. / Carbohydrate Polymers 176 (2017) 345–355
F ulus (l otato s
TwIsasiod
Towtl2gc
ig. 2. Dynamic strain sweep data for starch–HPMC model doughs. (A) Storage modmethylcellulose; WS, wheat starch; CS, corn starch; TS, tapioca starch; SS, sweet p
he z′ values show the degree of dependence of G′ on frequency,hich can reflect the type of molecular interactions in the doughs.
n the logarithmic plot, z′ = 0 suggests a covalent linkage with atable network structure, whereas z′ > 0 suggests a physical link-ge with a less stable network structure. The K′ values show thetrength of the doughs, with a higher K value (K = log K′) indicat-ng higher strength of the dough (Kim & Yoo, 2009). The goodnessf fit was evaluated by means of the corresponding coefficients ofetermination (R2).
Table 3 shows the z′ and K in the equation of log G′ = z′ log � + K.he slopes (z′) from the logarithmic plot of G′ versus the logarithmf � show that all the model doughs in this study had G′ values thatere dependent on � (R2 > 0.99). The z′ values ranged from 0.160
o 0.236 for the starch–HPMC model doughs, signifying physical
inkage with low stability in the network structure (Moreira et al.,013). The role of hydrocolloids in the rheological properties ofluten-free dough may be related to the molecular structure andhain conformation of the polysaccharides, which determine theG′) versus strain (%); (B) Loss modulus (G′′) versus strain (%). HPMC, hydroxypropy-tarch; PS, potato starch.
physical intermolecular associations (crosslinks or entanglements)of the polymeric chains (Lazaridou et al., 2007). Starches from thedifferent botanical sources affected the z′ and K values differently.The WS–HPMC dough exhibited the highest z′ (0.236) and the low-est K (4.450), indicating a less stable dough network structure andlower strength of the dough matrix compared to other doughs. Thismight be explained by Sipes (1993) et al., who found that surfacelipid films of WS decreased the interactions between WS and HPMC.It is worth noting that heating could destroy these surface lipidfilms, and change the interactions between WS and HPMC as dis-cussed in Section 3.2 (strong interactions between WS and HPMCduring heating). The PS–HPMC dough showed the lowest z′ (0.160)but the highest K (5.562), implying a more stable network struc-ture and higher strength of the dough matrix compared to other
′
doughs. The big difference between the rheological properties (zand K values) of the PS–HPMC model dough could be attributed tothe stronger water-binding capacity caused by the high phospho-rus content in PS, which result in tighter adhesion of the hydrated
D. Zhang et al. / Carbohydrate Polymers 176 (2017) 345–355 351
Table 3The z′ , K and R2 values of the starch-HPMC model doughs obtained by fitting the frequency sweep data into power law model and the parameters obtained from thecreep-recovery curves of starch-gluten model doughs.
Model doughs z′ K R2 Creep phase Recovery phase
Jmax × 105 (1/Pa) �0 × 10−6 (Pa s) Je/Jmax (%) Jv/Jmax (%)
WS–HPMC 0.236 ± 0.003a 4.450 ± 0.009d 0.999 ± 0.000 67.83 ± 2.10a 7.10 ± 0.02d 31.79 ± 1.37c 68.21 ± 2.34c
CS–HPMC 0.208 ± 0.002b 4.628 ± 0.017c 0.998 ± 0.000 37.21 ± 1.21b 13.94 ± 0.91b 24.38 ± 1.79ab 75.62 ± 1.53b
TS–HPMC 0.230 ± 0.005a 4.442 ± 0.021d 0.999 ± 0.000 38.03 ± 1.28b 12.55 ± 1.04b 25.70 ± 1.22a 74.30 ± 2.07b
SS–HPMC 0.189 ± 0.007c 4.662 ± 0.024b 0.999 ± 0.000 21.34 ± 1.05c 22.22 ± 1.05a 23.69 ± 0.91b 76.31 ± 1.95b
PS–HPMC 0.160 ± 0.004d 5.562 ± 0.031a 0.999 ± 0.000 7.31 ± 0.64d 7.38 ± 0.24c 19.33 ± 0.79c 80.67 ± 2.06a
Values are the mean ± S.D. of three replicates. Data followed by the same letter in the same column are not significantly different (P > 0.05). HPMC, hydroxypropylmethylcel-l ; PS, po , the mp reep c
HH
3
dumtaettp
t|sisiscttqbnwtdfWmcsatsaitCh�eitfO
ulose; WS, wheat starch; CS, corn starch; TS, tapioca starch; SS, sweet potato starchf molecular interactions; R2, the corresponding coefficients of determination; Jmax
art of maximum creep compliance; Jv/Jmax, the relative viscous part of maximum c
PMC around the surface of the PS granules (Zaidul, Yamauchi, Kim,ashimoto, & Noda, 2007).
.3.3. Temperature sweepThe starch gelatinization process in the starch–HPMC model
oughs can be easily monitored by the course of the dynamic mod-lus. |G*| is the absolute value of the vector between G′ and G′′
easured by the oscillation test, and is a combination parameterhat describes the intensity of the sample. A higher |G*| indicates
firm dough (or a dough with high intensity). Tan � is a param-ter that describes the relationship between G′ and G′′. A higheran � indicates dough with high viscosity. For tan � < 1, G′ is greaterhan G′′, which indicates a predominance of elastic over viscousroperties in the model dough.
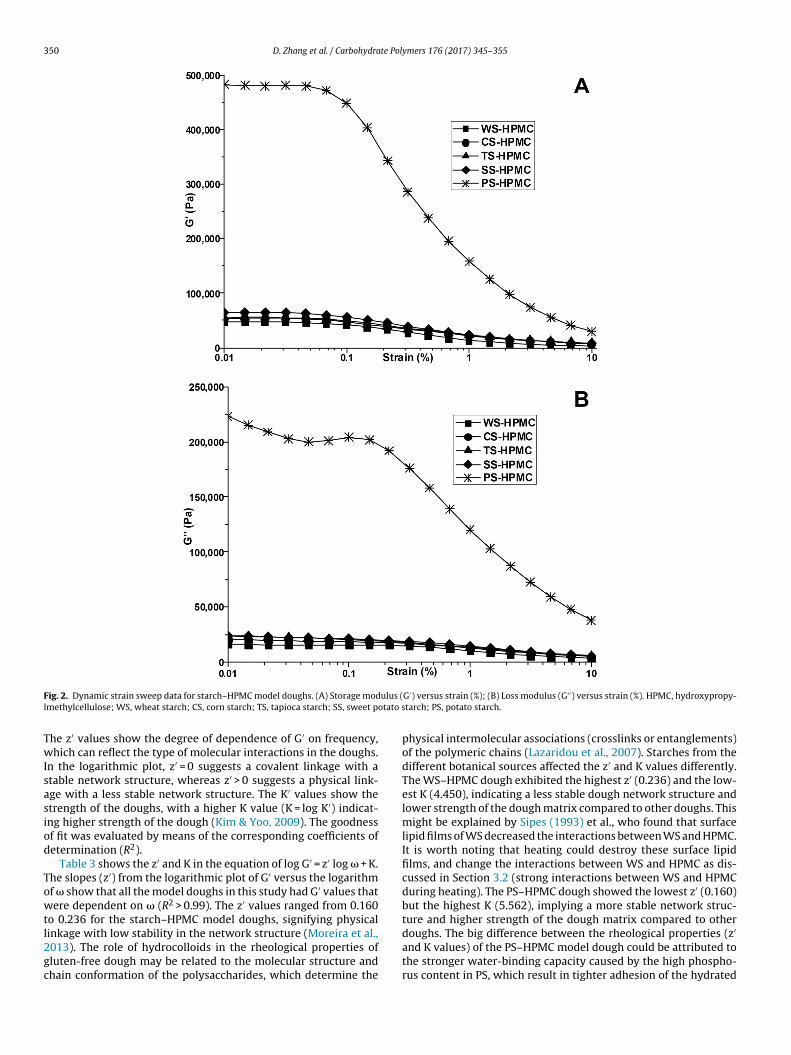
Fig. 3 shows the plot of the complex shear modulus |G*| andhe loss factor tan � as functions of temperature. The increase ofG*| during heating has been reported as being proportional to thetarch content of the dough, which indicates that the physicochem-cal changes in heated dough are essentially due to changes in thetarch fraction of the dough (Angioloni and Dalla Rosa, 2005). Dur-ng the initial stage of heating (from 25 to 60 ◦C), |G*| decreasedlowly because of the water swelling of the starch and HPMC, whichaused an increase of the dough volume and an initial softening ofhe doughs (Rosell et al., 2007). During this phase, the high |G*| inhe PS–HPMC dough (indicating higher dough intensity) decreaseduickly compared with that in the other model doughs, which coulde attributed to the larger PS granules and the relatively loose inter-al structure of PS (Martínez & Gómez, 2017). |G*| clearly increasedith increasing temperature (from 60 to 90 ◦C), and this represents
he onset of starch gelatinization. |G*| peaked (|G*|max) and thenecreased significantly during the rest of the temperature increaserom 60 to 90 ◦C. The higher |G*|max of the model doughs made with
S and CS compared to that of the other doughs indicates higheraximum intensity and the maximal structural hardening, which
ould prevent dough cracking caused by oven-spring in the earlytage of heating (Jekle et al., 2016). In the case of the WS–HPMCnd CS–HPMC model doughs, the higher |G*|max could be ascribedo the higher Wabs (as shown in Table 2) and amylose content (ashown in Table 1) of WS and CS. Amylose leached from the WSnd CS granules, forming sufficient network structure with HPMCn the presence of enough water. With increasing temperature,an � increased, peaked (tan �max), and then decreased. AlthoughS–HPMC model dough could prevent dough cracking (presentedigher |G*|max), a large viscosity drop (a substantial decrease of tan), which suggests that the CS–HPMC dough becomes fragile moreasily in the later stage of heating than the other doughs, result-
ng in a relatively loose structure in the final product; conversely,he performance of the SS– and WS–HPMC doughs clearly differedrom that of the CS–HPMC dough (Rojas, Rosell, & de Barber, 1999;lkku & Rha, 1978).otato starch. z′ , the degree of dependence of G′ on frequency sweep; K′ , the strengthaximum creep compliance; �0, the zero shear viscosity, Je/Jmax, the relative elasticompliance.
According to Jekle et al. (2016), tan �max can be used as a toolto identify the start of gelatinization, indicating the lowest struc-tural stability of the starch–HPMC dough, whereas |G*|max can beused as a tool to identify the peak gelatinization, indicating themaximal structural hardening of the doughs. The |G*|max and tan�max at different temperatures (T|G*|max and Ttan�max) are shownin Table 2. The model doughs made with SS showed the highestvalue of T|G*|max, suggesting the highest temperature to reach themaximal structural hardening (|G*|max). This could be attributed tothe higher content of water-soluble sugars in SS, including sucrose,glucose, and fructose, which increases the gelatinization tempera-ture of the dough (Kohyama & Nishinari, 2002). In the same way,chemical composition, the amylose/amylopectin ratio, and factorsrelated to the microstructural characteristics of the starch gran-ules should be considered to explain these phenomena (Galliard& Bowler, 1987)The gelatinization temperature of model doughscan also be obtained using the Mixolab apparatus by evaluating thedough temperature when C2 and C3 are achieved. Table 2 shows thetemperature when the torque reaches C2 and C3 (TC2 and TC3). TC2and TC3 reflect the onset and peak gelatinization of starch in modeldoughs, respectively. It is worth noting that Mixolab systemati-cally gave different TC2 and TC3 values relative to the measurementstaken by temperature sweep using a rheometer (TC2 and TC3 corre-spond to Ttan�max and T|G*|max, respectively). Although the doughexperienced the same temperature rise process (30 ◦C–90 ◦C) inthe determination of the Mixolab apparatus and the rheometer,however, the rheometer records the small deformation rheologicalproperties of the model doughs, which stay within the LVR lim-its of the model doughs, whereas the Mixolab apparatus recordsthe large deformation rheological properties of the model doughs,which exceed the LVR limits of the model doughs (Tronsmo et al.,2003). The Mixolab apparatus provides the measurement of the vis-cosity and strength changes of the dough, which is the macroscopicproperties of the dough. In comparison to the Mixolab apparatus,the rheometer provides the measurement of the microstructurechanges of the dough (including the gelatinization of the starchand the varying interactions between starch and HPMC). Althoughthe results obtained from the Mixolab apparatus confirmed thevarying interactions between different starch and HPMC duringheating as discussed in Section 3.2, the clear difference in the resultsobtained from the rheometer and the Mixolab apparatus indicatedthat the microstructure changes of the model doughs could not befully reflected by the variation of the macroscopic properties of thedough.
3.3.4. Creep and recovery measurementsCreep and recovery measurements were also made on the model
doughs. A stress of 250 MPa, which exceeds the LVR limits, wasapplied in all the measurements for 300 s, and is sufficient for thesample to reach steady-state flow as determined by the instru-ment software. The creep-recovery curves of starch–HPMC doughs

352 D. Zhang et al. / Carbohydrate Polymers 176 (2017) 345–355
F ss factW otato
efl
atcvgte1dr(ite
ig. 3. Effect of heating (5 ◦C/min) on (A) complex shear modulus (|G*|) and (B) loS, wheat starch; CS, corn starch; TS, tapioca starch; SS, sweet potato starch; PS, p
xhibited a typical viscoelastic behavior combining both viscousuid and elastic components (Sivaramakrishnan et al., 2004).
The creep–recovery curves of the starch–HPMC model doughsre shown in Supplementary Fig. 2. The parameters obtained fromhe creep–recovery curves are presented in Table 3. The maximumreep strain (Jmax) can be used to describe dough rigidity, and a pre-ious study found that strong dough, such as bread flour dough, hasreater resistance to deformation than softer doughs, such as pas-ry flour dough (Wang & Sun, 2002). The PS–HPMC model doughxhibited the highest deformation resistance (Jmax of 7.31 × 10⁻⁵
/Pa), followed successively by the SS–, TS–, and CS–HPMC modeloughs (Jmax of 21.3 × 10⁻⁵, 38.03 × 10⁻⁵ and 38.21 × 10⁻⁵ 1/Pa,espectively). The WS–HPMC dough showed the lowest resistanceJmax of 67.83 × 10⁻⁵ 1/Pa) among all the gluten-free model doughs
n this study. The starch in the model doughs acted as a rigid fillerhat helped to form the polysaccharide (HPMC) network (Hadna –devt al., 2014). The hydrocolloids form a barrier around the starchor (tan �) for starch–HPMC model doughs. HPMC, hydroxypropylmethylcellulose;starch.
granules for the hydration and flowability of the starch granules. Inthe presence of HPMC, the starch granules adhere to one another,and their mobility depends on the surface, shape, and size of thestarch, as well as the varying interactions between starch and HPMC(Jekle et al., 2016; Lazaridou et al., 2007). In this study, we observedthat the lower the z′ value (which signifies higher stability of thenetwork structure as discussed in Section 3.3.2), the higher the Jmax
value. This suggests that although many factors play a role in thedeference of the resistance to deformation of the model doughsmade with starches of different botanical origins, the resistanceto deformation mainly depends on the stability of the networkstructure.
Creep–recovery experiments may provide some insight intodough macrostructure. For example, the zero shear viscosity (� )
0gave the flowability of the model doughs at the end of appliedstress (250 MPa). As seen in Table 3, the SS–HPMC dough exhib-ited the highest �0, followed successively by the CS–, TS–, PS–,
D. Zhang et al. / Carbohydrate Polymers 176 (2017) 345–355 353
F S– (B)r ) as aT
amwtc(fiT(sibWPmw(
3
wfdrrs
ig. 4. The continuous distribution of spin–spin relaxation time of WS–, CS– (A), Telaxation time of WS–HPMC model dough was shown in every graph (A, B, C and DS, tapioca starch; SS, sweet potato starch; PS, potato starch.
nd WS–HPMC doughs. This suggests that it may be difficult toaintain the shape of gluten-free doughs made with SS and CS,hereas it may be easier for the WS– and PS–HPMC doughs to hold
heir shape. The higher the relative elastic part of maximum creepompliance (Je/Jmax), the higher the recovery capacity of the doughWang & Sun, 2002). WS–HPMC dough exhibited the highest Je/Jmax,ollowed successively by the TS–, CS–, SS– and PS–HPMC doughs,ndicating the decreasing order of the recovery capacity was WS–,S–, CS–, SS– and PS–HPMC doughs. In addition, higher viscosityJv/Jmax) means better stability to trap gas (Weipert, 1990). Thetarch–HPMC dough made with PS exhibited the highest Jv/Jmax,ndicating better stability against the rupture of the dough filmetween gas cells, followed successively by the SS–, CS–, TS–, andS–HPMC model doughs. The relatively higher Jv/Jmax value of the
S–HPMC model dough could be ascribed to the fact that PS poly-ers, with their high content of phosphorus, dissolve more easily inater during dough preparation, thus increasing dough stickiness
Hadna –dev et al., 2014).
.4. Moisture distribution analysis of the model doughs
The moisture distributions of the starch–HPMC model doughsere analyzed to further explore the mechanism of how the dif-
erent starches influence the rheological properties of gluten-free
oughs. Low-resolution 1H NMR has been used to measure T2elaxation times in starch–HPMC model doughs. Two spin–spinelaxation time constants, the first relaxation time (T21) and theecond relaxation time (T22), have been identified from the NMR, SS (C) and PS–HPMC (D) model doughs. The continuous distribution of spin–spin control. HPMC, hydroxypropylmethylcellulose; WS, wheat starch; CS, corn starch;
spectrum using the CPMG sequences. The existence of these timeconstants indicates that there are one or two fractions of water withdifferent relaxation rates (Chen, Long, Ruan, & Labuza, 1997).
Fig. 4 shows the continuous distribution of the spin–spin relax-ation time of the starch–HPMC doughs. Table 4 shows the spin–spinrelaxation time (T21, T22) and the amplitudes of the two compo-nents (A21, A22). T21 ranged from 2.10 to 5.17 ms, whereas T22ranged from 12.75 to 29.33 ms, corresponding to the different mois-ture distribution.
Many authors have studied the T2 distributions in starch–watermixtures (Chatakanonda et al., 2003; Choi & Kerr, 2003;Tananuwong & Reid, 2004; Tang, Brun, & Hills, 2001; Tang,Godward, & Hills, 2000) and gluten-containing doughs (Bosmanset al., 2012; Bushuk & Winkler, 1957; Willhoft, 1971). A previousstudy showed that two distinct regions of T2 distributions, T21 andT22 are usually observed in doughs, and these range from 2 to 5 msand from 10 to 100 ms, respectively (Bosmans et al., 2012). It isgenerally recognized that starch and gluten have different water-binding capacities. However, the location and mobility behaviorof water during dough preparation are still controversial. Bushukand Winkler (1957) reported that more water binds to starch thanto gluten, because of the higher water sorption capacity of starch.In contrast, Willhoft (1971) suggested that there is more waterassociated with gluten than with starch in doughs.
In the present study, we also observed two distinct regions
of T2 distributions at T21 (2–5 ms) and T22 (10–100 ms) in thestarch–HPMC model doughs, and starch and HPMC were the maincomponents influencing the mobility of water in the model doughs.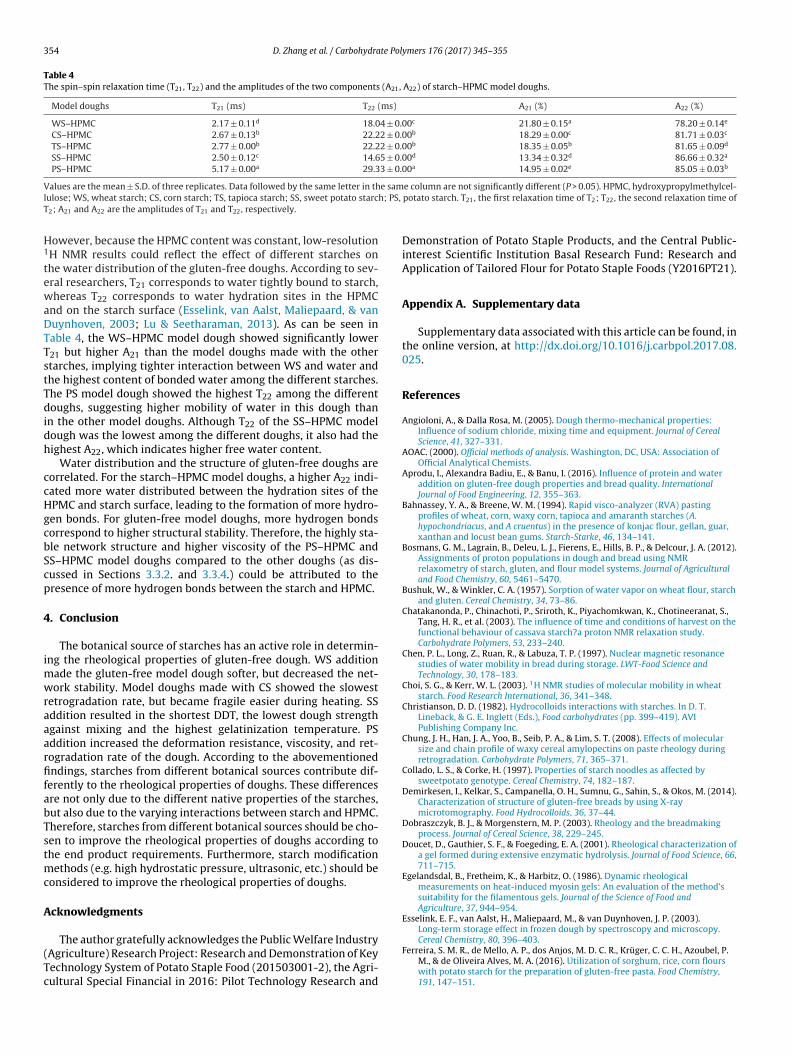
354 D. Zhang et al. / Carbohydrate Polymers 176 (2017) 345–355
Table 4The spin–spin relaxation time (T21, T22) and the amplitudes of the two components (A21, A22) of starch–HPMC model doughs.
Model doughs T21 (ms) T22 (ms) A21 (%) A22 (%)
WS–HPMC 2.17 ± 0.11d 18.04 ± 0.00c 21.80 ± 0.15a 78.20 ± 0.14e
CS–HPMC 2.67 ± 0.13b 22.22 ± 0.00b 18.29 ± 0.00c 81.71 ± 0.03c
TS–HPMC 2.77 ± 0.00b 22.22 ± 0.00b 18.35 ± 0.05b 81.65 ± 0.09d
SS–HPMC 2.50 ± 0.12c 14.65 ± 0.00d 13.34 ± 0.32d 86.66 ± 0.32a
PS–HPMC 5.17 ± 0.00a 29.33 ± 0.00a 14.95 ± 0.02e 85.05 ± 0.03b
V e saml h; PS,
T
H1
tewaDTTstTdidh
ccHgcbScp
4
imwraaarfifabTstmc
A
(Tc
alues are the mean ± S.D. of three replicates. Data followed by the same letter in thulose; WS, wheat starch; CS, corn starch; TS, tapioca starch; SS, sweet potato starc2; A21 and A22 are the amplitudes of T21 and T22, respectively.
owever, because the HPMC content was constant, low-resolutionH NMR results could reflect the effect of different starches onhe water distribution of the gluten-free doughs. According to sev-ral researchers, T21 corresponds to water tightly bound to starch,hereas T22 corresponds to water hydration sites in the HPMC
nd on the starch surface (Esselink, van Aalst, Maliepaard, & vanuynhoven, 2003; Lu & Seetharaman, 2013). As can be seen inable 4, the WS–HPMC model dough showed significantly lower21 but higher A21 than the model doughs made with the othertarches, implying tighter interaction between WS and water andhe highest content of bonded water among the different starches.he PS model dough showed the highest T22 among the differentoughs, suggesting higher mobility of water in this dough than
n the other model doughs. Although T22 of the SS–HPMC modelough was the lowest among the different doughs, it also had theighest A22, which indicates higher free water content.
Water distribution and the structure of gluten-free doughs areorrelated. For the starch–HPMC model doughs, a higher A22 indi-ated more water distributed between the hydration sites of thePMC and starch surface, leading to the formation of more hydro-en bonds. For gluten-free model doughs, more hydrogen bondsorrespond to higher structural stability. Therefore, the highly sta-le network structure and higher viscosity of the PS–HPMC andS–HPMC model doughs compared to the other doughs (as dis-ussed in Sections 3.3.2. and 3.3.4.) could be attributed to theresence of more hydrogen bonds between the starch and HPMC.
. Conclusion
The botanical source of starches has an active role in determin-ng the rheological properties of gluten-free dough. WS addition
ade the gluten-free model dough softer, but decreased the net-ork stability. Model doughs made with CS showed the slowest
etrogradation rate, but became fragile easier during heating. SSddition resulted in the shortest DDT, the lowest dough strengthgainst mixing and the highest gelatinization temperature. PSddition increased the deformation resistance, viscosity, and ret-ogradation rate of the dough. According to the abovementionedndings, starches from different botanical sources contribute dif-
erently to the rheological properties of doughs. These differencesre not only due to the different native properties of the starches,ut also due to the varying interactions between starch and HPMC.herefore, starches from different botanical sources should be cho-en to improve the rheological properties of doughs according tohe end product requirements. Furthermore, starch modification
ethods (e.g. high hydrostatic pressure, ultrasonic, etc.) should beonsidered to improve the rheological properties of doughs.
cknowledgments
The author gratefully acknowledges the Public Welfare IndustryAgriculture) Research Project: Research and Demonstration of Keyechnology System of Potato Staple Food (201503001-2), the Agri-ultural Special Financial in 2016: Pilot Technology Research and
e column are not significantly different (P > 0.05). HPMC, hydroxypropylmethylcel-potato starch. T21, the first relaxation time of T2; T22, the second relaxation time of
Demonstration of Potato Staple Products, and the Central Public-interest Scientific Institution Basal Research Fund: Research andApplication of Tailored Flour for Potato Staple Foods (Y2016PT21).
Appendix A. Supplementary data
Supplementary data associated with this article can be found, inthe online version, at http://dx.doi.org/10.1016/j.carbpol.2017.08.025.
References
Angioloni, A., & Dalla Rosa, M. (2005). Dough thermo-mechanical properties:Influence of sodium chloride, mixing time and equipment. Journal of CerealScience, 41, 327–331.
AOAC. (2000). Official methods of analysis. Washington, DC, USA: Association ofOfficial Analytical Chemists.
Aprodu, I., Alexandra Badiu, E., & Banu, I. (2016). Influence of protein and wateraddition on gluten-free dough properties and bread quality. InternationalJournal of Food Engineering, 12, 355–363.
Bahnassey, Y. A., & Breene, W. M. (1994). Rapid visco-analyzer (RVA) pastingprofiles of wheat, corn, waxy corn, tapioca and amaranth starches (A.hypochondriacus, and A cruentus) in the presence of konjac flour, gellan, guar,xanthan and locust bean gums. Starch-Starke, 46, 134–141.
Bosmans, G. M., Lagrain, B., Deleu, L. J., Fierens, E., Hills, B. P., & Delcour, J. A. (2012).Assignments of proton populations in dough and bread using NMRrelaxometry of starch, gluten, and flour model systems. Journal of Agriculturaland Food Chemistry, 60, 5461–5470.
Bushuk, W., & Winkler, C. A. (1957). Sorption of water vapor on wheat flour, starchand gluten. Cereal Chemistry, 34, 73–86.
Chatakanonda, P., Chinachoti, P., Sriroth, K., Piyachomkwan, K., Chotineeranat, S.,Tang, H. R., et al. (2003). The influence of time and conditions of harvest on thefunctional behaviour of cassava starch?a proton NMR relaxation study.Carbohydrate Polymers, 53, 233–240.
Chen, P. L., Long, Z., Ruan, R., & Labuza, T. P. (1997). Nuclear magnetic resonancestudies of water mobility in bread during storage. LWT-Food Science andTechnology, 30, 178–183.
Choi, S. G., & Kerr, W. L. (2003). 1H NMR studies of molecular mobility in wheatstarch. Food Research International, 36, 341–348.
Christianson, D. D. (1982). Hydrocolloids interactions with starches. In D. T.Lineback, & G. E. Inglett (Eds.), Food carbohydrates (pp. 399–419). AVIPublishing Company Inc.
Chung, J. H., Han, J. A., Yoo, B., Seib, P. A., & Lim, S. T. (2008). Effects of molecularsize and chain profile of waxy cereal amylopectins on paste rheology duringretrogradation. Carbohydrate Polymers, 71, 365–371.
Collado, L. S., & Corke, H. (1997). Properties of starch noodles as affected bysweetpotato genotype. Cereal Chemistry, 74, 182–187.
Demirkesen, I., Kelkar, S., Campanella, O. H., Sumnu, G., Sahin, S., & Okos, M. (2014).Characterization of structure of gluten-free breads by using X-raymicrotomography. Food Hydrocolloids, 36, 37–44.
Dobraszczyk, B. J., & Morgenstern, M. P. (2003). Rheology and the breadmakingprocess. Journal of Cereal Science, 38, 229–245.
Doucet, D., Gauthier, S. F., & Foegeding, E. A. (2001). Rheological characterization ofa gel formed during extensive enzymatic hydrolysis. Journal of Food Science, 66,711–715.
Egelandsdal, B., Fretheim, K., & Harbitz, O. (1986). Dynamic rheologicalmeasurements on heat-induced myosin gels: An evaluation of the method’ssuitability for the filamentous gels. Journal of the Science of Food andAgriculture, 37, 944–954.
Esselink, E. F., van Aalst, H., Maliepaard, M., & van Duynhoven, J. P. (2003).Long-term storage effect in frozen dough by spectroscopy and microscopy.
Cereal Chemistry, 80, 396–403.Ferreira, S. M. R., de Mello, A. P., dos Anjos, M. D. C. R., Krüger, C. C. H., Azoubel, P.M., & de Oliveira Alves, M. A. (2016). Utilization of sorghum, rice, corn flourswith potato starch for the preparation of gluten-free pasta. Food Chemistry,191, 147–151.
te Pol
G
G
H
H
I
J
K
K
K
K
K
L
L
L
M
M
M
M
M
O
P
P
P
D. Zhang et al. / Carbohydra
allagher, E., Gormley, T. R., & Arendt, E. K. (2004). Recent advances in theformulation of gluten-free cereal-based products. Trends in Food Science andTechnology, 15, 143–152.
alliard, T., & Bowler, P. (1987). Morphology and composition of starch. In T.Galliard (Ed.), Starch: Properties and potential. critical reports on appliedchemistry (pp. 54–78). New York: John Wiley and Sons.
adna –dev, T. D., Dokic, L. P., Hadna –dev, M. S., Pojic, M. M., & Torbica, A. M. (2014).Rheological and breadmaking properties of wheat flours supplemented withoctenyl succinic anhydride-modified waxy maize starches. Food and BioprocessTechnology, 7, 235–247.
ager, A. S., & Arendt, E. K. (2013). Influence of hydroxypropylmethylcellulose(HPMC), xanthan gum and their combination on loaf specific volume, crumbhardness and crumb grain characteristics of gluten-free breads based on rice,maize teff and buckwheat. Food Hydrocolloids, 32, 195–203.
CC Standards. (2008). Standard methods of the International Association for CerealScience and Technology. Vienna: ICC Standard, International Association forCereal Science and Technology.
ekle, M., Mühlberger, K., & Becker, T. (2016). Starch-gluten interactions duringgelatinization and its functionality in dough like model systems. FoodHydrocolloids, 54, 196–201.
ahraman, K., Sakıyan, O., Ozturk, S., Koksel, H., Sumnu, G., & Dubat, A. (2008).Utilization of mixolab® to predict the suitability of flours in terms of cakequality. European Food Research and Technology, 227, 565–570.
avanagh, G. M., & Ross-Murphy, S. B. (1998). Rheological characterisation ofpolymer gels. Progress in Polymer Science, 23, 533–562.
elly, C. P., Feighery, C. F., Gallagher, R. B., & Weir, D. G. (1990). Diagnosis andtreatment of gluten-sensitive enteropathy. Advances in Internal Medicine, 35,341–363.
im, W. W., & Yoo, B. (2009). Rheological behavior of acorn starch dispersions:Effects of concentration and temperature. International Journal of Food Scienceand Technology, 44, 503–509.
ohyama, K., & Nishinari, K. (2002). Effect of soluble sugars on gelatinization andretrogradation of sweet potato starch. Journal of Agricultural and FoodChemistry, 39, 1406–1410.
ópez, A. C. B., Pereira, A. J. G., & Junqueira, R. G. (2004). Flour mixture of rice flour,corn and cassava starch in the production of gluten-free white bread. BrazilianArchives of Biology and Technology, 47, 63–70.
azaridou, A., Duta, D., Papageorgiou, M., Belc, N., & Biliaderis, C. G. (2007). Effectsof hydrocolloids on dough rheology and bread quality parameters ingluten-free formulations. Journal of Food Engineering, 79, 1033–1047.
u, Z., & Seetharaman, K. (2013). 1H Nuclear magnetic resonance (NMR) anddifferential scanning calorimetry (DSC) studies of water mobility in doughsystems containing barley flour. Cereal Chemistry, 90, 120–126.
ancebo, C. M., Merino, C., Martínez, M. M., & Gómez, M. (2015). Mixture design ofrice flour, maize starch and wheat starch for optimization of gluten free breadquality. Journal of Food Science and Technology, 52, 1–11.
ancebo, C. M., Picón, J., & Gómez, M. (2015). Effect of flour properties on thequality characteristics of gluten free sugar-snap cookies. LWT-Food Science andTechnology, 64, 264–269.
ariotti, M., Pagani, M. A., & Lucisano, M. (2013). The role of buckwheat and hpmcon the breadmaking properties of some commercial gluten-free breadmixtures. Food Hydrocolloids, 30, 393–400.
artínez, M. M., & Gómez, M. (2017). Rheological and microstructural evolution ofthe most common gluten-free flours and starches during bread fermentationand baking. Journal of Food Engineering, 197, 78–86.
oreira, R., Chenlo, F., & Torres, M. D. (2013). Rheology of gluten-free doughs fromblends of chestnut and rice flours. Food and Bioprocess Technology, 6,1476–1485.
lkku, J., & Rha, C. K. (1978). Gelatinisation of starch and wheat flour starch—Areview. Food Chemistry, 3, 293–317.
etrofsky, K. E., & Hoseney, R. C. (1995). Rheological properties of dough madewith starch and gluten from several cereal sources. Cereal Chemistry, 72, 53–58.
han-Thien, N., & Safari-Ardi, M. (1998). Linear viscoelastic properties of
flour-water doughs at different water concentrations. Journal ofNon-Newtonian Fluid Mechanics, 74, 137–150.han-Thien, N., Safari-Ardi, M., & Morales-Patino, A. (1997). Oscillatory and simpleshear flows of a flour-water dough: A constitutive model. Rheologica Acta, 36,38–48.
ymers 176 (2017) 345–355 355
Pongjaruvat, W., Methacanon, P., Seetapan, N., Fuongfuchat, A., & Gamonpilas, C.(2014). Influence of pregelatinised tapioca starch and transglutaminase ondough rheology and quality of gluten-free jasmine rice breads. FoodHydrocolloids, 36, 143–150.
Renard, D., van de Velde, F., & Visschers, R. W. (2006). The gap between food gelstructure, texture and perception. Food Hydrocolloids, 20, 423–431.
Rojas, J. A., Rosell, C. M., & de Barber, C. B. (1999). Pasting properties of differentwheat flour-hydrocolloid systems. Food Hydrocolloids, 13, 27–33.
Ronda, F., Gómez, M., Caballero, P. A., Oliete, B., & Blanco, C. A. (2009).Improvement of quality of gluten-free layer cakes. Food Science and TechnologyInternational, 15, 193–202.
Rosell, C. M., Collar, C., & Haros, M. (2007). Assessment of hydrocolloid effects onthe thermo-mechanical properties of wheat using the Mixolab. FoodHydrocolloids, 21, 452–462.
Schofield, R. K., & Blair, G. W. S. (1933). The relationship between viscosity, elasticityand plastic strength of soft materials as illustrated by some mechanical propertiesof flour doughs. III. 72-85: Royal Society of London Proceedings.
Shi, X., & Bemiller, J. N. (2002). Effects of food gums on viscosities of starchsuspensions during pasting. Carbohydrate Polymers, 50, 7–18.
Singh, H., & MacRitchie, F. (2001). Application of polymer science to properties ofgluten. Journal of Cereal Science, 33, 231–243.
Sipes, K. K. (1993). Factors affecting protein and starch interaction Doctoraldissertation. Manhattan, KS: Kansas State University.
Sivaramakrishnan, H. P., Senge, B., & Chattopadhyay, P. K. (2004). Rheologicalproperties of rice dough for making rice bread. Journal of Food Engineering, 62,37–45.
Swinkels, J. J. M. (1985). Composition and properties of commercial nativestarches. Starch–Stärke, 37, 1–5.
Tananuwong, K., & Reid, D. S. (2004). Differential scanning calorimetry study ofglass transition in frozen starch gels. Journal of Agricultural and Food Chemistry,52, 4308–4317.
Tang, H. R., Godward, J., & Hills, B. (2000). The distribution of water in native starchgranules—A multinuclear NMR study. Carbohydrate Polymers, 43, 375–387.
Tang, H. R., Brun, A., & Hills, B. (2001). A proton NMR relaxation study of thegelatinization and acid hydrolysis of native potato starch. CarbohydratePolymers, 46, 7–18.
Tipples, K., Appolonia, B., Dirks, B., Hert, R., Kite, F., Matsuo, R., et al. (1980). Theamylograph handbook. In W. C. Shuey, & K. H. Tipples (Eds.), AmericanAssociation of Cereal Chemists (pp. 12–24). Minnesota: Saint Paul.
Tronsmo, K. M., Magnus, E. M., Baardseth, P., Schofield, J. D., Aamodt, A., &Færgestad, E. M. (2003). Comparison of small and large deformation rheologicalproperties of wheat dough and gluten. Cereal Chemistry, 80, 587–595.
Van Bockstaele, F., de Leyn, I., Eeckhout, M., & Dewettinck, K. (2011). Non-linearcreep-recovery measurements as a tool for evaluating the viscoelasticproperties of wheat flour dough. Journal of Food Engineering, 107, 50–59.
Wach, R. A., Mitomo, H., Yoshii, F., & Kume, T. (2002). Hydrogel ofradiation-induced cross-linked hydroxypropylcellulose. MacromolecularMaterials and Engineering, 287, 285–295.
Wang, F. C., & Sun, X. S. (2002). Creep-Recovery of wheat flour doughs andrelationship to other physical dough tests and breadmaking performance.Cereal Chemistry, 79, 567–571.
Weipert, D. (1990). The benefits of basic rheometry in studying dough rheology.Cereal Chemistry, 67, 311–317.
Willhoft, E. M. A. (1971). Bread staling: I. Experimental study. Journal of the Scienceof Food and Agriculture, 22, 176–180.
Witczak, T., Juszczak, L., Ziobro, R., & Korus, J. (2016). Rheology of gluten-freedough and physical characteristics of bread with potato protein. Journal of FoodProcess Engineering, 2016 http://dx.doi.org/10.1111/jfpe.12491
Xie, F., Yu, L., Su, B., Liu, P., Wang, J., Liu, H., et al. (2009). Rheological properties ofstarches with different amylose/amylopectin ratios. Journal of Cereal Science,49, 371–377.
Yuan, J., Jiang, X., Hu, S., Gao, J., & Chen, H. (2015). Recent advances in celiacdisease. Journal of Food Safety and Quality, 6, 4510–4515 [in Chinese]
Zaidul, I. S. M., Norulaini, N. N., Omar, A. M., Yamauchi, H., & Noda, T. (2007). RVA
analysis of mixtures of wheat flour and potato, sweet potato, yam, and cassavastarches. Carbohydrate Polymers, 69, 784–791.Zaidul, I. S. M., Yamauchi, H., Kim, S. J., Hashimoto, N., & Noda, T. (2007). RVA studyof mixtures of wheat flour and potato starches with different phosphoruscontents. Food Chemistry, 102, 1105–1111.