Embed Size (px)
Citation preview
Submitted 15 February 2017Accepted 11 May 2017Published 30 May 2017
Corresponding authorMoju Cao, [email protected]
Academic editorEiji Nambara
Additional Information andDeclarations can be found onpage 18
DOI 10.7717/peerj.3408
Copyright2017 Li et al.
Distributed underCreative Commons CC-BY 4.0
OPEN ACCESS
Comparative transcriptome analysis ofisonuclear-alloplasmic lines unmask keytranscription factor genes and metabolicpathways involved in sterility of maizeCMS-CChuan Li*, Zhuofan Zhao*, Yongming Liu, Bing Liang, Shuxian Guan,Hai Lan, Jing Wang, Yanli Lu and Moju CaoMaize Research Institute, Sichuan Agricultural University, Chengdu, Sichuan, P.R. ChinaKey Laboratory of Biology and Genetic Improvement of Maize in Southwest Region, Ministry of Agriculture,Chengdu, Sichuan, P.R. China
*These authors contributed equally to this work.
ABSTRACTAlthough C-type cytoplasmic male sterility (CMS-C) is one of the most attractivetools for maize hybrid seed production, the detailed regulation network of the malesterility remains unclear. In order to identify theCMS-C sterility associated genes and/orpathways, the comparison of the transcriptomes between the CMS-C line C48-2 andits isonuclear-alloplasmic maintainer line N48-2 at pollen mother cell stage (PS), anearly development stage of microspore, and mononuclear stage (MS), an abortive stageof microspore, were analyzed. 2,069 differentially expressed genes (DEGs) between thetwo stages were detected and thought to be essential for the spikelet development ofN48-2. 453 of the 2,069 DEGs were differentially expressed at MS stage between thetwo lines and thought to be participated in the process or the causes of microsporeabortion. Among the 453 DEGs, 385 (84.99%) genes were down-regulated and only68 (15.01%) genes were up-regulated in C48-2 at MS stage. The dramatic decreasedexpression of the fourDEGs encodingMYB transcription factors and theDEGs involvedin ‘‘polyamine metabolic process’’, ‘‘Cutin, suberine and wax biosynthesis’’, ‘‘Fatty acidelongation’’, ‘‘Biosynthesis of unsaturated fatty acids’’ and ‘‘Prolinemetabolism’’ mightplay an important role in the sterility of C48-2. This studywill point out some directionsfor detailedmolecular analysis and better understanding of sterility of CMS-C inmaize.
Subjects Agricultural Science, Genetics, Genomics, Molecular Biology, Plant ScienceKeywords Cytoplasmic male sterility, RNA-seq, Differentially expressed gene, Transcriptionfactor, Metabolic pathway, Maize
INTRODUCTIONPlant cytoplasmic male sterility (CMS), a maternally inherited trait that resulted in theinability to produce functional pollen, is on the account of the inability to establish acoordinated interaction between the organellar and nuclear genomes (Fujii & Toriyama,2008). Many of these defects can be restored by nuclear-encoded fertility restorer genes
How to cite this article Li et al. (2017), Comparative transcriptome analysis of isonuclear-alloplasmic lines unmask key transcription fac-tor genes and metabolic pathways involved in sterility of maize CMS-C. PeerJ 5:e3408; DOI 10.7717/peerj.3408
known as restorer-of-fertility (Rf ) (Chase, 2007). CMS-Rf system circumvents the time-consuming and costly emasculation work in the production of hybrid seeds, therebyencouraging the system to generate F1 progenies in different field crops, such as rice,sorghum, sunflower and so on (Bohra et al., 2016). Maize male-sterile cytotype hasbeen classified into three major groups, i.e., T (Texas), S (USDA), and C (Charrua),by their response to specific lines (Beckett, 1971). T cytotype is no longer widely usedcommercially in hybrid seed production due to its vulnerability to a fungal pathogenBipolaris (Helminthosporium) maydis race T that causes southern corn leaf blight (Beckett,1971;Wise et al., 1999). The commercial utilization of S cytotype is also negatively affectedby the unstable fertility of CMS (Weider et al., 2009). CMS-C is today the most widelyapplied type of CMS for the production of hybrid seeds in maize due to the resistance tosouthern corn leaf blight and the stability of sterility (Sofi, Rather & Wani, 2007).
The analysis on molecular basis of maize CMS-C has a long history. Forde & Leaver(1980) previously demonstrated that there are differences in themitochondrial polypeptidessynthesis between the C and T or normal cytotype, but the functions of these polypeptideswere not identified. Three chimeric genes (atp9-C, cox II -C, and atp6-C) that uniquelyassociated with the maize C cytotype were founded (Dewey, Timothy & Levings, 1991).From the aspect of whole mitochondrial genome, some potentially functional genes andopen reading frames (ORFs) including the CMS associated chimeric ORFs had beenidentified (Allen et al., 2007). The evidence of how these genes and/or ORFs results in malesterility have not been obtained. At the transcriptome level, the CMS cytotype affectingthe globe gene expression patterns were analyzed and some potential key genes andmetabolism pathways associated with CMS were discussed in cotton (Yang, Han & Huang,2014), soybean (Li et al., 2015), rice (Fujii, Komatsu & Toriyama, 2007; Hu et al., 2016),radish (Mei, Liu & Wang, 2016) and welsh onion (Liu et al., 2016). But the relationshipsbetween the maize C cytotype and the CMS remain unknown.
Chase (2007) suggested that isonuclear-alloplasmic CMS lines provide a window forthe insights of cytoplasm-nucleus communication and is an ideal model for discoveringthe genes that are essential to pollen sterility. Here, genome-wide comparison of thetranscriptome at different microspore development stages between the CMS-C line C48-2and its isonuclear-alloplasmic maintainer line N48-2 were analyzed using RNA-seq. Itwill provide information on how the C cytotype affects the nuclear gene expression, andpromote the elucidation of the genetic components and retrograde response pathwayspossibly involved in the sterility of CMS-C, then assist the utilization of CMS-C in maizehybrid breeding.
MATERIALS AND METHODSPlant materialsThe maize CMS-C line C48-2 (C means the C cytotype) was obtained by successivebackcrossing using N48-2 (N means the normal cytotype) as the male donor for more thaneight generations (Fig. S1A). The two lines were cultivated in the same experimental plotin Sichuan Agriculture University (Chengdu, Sichuan Province, China). Three biological
Li et al. (2017), PeerJ, DOI 10.7717/peerj.3408 2/23
replicates of each line were planted at every two days, and each replicate was planted inthree-row plots with 42 individual plants. Maize inflorescences are composed of spikeletswhich contain two florets, an upper and a lower one. The anthers in the upper floretdevelop 2–3 days ahead of the 3 anthers in the lower floret (Hsu, Huang & Peterson, 1988).In order to reconcile this developmental discrepancy, the lower florets were discarded andthe rest of the spikelet were used for sample preparation.
Samples preparation for qRT-PCR of transcriptional factorsUpper florets at different development stages were crushed by dissecting needles and dyedwith carbol fuchsin stains, then observed by optical microscope (Leica DM1000) (Fig.S1C). Spikelets of ten independent plants at different microspore developmental stages,i.e., pollen mother cell stage (PS), dyad stage (DS), tetrad stage (TS) and mononuclearstage (MS), were collected and pooled respectively, and snap-frozen in liquid nitrogen andkept at −80 ◦C for RNA extraction.
Samples preparation for RNA-seqThe spikelets at PS stage and MS stage were sampled and pooled from ten individual tasselsof each plot respectively, and snap-frozen in liquid nitrogen and kept at −80 ◦C for RNAextraction. Three biological replicate samples were collected respectively and used forRNA-seq.
RNA extractionTotal RNA was isolated using TRizol kit (invitrogen, USA) and purified using mRNApurification kit (Promega, USA) following the manufacturer’s protocol. An Ultra-microspectrophotometer NanoDrop 2000 (Thermo Fisher Scientific, USA) was usedto detect total RNA concentration and purity.
cDNA library construction and RNA-seqThe mRNA-enriched RNAs were broken into short pieces with the fragmentation buffer.The short pieces and random hexamer primers were used for the synthesis of the firststrands of cDNAs. The second-strand cDNAs were synthesized using the Second StrandSynthesis Reaction Buffer and the Second Strand Synthesis Enzyme Mix from NEBNext R©
UltraTM RNA Library Prep Kit for Illumina (NEB, USA). Short fragments were purifiedwith AMPure XP Beads (Agencourt, USA) for end repair and tailing A. A-tailed fragmentswere mixed with NEBNext Adaptor and Blunt/TA Ligase Master Mix for adaptor ligation.Finally, the sequencing libraries were constructed following PCR amplification with theseadaptor-ligated fragments. Agilent 2100 Bioanalyzer and ABI StepOnePlusTM Real-TimePCR System were used for the quantification of the cDNA library. Paired-end sequencingwas performed on the Illumina HiSeq 4000 sequencing platform. RNA-seq were completedby Beijing Annoroad Gene Technology Co., LTD (China).
Read processing and mappingAll sequencing data were first processed by trimming adapter sequences, removing higherN rate (>10%) sequences and filtering low-quality reads (the ratio of the bases with qualityvalueQ≤ 5 greater than 50%)using the SOAPnuke software (http://soap.genomics.org.cn/)
Li et al. (2017), PeerJ, DOI 10.7717/peerj.3408 3/23
developedbyBGIA.The remaining clean readsweremapped tomaize B73 reference genome(RefGen_v3) and genes using BWA (version 0.7.10-r789) (Li & Durbin, 2009) and Bowtie2(version 2.2.5) (Langmead & Salzberg, 2012), respectively.
Gene expression analysis and identification of DEGsThe Bowtie2 aligner was used to map the clean reads on the genes and all the uniquelymapped reads were transformed into FPKM (fragments per kilobase of exon model permillion mapped reads) using RSEM tool to estimate transcript expression levels in allsamples (Li & Dewey, 2011). DESeq2 package (version 1.14.1) was applied to detect DEGsbetween each chosen sample pairs (Love, Huber & Anders, 2014). The results of all statisticaltests were corrected for multiple testing using the Benjamini–Hochberg False DiscoveryRate (FDR≤ 0.001) (Benjamini & Yekutieli, 2001) and |Log2FC| ≥ 1 (FC = fold change).
GO annotation and KEGG enrichment pathway analysisGene Ontology (GO) and functional enrichment analysis were conducted on allidentified DEGs as described (Ashburner et al., 2000). Kyoto Encyclopedia of Genesand Genomes (KEGG) analysis utilizes hypergeometric test to search DEGs that aresignificantly enriched in certain KEGG pathways compared with other genes in thegenome. GO::TermFinder (Module Version: 0.86, http://search.cpan.org/dist/GO-TermFinder/lib/GO/TermFinder.pm) was used for accessing GO information and findingsignicicantly enriched GO terms (Boyle et al., 2004). KOBAS 2.0 (Xie et al., 2011) andKEGG database (http://www.genome.jp/kegg/genes.html) were used for KEGG analysis.GO categories with corrected P value ≤ 0.05 and KEGG pathways with Q value (P valueafter multiple hypothesis testing correction with a range between 0 and 1) ≤ 0.05 weredefined as significantly enriched.
qRT-PCR analysiscDNA was synthesized using PrimeScript RT Master Mix Kit (Takara, Japan)following the protocols. Gene-specific primers were designed with Primer-BLAST(http://www.ncbi.nlm.nih.gov/tools/primer-blast/). The primer sequence of DEGs andthe control gene were listed in Table S1. qRT-PCR were carried out using an CFX96Real-Time PCR Detection System (Bio-Rad, USA). The mixed solution of each qRT-PCRreaction contained 1.0 µL of cDNA template, 1.0 µL of 10 µmol/L forward and reverseprimers each, and 5 µL of SYBR Premix Ex Taq II (Takara, Japan) in a final volume of10 µL. PCRs were implemented as follows: 95 ◦C for 2 min, followed by 40 cycles of95 ◦C for 10 s, 60 ◦C for 30 s. qRT-PCR was performed with three replicates for eachsample. Quantification cycle (Cq) was used for the determination of relative expresssionlevels normalized to reference genes. 18S was used as a reference gene for qRT-PCR oftranscriptional factors, and Actin was used as a reference gene for verification of RNA-seqresults.
Li et al. (2017), PeerJ, DOI 10.7717/peerj.3408 4/23
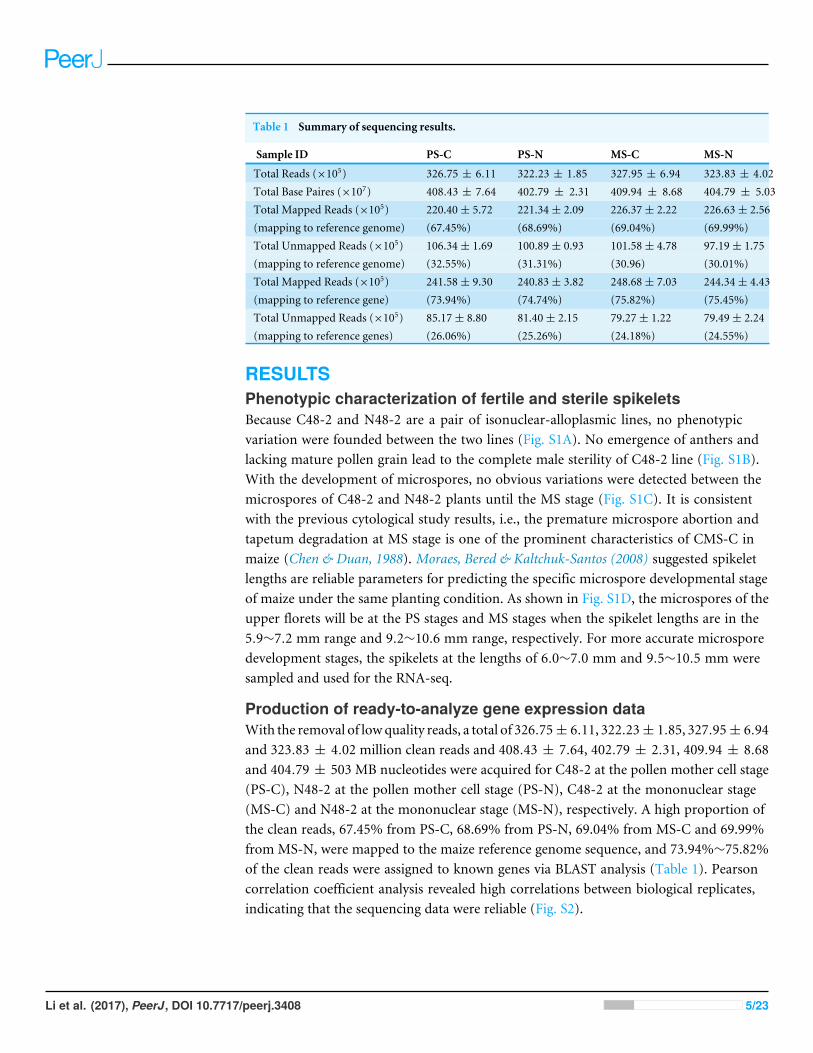
Table 1 Summary of sequencing results.
Sample ID PS-C PS-N MS-C MS-N
Total Reads (×105) 326.75 ± 6.11 322.23 ± 1.85 327.95 ± 6.94 323.83 ± 4.02Total Base Paires (×107) 408.43 ± 7.64 402.79 ± 2.31 409.94 ± 8.68 404.79 ± 5.03Total Mapped Reads (×105) 220.40± 5.72 221.34± 2.09 226.37± 2.22 226.63± 2.56(mapping to reference genome) (67.45%) (68.69%) (69.04%) (69.99%)Total Unmapped Reads (×105) 106.34± 1.69 100.89± 0.93 101.58± 4.78 97.19± 1.75(mapping to reference genome) (32.55%) (31.31%) (30.96) (30.01%)Total Mapped Reads (×105) 241.58± 9.30 240.83± 3.82 248.68± 7.03 244.34± 4.43(mapping to reference gene) (73.94%) (74.74%) (75.82%) (75.45%)Total Unmapped Reads (×105) 85.17± 8.80 81.40± 2.15 79.27± 1.22 79.49± 2.24(mapping to reference genes) (26.06%) (25.26%) (24.18%) (24.55%)
RESULTSPhenotypic characterization of fertile and sterile spikeletsBecause C48-2 and N48-2 are a pair of isonuclear-alloplasmic lines, no phenotypicvariation were founded between the two lines (Fig. S1A). No emergence of anthers andlacking mature pollen grain lead to the complete male sterility of C48-2 line (Fig. S1B).With the development of microspores, no obvious variations were detected between themicrospores of C48-2 and N48-2 plants until the MS stage (Fig. S1C). It is consistentwith the previous cytological study results, i.e., the premature microspore abortion andtapetum degradation at MS stage is one of the prominent characteristics of CMS-C inmaize (Chen & Duan, 1988). Moraes, Bered & Kaltchuk-Santos (2008) suggested spikeletlengths are reliable parameters for predicting the specific microspore developmental stageof maize under the same planting condition. As shown in Fig. S1D, the microspores of theupper florets will be at the PS stages and MS stages when the spikelet lengths are in the5.9∼7.2 mm range and 9.2∼10.6 mm range, respectively. For more accurate microsporedevelopment stages, the spikelets at the lengths of 6.0∼7.0 mm and 9.5∼10.5 mm weresampled and used for the RNA-seq.
Production of ready-to-analyze gene expression dataWith the removal of lowquality reads, a total of 326.75± 6.11, 322.23± 1.85, 327.95± 6.94and 323.83 ± 4.02 million clean reads and 408.43 ± 7.64, 402.79 ± 2.31, 409.94 ± 8.68and 404.79 ± 503 MB nucleotides were acquired for C48-2 at the pollen mother cell stage(PS-C), N48-2 at the pollen mother cell stage (PS-N), C48-2 at the mononuclear stage(MS-C) and N48-2 at the mononuclear stage (MS-N), respectively. A high proportion ofthe clean reads, 67.45% from PS-C, 68.69% from PS-N, 69.04% from MS-C and 69.99%from MS-N, were mapped to the maize reference genome sequence, and 73.94%∼75.82%of the clean reads were assigned to known genes via BLAST analysis (Table 1). Pearsoncorrelation coefficient analysis revealed high correlations between biological replicates,indicating that the sequencing data were reliable (Fig. S2).
Li et al. (2017), PeerJ, DOI 10.7717/peerj.3408 5/23
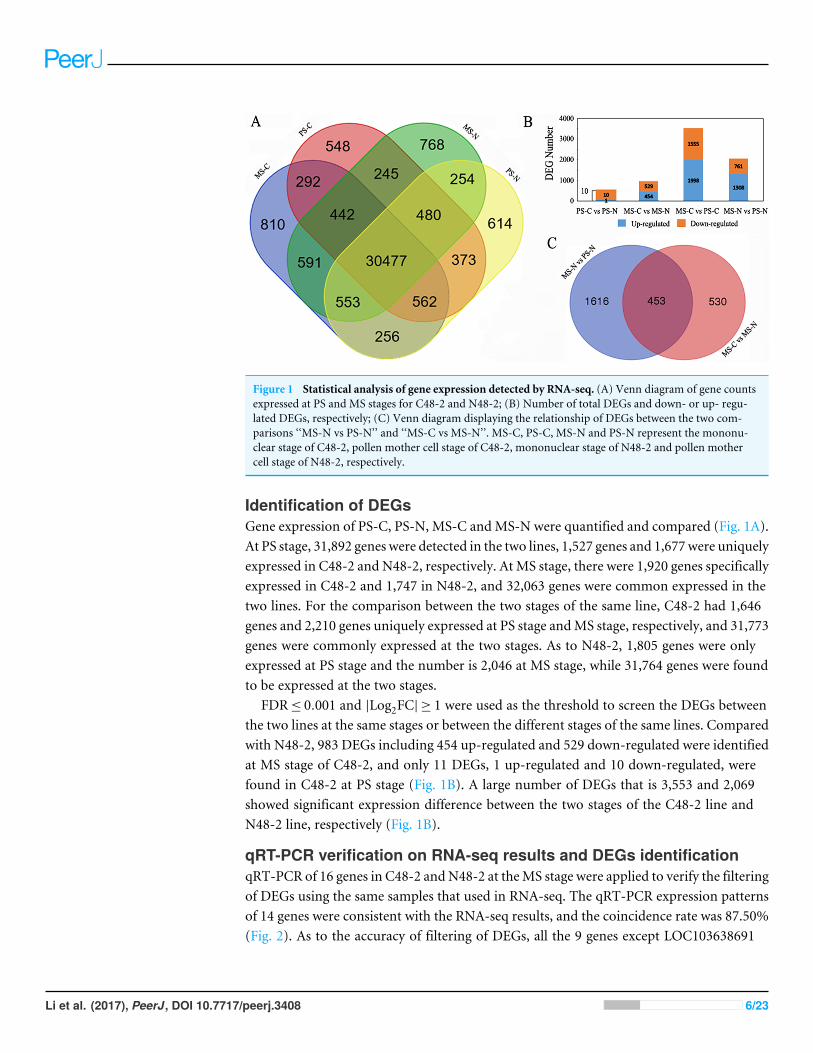
Figure 1 Statistical analysis of gene expression detected by RNA-seq. (A) Venn diagram of gene countsexpressed at PS and MS stages for C48-2 and N48-2; (B) Number of total DEGs and down- or up- regu-lated DEGs, respectively; (C) Venn diagram displaying the relationship of DEGs between the two com-parisons ‘‘MS-N vs PS-N’’ and ‘‘MS-C vs MS-N’’. MS-C, PS-C, MS-N and PS-N represent the mononu-clear stage of C48-2, pollen mother cell stage of C48-2, mononuclear stage of N48-2 and pollen mothercell stage of N48-2, respectively.
Identification of DEGsGene expression of PS-C, PS-N, MS-C andMS-N were quantified and compared (Fig. 1A).At PS stage, 31,892 genes were detected in the two lines, 1,527 genes and 1,677were uniquelyexpressed in C48-2 and N48-2, respectively. At MS stage, there were 1,920 genes specificallyexpressed in C48-2 and 1,747 in N48-2, and 32,063 genes were common expressed in thetwo lines. For the comparison between the two stages of the same line, C48-2 had 1,646genes and 2,210 genes uniquely expressed at PS stage andMS stage, respectively, and 31,773genes were commonly expressed at the two stages. As to N48-2, 1,805 genes were onlyexpressed at PS stage and the number is 2,046 at MS stage, while 31,764 genes were foundto be expressed at the two stages.
FDR≤ 0.001 and |Log2FC| ≥ 1 were used as the threshold to screen the DEGs betweenthe two lines at the same stages or between the different stages of the same lines. Comparedwith N48-2, 983 DEGs including 454 up-regulated and 529 down-regulated were identifiedat MS stage of C48-2, and only 11 DEGs, 1 up-regulated and 10 down-regulated, werefound in C48-2 at PS stage (Fig. 1B). A large number of DEGs that is 3,553 and 2,069showed significant expression difference between the two stages of the C48-2 line andN48-2 line, respectively (Fig. 1B).
qRT-PCR verification on RNA-seq results and DEGs identificationqRT-PCR of 16 genes in C48-2 andN48-2 at theMS stage were applied to verify the filteringof DEGs using the same samples that used in RNA-seq. The qRT-PCR expression patternsof 14 genes were consistent with the RNA-seq results, and the coincidence rate was 87.50%(Fig. 2). As to the accuracy of filtering of DEGs, all the 9 genes except LOC103638691
Li et al. (2017), PeerJ, DOI 10.7717/peerj.3408 6/23
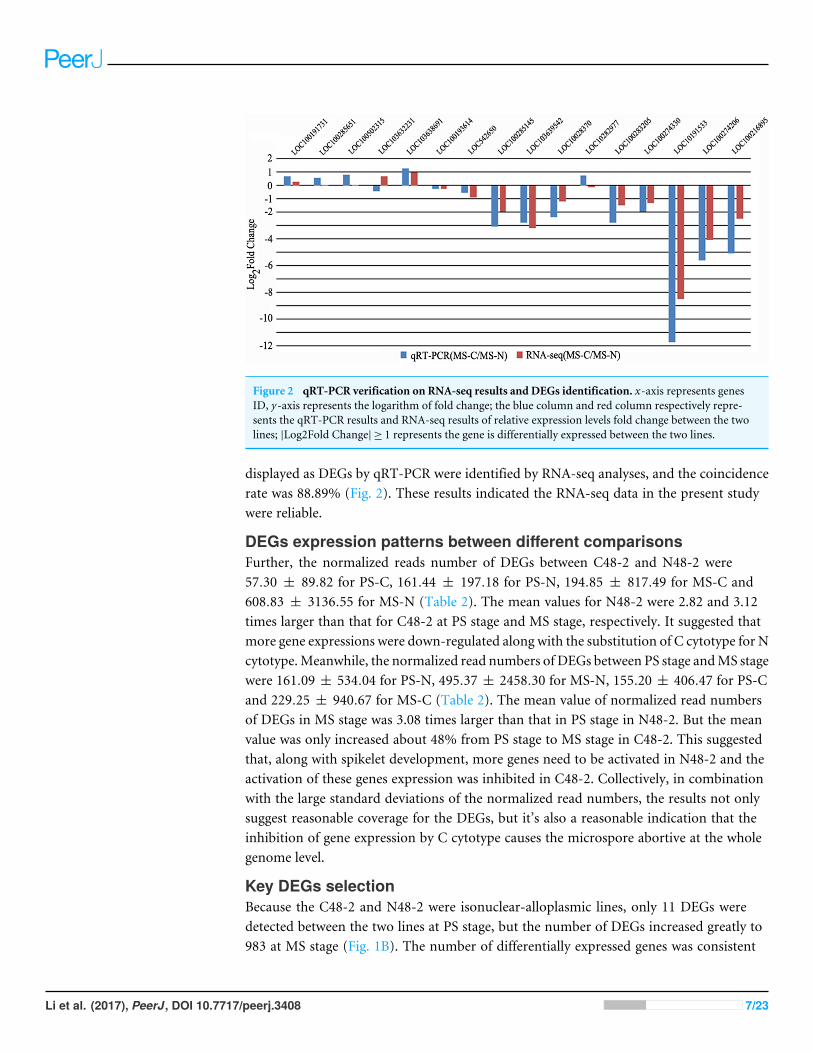
Figure 2 qRT-PCR verification on RNA-seq results and DEGs identification. x-axis represents genesID, y-axis represents the logarithm of fold change; the blue column and red column respectively repre-sents the qRT-PCR results and RNA-seq results of relative expression levels fold change between the twolines; |Log2Fold Change| ≥ 1 represents the gene is differentially expressed between the two lines.
displayed as DEGs by qRT-PCR were identified by RNA-seq analyses, and the coincidencerate was 88.89% (Fig. 2). These results indicated the RNA-seq data in the present studywere reliable.
DEGs expression patterns between different comparisonsFurther, the normalized reads number of DEGs between C48-2 and N48-2 were57.30 ± 89.82 for PS-C, 161.44 ± 197.18 for PS-N, 194.85 ± 817.49 for MS-C and608.83 ± 3136.55 for MS-N (Table 2). The mean values for N48-2 were 2.82 and 3.12times larger than that for C48-2 at PS stage and MS stage, respectively. It suggested thatmore gene expressions were down-regulated along with the substitution of C cytotype for Ncytotype.Meanwhile, the normalized read numbers of DEGs between PS stage andMS stagewere 161.09 ± 534.04 for PS-N, 495.37 ± 2458.30 for MS-N, 155.20 ± 406.47 for PS-Cand 229.25 ± 940.67 for MS-C (Table 2). The mean value of normalized read numbersof DEGs in MS stage was 3.08 times larger than that in PS stage in N48-2. But the meanvalue was only increased about 48% from PS stage to MS stage in C48-2. This suggestedthat, along with spikelet development, more genes need to be activated in N48-2 and theactivation of these genes expression was inhibited in C48-2. Collectively, in combinationwith the large standard deviations of the normalized read numbers, the results not onlysuggest reasonable coverage for the DEGs, but it’s also a reasonable indication that theinhibition of gene expression by C cytotype causes the microspore abortive at the wholegenome level.
Key DEGs selectionBecause the C48-2 and N48-2 were isonuclear-alloplasmic lines, only 11 DEGs weredetected between the two lines at PS stage, but the number of DEGs increased greatly to983 at MS stage (Fig. 1B). The number of differentially expressed genes was consistent
Li et al. (2017), PeerJ, DOI 10.7717/peerj.3408 7/23
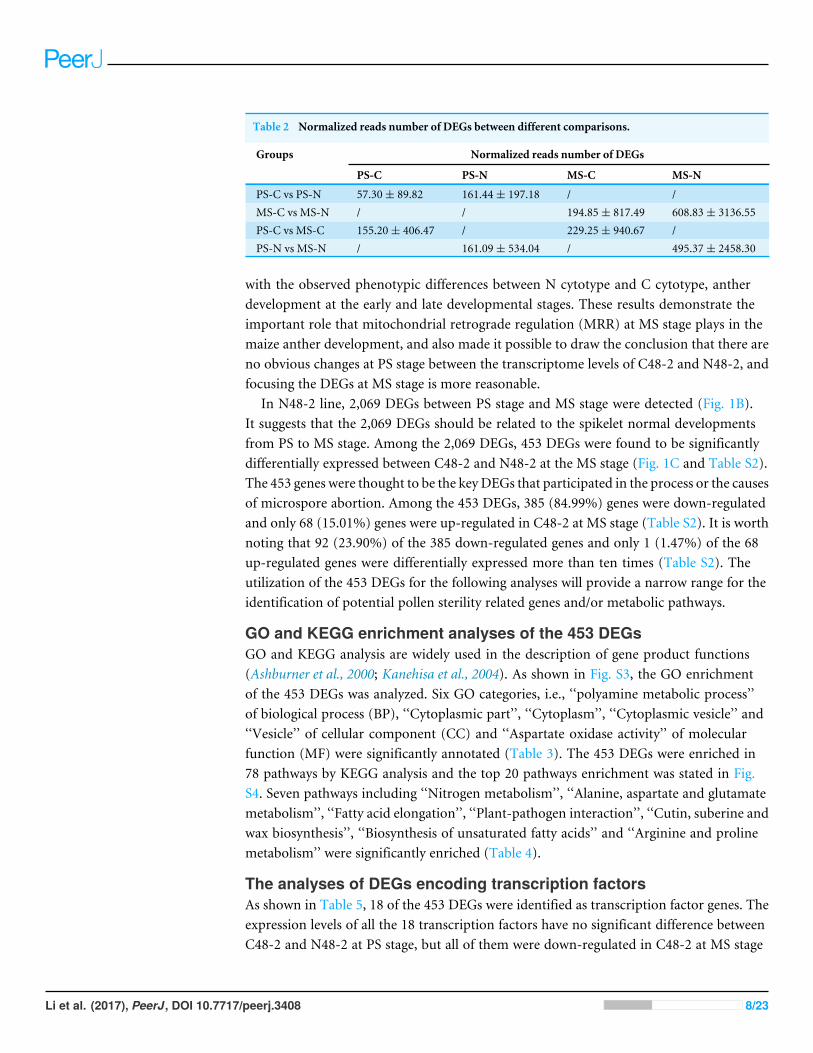
Table 2 Normalized reads number of DEGs between different comparisons.
Groups Normalized reads number of DEGs
PS-C PS-N MS-C MS-N
PS-C vs PS-N 57.30± 89.82 161.44± 197.18 / /MS-C vs MS-N / / 194.85± 817.49 608.83± 3136.55PS-C vs MS-C 155.20± 406.47 / 229.25± 940.67 /PS-N vs MS-N / 161.09± 534.04 / 495.37± 2458.30
with the observed phenotypic differences between N cytotype and C cytotype, antherdevelopment at the early and late developmental stages. These results demonstrate theimportant role that mitochondrial retrograde regulation (MRR) at MS stage plays in themaize anther development, and also made it possible to draw the conclusion that there areno obvious changes at PS stage between the transcriptome levels of C48-2 and N48-2, andfocusing the DEGs at MS stage is more reasonable.
In N48-2 line, 2,069 DEGs between PS stage and MS stage were detected (Fig. 1B).It suggests that the 2,069 DEGs should be related to the spikelet normal developmentsfrom PS to MS stage. Among the 2,069 DEGs, 453 DEGs were found to be significantlydifferentially expressed between C48-2 and N48-2 at the MS stage (Fig. 1C and Table S2).The 453 genes were thought to be the keyDEGs that participated in the process or the causesof microspore abortion. Among the 453 DEGs, 385 (84.99%) genes were down-regulatedand only 68 (15.01%) genes were up-regulated in C48-2 at MS stage (Table S2). It is worthnoting that 92 (23.90%) of the 385 down-regulated genes and only 1 (1.47%) of the 68up-regulated genes were differentially expressed more than ten times (Table S2). Theutilization of the 453 DEGs for the following analyses will provide a narrow range for theidentification of potential pollen sterility related genes and/or metabolic pathways.
GO and KEGG enrichment analyses of the 453 DEGsGO and KEGG analysis are widely used in the description of gene product functions(Ashburner et al., 2000; Kanehisa et al., 2004). As shown in Fig. S3, the GO enrichmentof the 453 DEGs was analyzed. Six GO categories, i.e., ‘‘polyamine metabolic process’’of biological process (BP), ‘‘Cytoplasmic part’’, ‘‘Cytoplasm’’, ‘‘Cytoplasmic vesicle’’ and‘‘Vesicle’’ of cellular component (CC) and ‘‘Aspartate oxidase activity’’ of molecularfunction (MF) were significantly annotated (Table 3). The 453 DEGs were enriched in78 pathways by KEGG analysis and the top 20 pathways enrichment was stated in Fig.S4. Seven pathways including ‘‘Nitrogen metabolism’’, ‘‘Alanine, aspartate and glutamatemetabolism’’, ‘‘Fatty acid elongation’’, ‘‘Plant-pathogen interaction’’, ‘‘Cutin, suberine andwax biosynthesis’’, ‘‘Biosynthesis of unsaturated fatty acids’’ and ‘‘Arginine and prolinemetabolism’’ were significantly enriched (Table 4).
The analyses of DEGs encoding transcription factorsAs shown in Table 5, 18 of the 453 DEGs were identified as transcription factor genes. Theexpression levels of all the 18 transcription factors have no significant difference betweenC48-2 and N48-2 at PS stage, but all of them were down-regulated in C48-2 at MS stage
Li et al. (2017), PeerJ, DOI 10.7717/peerj.3408 8/23
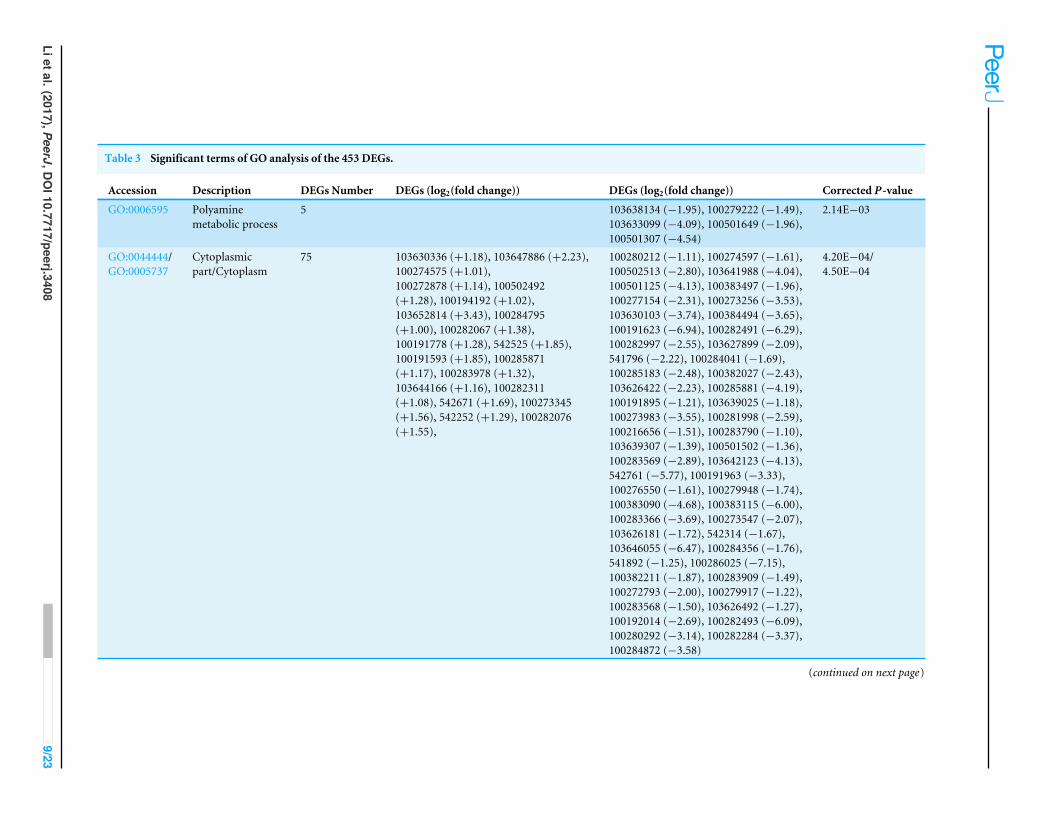
Table 3 Significant terms of GO analysis of the 453 DEGs.
Accession Description DEGs Number DEGs (log2(fold change)) DEGs (log2(fold change)) Corrected P-value
GO:0006595 Polyaminemetabolic process
5 103638134 (−1.95), 100279222 (−1.49),103633099 (−4.09), 100501649 (−1.96),100501307 (−4.54)
2.14E−03
GO:0044444/GO:0005737
Cytoplasmicpart/Cytoplasm
75 103630336 (+1.18), 103647886 (+2.23),100274575 (+1.01),100272878 (+1.14), 100502492(+1.28), 100194192 (+1.02),103652814 (+3.43), 100284795(+1.00), 100282067 (+1.38),100191778 (+1.28), 542525 (+1.85),100191593 (+1.85), 100285871(+1.17), 100283978 (+1.32),103644166 (+1.16), 100282311(+1.08), 542671 (+1.69), 100273345(+1.56), 542252 (+1.29), 100282076(+1.55),
100280212 (−1.11), 100274597 (−1.61),100502513 (−2.80), 103641988 (−4.04),100501125 (−4.13), 100383497 (−1.96),100277154 (−2.31), 100273256 (−3.53),103630103 (−3.74), 100384494 (−3.65),100191623 (−6.94), 100282491 (−6.29),100282997 (−2.55), 103627899 (−2.09),541796 (−2.22), 100284041 (−1.69),100285183 (−2.48), 100382027 (−2.43),103626422 (−2.23), 100285881 (−4.19),100191895 (−1.21), 103639025 (−1.18),100273983 (−3.55), 100281998 (−2.59),100216656 (−1.51), 100283790 (−1.10),103639307 (−1.39), 100501502 (−1.36),100283569 (−2.89), 103642123 (−4.13),542761 (−5.77), 100191963 (−3.33),100276550 (−1.61), 100279948 (−1.74),100383090 (−4.68), 100383115 (−6.00),100283366 (−3.69), 100273547 (−2.07),103626181 (−1.72), 542314 (−1.67),103646055 (−6.47), 100284356 (−1.76),541892 (−1.25), 100286025 (−7.15),100382211 (−1.87), 100283909 (−1.49),100272793 (−2.00), 100279917 (−1.22),100283568 (−1.50), 103626492 (−1.27),100192014 (−2.69), 100282493 (−6.09),100280292 (−3.14), 100282284 (−3.37),100284872 (−3.58)
4.20E−04/4.50E−04
(continued on next page)
Lietal.(2017),PeerJ,DOI10.7717/peerj.3408
9/23
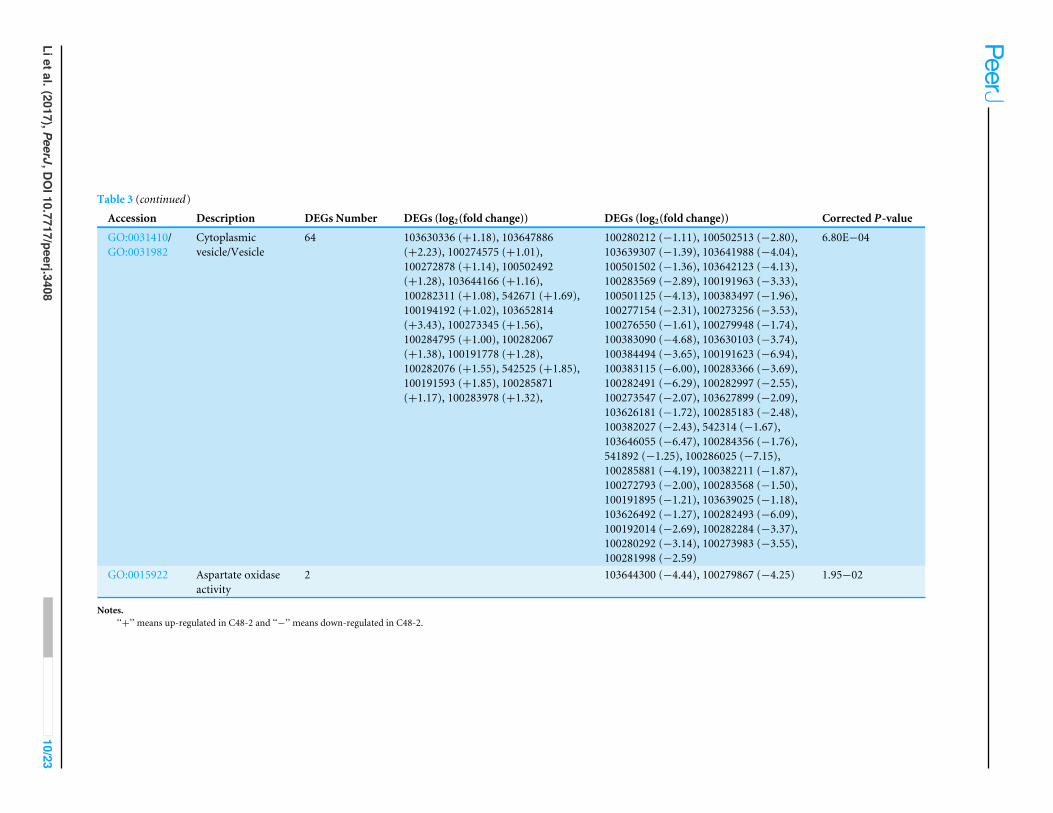
Table 3 (continued)
Accession Description DEGs Number DEGs (log2(fold change)) DEGs (log2(fold change)) Corrected P-value
GO:0031410/GO:0031982
Cytoplasmicvesicle/Vesicle
64 103630336 (+1.18), 103647886(+2.23), 100274575 (+1.01),100272878 (+1.14), 100502492(+1.28), 103644166 (+1.16),100282311 (+1.08), 542671 (+1.69),100194192 (+1.02), 103652814(+3.43), 100273345 (+1.56),100284795 (+1.00), 100282067(+1.38), 100191778 (+1.28),100282076 (+1.55), 542525 (+1.85),100191593 (+1.85), 100285871(+1.17), 100283978 (+1.32),
100280212 (−1.11), 100502513 (−2.80),103639307 (−1.39), 103641988 (−4.04),100501502 (−1.36), 103642123 (−4.13),100283569 (−2.89), 100191963 (−3.33),100501125 (−4.13), 100383497 (−1.96),100277154 (−2.31), 100273256 (−3.53),100276550 (−1.61), 100279948 (−1.74),100383090 (−4.68), 103630103 (−3.74),100384494 (−3.65), 100191623 (−6.94),100383115 (−6.00), 100283366 (−3.69),100282491 (−6.29), 100282997 (−2.55),100273547 (−2.07), 103627899 (−2.09),103626181 (−1.72), 100285183 (−2.48),100382027 (−2.43), 542314 (−1.67),103646055 (−6.47), 100284356 (−1.76),541892 (−1.25), 100286025 (−7.15),100285881 (−4.19), 100382211 (−1.87),100272793 (−2.00), 100283568 (−1.50),100191895 (−1.21), 103639025 (−1.18),103626492 (−1.27), 100282493 (−6.09),100192014 (−2.69), 100282284 (−3.37),100280292 (−3.14), 100273983 (−3.55),100281998 (−2.59)
6.80E−04
GO:0015922 Aspartate oxidaseactivity
2 103644300 (−4.44), 100279867 (−4.25) 1.95−02
Notes.‘‘+’’ means up-regulated in C48-2 and ‘‘−’’ means down-regulated in C48-2.
Lietal.(2017),PeerJ,DOI10.7717/peerj.3408
10/23
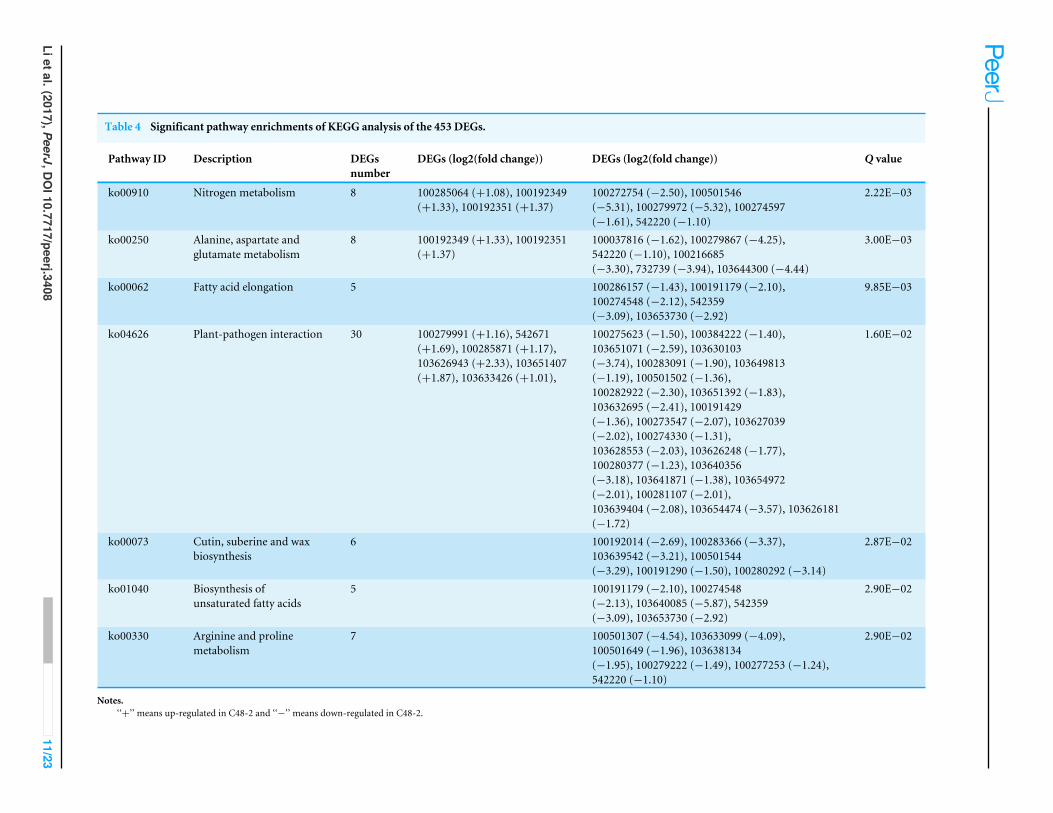
Table 4 Significant pathway enrichments of KEGG analysis of the 453 DEGs.
Pathway ID Description DEGsnumber
DEGs (log2(fold change)) DEGs (log2(fold change)) Q value
ko00910 Nitrogen metabolism 8 100285064 (+1.08), 100192349(+1.33), 100192351 (+1.37)
100272754 (−2.50), 100501546(−5.31), 100279972 (−5.32), 100274597(−1.61), 542220 (−1.10)
2.22E−03
ko00250 Alanine, aspartate andglutamate metabolism
8 100192349 (+1.33), 100192351(+1.37)
100037816 (−1.62), 100279867 (−4.25),542220 (−1.10), 100216685(−3.30), 732739 (−3.94), 103644300 (−4.44)
3.00E−03
ko00062 Fatty acid elongation 5 100286157 (−1.43), 100191179 (−2.10),100274548 (−2.12), 542359(−3.09), 103653730 (−2.92)
9.85E−03
ko04626 Plant-pathogen interaction 30 100279991 (+1.16), 542671(+1.69), 100285871 (+1.17),103626943 (+2.33), 103651407(+1.87), 103633426 (+1.01),
100275623 (−1.50), 100384222 (−1.40),103651071 (−2.59), 103630103(−3.74), 100283091 (−1.90), 103649813(−1.19), 100501502 (−1.36),100282922 (−2.30), 103651392 (−1.83),103632695 (−2.41), 100191429(−1.36), 100273547 (−2.07), 103627039(−2.02), 100274330 (−1.31),103628553 (−2.03), 103626248 (−1.77),100280377 (−1.23), 103640356(−3.18), 103641871 (−1.38), 103654972(−2.01), 100281107 (−2.01),103639404 (−2.08), 103654474 (−3.57), 103626181(−1.72)
1.60E−02
ko00073 Cutin, suberine and waxbiosynthesis
6 100192014 (−2.69), 100283366 (−3.37),103639542 (−3.21), 100501544(−3.29), 100191290 (−1.50), 100280292 (−3.14)
2.87E−02
ko01040 Biosynthesis ofunsaturated fatty acids
5 100191179 (−2.10), 100274548(−2.13), 103640085 (−5.87), 542359(−3.09), 103653730 (−2.92)
2.90E−02
ko00330 Arginine and prolinemetabolism
7 100501307 (−4.54), 103633099 (−4.09),100501649 (−1.96), 103638134(−1.95), 100279222 (−1.49), 100277253 (−1.24),542220 (−1.10)
2.90E−02
Notes.‘‘+’’ means up-regulated in C48-2 and ‘‘−’’ means down-regulated in C48-2.
Lietal.(2017),PeerJ,DOI10.7717/peerj.3408
11/23
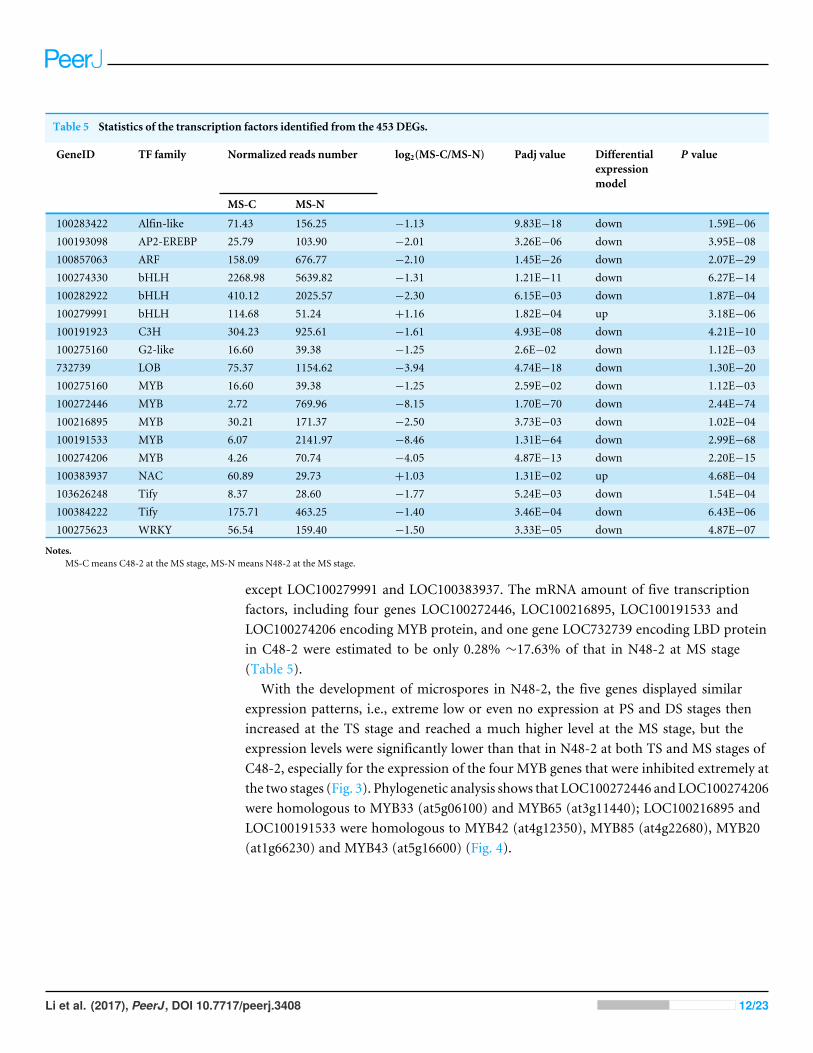
Table 5 Statistics of the transcription factors identified from the 453 DEGs.
GeneID TF family Normalized reads number log2(MS-C/MS-N) Padj value Differentialexpressionmodel
P value
MS-C MS-N
100283422 Alfin-like 71.43 156.25 −1.13 9.83E−18 down 1.59E−06100193098 AP2-EREBP 25.79 103.90 −2.01 3.26E−06 down 3.95E−08100857063 ARF 158.09 676.77 −2.10 1.45E−26 down 2.07E−29100274330 bHLH 2268.98 5639.82 −1.31 1.21E−11 down 6.27E−14100282922 bHLH 410.12 2025.57 −2.30 6.15E−03 down 1.87E−04100279991 bHLH 114.68 51.24 +1.16 1.82E−04 up 3.18E−06100191923 C3H 304.23 925.61 −1.61 4.93E−08 down 4.21E−10100275160 G2-like 16.60 39.38 −1.25 2.6E−02 down 1.12E−03732739 LOB 75.37 1154.62 −3.94 4.74E−18 down 1.30E−20100275160 MYB 16.60 39.38 −1.25 2.59E−02 down 1.12E−03100272446 MYB 2.72 769.96 −8.15 1.70E−70 down 2.44E−74100216895 MYB 30.21 171.37 −2.50 3.73E−03 down 1.02E−04100191533 MYB 6.07 2141.97 −8.46 1.31E−64 down 2.99E−68100274206 MYB 4.26 70.74 −4.05 4.87E−13 down 2.20E−15100383937 NAC 60.89 29.73 +1.03 1.31E−02 up 4.68E−04103626248 Tify 8.37 28.60 −1.77 5.24E−03 down 1.54E−04100384222 Tify 175.71 463.25 −1.40 3.46E−04 down 6.43E−06100275623 WRKY 56.54 159.40 −1.50 3.33E−05 down 4.87E−07
Notes.MS-C means C48-2 at the MS stage, MS-N means N48-2 at the MS stage.
except LOC100279991 and LOC100383937. The mRNA amount of five transcriptionfactors, including four genes LOC100272446, LOC100216895, LOC100191533 andLOC100274206 encoding MYB protein, and one gene LOC732739 encoding LBD proteinin C48-2 were estimated to be only 0.28% ∼17.63% of that in N48-2 at MS stage(Table 5).
With the development of microspores in N48-2, the five genes displayed similarexpression patterns, i.e., extreme low or even no expression at PS and DS stages thenincreased at the TS stage and reached a much higher level at the MS stage, but theexpression levels were significantly lower than that in N48-2 at both TS and MS stages ofC48-2, especially for the expression of the four MYB genes that were inhibited extremely atthe two stages (Fig. 3). Phylogenetic analysis shows that LOC100272446 and LOC100274206were homologous to MYB33 (at5g06100) and MYB65 (at3g11440); LOC100216895 andLOC100191533 were homologous to MYB42 (at4g12350), MYB85 (at4g22680), MYB20(at1g66230) and MYB43 (at5g16600) (Fig. 4).
Li et al. (2017), PeerJ, DOI 10.7717/peerj.3408 12/23
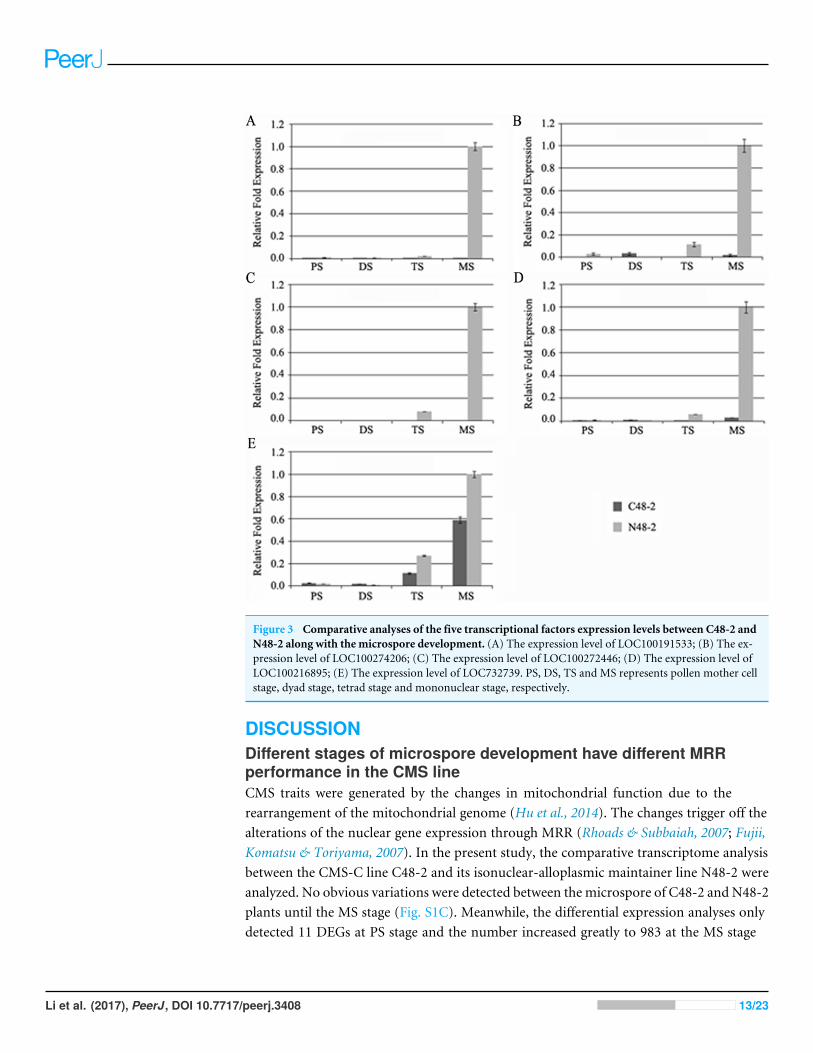
Figure 3 Comparative analyses of the five transcriptional factors expression levels between C48-2 andN48-2 along with the microspore development. (A) The expression level of LOC100191533; (B) The ex-pression level of LOC100274206; (C) The expression level of LOC100272446; (D) The expression level ofLOC100216895; (E) The expression level of LOC732739. PS, DS, TS and MS represents pollen mother cellstage, dyad stage, tetrad stage and mononuclear stage, respectively.
DISCUSSIONDifferent stages of microspore development have different MRRperformance in the CMS lineCMS traits were generated by the changes in mitochondrial function due to therearrangement of the mitochondrial genome (Hu et al., 2014). The changes trigger off thealterations of the nuclear gene expression through MRR (Rhoads & Subbaiah, 2007; Fujii,Komatsu & Toriyama, 2007). In the present study, the comparative transcriptome analysisbetween the CMS-C line C48-2 and its isonuclear-alloplasmic maintainer line N48-2 wereanalyzed. No obvious variations were detected between themicrospore of C48-2 and N48-2plants until the MS stage (Fig. S1C). Meanwhile, the differential expression analyses onlydetected 11 DEGs at PS stage and the number increased greatly to 983 at the MS stage
Li et al. (2017), PeerJ, DOI 10.7717/peerj.3408 13/23
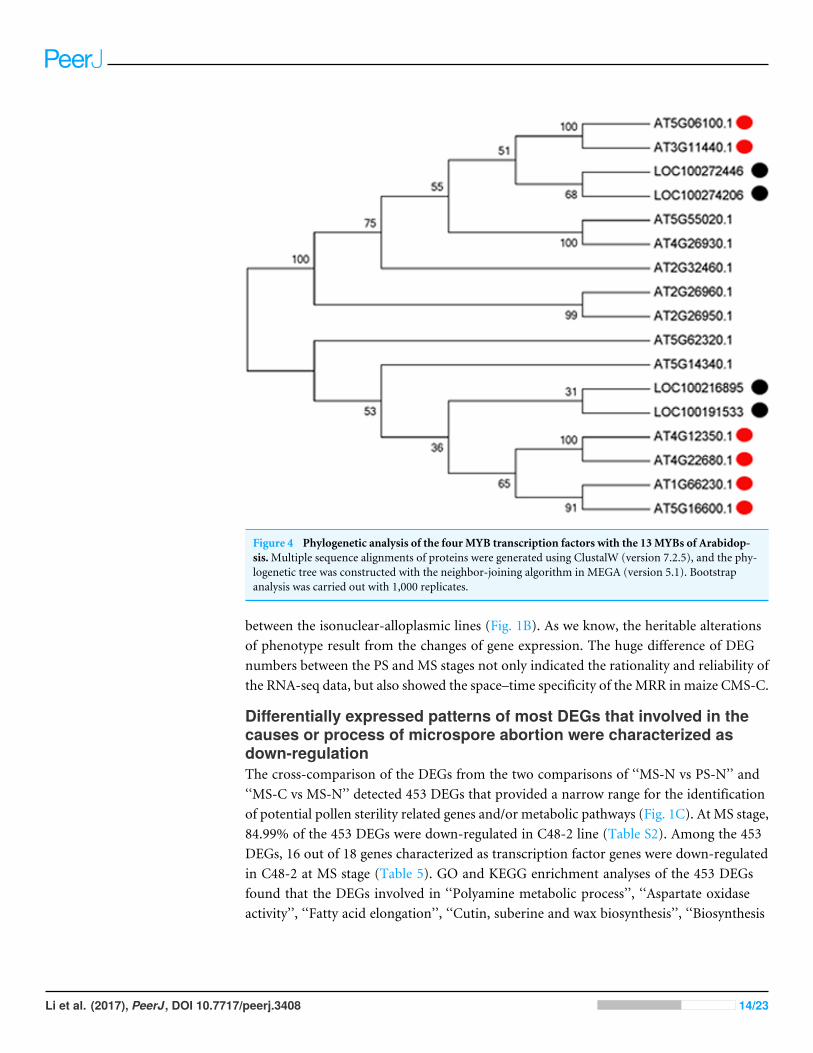
Figure 4 Phylogenetic analysis of the four MYB transcription factors with the 13MYBs of Arabidop-sis.Multiple sequence alignments of proteins were generated using ClustalW (version 7.2.5), and the phy-logenetic tree was constructed with the neighbor-joining algorithm in MEGA (version 5.1). Bootstrapanalysis was carried out with 1,000 replicates.
between the isonuclear-alloplasmic lines (Fig. 1B). As we know, the heritable alterationsof phenotype result from the changes of gene expression. The huge difference of DEGnumbers between the PS and MS stages not only indicated the rationality and reliability ofthe RNA-seq data, but also showed the space–time specificity of the MRR in maize CMS-C.
Differentially expressed patterns of most DEGs that involved in thecauses or process of microspore abortion were characterized asdown-regulationThe cross-comparison of the DEGs from the two comparisons of ‘‘MS-N vs PS-N’’ and‘‘MS-C vs MS-N’’ detected 453 DEGs that provided a narrow range for the identificationof potential pollen sterility related genes and/or metabolic pathways (Fig. 1C). At MS stage,84.99% of the 453 DEGs were down-regulated in C48-2 line (Table S2). Among the 453DEGs, 16 out of 18 genes characterized as transcription factor genes were down-regulatedin C48-2 at MS stage (Table 5). GO and KEGG enrichment analyses of the 453 DEGsfound that the DEGs involved in ‘‘Polyamine metabolic process’’, ‘‘Aspartate oxidaseactivity’’, ‘‘Fatty acid elongation’’, ‘‘Cutin, suberine and wax biosynthesis’’, ‘‘Biosynthesis
Li et al. (2017), PeerJ, DOI 10.7717/peerj.3408 14/23
of unsaturated fatty acids’’ and ‘‘Arginine and proline metabolism’’ were all significantlydown-regulated in C48-2 at the MS stage (Tables 3 and 4).
The significantly down-regulated expression of MYB was essential formale sterilityThe alteration of transcription factors expression often leads to the abnormal pollendevelopment and the male sterility during plant growth. Millar & Gubler (2005) foundthat the myb33 myb65 had a premeiotic abortion of pollen development because thetapetum undergoes hypertrophy at the pollen mother cell stage in Arabidopsis. A battery ofSND1-regulated transcription factors, includingMYB20 (at1g66230), MYB43 (at5g16600),MYB42 (at4g12350) and MYB85 (at4g22680), is required for normal secondary cell wallbiosynthesis and secondary cell wall thickening of the endothecium is necessary for therelease of pollen grains (Zhong et al., 2008; Keijzer, 1987; Millar & Gubler, 2005; Dawsonet al., 1999; Steiner-Lange et al., 2003). In the present study, four genes encoding MYBtranscription factors were homologous to Arabidopsis MYB33, MYB65, MYB42, MYB85,MYB20 andMYB43 and found to be absolutely suppressed or significantly down-regulatedin C48-2 along with the microspore development (Figs. 3 and 4). We suggest that thedramatic decreases of these MYB mRNA amount at the TS and MS stages might beinvolved in the male sterility of C48-2 line.
Down-regulation of DEGs involved in energy metabolism potentiallyrelated to CMS in maizeHigh respiration rate and great energy demand are usually observed during microsporedevelopment (Tadege & Kuhlemeier, 1997). ATP, the energy currency for the Cell, in malesterile lines was significantly decreased (Bergman et al., 2000; Teixeira, Knorpp & Glimelius,2005; Li et al., 2015). NAD is essential for energy metabolism and electron transfer, de novobiosynthesis ofNADstartswith the oxidation of L-Asp toα-iminosuccinate and catalyzed byL-Asp oxidase (AO) in plants (Katoh et al., 2006). In this study, two DEGs, LOC103644300and LOC100279867, encoding AO protein were found involved in ‘‘Aspartate oxidaseactivity’’ and the mRNA amount of LOC103644300 and LOC100279867 in C48-2 wereestimated to be only 4.60% and 5.24% of that in N48-2 (Table 3). We speculated thatthe suppressed expression of the genes that related to the energy supply might result in ashortage in energy required for microspore development and ultimately led to the malesterility of C48-2.
Down-regulation of DEGs involved in polyamine metabolic pathwaymight resulted in the accumulation of ROS in C48-2 lineFor the male fertility of higher plant, the importance of polyamines, i.e., putrescine,spermidine and spermine, has been widely demonstrated (Falasca et al., 2010; Aloisiet al., 2016; Song & Tachibana, 2007). In plants, the ornithine decarboxylase (ODC),arginine decarboxylase (ADC) and spermidine synthase (SPDS) were essential for thesynthesis of putrescine (Aloisi et al., 2016). ADC and ODC enzymes were expressed at themononuclear stage of Nicotiana tabacum microspore and inhibited activity of SPDS ledto abnormal pollen grains in kiwifruit (Bokvaj, Hafidh & Honys, 2015; Falasca et al., 2010).
Li et al. (2017), PeerJ, DOI 10.7717/peerj.3408 15/23
5 DEGs (LOC100501307 and LOC103633099 encoding ODC protein, LOC100501649and LOC103638134 encoding ADC protein, and LOC100279222 encoding SPDS protein)that significantly enriched in ‘‘polyamine metabolic process’’ were all down-regulatedin C48-2 at MS stage (Table 3). Particularly, the mRNA amount of LOC100501307 andLOC103633099 in C48-2 were estimated to be only 4.30% and 5.87% of that in N48-2(Table 3). Therefore, we hypothesized these genes’ significant down-regulation in C48-2might lead to the reduction of cellular polyamine levels. Polyamines can protect cellularconstituents from reactive oxygen species (ROS) because of the powerful properties forhydroxyl radical scavenging and singlet oxygen quenching (Das & Misra, 2004). ROSinduce programmed cell death (PCD) and high levels of ROS indiscriminately attackcellular constituents then leads to male sterility (Xie et al., 2014; Song et al., 2016). Ourprevious study found that more ROS were produced in C48-2 than that in N48-2 at MSstage (Huang et al., 2012). Collectively, it is reasonable to draw a conclusion that the sharpdown-regulated expression of the polyamine metabolism related genes might result inthe reduction of cellular polyamine levels and the balance between ROS production andscavenging were disturbed, then the higher concentrations of ROS were accumulated inC48-2 line at MS stage, eventually led to the male sterility.
Down-regulation of DEGs involved in fatty acid synthesis might dis-rupt the pollen wall developmentIn most cases, the male sterility traits were on account of the defective pollen wall (Wuet al., 2015). The pollen wall consists of the exine and the intine (Dobritsa et al., 2011).The exine was derived from the tapetum and consists of sporopollenin (Jiang, Zhang &Cao, 2013). Sporopollenin biosynthesis is closely associated with fatty acid metabolism forwax and cutin formation (Morant et al., 2007; Dobritsa et al., 2009; Li et al., 2010). Here,six DEGs were significantly enriched in the fatty acid metabolism related ‘‘biosynthesis ofunsaturated fatty acids’’ and ‘‘fatty acid elongation’’ (Table 4). The synthesized C16 andC18 fatty acids are transported to the endoplasmic reticulum and lengthened into verylong chain fatty acids (VLCFAs) that are used for sporopollenin and/or wax biosynthesis(Jiang, Zhang & Cao, 2013). In the process of fatty acid elongation, the four enzymaticreactions catalyzed by β-ketoacyl-CoA synthase (KCS), β-ketoacyl-CoA reductases (KCR),β-hydroxyacyl -CoA dehydrase and trans-2-enoyl-CoA reductases (ECR) are the corebiosynthetic activities (Costaglioli et al., 2005). In this study, LOC100286157 that encodingKCS protein, LOC103653730 (GL8B) and LOC542359 (GL8) that encoding KCR protein,LOC100274548 (PAS2) that encoding β-hydroxyacyl -CoA dehydrase, and LOC100191179that encoding ECRproteinwere all down-regulated inC48-2 atMS stage (Table 4). Inmaize,studies had demonstrated GL8 and PAS2 are two essential enzymes in VLCFAs synthesis(Xu et al., 1997; Xu et al., 2002; Bach et al., 2008). Meanwhile, all the DEGs significantlyenriched in ‘‘Cutin, suberine and wax biosynthesis’’ were down-regulated in C48-2 at MSstage (Table 4). Based on these results, it is also reasonable to draw another conclusionthat the down-regulation of the genes involved in the fatty acid synthesis might disrupt thepollen wall development and then contribute to the pollen abortion.
Li et al. (2017), PeerJ, DOI 10.7717/peerj.3408 16/23
Analysis of DEGs involved in proline metabolism of pollendevelopmentIn a number of plant species, massive proline accumulation in anthers and pollen hadbeen reported by different authors (Mattioli et al., 2012; Biancucci et al., 2015). It is notvery clear, to date, the reason for such a massive proline accumulation in pollen. InArabidopsis, aberrant and infertile pollen grains were found in the proline-deficientmutant p5cs1 p5cs2/P5CS2 that defective in proline biosynthetic enzymes, and exogenousproline supplied can partially complement both morphological and functional defectsof pollen (Mattioli et al., 2012; Funck et al., 2012). This supports the idea that proline isrequired for pollen development at the genetic and molecular level. In maize, Zou et al.(2009) found that along with the maize microspore development, the proline content wasgradually increase in the maintainer line, but the proline contents were significant reducedin the CMS-C line. In this study, seven DEGs were significantly enriched in ‘‘arginine andproline metabolism’’ pathway and all were down-regulated in C48-2 line compared withthat of N48-2 line (Table 4). These results showed that the down-regulation of these genesexpression might be correlated with the proline content reduction and then made thedefects in pollen development and male fertility in C48-2 line.
CONCLUSIONIn the present study, the RNA-seq and comparative transcript profiling analyses ofCMS-C line C48-2 and its isonuclear-alloplasmic maintainer line N48-2 were appliedto investigate the maize CMS-C sterility associated genes and/or pathways. Finally, wefound the four genes encoding MYB transcription factor, and the DEGs involved in energymetabolism related ‘‘Aspartate oxidase activity’’, regulation of ROS concentration related‘‘Polyamine metabolic process’’, pollen wall development related ‘‘Cutin, suberine andwax biosynthesis’’, ‘‘Fatty acid elongation’’ and ‘‘Biosynthesis of unsaturated fatty acids’’,and pollen development related ‘‘Proline metabolism’’ might be the important factorscontributing to the sterile trait of maize CMS-C. Although there is no direct evidenceindicating that these transcription factors and metabolism pathways are responsible forthe maize CMS-C, the related research results in other plant species strongly suggest sucha role. This study might shed some light on how the CMS generated and maintained, andprovided some important and critical foothold for the molecular mechanism study of themale sterility of maize CMS-C. Based on the results of the present study, further preciseanalyses about the molecular mechanism of how these genes and metabolic pathways leadto the male sterility of CMS-C are needed.
ACKNOWLEDGEMENTSWe thank Dr. Wei Zhang of the Chengdu Biotechservice Co. Ltd. for technical support forthe data analyses.
Li et al. (2017), PeerJ, DOI 10.7717/peerj.3408 17/23
ADDITIONAL INFORMATION AND DECLARATIONS
FundingThis work was supported by the National Key Research and Development Program ofChina (2016YFD0101206 and 2016YFD0102204). The funders had no role in study design,data collection and analysis, decision to publish, or preparation of the manuscript.
Grant DisclosuresThe following grant information was disclosed by the authors:National Key Research and Development Program of China: 2016YFD0101206,2016YFD0102204.
Competing InterestsThe authors declare there are no competing interests.
Author Contributions• Chuan Li conceived and designed the experiments, performed the experiments, analyzedthe data, wrote the paper, prepared figures and/or tables.• Zhuofan Zhao performed the experiments, prepared figures and/or tables.• Yongming Liu and Bing Liang performed the experiments.• Shuxian Guan analyzed the data.• Hai Lan contributed reagents/materials/analysis tools, reviewed drafts of the paper.• Jing Wang contributed reagents/materials/analysis tools.• Yanli Lu reviewed drafts of the paper.• Moju Cao conceived and designed the experiments, analyzed the data, wrote the paper,reviewed drafts of the paper.
Data AvailabilityPaired-end RNA-seq raw data of 3 biological replicates of MS-C:
MS-C_1_1 (http://dx.doi.org/10.6084/m9.figshare.4905758); MS-C_1_2(http://dx.doi.org/10.6084/m9.figshare.4907921); MS-C_2_1 (http://dx.doi.org/10.6084/m9.figshare.4906679); MS-C_2_2 (http://dx.doi.org/10.6084/m9.figshare.4907939); MS-C_3_1 (http://dx.doi.org/10.6084/m9.figshare.4909289); MS-C_3_2 (http://dx.doi.org/10.6084/m9.figshare.4909292).
Paired-end RNA-seq raw data of 3 biological replicates of PS-C:PS-C_1_1 (http://dx.doi.org/10.6084/m9.figshare.4909301); PS-C_1_2 (http://dx.doi.
org/10.6084/m9.figshare.4909505); PS-C_2_1 (http://dx.doi.org/10.6084/m9.figshare.4909304); PS-C_2_2 (http://dx.doi.org/10.6084/m9.figshare.4909307); PS-C_3_1 (http://dx.doi.org/10.6084/m9.figshare.4909331); PS-C_3_2 (http://dx.doi.org/10.6084/m9.figshare.4909337).
Paired-end RNA-seq raw data of 3 biological replicate of MS-N:MS-N_1_1 (http://dx.doi.org/10.6084/m9.figshare.4906874); MS-N_1_2 (http:
//dx.doi.org/10.6084/m9.figshare.4906871); MS-N_2_1 (http://dx.doi.org/10.6084/m9.
Li et al. (2017), PeerJ, DOI 10.7717/peerj.3408 18/23
figshare.4906964); MS-N_2_2 (http://dx.doi.org/10.6084/m9.figshare.4906961); MS-N_3_1 (http://dx.doi.org/10.6084/m9.figshare.4906994); MS-N_3_2 (http://dx.doi.org/10.6084/m9.figshare.4907006).
Paired-end RNA-seq raw data of 3 biological replicate of PS-N:PS-N_1_1 (http://dx.doi.org/10.6084/m9.figshare.4907165); PS-N_1_2 (http://dx.doi.
org/10.6084/m9.figshare.4907165); PS-N_2_1 (http://dx.doi.org/10.6084/m9.figshare.4907165); PS-N_2_2 (http://dx.doi.org/10.6084/m9.figshare.4907174); PS-N_3_1(http://dx.doi.org/10.6084/m9.figshare.4907345); PS-N_3_2 (http://dx.doi.org/10.6084/m9.figshare.4907348).
Supplemental InformationSupplemental information for this article can be found online at http://dx.doi.org/10.7717/peerj.3408#supplemental-information.
REFERENCESAllen JO, Fauron CM,Minx P, Roark L, Oddiraju S, Lin GN, Meyer L, Sun H, Kim
K,Wang C, Du F, Xu D, GibsonM, Cifrese J, Clifton SW, Newton KJ. 2007.Comparisons among two fertile and three male-sterile mitochondrial genomes ofmaize. Genetics 177(2):1173–1192 DOI 10.1534/genetics.107.073312.
Aloisi I, Cai G, Serafini-Fracassini D, Del DS. 2016. Polyamines in pollen: frommicrosporogenesis to fertilization. Frontiers in Plant Science 7:155DOI 10.3389/fpls.2016.00155.
Ashburner M, Ball CA, Blake JA, Botstein D, Butler H, Cherry JM, Davis AP, DolinskiK, Dwight SS, Eppig JT, Harris MA, Hill DP, Issel-Tarver L, Kasarskis A, LewisS, Matese JC, Richardson JE, RingwaldM, Rubin GM, Sherlock G. 2000. Geneontology: tool for the unification of biology. The gene ontology consortium. NatureGenetics 25(1):25–29 DOI 10.1038/75556.
Bach L, Michaelson LV, Haslam R, Bellec Y, Gissot L, Marion J, Da Costa M, BoutinJP, Miquel M, Tellier F, Domergue F, Markham JE, Beaudoin F, Napier JA,Faure JD. 2008. The very-long-chain hydroxy fatty acyl-CoA dehydratase PAS-TICCINO2 is essential and limiting for plant development. Proceedings of theNational Academy of Sciences of the United States of America 105(38):14727–14731DOI 10.1073/pnas.0805089105.
Beckett JB. 1971. Classification of male-sterile cytoplasms in maize (Zea mays L.). CropScience 11(5):724–727.
Benjamini BY, Yekutieli D. 2001. The control of the false discovery rate in multipletesting under dependency. Annals of Statistics 29:1165–1188DOI 10.1214/aos/1013699998.
Bergman P, Edqvist J, Farbos I, Glimelius K. 2000.Male-sterile tobacco displaysabnormal mitochondrial atp1 transcript accumulation and reduced floral ATP/ADPratio. Plant Molecular Biology 42(3):531–544 DOI 10.1023/A:1006388814458.
Li et al. (2017), PeerJ, DOI 10.7717/peerj.3408 19/23
Biancucci M, Mattioli R, Forlani G, Funck D, Costantino P, TrovatoM. 2015. Role ofproline and GABA in sexual reproduction of angiosperms. Frontiers in Plant Science6:680 DOI 10.3389/fpls.2015.00680.
Bohra A, Jha UC, Adhimoolam P, Bisht D, Singh NP. 2016. Cytoplasmic male steril-ity (CMS) in hybrid breeding in field crops. Plant Cell Reports 35(5):967–993DOI 10.1007/s00299-016-1949-3.
Bokvaj P, Hafidh S, Honys D. 2015. Transcriptome profiling of male gametophytedevelopment in Nicotiana tabacum. Genomics Data 3:106–111.
Boyle EI, Weng S, Gollub J, Jin H, Botstein D, Cherry JM, Sherlock G. 2004.GO::TermFinder—open source software for accessing Gene Ontology informationand finding significantly enriched Gene Ontology terms associated with a list ofgenes. Bioinformatics 20(18):3710–3715 DOI 10.1093/bioinformatics/bth456.
Chase CD. 2007. Cytoplasmic male sterility: a window to the world of plant mitochondrial-nuclear interactions. Trends in Genetics 23(2):81–90 DOI 10.1016/j.tig.2006.12.004.
ChenWC, Duan SF. 1988. The cytological observation of anther development in C-cytoplasmic male sterile corn. Acta Agronomica Sinica 14(3):177–181.
Costaglioli P, Joubes J, Garcia C, Stef M, Arveiler B, Lessire R, Garbay B. 2005. Profilingcandidate genes involved in wax biosynthesis in Arabidopsis thaliana by microarrayanalysis. Biochimica et Biophysica Acta—Molecular and Cell Biology of Lipids1734:247–258 DOI 10.1016/j.bbalip.2005.04.002.
Das KC, Misra HP. 2004.Hydroxyl radical scavenging and singlet oxygen quenchingproperties of polyamines.Molecular and Cellular Biochemistry 262:127–133DOI 10.1023/B:MCBI.0000038227.91813.79.
Dawson J, Sozen E, Vizir I, VanWaeyenberge S, Wilson ZA, Mulligan BJ. 1999.Characterization and genetic mapping of a mutation (ms35) which prevents antherdehiscence in Arabidopsis thaliana by affecting secondary wall thickening in theendothecium. New Phytologist 144:213–222 DOI 10.1046/j.1469-8137.1999.00507.x.
Dewey RE, Timothy DH, Levings CS. 1991. Chimeric mitochondrial genes ex-pressed in the C male-sterile cytoplasm of maize. Current Genetics 20(6):475–482DOI 10.1007/BF00334775.
Dobritsa AA, Geanconteri A, Shrestha J, Carlson A, Kooyers N, Coerper D, Urbanczyk-Wochniak E, Bench BJ, Sumner LW, Swanson R, Preuss D. 2011. A large-scalegenetic screen in Arabidopsis to identify genes involved in pollen exine production.Plant Physiology 157(2):947–970 DOI 10.1104/pp.111.179523.
Dobritsa AA, Nishikawa S, Preuss D, Urbanczyk-Wochniak E, Sumner LW, HammondA, Carlson AL, Swanson RJ. 2009. LAP3, a novel plant protein required for pollendevelopment, is essential for proper exine formation. Sexual Plant Reproduction22(3):167–177 DOI 10.1007/s00497-009-0101-8.
Falasca G, Franceschetti M, Bagni N, AltamuraMM, Biasi R. 2010. Polyamine biosyn-thesis and control of the development of functional pollen in kiwifruit. PlantPhysiology and Biochemistry 48(7):565–573 DOI 10.1016/j.plaphy.2010.02.013.
Forde BG, Leaver CJ. 1980. Nuclear and cytoplasmic genes controlling synthesisof variant mitochondrial polypeptides in male-sterile maize. Proceedings of the
Li et al. (2017), PeerJ, DOI 10.7717/peerj.3408 20/23
National Academy of Sciences of the United States of America 77(1):418–422DOI 10.1073/pnas.77.1.418.
Fujii S, Komatsu S, Toriyama K. 2007. Retrograde regulation of nuclear gene expressionin CW-CMS of rice. Plant Molecular Biology 63(3):405–417DOI 10.1007/s11103-006-9097-8.
Fujii S, Toriyama K. 2008. Genome barriers between nuclei and mitochondria ex-emplified by cytoplasmic male sterility. Plant and Cell Physiology 49:1484–1494DOI 10.1093/pcp/pcn102.
Funck D,Winter G, Baumgarten L, Forlani G. 2012. Requirement of proline syn-thesis during Arabidopsis reproductive development. BMC Plant Biology 12:191DOI 10.1186/1471-2229-12-191.
Hsu SY, Huang Y-C, Peterson PA. 1988. Development pattern of microspores in Zeamays L. The maturation of upper and lower florets of spikelets among an assortmentof genotypes.Maydica 33:77–98.
Hu J, Chen G, Zhang H, Qian Q, Ding Y. 2016. Comparative transcript profilingof alloplasmic male-sterile lines revealed altered gene expression related topollen development in rice (Oryza sativa L.). BMC Plant Biology 16(1):175DOI 10.1186/s12870-016-0864-7.
Hu J, HuangW, Huang Q, Qin X, Yu C,Wang L, Li S, Zhu R, Zhu Y. 2014.Mito-chondria and cytoplasmic male sterility in plants.Mitochondrion Pt B:282–288DOI 10.1016/j.mito.2014.02.008.
Huang L, Xiang J, Liu J, Rong TZ,Wang J, Lu YL, Tang QL,WenW, CaoMJ.2012. Expression characterization of genes for CMS-C in maize. Protoplasma249(4):1119–1127 DOI 10.1007/s00709-011-0358-2.
Jiang J, Zhang Z, Cao J. 2013. Pollen wall development: the associated enzymes andmetabolic pathways. Plant Biology 15(2):249–263DOI 10.1111/j.1438-8677.2012.00706.x.
Kanehisa M, Goto S, Kawashima S, Okuno Y, Hattori M. 2004. The KEGG resource fordeciphering the genome. Nucleic Acids Research 32(Database issue):D277–D280.
Katoh A, Uenohara K, Akita M, Hashimoto T. 2006. Early steps in the biosynthesis ofNAD in Arabidopsis start with aspartate and occur in the plastid. Plant Physiology141(3):851–857 DOI 10.1104/pp.106.081091.
Keijzer CJ. 1987. The processes of anther dehiscence and pollen dispersal. 1. The openingmechanism of longitudinally dehiscing anthers. New Phytologist 105:487–498DOI 10.1111/j.1469-8137.1987.tb00886.x.
Langmead B, Salzberg SL. 2012. Fast gapped-read alignment with Bowtie2. NatureMethods 9:357–359 DOI 10.1038/nmeth.1923.
Li B, Dewey CN. 2011. RSEM: accurate transcript quantification from RNA-Seq data with or without a reference genome. BMC Bioinformatics 12:323DOI 10.1186/1471-2105-12-323.
Li H, Durbin R. 2009. Fast and accurate short read alignment with Burrows-Wheelertransform. Bioinformatics 25(14):1754–1760 DOI 10.1093/bioinformatics/btp324.
Li et al. (2017), PeerJ, DOI 10.7717/peerj.3408 21/23
Li J, Han S, Ding X, He T, Dai J, Yang S, Gai J. 2015. Comparative transcriptomeanalysis between the cytoplasmic male sterile line NJCMS1A and its maintainerNJCMS1B in soybean (Glycine max (L.) Merr.). PLOS ONE 10(5):e0126771DOI 10.1371/journal.pone.0126771.
Li H, Pinot F, Sauveplane V,Werck-Reichhart D, Diehl P, Schreiber L, Franke R, ZhangP, Chen L, Gao Y, LiangW, Zhang D. 2010. Cytochrome P450 family memberCYP704B2 catalyzes the {omega}-hydroxylation of fatty acids and is requiredfor anther cutin biosynthesis and pollen exine formation in rice. The Plant Cell22(1):173–190 DOI 10.1105/tpc.109.070326.
Liu Q, Lan Y,Wen C, Zhao H,Wang J, Wang Y. 2016. Transcriptome sequencinganalyses between the cytoplasmic male sterile line and its maintainer line in welshonion (Allium fistulosum L.). International Journal of Molecular Sciences 17(7):1058DOI 10.3390/ijms17071058.
LoveMI, HuberW, Anders S. 2014.Moderated estimation of fold change and dispersionfor RNA-seq data with DESeq2. Genome Biology 15(12):550DOI 10.1186/s13059-014-0550-8.
Mattioli R, Biancucci M, Lonoce C, Costantino P, TrovatoM. 2012. Proline is requiredfor male gametophyte development in Arabidopsis. BMC Plant Biology 12:236DOI 10.1186/1471-2229-12-236.
Mei S, Liu T,Wang Z. 2016. Comparative transcriptome profile of the cytoplasmic malesterile and fertile floral buds of radish (Raphanus sativus L.). International Journal ofMolecular Sciences 17(1):42.
Millar AA, Gubler F. 2005. The Arabidopsis GAMYB-like genes, MYB33 and MYB65,are microRNA-regulated genes that redundantly facilitate anther development. ThePlant Cell 17(3):705–721 DOI 10.1105/tpc.104.027920.
Moraes APD, Bered F, Kaltchuk-Santos E. 2008.Morphological markers for mi-crospore developmental stage in maize. Brazilian Archives of Biology & Technology51(5):911–916 DOI 10.1590/S1516-89132008000500006.
Morant M, Jørgensen K, Schaller H, Pinot F, Møller BL,Werck-Reichhart D, Bak S.2007. CYP703 is an ancient cytochrome P450 in land plants catalyzing in-chainhydroxylation of lauric acid to provide building blocks for sporopollenin synthesisin pollen. The Plant Cell 19(5):1473–1487 DOI 10.1105/tpc.106.045948.
Rhoads DM, Subbaiah CC. 2007.Mitochondrial retrograde regulation in plants.Mitochondrion 7(3):177–194 DOI 10.1016/j.mito.2007.01.002.
Sofi P, Rather A,Wani S. 2007. Genetic and molecular basis of cytoplasmic male sterilityin maize. Communications in Biometry and Crop Science 2:49–60.
Song J, Tachibana S. 2007. Loss of viability of tomato pollen during long-term dry stor-age is associated with reduced capacity for translating polyamine enzyme genes afterrehydration. Journal of Experimental Botany 58:4235–4244 DOI 10.1093/jxb/erm280.
Song L, Zhou Z, Tang S, Zhang Z, Xia S, QinM, Li B,Wen J, Yi B, Shen J, Ma C, FuT, Tu J. 2016. Ectopic expression of BnaC.CP20.1 results in premature tapetalprogrammed cell death in arabidopsis. Plant and Cell Physiology 57(9):1972–1984DOI 10.1093/pcp/pcw119.
Li et al. (2017), PeerJ, DOI 10.7717/peerj.3408 22/23
Steiner-Lange S, Unte US, Eckstein L, Yang CY,Wilson ZA, Schmelzer E, DekkerK, Saedler H. 2003. Disruption of Arabidopsis thaliana MYB26 results inmale sterility due to non-dehiscent anthers. The Plant Journal 34:519–528DOI 10.1046/j.1365-313X.2003.01745.x.
TadegeM, Kuhlemeier C. 1997. Aerobic fermentation during tobacco pollen develop-ment. Plant Molecular Biology 35(3):343–354 DOI 10.1023/A:1005837112653.
Teixeira RT, Knorpp C, Glimelius K. 2005.Modified sucrose, starch, and ATP levelsin two alloplasmic male-sterile lines of B. napus. Journal of Experimental Botany56(414):1245–1253 DOI 10.1093/jxb/eri120.
Weider C, Stamp P, Christov N, Hüsken A, Foueillassar X, Camp KH,MunschM.2009. Stability of cytoplasmic male sterility in maize under different environmentalconditions. Crop Science 49:77–84 DOI 10.2135/cropsci2007.12.0694.
Wise RP, Gobelman-Werner K, Pei D, Dill CL, Schnable PS. 1999.Mitochondrialtranscript processing and restoration of male fertility in T-cytoplasm maize. Journalof Heredity 90(3):380–385 DOI 10.1093/jhered/90.3.380.
WuY,Min L,Wu Z, Yang L, Zhu L, Yang X, Yuan D, Guo X, Zhang X. 2015. Defectivepollen wall contributes to male sterility in the male sterile line 1355A of cotton.Scientific Reports 5:9608 DOI 10.1038/srep09608.
Xie C, Mao X, Huang J, Ding Y,Wu J, Dong S, Kong L, Gao G, Li CY,Wei L. 2011.KOBAS 2.0: a web server for annotation and identification of enriched path-ways and diseases. Nucleic Acids Research 39(Web Server issue):W316–W322DOI 10.1093/nar/gkr483.
Xie HT,Wan ZY, Li S, Zhang Y. 2014. Spatiotemporal production of reactive oxy-gen species by NADPH oxidase is critical for tapetal programmed cell deathand pollen development in Arabidopsis. The Plant Cell 26(5):2007–2023DOI 10.1105/tpc.114.125427.
Xu X, Dietrich CR, DelledonneM, Xia Y,Wen TJ, Robertson DS, Nikolau BJ, SchnablePS. 1997. Sequence analysis of the cloned glossy8 gene of maize suggests that it maycode for a beta-ketoacyl reductase required for the biosynthesis of cuticular waxes.Plant Physiology 115(2):501–510 DOI 10.1104/pp.115.2.501.
Xu X, Dietrich CR, Lessire R, Nikolau BJ, Schnable PS. 2002. The Endoplasmicreticulum-associated maize GL8 protein is a component of the acyl-coenzymeA elongase ivolved in the production of cuticular waxes. Plant Physiology128(3):924–934 DOI 10.1104/pp.010621.
Yang P, Han J, Huang J. 2014. Transcriptome sequencing and de novo analysisof cytoplasmic male sterility and maintenance in JA-CMS cotton. PLOS ONE9(11):e112320 DOI 10.1371/journal.pone.0112320.
Zhong R, Lee C, Zhou J, McCarthy RL, Ye ZH. 2008. A battery of transcription factorsinvolved in the regulation of secondary cell wall biosynthesis in Arabidopsis. ThePlant Cell 20(10):2763–2782 DOI 10.1105/tpc.108.061325.
Zou J, LinW, Luo H, Sun L, Liu C. 2009. Relationship between contents of soluble sugar,soluble protein and free proline and C-cytoplasmic male sterility in maize. Journal ofHunan Agricultural University (Natural Sciences) 35(3):249–251.
Li et al. (2017), PeerJ, DOI 10.7717/peerj.3408 23/23