Embed Size (px)
Citation preview
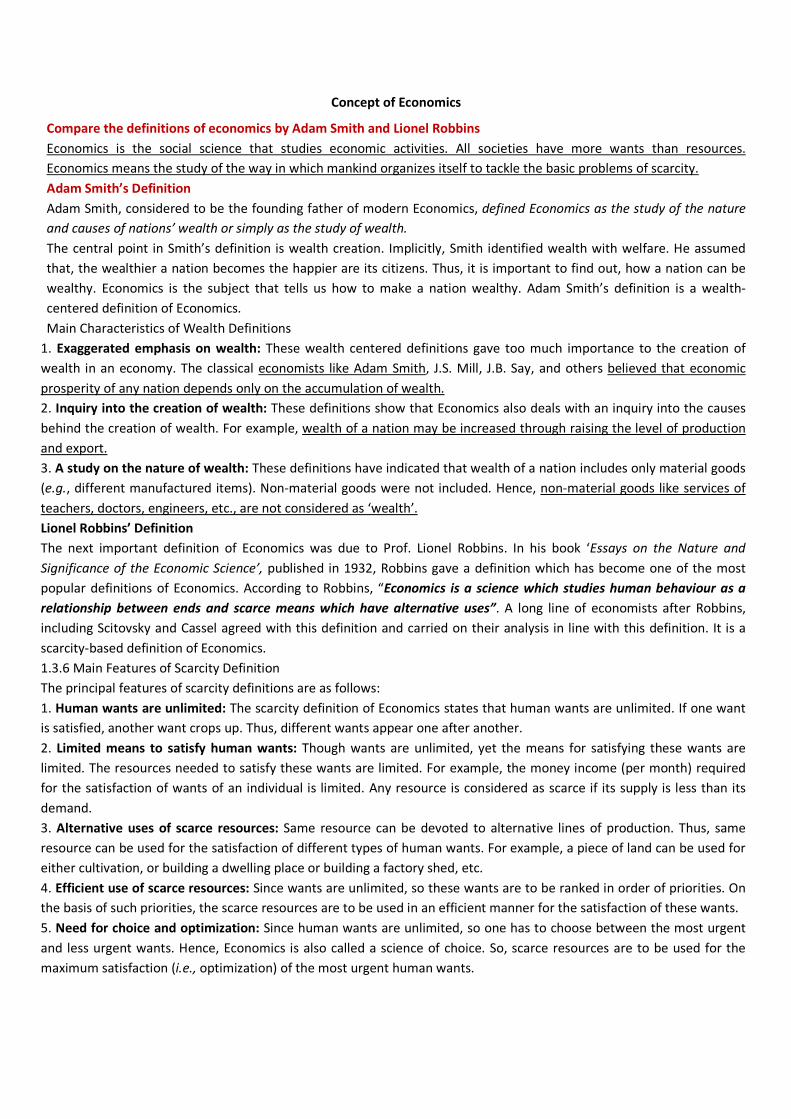
Concept of Economics
Compare the definitions of economics by Adam Smith and Lionel Robbins
Economics is the social science that studies economic activities. All societies have more wants than resources.
Economics means the study of the way in which mankind organizes itself to tackle the basic problems of scarcity.
Adam Smith’s Definition
Adam Smith, considered to be the founding father of modern Economics, defined Economics as the study of the nature
and causes of nations’ wealth or simply as the study of wealth.
The central point in Smith’s definition is wealth creation. Implicitly, Smith identified wealth with welfare. He assumed
that, the wealthier a nation becomes the happier are its citizens. Thus, it is important to find out, how a nation can be
wealthy. Economics is the subject that tells us how to make a nation wealthy. Adam Smith’s definition is a wealth-
centered definition of Economics.
Main Characteristics of Wealth Definitions
1. Exaggerated emphasis on wealth: These wealth centered definitions gave too much importance to the creation of
wealth in an economy. The classical economists like Adam Smith, J.S. Mill, J.B. Say, and others believed that economic
prosperity of any nation depends only on the accumulation of wealth.
2. Inquiry into the creation of wealth: These definitions show that Economics also deals with an inquiry into the causes
behind the creation of wealth. For example, wealth of a nation may be increased through raising the level of production
and export.
3. A study on the nature of wealth: These definitions have indicated that wealth of a nation includes only material goods
(e.g., different manufactured items). Non-material goods were not included. Hence, non-material goods like services of
teachers, doctors, engineers, etc., are not considered as ‘wealth’.
Lionel Robbins’ Definition
The next important definition of Economics was due to Prof. Lionel Robbins. In his book ‘Essays on the Nature and
Significance of the Economic Science’, published in 1932, Robbins gave a definition which has become one of the most
popular definitions of Economics. According to Robbins, “Economics is a science which studies human behaviour as a
relationship between ends and scarce means which have alternative uses”. A long line of economists after Robbins,
including Scitovsky and Cassel agreed with this definition and carried on their analysis in line with this definition. It is a
scarcity-based definition of Economics.
1.3.6 Main Features of Scarcity Definition
The principal features of scarcity definitions are as follows:
1. Human wants are unlimited: The scarcity definition of Economics states that human wants are unlimited. If one want
is satisfied, another want crops up. Thus, different wants appear one after another.
2. Limited means to satisfy human wants: Though wants are unlimited, yet the means for satisfying these wants are
limited. The resources needed to satisfy these wants are limited. For example, the money income (per month) required
for the satisfaction of wants of an individual is limited. Any resource is considered as scarce if its supply is less than its
demand.
3. Alternative uses of scarce resources: Same resource can be devoted to alternative lines of production. Thus, same
resource can be used for the satisfaction of different types of human wants. For example, a piece of land can be used for
either cultivation, or building a dwelling place or building a factory shed, etc.
4. Efficient use of scarce resources: Since wants are unlimited, so these wants are to be ranked in order of priorities. On
the basis of such priorities, the scarce resources are to be used in an efficient manner for the satisfaction of these wants.
5. Need for choice and optimization: Since human wants are unlimited, so one has to choose between the most urgent
and less urgent wants. Hence, Economics is also called a science of choice. So, scarce resources are to be used for the
maximum satisfaction (i.e., optimization) of the most urgent human wants.

Give the definition of economics by Alfred Marshall and explain it.
Economics is the social science that studies economic activities. All societies have more wants than resources.
Economics means the study of the way in which mankind organizes itself to tackle the basic problems of scarcity.
Alfred Marshall’s Definition
Alfred Marshall also stressed the importance of wealth. But he also emphasized the role of the individual in the creation
and the use of wealth. He wrote: “Economics is a study of man in the ordinary business of life. It enquires how he gets
his income and how he uses it. Thus, it is on the one side, the study of wealth and on the other and more important side,
a part of the study of man”. Marshall, therefore, stressed the supreme importance of man in the economic system.
Marshall’s definition is considered to be material-welfare centred definition of Economics.
Features of Material Welfare Definitions
The main features of material welfare-centred definitions are as follows:
1. Study of material requisites of well-being: These definitions indicate that Economics studies only the material aspects
of well-being. Thus, these definitions emphasize the materialistic aspects of economic welfare.
2. Concentrates on the ordinary business of life: These definitions show that Economics deals with the study of man in
the ordinary business of life. Thus, Economics enquires how an individual gets his income and how he uses it.
3. A stress on the role of man: These definitions stressed on the role of man in the creation of wealth or income.
What is meant by positive and normative economics? Distinguish between them.
Positive economics and normative economics
Positive economics (as opposed to normative economics) is the branch of economics that concerns the description and
explanation of economic phenomena. It focuses on facts and cause-and-effect behavioral relationships and includes the
development and testing of economics theories. Positive economics, as science, concerns analysis of
economic behavior. Positive economics as such avoids economic value judgments. For example, a positive
economic theory might describe how money supply growth affects inflation, but it does not provide any instruction on
what policy ought to be followed.
Normative economics (as opposed to positive economics) is that part of economics that expresses value judgments
(normative judgments) about economic fairness or what the economy ought to be like or what goals of public ought to
be.
Differences between positive and normative economics
1. Conceptual differences: Descriptive, factual statements about the world are referred to as positive statements
by economists. The term "positive" isn't used to imply that economists always convey good news, of course, and
economists often make very, well, negative positive statements. Positive analysis, accordingly, uses scientific
principles to arrive at objective, testable conclusions. On the other hand, economists refer to prescriptive, value-
based statements as normative statements. Normative statements usually use factual evidence as support, but
they are not by themselves factual. Instead, they incorporate the opinions and underlying morals and standards
of those people making the statements. Normative analysis refers to the process of making recommendations
about what action should be taken or taking a particular viewpoint on a topic.
2. Positive economics is sometimes defined as the economics of "what is", whereas normative economics discusses
"what ought to be”.
3. Examples of Positive vs. Normative: The distinction between positive and normative statements is easily shows
via examples. The statement – “The unemployment rate is currently at 9 percent”.- is a positive statement, since
it conveys factual, testable information about the world. Statements such as “The unemployment rate is too
high. The government must take action in order to reduce the unemployment rate” - are normative statements,
since they include value judgments and are of a prescriptive nature. It's important to understand that, despite
the fact that the two normative statements above are intuitively related to the positive statement, they cannot
be logically inferred from the objective information provided. (In other words, they don't have to be true given
that the unemployment rate is at 9 percent.)

Why it is important for a banker to know the basic principles of economics?
Economics is all about making choices, and to make good choices we must compare the benefit of something to its cost.
Opportunity cost incorporates the notion of scarcity: No matter what we do, there is always a trade-off. We must trade
off one thing for another because resources are limited and can be used in different ways. By acquiring something, we
use up resources that could have been used to acquire something else. The notion of opportunity cost allows us to
measure this trade-off.
1. People make rational choices: If you drove to work/school today, I bet you would disagree with this one (because of
all of the irrational drivers out there). However, it is an assumption that economists have to make. If people behaved
irrationally, then there would be no chance in the world to predict their behavior. By assuming that people are rational,
and make decisions based on what is best for them, we can break down the decision making process. This allows us to
study the factors that influence decision making.
2. Costs and opportunity costs: The most common use of the word cost is a monetary cost. We have to pay for food, or
movies. But there are other types of costs; in economics we call these opportunity costs. Most decisions involve several
alternatives. For example, if you spend an hour studying for an economics exam, you have one less hour to pursue other
activities.
To determine the opportunity cost of an activity, we look at what you consider the best of these “other” activities. The
principle of opportunity cost can also be applied to decisions about how to spend money from a fixed budget. For
example, suppose that you have a fixed budget to spend on music. You can either buy your music at a local music store
for $15 per CD or you can buy your music online for $1 per song. The opportunity cost of 1 CD is 15 one-dollar online
songs. A hospital with a fixed salary budget can increase the number of doctors only at the expense of nurses or
physician’s assistants. If a doctor costs five times as much as a nurse, the opportunity cost of a doctor is 5 nurses.
3. Benefits: The reason we incur costs is because we also derive benefits from them. Benefits can take many forms, but
the most common are monetary or happiness related. In economics we try to measure happiness using the word
“utility”, but this will be discussed later.
4. Incentives: Incentives are the rewards and punishments we experience every day. We like to get rewards, so we will
generally make a decision so that we will get rewarded. At the same time we don’t like punishment so we will avoid
decisions that will result in us getting punished. Economists are interested in how people respond differently to rewards
and punishments for similar scenarios. For example, is it more effective to reward people for driving safe by lowering
their car insurance premium every year when they don’t get in an accident, or is it better to punish them by jacking up
their rates when they do get in an accident? Economists would use surveys and data to see which is more effective at
getting people to drive safe.
5. Marginal Analysis: Almost everything analyzed in economics is done so on the margin. This means that economists
are interested in the NEXT decision being made. Focusing on the margin means only considering the NEXT piece of pizza
eaten, or the NEXT video game being made. If you are familiar with calculus then this concept makes sense. If not, think
about drinking beer with your friends. Whenever you order your NEXT beer you consider how much you want that NEXT
beer, and how much money that NEXT beer will cost you. While decisions made in the past will affect your happiness
from that NEXT beer, and the amount of money you have, the decision to buy that NEXT beer is made then.
Remember: In economics, we assume people are rational, this allows us to try to predict their behavior through the use
of models. Opportunity costs rule the day in economics, the price of something is its opportunity cost because you are
giving up that money to get it. Everything is analyzed on the margin, I might as well introduce this to you now, you will
get tired of hearing marginal cost=marginal benefit.
B) Discuss the subject matters of economics.
Economics is a social science concerned with the administration of scarce resources. Resources are objects and services
that are capable of satisfying human wants either directly or indirectly by helping to produce other objects and services
whose use satisfies human wants. Scarce resources are those that are insufficient to fill completely all the wants they
cater to; these wants therefore can only be satisfied partially. This raises problems of administration which are the
subject matter of economics. So, the subject matters of economics are-
• to insure the full utilization of scarce resources
• When scarce resources are fully utilized, proper allocation of these resources among their different uses
and to the satisfaction of different wants.
• Proper distribution among consumers of these resources or of the goods and services produced with
their aid.
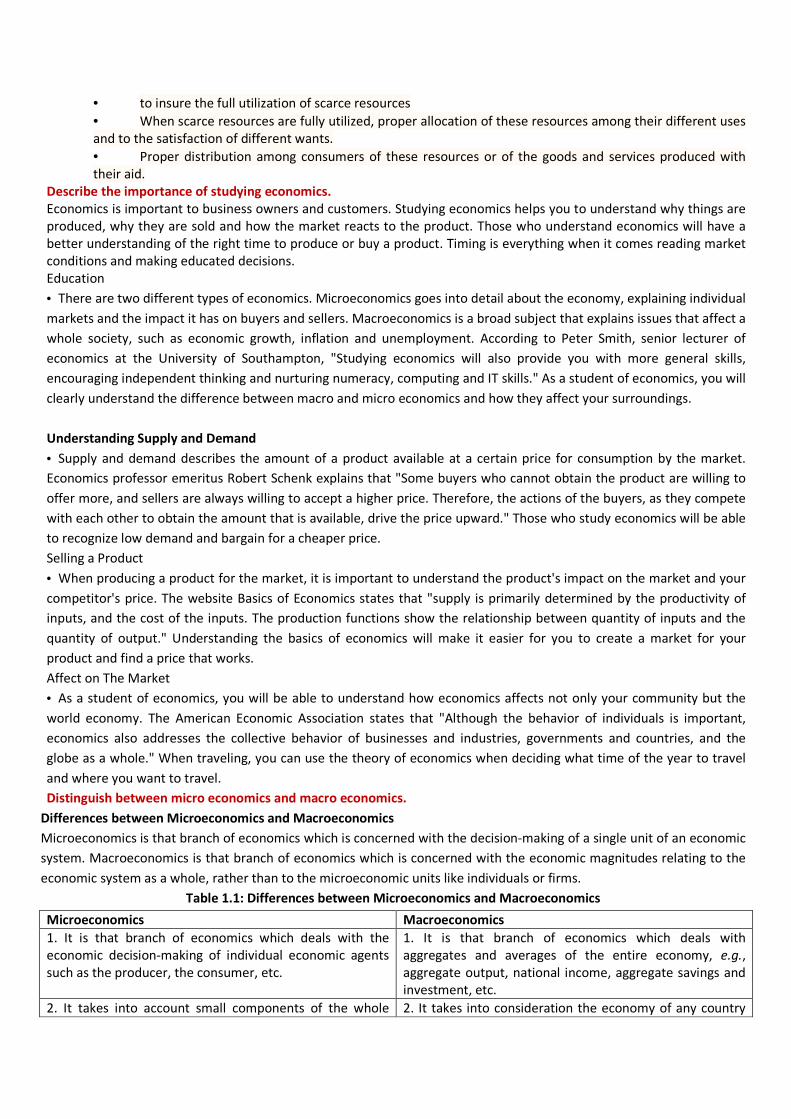
Describe the importance of studying economics.
Economics is important to business owners and customers. Studying economics helps you to understand why things are
produced, why they are sold and how the market reacts to the product. Those who understand economics will have a
better understanding of the right time to produce or buy a product. Timing is everything when it comes reading market
conditions and making educated decisions.
Education
• There are two different types of economics. Microeconomics goes into detail about the economy, explaining individual
markets and the impact it has on buyers and sellers. Macroeconomics is a broad subject that explains issues that affect a
whole society, such as economic growth, inflation and unemployment. According to Peter Smith, senior lecturer of
economics at the University of Southampton, "Studying economics will also provide you with more general skills,
encouraging independent thinking and nurturing numeracy, computing and IT skills." As a student of economics, you will
clearly understand the difference between macro and micro economics and how they affect your surroundings.
Understanding Supply and Demand
• Supply and demand describes the amount of a product available at a certain price for consumption by the market.
Economics professor emeritus Robert Schenk explains that "Some buyers who cannot obtain the product are willing to
offer more, and sellers are always willing to accept a higher price. Therefore, the actions of the buyers, as they compete
with each other to obtain the amount that is available, drive the price upward." Those who study economics will be able
to recognize low demand and bargain for a cheaper price.
Selling a Product
• When producing a product for the market, it is important to understand the product's impact on the market and your
competitor's price. The website Basics of Economics states that "supply is primarily determined by the productivity of
inputs, and the cost of the inputs. The production functions show the relationship between quantity of inputs and the
quantity of output." Understanding the basics of economics will make it easier for you to create a market for your
product and find a price that works.
Affect on The Market
• As a student of economics, you will be able to understand how economics affects not only your community but the
world economy. The American Economic Association states that "Although the behavior of individuals is important,
economics also addresses the collective behavior of businesses and industries, governments and countries, and the
globe as a whole." When traveling, you can use the theory of economics when deciding what time of the year to travel
and where you want to travel.
Distinguish between micro economics and macro economics.
Differences between Microeconomics and Macroeconomics
Microeconomics is that branch of economics which is concerned with the decision-making of a single unit of an economic
system. Macroeconomics is that branch of economics which is concerned with the economic magnitudes relating to the
economic system as a whole, rather than to the microeconomic units like individuals or firms.
Table 1.1: Differences between Microeconomics and Macroeconomics
Microeconomics Macroeconomics
1. It is that branch of economics which deals with the
economic decision-making of individual economic agents
such as the producer, the consumer, etc.
1. It is that branch of economics which deals with
aggregates and averages of the entire economy, e.g.,
aggregate output, national income, aggregate savings and
investment, etc.
2. It takes into account small components of the whole 2. It takes into consideration the economy of any country
What are the main goals of macroeconomic policy?
Macroeconomic goals are three of the five economic goals of a mixed economy that are most important to the study
of macroeconomics. They are full employment, stability, and economic growth.
Full Employment
Full employment is achieved when all available resources (labor, capital, land, and entrepreneurship) are used to
produce goods and services. This goal is commonly indicated by the employment of labor resources (measured by
the unemployment rate). However, all resources in the economy--labor, capital, land, and entrepreneurship--are
important to this goal. The economy benefits from full employment because resources produce the goods that satisfy
the wants and needs that lessen the scarcity problem. If the resources are not employed, then they are not producing
and satisfaction is not achieved.
Stability
Stability is achieved by avoiding or limiting fluctuations in production, employment, and prices. Stability seeks to avoid
the recessionary declines and inflationary expansions of business cycles. This goal is indicated by month-to-month and
year-to-year changes in various economic measures, such as the inflation rate, the unemployment rate, and the growth
rate of production. If these remain unchanged, then stability is at hand. Maintaining stability is beneficial because it
means uncertainty and disruptions in the economy are avoided. It means consumers and businesses can safely pursue
long-term consumption and production plans. Policies makers are usually most concerned with price stability and the
inflation rate.
Economic Growth
Economic growth is achieved by increasing the economy's ability to produce goods and services. This goal is best
indicated by measuring the growth rate of production. If the economy produces more goods this year than last, then it is
growing. Economic growth is also indicated by increases in the quantities of the resources--labor, capital, land, and
entrepreneurship--used to produce goods. With economic growth, society gets more goods that can be used to satisfy
more wants and needs--people are better off; living standards rise; and scarcity is less of a problem.
economy. as a whole.
3. It deals with the process of price determination in case
of individual products and factors of production.
3. It deals with general price-level in any economy.
4. It is known as price theory (since it explains the process
of allocation of economic resources along alternative lines
of production on the basis of relative prices of various
goods and services.)
4. It is also known as the income theory (since it explains
the changing levels of national income in any economy
during any particular time period.)
5. It is concerned with the optimization goals of individual
consumers and producers (e.g., individual consumers are
utility-maximizers, while individual producers are profit
maximizers.)
5. It is concerned with the optimization of the growth
process of the entire economy.
6. It studies the flow of economic resources or factors of
production from any individual owner of such resources to
any individual user of these resources, etc.
6. It studies the circular flow of income and expenditure
between different sectors of the economy (say, between
the firm sector and the household sector.)
7. Microeconomic theories help us in formulating
appropriate policies for resource allocation at the firm
level.
7. Macroeconomic theories help us in formulating
appropriate policies for controlling inflation (i.e., rising
price-level), unemployment, etc.
8. It takes into account the aggregates over homogeneous
or similar products (e.g., the supply of steel in an
economy.)
8. It takes into account the aggregates over heterogeneous
or dissimilar products (say, the Gross Domestic Product of
any country during any year.)
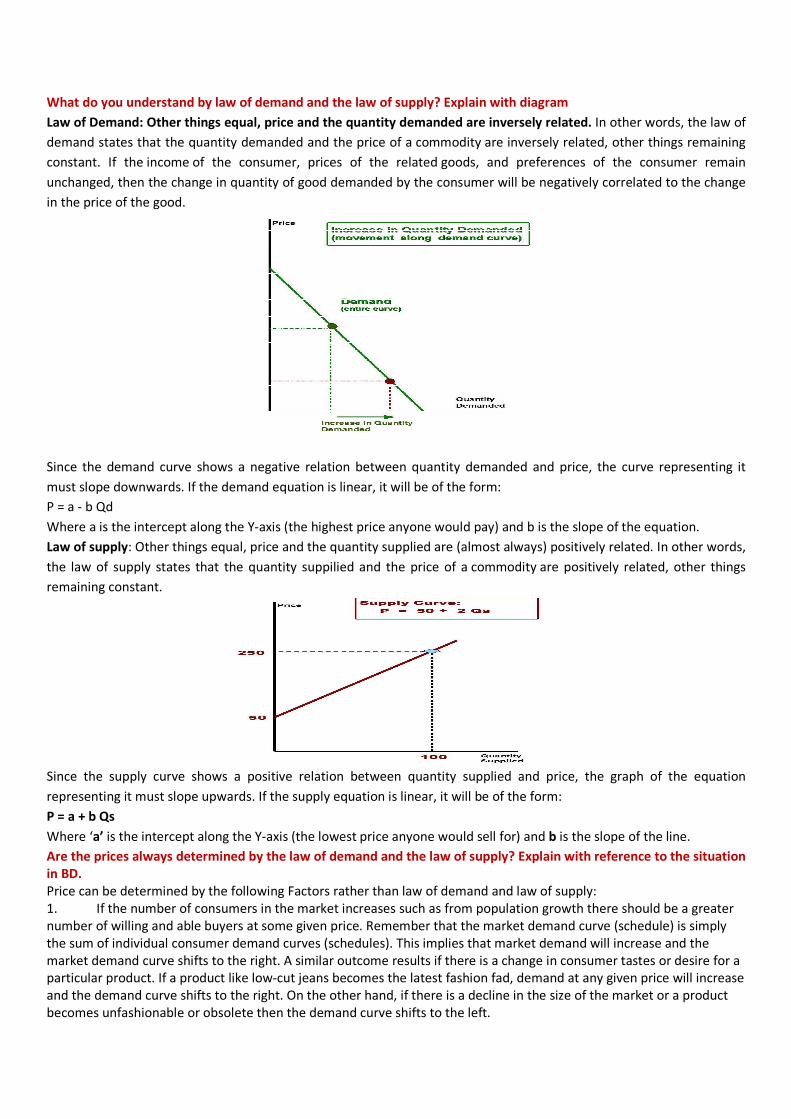
What do you understand by law of demand and the law of supply? Explain with diagram
Law of Demand: Other things equal, price and the quantity demanded are inversely related. In other words, the law of
demand states that the quantity demanded and the price of a commodity are inversely related, other things remaining
constant. If the income of the consumer, prices of the related goods, and preferences of the consumer remain
unchanged, then the change in quantity of good demanded by the consumer will be negatively correlated to the change
in the price of the good.
Since the demand curve shows a negative relation between quantity demanded and price, the curve representing it
must slope downwards. If the demand equation is linear, it will be of the form:
P = a - b Qd
Where a is the intercept along the Y-axis (the highest price anyone would pay) and b is the slope of the equation.
Law of supply: Other things equal, price and the quantity supplied are (almost always) positively related. In other words,
the law of supply states that the quantity suppilied and the price of a commodity are positively related, other things
remaining constant.
Since the supply curve shows a positive relation between quantity supplied and price, the graph of the equation
representing it must slope upwards. If the supply equation is linear, it will be of the form:
P = a + b Qs
Where ‘a’ is the intercept along the Y-axis (the lowest price anyone would sell for) and b is the slope of the line.
Are the prices always determined by the law of demand and the law of supply? Explain with reference to the situation
in BD.
Price can be determined by the following Factors rather than law of demand and law of supply:
1. If the number of consumers in the market increases such as from population growth there should be a greater
number of willing and able buyers at some given price. Remember that the market demand curve (schedule) is simply
the sum of individual consumer demand curves (schedules). This implies that market demand will increase and the
market demand curve shifts to the right. A similar outcome results if there is a change in consumer tastes or desire for a
particular product. If a product like low-cut jeans becomes the latest fashion fad, demand at any given price will increase
and the demand curve shifts to the right. On the other hand, if there is a decline in the size of the market or a product
becomes unfashionable or obsolete then the demand curve shifts to the left.

2. Changes in the prices of complements and substitutes have opposite effects on the demand for a good. As the
price of a complement goes up, demand declines. As the price of a substitute goes up, demand increases.
3. Governments in their infinite wisdom often intervene in markets to control prices and prevent them from
reaching equilibrium. While the goals of market interference often appear noble, microeconomics lets us evaluate the
undesirable consequences. In any free market intervention there will be those who benefit and others who will be hurt.
Economics allows us to identify those whose interests are affected and by how much.
A common method of government intervention is the imposition of a price control in the form of a price ceiling or
a price floor.
Figure 3-4. Price Ceiling
Figure 3-5. Price Floor
4. The cost of production is probably one of the most important influences on the position of the supply curve. As
the cost of production increases, firms will be forced to reduce production unless they can raise the market price of the
final product. At some given price less will now be produced, which means the supply curve will shift to the left.
Costs of production relate to the costs of the human and nonhuman inputs to the production process. An increase in the
costs of inputs such as raw materials, energy, or labor will shift the supply curve to the left. For example, as the price of
fertilizer goes up, some farmers will find it no longer economical to grow wheat. At some given price less wheat will be
produced.
Costs of production can also decline such as from the benefits of technological innovation. With improvements in
technology and lower production costs the supply curve will shift to the right. At some given price more will be
produced.
What is meant by “Ceterus perebus” used in the law of demand?
When we described the Law of Demand and the Law of Supply we made a similar important statement with respect to
both: given that everything else remains unchanged. This is referred to as the ceteris paribus assumption. This is not an
assumption we make for convenience but is a necessary condition for each law to hold. The term implies that other
factors of demand, except the price of a good, are unchanged. If they don't remain constant, the inverse relation may
not hold well. We assume by this clause that income, the prices of substitutes and complements, and consumer tastes
and perceptions of quality remain the same.This does not mean these factors cannot change.
a. If income goes up and the price of gas goes up, we cannot be sure whether the quantity of gas purchased will increase
(due to higher income) or decrease (due to higher prices).
b. If the price of substitutes increases, an increase in the price of the good itself might fail to decrease the quantity
demanded. If the price of coffee goes up, but the price of tea goes up even more, more rather than less coffee may be
drunk. This would not violate the law of demand, since other things did not stay the same.
c. If the price of complements decreases, an increase in the price of the good itself might fail to decrease the quantity
demanded. If you only use sugar in your coffee, and the price of coffee falls from (say) $ 6.00 a pound to 10 cents a
pound, you might use more sugar even if the price of sugar went up.
d. If consumer tastes change, an increase in the price of the good itself might fail to decrease the quantity demanded. If
it is reported that dark chocolate helps prevent cancer, the amount of dark chocolate purchased will increase even if the
price of dark chocolate increases.

In all four of the examples above, we would say that demand increased due to the rise in income, or the rise in the price
of substitutes, or the fall in the price of complements.
Other factors influence in law of demand:
(5) Government Policy
(6) Other Factors:
(i) Size and Composition of Population
(ii) Distribution of Income and Wealth
(iii) Economic Fluctuations
What is the difference between change in demand (movement along demand curve)/quantity demanded and
increase and decrease in demand (shift in demand)?
A change in the price of the product leads to a change in the quantity demanded and a movement along the demand
curve. The higher the price of a good, the lower is the quantity demanded. This relationship is shown in Figure 3.1 with
the movement along __ from 4,000 to 2,000 street hockey balls demanded per week in response to a rise in price from
$2 to $4 for a street hockey ball.
A change in demand and a shift in the demand curve, occur when any factor that affects buying plans, other than the
price of the product changes. An increase in demand means that the demand curve shifts rightward, such as the shift
from __ to __ in Figure 3.1; a decrease in demand refers to a shift leftward. The demand curve shifts from changes in the
following:
♦prices of related goods — a rise in the price of a substitute increases demand and the demand curve shifts rightward; a
rise in the price of a complement decreases demand and the demand curve shifts leftward.
♦expected future prices — if a product’s price is expected to rise in the future, the current demand for it increases and
the demand curve shifts rightward.
♦Income — for a normal good, an increase in income increases demand and the demand curve shifts rightward; for an
inferior good an increase in income decreases demand and the demand curve shifts leftward.
♦Population — an increase in population increases demand and the demand curve shifts rightward.
♦Preferences — if people decide they like a good more, its demand increases and the demand curve shifts rightward.
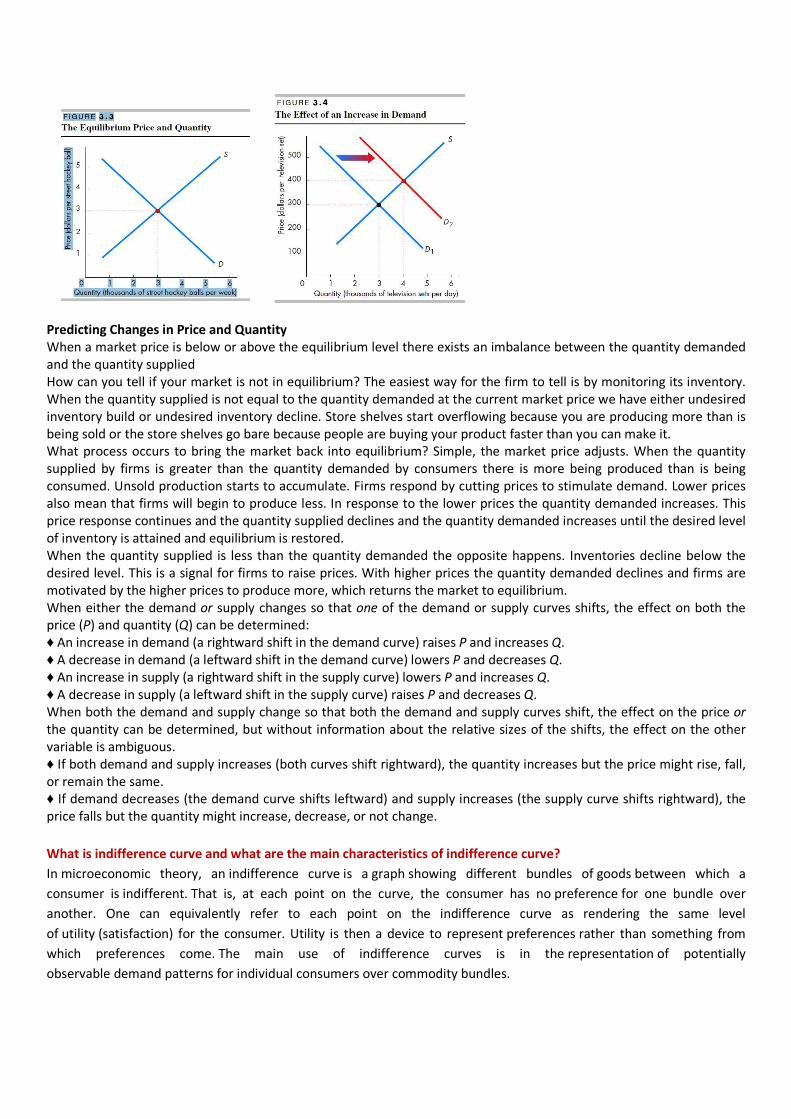
Illustrate how equilibrium market price is determined through the interaction of demand and supply?
The equilibrium price is determined by the intersection of the demand and supply curves. It is the price at which the
quantity demanded equals the quantity supplied. The equilibrium quantity is the quantity bought and sold at the
equilibrium price. Economists often refer to equilibrium as the "market clearing price" where all willing sellers find all
willing buyers. Figure 3.3 shows the equilibrium price, $3, and the equilibrium quantity, 3,000 street hockey balls per
week. At a price below the equilibrium price, a shortage exists and the price will rise. At a price above the equilibrium
price, a surplus exists and the price will fall. Only at the equilibrium price does the price not change.
Predicting Changes in Price and Quantity
When a market price is below or above the equilibrium level there exists an imbalance between the quantity demanded
and the quantity supplied
How can you tell if your market is not in equilibrium? The easiest way for the firm to tell is by monitoring its inventory.
When the quantity supplied is not equal to the quantity demanded at the current market price we have either undesired
inventory build or undesired inventory decline. Store shelves start overflowing because you are producing more than is
being sold or the store shelves go bare because people are buying your product faster than you can make it.
What process occurs to bring the market back into equilibrium? Simple, the market price adjusts. When the quantity
supplied by firms is greater than the quantity demanded by consumers there is more being produced than is being
consumed. Unsold production starts to accumulate. Firms respond by cutting prices to stimulate demand. Lower prices
also mean that firms will begin to produce less. In response to the lower prices the quantity demanded increases. This
price response continues and the quantity supplied declines and the quantity demanded increases until the desired level
of inventory is attained and equilibrium is restored.
When the quantity supplied is less than the quantity demanded the opposite happens. Inventories decline below the
desired level. This is a signal for firms to raise prices. With higher prices the quantity demanded declines and firms are
motivated by the higher prices to produce more, which returns the market to equilibrium.
When either the demand or supply changes so that one of the demand or supply curves shifts, the effect on both the
price (P) and quantity (Q) can be determined:
♦ An increase in demand (a rightward shift in the demand curve) raises P and increases Q.
♦ A decrease in demand (a leftward shift in the demand curve) lowers P and decreases Q.
♦ An increase in supply (a rightward shift in the supply curve) lowers P and increases Q.
♦ A decrease in supply (a leftward shift in the supply curve) raises P and decreases Q.
When both the demand and supply change so that both the demand and supply curves shift, the effect on the price or
the quantity can be determined, but without information about the relative sizes of the shifts, the effect on the other
variable is ambiguous.
♦ If both demand and supply increases (both curves shift rightward), the quantity increases but the price might rise, fall,
or remain the same.
♦ If demand decreases (the demand curve shifts leftward) and supply increases (the supply curve shifts rightward), the
price falls but the quantity might increase, decrease, or not change.
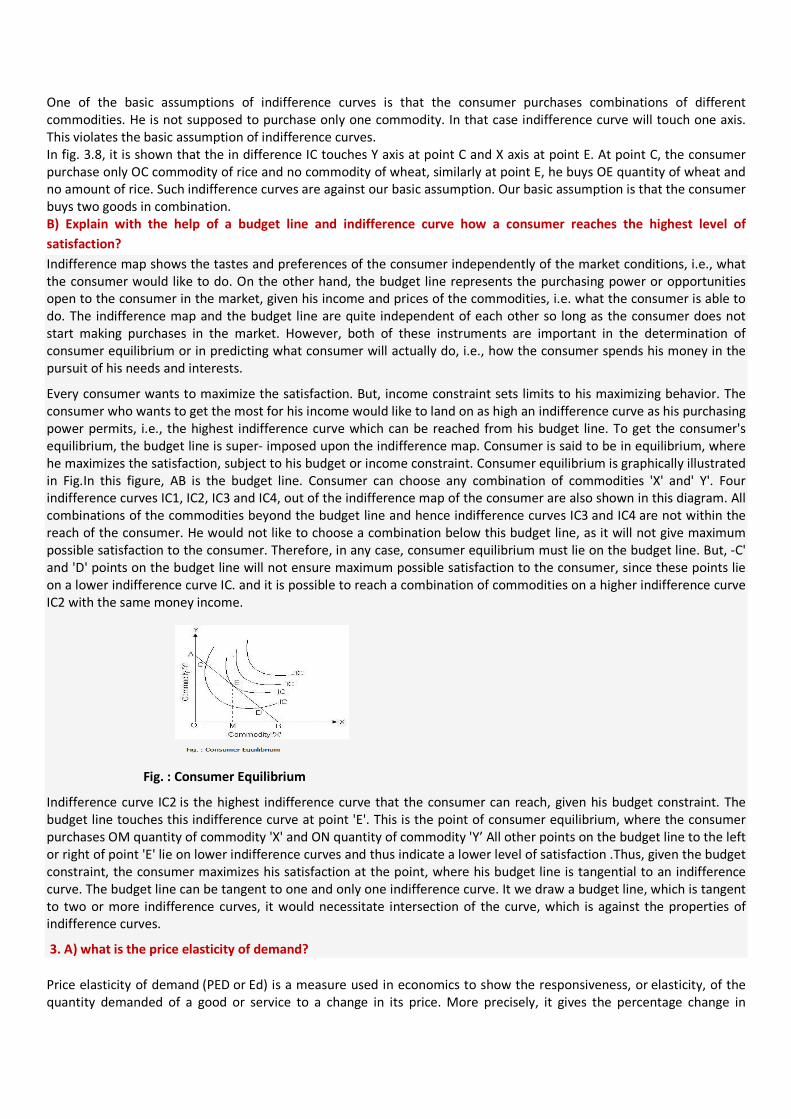
What is indifference curve and what are the main characteristics of indifference curve?
In microeconomic theory, an indifference curve is a graph showing different bundles of goods between which a
consumer is indifferent. That is, at each point on the curve, the consumer has no preference for one bundle over
another. One can equivalently refer to each point on the indifference curve as rendering the same level
of utility (satisfaction) for the consumer. Utility is then a device to represent preferences rather than something from
which preferences come. The main use of indifference curves is in the representation of potentially
observable demand patterns for individual consumers over commodity bundles.

The main attributes or properties or characteristics of indifference curves are as follows:
(1) Indifference Curves are Negatively Sloped:
The indifference curves must slope down from left to right. This means that an indifference curve is negatively sloped. It
slopes downward because as the consumer increases the consumption of X commodity, he has to give up certain units
of Y commodity in order to maintain the same level of satisfaction.
In fig. 3.4 the two combinations of commodity cooking oil and commodity wheat is shown by the points a and b on the
same indifference curve. The consumer is indifferent towards points a and b as they represent equal level of satisfaction.
At point (a) on the indifference curve, the consumer is satisfied with OE units of ghee and OD units of wheat. He is
equally satisfied with OF units of ghee and OK units of wheat shown by point b on the indifference curve. It is only on
the negatively sloped curve that different points representing different combinations of goods X and Y give the same
level of satisfaction to make the consumer indifferent.
(2) Higher Indifference Curve Represents Higher Level:
A higher indifference curve that lies above and to the right of another indifference curve represents a higher level of
satisfaction and combination on a lower indifference curve yields a lower satisfaction.
In other words, we can say that the combination of goods which lies on a higher indifference curve will be preferred by a
consumer to the combination which lies on a lower indifference curve.
In this diagram (3.5) there are three indifference curves, IC1, IC2 and IC3 which represents different levels of satisfaction.
The indifference curve IC3 shows greater amount of satisfaction and it contains more of both goods than IC2 and
IC1 (IC3 > IC2 > IC1).
(3) Indifference Curve are Convex to the Origin:
This is an important property of indifference curves. They are convex to the origin (bowed inward). This is equivalent to
saying that as the consumer substitute’s commodity X for commodity Y, the marginal rate of substitution diminishes of X
for Y along an indifference curve.
In this figure (3.6) as the consumer moves from A to B to C to D, the willingness to substitute good X for good Y
diminishes. This means that as the amount of good X is increased by equal amounts, that of good Y diminishes by
smaller amounts. The marginal rate of substitution of X for Y is the quantity of Y good that the consumer is willing to give
up to gain a marginal unit of good X. The slope of IC is negative. It is convex to the origin.
(4) Indifference Curve Cannot Intersect Each Other:
Given the definition of indifference curve and the assumptions behind it, the indifference curves cannot intersect each
other. It is because at the point of tangency, the higher curve will give as much as of the two commodities as is given by
the lower indifference curve. This is absurd and impossible.
In fig 3.7, two indifference curves are showing cutting each other at point B. The combinations represented by points B
and F given equal satisfaction to the consumer because both lie on the same indifference curve IC2. Similarly the
combinations shows by points B and E on indifference curve IC1 give equal satisfaction top the consumer.
If combination F is equal to combination B in terms of satisfaction and combination E is equal to combination B in
satisfaction. It follows that the combination F will be equivalent to E in terms of satisfaction. This conclusion looks quite
funny because combination F on IC2 contains more of good Y (wheat) than combination which gives more satisfaction to
the consumer. We, therefore, conclude that indifference curves cannot cut each other.
(5) Indifference Curves do not Touch the Horizontal or Vertical Axis:
One of the basic assumptions of indifference curves is that the consumer purchases combinations of different
commodities. He is not supposed to purchase only one commodity. In that case indifference curve will touch one axis.
This violates the basic assumption of indifference curves.
In fig. 3.8, it is shown that the in difference IC touches Y axis at point C and X axis at point E. At point C, the consumer
purchase only OC commodity of rice and no commodity of wheat, similarly at point E, he buys OE quantity of wheat and
no amount of rice. Such indifference curves are against our basic assumption. Our basic assumption is that the consumer
buys two goods in combination.
B) Explain with the help of a budget line and indifference curve how a consumer reaches the highest level of
satisfaction?
Indifference map shows the tastes and preferences of the consumer independently of the market conditions, i.e., what
the consumer would like to do. On the other hand, the budget line represents the purchasing power or opportunities
open to the consumer in the market, given his income and prices of the commodities, i.e. what the consumer is able to
do. The indifference map and the budget line are quite independent of each other so long as the consumer does not
start making purchases in the market. However, both of these instruments are important in the determination of
consumer equilibrium or in predicting what consumer will actually do, i.e., how the consumer spends his money in the
pursuit of his needs and interests.
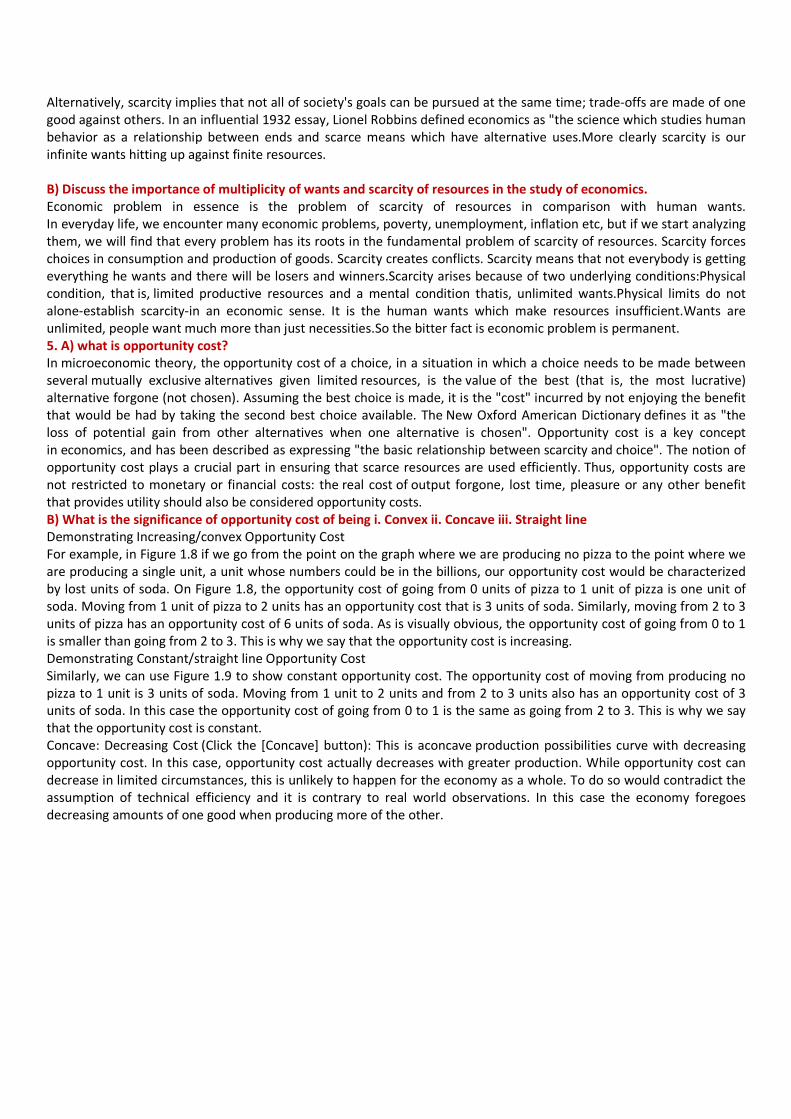
Every consumer wants to maximize the satisfaction. But, income constraint sets limits to his maximizing behavior. The
consumer who wants to get the most for his income would like to land on as high an indifference curve as his purchasing
power permits, i.e., the highest indifference curve which can be reached from his budget line. To get the consumer's
equilibrium, the budget line is super- imposed upon the indifference map. Consumer is said to be in equilibrium, where
he maximizes the satisfaction, subject to his budget or income constraint. Consumer equilibrium is graphically illustrated
in Fig.In this figure, AB is the budget line. Consumer can choose any combination of commodities 'X' and' Y'. Four
indifference curves IC1, IC2, IC3 and IC4, out of the indifference map of the consumer are also shown in this diagram. All
combinations of the commodities beyond the budget line and hence indifference curves IC3 and IC4 are not within the
reach of the consumer. He would not like to choose a combination below this budget line, as it will not give maximum
possible satisfaction to the consumer. Therefore, in any case, consumer equilibrium must lie on the budget line. But, -C'
and 'D' points on the budget line will not ensure maximum possible satisfaction to the consumer, since these points lie
on a lower indifference curve IC. and it is possible to reach a combination of commodities on a higher indifference curve
IC2 with the same money income.
Fig. : Consumer Equilibrium
Indifference curve IC2 is the highest indifference curve that the consumer can reach, given his budget constraint. The
budget line touches this indifference curve at point 'E'. This is the point of consumer equilibrium, where the consumer
purchases OM quantity of commodity 'X' and ON quantity of commodity 'Y’ All other points on the budget line to the left
or right of point 'E' lie on lower indifference curves and thus indicate a lower level of satisfaction .Thus, given the budget
constraint, the consumer maximizes his satisfaction at the point, where his budget line is tangential to an indifference
curve. The budget line can be tangent to one and only one indifference curve. It we draw a budget line, which is tangent
to two or more indifference curves, it would necessitate intersection of the curve, which is against the properties of
indifference curves.
3. A) what is the price elasticity of demand?
Price elasticity of demand (PED or Ed) is a measure used in economics to show the responsiveness, or elasticity, of the
quantity demanded of a good or service to a change in its price. More precisely, it gives the percentage change in

quantity demanded in response to a one percent change in price (ceteris paribus, i.e. holding constant all the other
determinants of demand, such as income). It was devised by Alfred Marshall.
PED is calculated as follows:
PED �% change in quantity demanded
% chnage in price
PROPERTIES OF PRICE ELASTICITY OF DEMAND:
• Price elasticities are almost always negative, although analysts tend to ignore the sign even though this
can lead to ambiguity. Only goods which do not conform to the law of demand, such as Veblen and Giffen
goods, have a positive PED.
• In general, the demand for a good is said to be inelastic (or relatively inelastic) when the PED is less than
one (in absolute value): that is, changes in price have a relatively small effect on the quantity of the good
demanded.
• The demand for a good is said to be elastic (or relatively elastic) when its PED is greater than one (in
absolute value): that is, changes in price have a relatively large effect on the quantity of a good demanded.
• When the price elasticity of demand is one, we say that demand has unit elasticity.
• Necessities tend to have inelastic demand.
• Luxuries tend to have elastic demand.
• Demand is elastic when there are closesubstitutes.
• Elasticity is greater when the market isdefined more narrowly: food vs. ice cream.
• Elasticity is greater in the long run, aspeople are more free to adjust their behavior.
• Elasticity depends on where we are on the demand curve. For a straight line demand curve, elasticity is
highest when the price is high (and quantity is low).
B) show how the quantity demanded of a commodity responds to price changes when I) demand is perfectly inelastic
II) demand is perfectly elastic II) elasticity of demand is equal to unity. Use diagram for each case.Samuelson 68
I. When the price elasticity of demand for a good is perfectly inelastic (Ed = 0), changes in the price do not affect the
quantity demanded for the good; raising prices will always cause total revenue to increase. Goods necessary to survival
can be classified here; a rational person will be willing to pay anything for a good if the alternative is death. For example,
a person in the desert weak and dying of thirst would easily give all the money in his wallet, no matter how much, for a
bottle of water if he would otherwise die. His demand is not contingent on the price.
II.When the price elasticity of demand for a good is unit (or unitary) elastic (Ed = -1), the percentage change in quantity is
equal to that in price, so a change in price will not affect total revenue.
III. When the price elasticity of demand for a good is perfectly elastic (Ed is − ∞), any increase in the price, no matter how
small, will cause demand for the good to drop to zero. Hence, when the price is raised, the total revenue falls to zero.
This situation is typical for goods that have their value defined by law (such as fiat currency); if a 5 dollar bill were sold
for anything more than 5 dollars, nobody would buy it, so demand is zero.
C) Calculate the price elasticity of demand when the price per unit of product falls from Tk, 5 to Tk 4 and the quantity
demanded rises from 4 units to 5 units.
PED �% change in quantity demanded
% chnage in price
PED �� 5 � 4�/100
�4 � 5�/100
PED � �1
D) Using formula, distinguish between price elasticity of demand and income elasticity of demand.

Price elasticity of demand (PED or Ed) is a measure used in economics to show the responsiveness, or elasticity, of the
quantity demanded of a good or service to a change in its price. More precisely, it gives the percentage change in
quantity demanded in response to a one percent change in price (ceteris paribus, i.e. holding constant all the other
determinants of demand, such as income). It was devised by Alfred Marshall.
PED �% change in quantity demanded
% change in price
• Price elasticities are almost always negative, although analysts tend to ignore the sign even though this can lead to
ambiguity. Only goods which do not conform to the law of demand, such as Veblen and Giffen goods, have a positive
PED.
• In general, the demand for a good is said to be inelastic (or relatively inelastic) when the PED is less than one (in
absolute value): that is, changes in price have a relatively small effect on the quantity of the good demanded.
• The demand for a good is said to be elastic (or relatively elastic) when its PED is greater than one (in absolute value):
that is, changes in price have a relatively large effect on the quantity of a good demanded.
• When the price elasticity of demand is one, we say that demand has unit elasticity.
In economics, income elasticity of demand measures the responsiveness of the demand for a good to a change in the
income of the people demanding the good, ceteris paribus. It is calculated as the ratio of the percentage change in
demand to the percentage change in income. For example, if, in response to a 10% increase in income, the demand for a
good increased by 20%, the income elasticity of demand would be 20%/10% = 2.
IED �% change in quantity demanded
% change in Income
• A negative income elasticity of demand is associated with inferior goods; an increase in income will lead to a fall in the
demand and may lead to changes to more luxurious substitutes.
• A positive income elasticity of demand is associated with normal goods; an increase in income will lead to a rise in
demand. If income elasticity of demand of a commodity is less than 1, it is a necessity good. If the elasticity of demand is
greater than 1, it is a luxury good or a superior good.
• A zero income elasticity (or inelastic) demand occurs when an increase in income is not associated with a change in
the demand of a good. These would be sticky goods.
E) What is the significance of price elasticity of demand in practical life?
F) What is the relationship between marginal income, average income and price elasticity of demand?
Price elasticity of demand is defined as the measure of responsiveness in the quantity demanded for a commodity as a
result of change in price of the same commodity. In other words, it is percentage change in quantity demanded as per
the percentage change in price of the same commodity. In economics and business studies, the price elasticity of
demand (PED) is a measure of the sensitivity of quantity demanded to changes in price. It is measured as elasticity that is
it measures the relationship as the ratio of percentage changes between quantity demanded of a good and changes in
its price. Drinking water is a good example of a good that has inelastic characteristics in that people will pay anything for
it (high or low prices with relatively equivalent quantity demanded), so it is not elastic. On the other hand, demand for
sugar is very elastic because as the price of sugar increases, there are many substitutions which consumers may switch
to.
In microeconomics, Marginal Revenue (MR) is the extra revenue that an additional unit of product will bring. It can also
be described as the change in total revenue/change in number of units sold.
More formally, marginal revenue is equal to the change in total revenue over the change in quantity when the change in
quantity is equal to one unit (or the change in output in the bracket where the change in revenue has occurred)
This can also be represented as a derivative. (Total revenue) = (Price Demanded) times (Quantity)
4. A) explain the terms “want” and “scarcity” as understood in economics/
In economics, a want is something that is desired. It is said that every person has unlimited wants, but limited resources.
Thus, people cannot have everything they want and must look for the most affordable alternatives.
Scarcity is the fundamental economic problem of having seemingly unlimited human wants and needs in a world of
limited resources. It states that society has insufficient productive resources to fulfill all human wants and needs.
Alternatively, scarcity implies that not all of society's goals can be pursued at the same time; trade-offs are made of one
good against others. In an influential 1932 essay, Lionel Robbins defined economics as "the science which studies human
behavior as a relationship between ends and scarce means which have alternative uses.More clearly scarcity is our
infinite wants hitting up against finite resources.
B) Discuss the importance of multiplicity of wants and scarcity of resources in the study of economics.
Economic problem in essence is the problem of scarcity of resources in comparison with human wants.
In everyday life, we encounter many economic problems, poverty, unemployment, inflation etc, but if we start analyzing
them, we will find that every problem has its roots in the fundamental problem of scarcity of resources. Scarcity forces
choices in consumption and production of goods. Scarcity creates conflicts. Scarcity means that not everybody is getting
everything he wants and there will be losers and winners.Scarcity arises because of two underlying conditions:Physical
condition, that is, limited productive resources and a mental condition thatis, unlimited wants.Physical limits do not
alone-establish scarcity-in an economic sense. It is the human wants which make resources insufficient.Wants are
unlimited, people want much more than just necessities.So the bitter fact is economic problem is permanent.
5. A) what is opportunity cost?
In microeconomic theory, the opportunity cost of a choice, in a situation in which a choice needs to be made between
several mutually exclusive alternatives given limited resources, is the value of the best (that is, the most lucrative)
alternative forgone (not chosen). Assuming the best choice is made, it is the "cost" incurred by not enjoying the benefit
that would be had by taking the second best choice available. The New Oxford American Dictionary defines it as "the
loss of potential gain from other alternatives when one alternative is chosen". Opportunity cost is a key concept
in economics, and has been described as expressing "the basic relationship between scarcity and choice". The notion of
opportunity cost plays a crucial part in ensuring that scarce resources are used efficiently. Thus, opportunity costs are
not restricted to monetary or financial costs: the real cost of output forgone, lost time, pleasure or any other benefit
that provides utility should also be considered opportunity costs.
B) What is the significance of opportunity cost of being i. Convex ii. Concave iii. Straight line
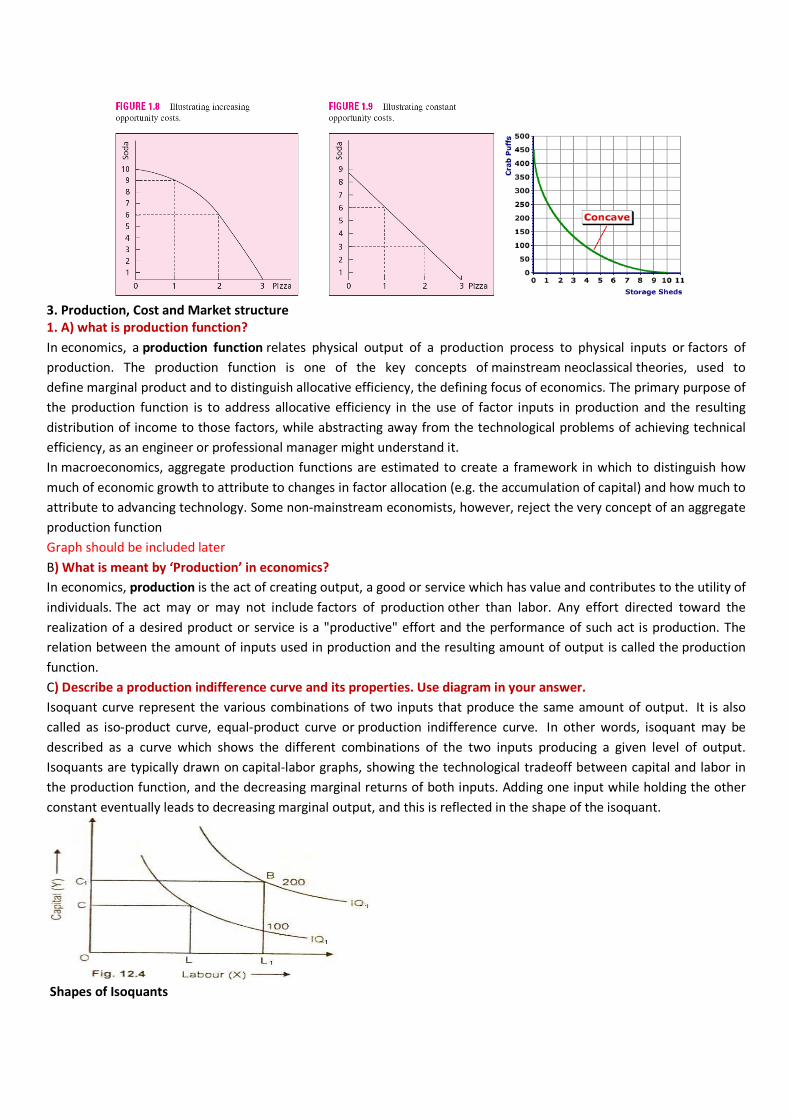
Demonstrating Increasing/convex Opportunity Cost
For example, in Figure 1.8 if we go from the point on the graph where we are producing no pizza to the point where we
are producing a single unit, a unit whose numbers could be in the billions, our opportunity cost would be characterized
by lost units of soda. On Figure 1.8, the opportunity cost of going from 0 units of pizza to 1 unit of pizza is one unit of
soda. Moving from 1 unit of pizza to 2 units has an opportunity cost that is 3 units of soda. Similarly, moving from 2 to 3
units of pizza has an opportunity cost of 6 units of soda. As is visually obvious, the opportunity cost of going from 0 to 1
is smaller than going from 2 to 3. This is why we say that the opportunity cost is increasing.
Demonstrating Constant/straight line Opportunity Cost
Similarly, we can use Figure 1.9 to show constant opportunity cost. The opportunity cost of moving from producing no
pizza to 1 unit is 3 units of soda. Moving from 1 unit to 2 units and from 2 to 3 units also has an opportunity cost of 3
units of soda. In this case the opportunity cost of going from 0 to 1 is the same as going from 2 to 3. This is why we say
that the opportunity cost is constant.
Concave: Decreasing Cost (Click the [Concave] button): This is aconcave production possibilities curve with decreasing
opportunity cost. In this case, opportunity cost actually decreases with greater production. While opportunity cost can
decrease in limited circumstances, this is unlikely to happen for the economy as a whole. To do so would contradict the
assumption of technical efficiency and it is contrary to real world observations. In this case the economy foregoes
decreasing amounts of one good when producing more of the other.
3. Production, Cost and Market structure
1. A) what is production function?
In economics, a production function relates physical output of a production process to physical inputs or factors of
production. The production function is one of the key concepts of mainstream neoclassical theories, used to
define marginal product and to distinguish allocative efficiency, the defining focus of economics. The primary purpose of
the production function is to address allocative efficiency in the use of factor inputs in production and the resulting
distribution of income to those factors, while abstracting away from the technological problems of achieving technical
efficiency, as an engineer or professional manager might understand it.
In macroeconomics, aggregate production functions are estimated to create a framework in which to distinguish how
much of economic growth to attribute to changes in factor allocation (e.g. the accumulation of capital) and how much to
attribute to advancing technology. Some non-mainstream economists, however, reject the very concept of an aggregate
production function
Graph should be included later
B) What is meant by ‘Production’ in economics?
In economics, production is the act of creating output, a good or service which has value and contributes to the utility of
individuals. The act may or may not include factors of production other than labor. Any effort directed toward the
realization of a desired product or service is a "productive" effort and the performance of such act is production. The
relation between the amount of inputs used in production and the resulting amount of output is called the production
function.
C) Describe a production indifference curve and its properties. Use diagram in your answer.
Isoquant curve represent the various combinations of two inputs that produce the same amount of output. It is also
called as iso-product curve, equal-product curve or production indifference curve. In other words, isoquant may be
described as a curve which shows the different combinations of the two inputs producing a given level of output.
Isoquants are typically drawn on capital-labor graphs, showing the technological tradeoff between capital and labor in
the production function, and the decreasing marginal returns of both inputs. Adding one input while holding the other
constant eventually leads to decreasing marginal output, and this is reflected in the shape of the isoquant.
Shapes of Isoquants

If the two inputs are perfect substitutes, the resulting isoquant map generated is represented in fig. A; with a given level
of production Q3, input X can be replaced by input Y at an unchanging rate. The perfect substitute inputs do not
experience decreasing marginal rates of return when they are substituted for each other in the production function.
If the two inputs are perfect complements, the isoquant map takes the form of fig. B; with a level of production Q3,
input X and input Y can only be combined efficiently in the certain ratio occurring at the kink in the isoquant. The firm
will combine the two inputs in the required ratio to maximize profit.
Example of an isoquant map with two inputs that are perfect substitutes
B) Example of an isoquant map with two inputs that are perfect complements.
Properties of Isoquants:
The main properties of the isoquants are similar to those of indifference curves. These properties are now discussed in
brief:
(i) An Isoquant Slopes Downward from Left to Right:
This implies that the Isoquant is a negatively sloped curve. This is because when the quantify of factor K (capital) is
increased, the quantity of L (labor) must be reduced so as to keep the same level of output.
The figure (12.3) depicts that an isoquant IP is negatively sloped curve. This curve shows that as the amount of factor K is
increased from one unit to 2 units, the units of factor L are decreased from 20 to 15 only so that output of 100 units
remains constant.
(ii) An Isoquant that Lies Above and to the Right of Another Represents a Higher Output Level:
It means a higher isoquant represents higher level of output.
The figure 12.4 represents this property. It shows that greater output can be secured by increasing the quantity
combinations of both the factors X and Y. The producer increases the output from 100 units to 200 units by increasing
the quantity combination of both the X and Y. The combination of OC of capital and OL of labor yield 100 units of
production. The production can be increased to 200 units by increasing the capital from OC to OC1and labor from OL to
OL1.
(iii) Isoquants Cannot Cut Each Other:
The two isoquants cannot intersect each other.
If two isoquant are drawn to intersect each other as is shown in this figure 12.5, then it is a negation of the property that
higher Isoquant represents higher level of output to a lower Isoquant. The intersection at point E shows that the same
factor combination can produce 100 units as well as 200 units. But this is quite absurd. How can the same level of factor
combination produce two different levels of output, when the technique of production remains unchanged. Hence two
isoquants cannot intersect each other.
(iv) Isoquants are Convex to the Origin:
This property implies that the marginal significance of one factor in terms of another factor diminishes along an ISO
product curve. In other words, the isoquants are convex to the origin due to diminishing marginal rate of substitution.
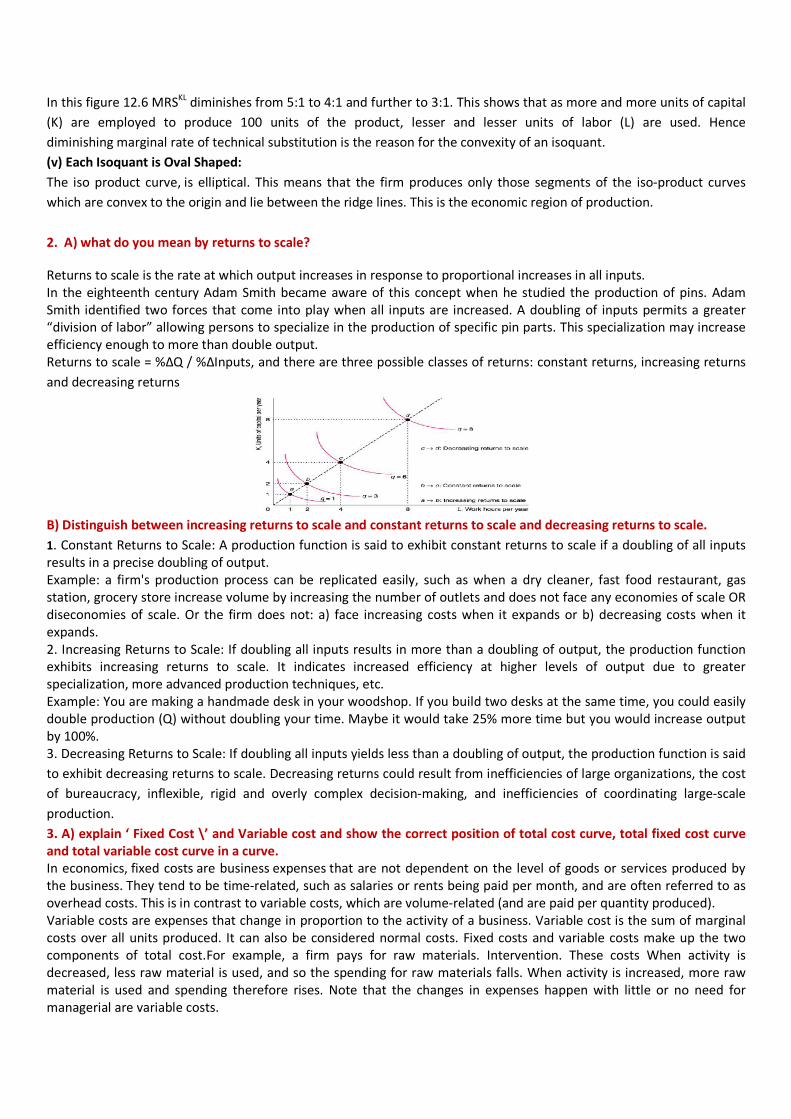
In this figure 12.6 MRSKL diminishes from 5:1 to 4:1 and further to 3:1. This shows that as more and more units of capital
(K) are employed to produce 100 units of the product, lesser and lesser units of labor (L) are used. Hence
diminishing marginal rate of technical substitution is the reason for the convexity of an isoquant.
(v) Each Isoquant is Oval Shaped:
The iso product curve, is elliptical. This means that the firm produces only those segments of the iso-product curves
which are convex to the origin and lie between the ridge lines. This is the economic region of production.
2. A) what do you mean by returns to scale?
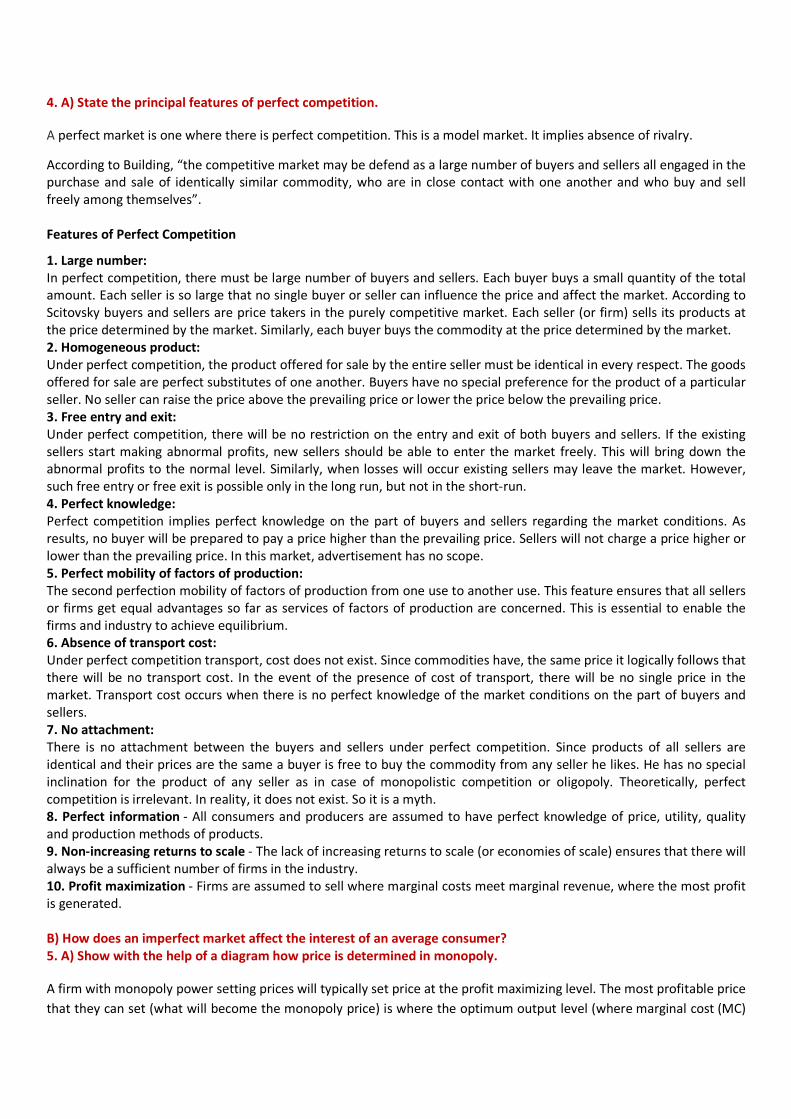
Returns to scale is the rate at which output increases in response to proportional increases in all inputs.
In the eighteenth century Adam Smith became aware of this concept when he studied the production of pins. Adam
Smith identified two forces that come into play when all inputs are increased. A doubling of inputs permits a greater
“division of labor” allowing persons to specialize in the production of specific pin parts. This specialization may increase
efficiency enough to more than double output.
Returns to scale = %ΔQ / %ΔInputs, and there are three possible classes of returns: constant returns, increasing returns
and decreasing returns
B) Distinguish between increasing returns to scale and constant returns to scale and decreasing returns to scale.
1. Constant Returns to Scale: A production function is said to exhibit constant returns to scale if a doubling of all inputs
results in a precise doubling of output.
Example: a firm's production process can be replicated easily, such as when a dry cleaner, fast food restaurant, gas
station, grocery store increase volume by increasing the number of outlets and does not face any economies of scale OR
diseconomies of scale. Or the firm does not: a) face increasing costs when it expands or b) decreasing costs when it
expands.
2. Increasing Returns to Scale: If doubling all inputs results in more than a doubling of output, the production function
exhibits increasing returns to scale. It indicates increased efficiency at higher levels of output due to greater
specialization, more advanced production techniques, etc.
Example: You are making a handmade desk in your woodshop. If you build two desks at the same time, you could easily
double production (Q) without doubling your time. Maybe it would take 25% more time but you would increase output
by 100%.
3. Decreasing Returns to Scale: If doubling all inputs yields less than a doubling of output, the production function is said
to exhibit decreasing returns to scale. Decreasing returns could result from inefficiencies of large organizations, the cost
of bureaucracy, inflexible, rigid and overly complex decision-making, and inefficiencies of coordinating large-scale
production.
3. A) explain ‘ Fixed Cost \’ and Variable cost and show the correct position of total cost curve, total fixed cost curve
and total variable cost curve in a curve.
In economics, fixed costs are business expenses that are not dependent on the level of goods or services produced by
the business. They tend to be time-related, such as salaries or rents being paid per month, and are often referred to as
overhead costs. This is in contrast to variable costs, which are volume-related (and are paid per quantity produced).
Variable costs are expenses that change in proportion to the activity of a business. Variable cost is the sum of marginal
costs over all units produced. It can also be considered normal costs. Fixed costs and variable costs make up the two
components of total cost.For example, a firm pays for raw materials. Intervention. These costs When activity is
decreased, less raw material is used, and so the spending for raw materials falls. When activity is increased, more raw
material is used and spending therefore rises. Note that the changes in expenses happen with little or no need for
managerial are variable costs.

Decomposing Total Costs as Fixed Costs
components of total: total cost is equal to fixed costs plus variable costs.
B) Show with the help of a diagram the relationship among ‘total product’, marginal product and average product.
The total product (or total physical product) of a variable factor of production identi
various levels of the variable input. This can be displayed in either a chart that lists the output level corresponding to
various levels of input, or a graph that summarizes the data into a “total product curve”. The d
total product curve. In this example, output increases as more inputs are employed up until point A. The maximum
output possible with this production process is Qm. (If there are other inputs used in the process, they are assumed to
be fixed.)
The average physical product is the total production divided by the number of units of variable input employed. It is the
output of each unit of input. If there are 10 employees working on a production process that manufactures 50 units per
day, then the average product of variable labour input is 5 units per day.
The average product typically varies as more of the input is employed, so this relationship can also be expressed as a
chart or as a graph. A typical average physical product curve is s
the origin to various points on the total product curve and plotting the slopes of these vectors.
The marginal physical product of a variable input is the change in total output due to a one unit chan
input (called the discrete marginal product) or alternatively the rate of change in total output due to an infinitesimally
small change in the variable input (called the continuous marginal product). The discrete
the additional output resulting from the use of an additional unit of capital (assuming all other factors are fixed). The
continuous marginal product of a variable input can be calculated as the derivative of quantity produced with respect to
variable input employed. The marginal physical product curve is shown (MPP). It can be obtained from the slope of the
total product curve.
Because the marginal product drives changes in the average product, we know that when the average physical product
is falling, the marginal physical product must be less than the average. Likewise, when the average physical product is
rising, it must be due to a marginal physical product greater than the average. For this reason, the marginal physical
product curve must intersect the maximum point on the average physical product curve.
Fixed Costs plus Variable. Along with variable costs, fixed costs make up one of the two
total cost is equal to fixed costs plus variable costs.
B) Show with the help of a diagram the relationship among ‘total product’, marginal product and average product.
The total product (or total physical product) of a variable factor of production identifies what outputs are possible using
various levels of the variable input. This can be displayed in either a chart that lists the output level corresponding to
various levels of input, or a graph that summarizes the data into a “total product curve”. The d
total product curve. In this example, output increases as more inputs are employed up until point A. The maximum
output possible with this production process is Qm. (If there are other inputs used in the process, they are assumed to
The average physical product is the total production divided by the number of units of variable input employed. It is the
output of each unit of input. If there are 10 employees working on a production process that manufactures 50 units per
then the average product of variable labour input is 5 units per day.
The average product typically varies as more of the input is employed, so this relationship can also be expressed as a
chart or as a graph. A typical average physical product curve is shown (APP). It can be obtained by drawing a vector from
the origin to various points on the total product curve and plotting the slopes of these vectors.
The marginal physical product of a variable input is the change in total output due to a one unit chan
input (called the discrete marginal product) or alternatively the rate of change in total output due to an infinitesimally
small change in the variable input (called the continuous marginal product). The discrete
the additional output resulting from the use of an additional unit of capital (assuming all other factors are fixed). The
continuous marginal product of a variable input can be calculated as the derivative of quantity produced with respect to
le input employed. The marginal physical product curve is shown (MPP). It can be obtained from the slope of the
changes in the average product, we know that when the average physical product
ng, the marginal physical product must be less than the average. Likewise, when the average physical product is
rising, it must be due to a marginal physical product greater than the average. For this reason, the marginal physical
ect the maximum point on the average physical product curve.
, fixed costs make up one of the two
B) Show with the help of a diagram the relationship among ‘total product’, marginal product and average product.
fies what outputs are possible using
various levels of the variable input. This can be displayed in either a chart that lists the output level corresponding to
various levels of input, or a graph that summarizes the data into a “total product curve”. The diagram shows a typical
total product curve. In this example, output increases as more inputs are employed up until point A. The maximum
output possible with this production process is Qm. (If there are other inputs used in the process, they are assumed to
The average physical product is the total production divided by the number of units of variable input employed. It is the
output of each unit of input. If there are 10 employees working on a production process that manufactures 50 units per
The average product typically varies as more of the input is employed, so this relationship can also be expressed as a
hown (APP). It can be obtained by drawing a vector from
the origin to various points on the total product curve and plotting the slopes of these vectors.
The marginal physical product of a variable input is the change in total output due to a one unit change in the variable
input (called the discrete marginal product) or alternatively the rate of change in total output due to an infinitesimally
small change in the variable input (called the continuous marginal product). The discrete marginal product of capital is
the additional output resulting from the use of an additional unit of capital (assuming all other factors are fixed). The
continuous marginal product of a variable input can be calculated as the derivative of quantity produced with respect to
le input employed. The marginal physical product curve is shown (MPP). It can be obtained from the slope of the
changes in the average product, we know that when the average physical product
ng, the marginal physical product must be less than the average. Likewise, when the average physical product is
rising, it must be due to a marginal physical product greater than the average. For this reason, the marginal physical
ect the maximum point on the average physical product curve.
4. A) State the principal features of perfect competition.
A perfect market is one where there is perfect competition. This is a model market. It implies absence of rivalry.
According to Building, “the competitive market may be defend as a large number of buyers and sellers all engaged in the
purchase and sale of identically similar commodity, who are in close contact with one another and who buy and sell
freely among themselves”.
Features of Perfect Competition
1. Large number:
In perfect competition, there must be large number of buyers and sellers. Each buyer buys a small quantity of the total
amount. Each seller is so large that no single buyer or seller can influence the price and affect the market. According to
Scitovsky buyers and sellers are price takers in the purely competitive market. Each seller (or firm) sells its products at
the price determined by the market. Similarly, each buyer buys the commodity at the price determined by the market.
2. Homogeneous product:
Under perfect competition, the product offered for sale by the entire seller must be identical in every respect. The goods
offered for sale are perfect substitutes of one another. Buyers have no special preference for the product of a particular
seller. No seller can raise the price above the prevailing price or lower the price below the prevailing price.
3. Free entry and exit:
Under perfect competition, there will be no restriction on the entry and exit of both buyers and sellers. If the existing
sellers start making abnormal profits, new sellers should be able to enter the market freely. This will bring down the
abnormal profits to the normal level. Similarly, when losses will occur existing sellers may leave the market. However,
such free entry or free exit is possible only in the long run, but not in the short-run.
4. Perfect knowledge:
Perfect competition implies perfect knowledge on the part of buyers and sellers regarding the market conditions. As
results, no buyer will be prepared to pay a price higher than the prevailing price. Sellers will not charge a price higher or
lower than the prevailing price. In this market, advertisement has no scope.
5. Perfect mobility of factors of production:
The second perfection mobility of factors of production from one use to another use. This feature ensures that all sellers
or firms get equal advantages so far as services of factors of production are concerned. This is essential to enable the
firms and industry to achieve equilibrium.
6. Absence of transport cost:
Under perfect competition transport, cost does not exist. Since commodities have, the same price it logically follows that
there will be no transport cost. In the event of the presence of cost of transport, there will be no single price in the
market. Transport cost occurs when there is no perfect knowledge of the market conditions on the part of buyers and
sellers.
7. No attachment:
There is no attachment between the buyers and sellers under perfect competition. Since products of all sellers are
identical and their prices are the same a buyer is free to buy the commodity from any seller he likes. He has no special
inclination for the product of any seller as in case of monopolistic competition or oligopoly. Theoretically, perfect
competition is irrelevant. In reality, it does not exist. So it is a myth.
8. Perfect information - All consumers and producers are assumed to have perfect knowledge of price, utility, quality
and production methods of products.
9. Non-increasing returns to scale - The lack of increasing returns to scale (or economies of scale) ensures that there will
always be a sufficient number of firms in the industry.
10. Profit maximization - Firms are assumed to sell where marginal costs meet marginal revenue, where the most profit
is generated.
B) How does an imperfect market affect the interest of an average consumer?
5. A) Show with the help of a diagram how price is determined in monopoly.
A firm with monopoly power setting prices will typically set price at the profit maximizing level. The most profitable price
that they can set (what will become the monopoly price) is where the optimum output level (where marginal cost (MC)

equals marginal revenue (MR), although not in the diagram below, because it is drawn incorrectly) meets the demand
curve. Under normal market conditions for a monopolist, this price will be higher than the marginal cost of producing
the product, thereby indicating the price paid by the consumer, which is equal to the marginal benefit for the consumer,
is above the firm's marginal cost. In the chart below the shaded area represents the profits of the monopolist, except
that it is incorrect because the graph does not set MR = MC for the case of monopoly. The lower half represents the
normal profits that would go to a competitive firm (ignoring output losses). The upper half represent the additional
economic profit going to the monopolist.
B) ‘In monopoly there is no supply curve’-illustrate.
In a perfectly competitive market there is a well defined supply function with a one to one relationship between price
and quantity supplied.[23] In a monopolistic market no such supply relationship exists. A monopolist cannot trace a
short term supply curve because for a given price there is not a unique quantity supplied. As Pindyck and Rubenfeld note
a change in demand "can lead to changes in prices with no change in output, changes in output with no change in price
or both".[24] Monopolies produce where marginal revenue equals marginal costs. For a specific demand curve the
supply "curve" would be the price/quantity combination at the point where marginal revenue equals marginal cost. If
the demand curve shifted the marginal revenue curve would shift as well and a new equilibrium and supply "point"
would be established.

6. A) compare the distinguishing features of the different forms of market structure ( perfect competition, monopoly,
monopolistic competition, oligopoly
B ) identify, with brief explanation, the market structure of the following products in BD: i. water supply in Dhaka city.
Rice market iii. Mobile telephone services iv. Banking services
7. A) explain the characteristics of perfectly competitive market and monopolist market and mention at least one
example of each type of business.
Perfectly competitive market
In economic theory, perfect competition (sometimes called pure competition) describes markets such that no
participants are large enough to have the market power to set the price of a homogeneous product. Because the
conditions for perfect competition are strict, there are few if any perfectly competitive markets. Still, buyers and sellers
in some auction-type markets, say for commodities or some financial assets, may approximate the concept.
Generally, a perfectly competitive market exists when every participant is a "price taker", and no participant
influences the price of the product it buys or sells. Specific characteristics may include:
• Infinite buyers and sellers – An infinite number of consumers with the willingness and ability to buy the
product at a certain price, and infinite producers with the willingness and ability to supply the product at a
certain price.
• Zero entry and exit barriers – A lack of entry and exit barriers makes it extremely easy to enter or exit a
perfectly competitive market.
• Perfect factor mobility – In the long run factors of production are perfectly mobile, allowing free long
term adjustments to changing market conditions.

• Perfect information - All consumers and producers are assumed to have perfect knowledge of price,
utility, quality and production methods of products.
• Zero transaction costs - Buyers and sellers do not incur costs in making an exchange of goods in a
perfectly competitive market.
• Profit maximization - Firms are assumed to sell where marginal costs meet marginal revenue, where the
most profit is generated.
• Homogenous products - The qualities and characteristics of a market good or service do not vary
between different suppliers.
• Non-increasing returns to scale - The lack of increasing returns to scale (or economies of scale) ensures
that there will always be a sufficient number of firms in the industry.
• Property rights - Well defined property rights determine what may be sold, as well as what rights are
conferred on the buyer.
In the short run, perfectly-competitive markets are not productively efficient as output will not occur where marginal
cost is equal to average cost (MC=AC). They are allocatively efficient, as output will always occur where marginal cost is
equal to marginal revenue (MC=MR). In the long run, perfectly competitive markets are both allocatively and
productively efficient.
In perfect competition, any profit-maximizing producer faces a market price equal to its marginal cost (P=MC). This
implies that a factor's price equals the factor's marginal revenue product. It allows for derivation of the supply curve on
which the neoclassical approach is based. This is also the reason why "a monopoly does not have a supply curve". The
abandonment of price taking creates considerable difficulties for the demonstration of a general equilibrium except
under other, very specific conditions such as that of monopolistic competition.
Monopolistic competition
Monopolistic competition is a type of imperfect competition such that many producers sell products that
are differentiated from one another as goods but not perfect substitutes (such as from branding, quality, or location). In
monopolistic competition, a firm takes the prices charged by its rivals as given and ignores the impact of its own prices
on the prices of other firms.
Monopolistically competitive markets have the following characteristics:
• There are many producers and many consumers in the market, and no business has total control over
the market price.
• Consumers perceive that there are non-price differences among the competitors' products.
• There are few barriers to entry and exit.
• Producers have a degree of control over price.
• Product differentiation
• Many firms
• Free entry and exit in the long run
• Independent decision making
• Market Power
• Buyers and Sellers do not have perfect information (Imperfect Information)
B) Show with the help of a diagram how equilibrium price and output are determined by a monopolist in the market.
C) How a firm can fix its equilibrium price and quantity in a perfectly competitive market?
4. Macro economics
1. A) what is inflation & why it arises?
In economics, inflation is a rise in the general level of prices of goods and services in an economy over a period of time.
When the general price level rises, each unit of currency buys fewer goods and services. Consequently, inflation reflects

a reduction in the purchasing power per unit of money – a loss of real value in the medium of exchange and unit of
account within the economy. A chief measure of price inflation is the inflation rate, the annualized percentage change in
a general price index (normally the consumer price index) over time.
Basically, two causes of inflation have been identified, namely, demand-pull and cost push.
i. Demand-pull inflation is caused by an increase in the conditions of demand. These could either be an increase in the
ability to buy goods or an increase in the willingness to do so.
ii. Cost-push inflation arises from anything that causes the conditions of supply to decrease. Some of these factors
include a rise in the cost of production, an increase in government taxation and a decrease in quantity of goods
produced.
iii. Built-in inflation is induced by adaptive expectations, and is often linked to the "price/wage spiral". It involves
workers trying to keep their wages up with prices (above the rate of inflation), and firms passing these higher labor costs
on to their customers as higher prices, leading to a 'vicious circle'. Built-in inflation reflects events in the past, and so
might be seen as hangover inflation.
iv. Unemployment
A connection between inflation and unemployment has been drawn since the emergence of large scale unemployment
in the 19th century, and connections continue to be drawn today. However, the unemployment rategenerally only
affects inflation in the short term but not the long term. In the long term, the velocity of money supply measures such as
the MZM ("money zero maturity," representing cash and equivalent demand deposits) velocity is far more predictive of
inflation than low unemployment.
Monetarists believe the most significant factor influencing inflation or deflation is how fast the money supply grows or
shrinks. They consider fiscal policy, or government spending and taxation, as ineffective in controlling
inflation. According to the famous monetarist economist Milton Friedman, "Inflation is always and everywhere a
monetary phenomenon." Some monetarists, however, will qualify this by making an exception for very short-term
circumstances.
B) Can monetary policy alone control inflation?
Measures to Control Inflation
• Monetary measures
Credit control is one of the significant monetary measures strategies. The central bank of the nation follows a number of
ways to control the quantity and quality of credit. For this cause, it raises the bank rates sells securities in the open
market, raises the reserve ratio and follows a number selective credit control measures such as raising margin
requirements and regulating consumer credit.
But one of the monetary measures is to demonetize currency of higher denominations. Such measures are usually
followed when there is more of black money in the nation.
The most tremendous monetary measure is the issue of new currency in place of the old ones. Under this operation, one
new currency note is negotiated for a number of currency notes of the old ones. The value of bank deposits is also set
respectively.
• Fiscal Measures
Fiscal measures such as slashing down unwanted expenditure, rise in taxes, rise in savings, surplus budgeting and public
debt.
Similar to monetary measures fiscal measures alone cannot help in controlling inflation and they should be surrogated
by monetary, non-monetary and non-fiscal measures.
C) How monetary policy can be used to combat inflation?
The balance between the overall demand for goods and services and the economy's capacity to sustainably supply them
determines inflation. In the jargon of economists, the difference between demand and the economy's capacity to supply
is known as the output gap. Monetary policy can't affect the economy's capacity to supply. However, monetary policy
can stimulate or dampen demand. This is done by adjusting short-term interest rates. Let's imagine that inflation is too
high. In this scenario, interest rates will need to be increased to lower the inflation rate.
When the Reserve Bank increases the Official Cash Rate, commercial banks will earn a higher return from overnight cash
deposits, and pay a higher overnight interest rate when borrowing from the Bank. As a result, the short-term interest
rate used between commercial banks will increase. The will put upward pressure on short term interest rates banks
offer to customers, and will also push rates higher through the wider financial system and to longer-term interest rates.
Both the cost of borrowing and the benefit of saving increase for the broader economy. Borrowers tend to reduce their
spending as the cost of credit increases, and savers have an incentive to save more, because their interest returns are
higher. These effects both lead to less spending in the economy, pushing the output gap lower and subsequently
inflationary pressures will ease.
Monetary policy also has a psychological effect. When the Official Cash Rate is increased it is a signal to everyone that
the Reserve Bank is taking measures to reduce the rate of inflation. If people believe the Reserve Bank is committed to
low inflation and that the Bank will be successful, they incorporate a lower future rate of inflation into the contracts they
enter into, such as in wage contracts. In this way, expectations of lower inflation can assist in lowering the actual
inflation rate in the future. In effect, the expectation of lower inflation is self-fulfilling. Conversely, if people think that
inflation will rise, or remain high, that can make it more difficult for monetary policy to reduce inflation.
The Reserve Bank tries to influence the output gap so the amount of pressure on resources causes inflation to remain
within the one to three percent inflation band.
2. A) what factors, according to you, influence a country’s economic growth?
The economic growth of a nation determines how its production and export of goods and services affect national
income and the standard of living. Strong economic growth requires strong domestic infrastructure and foreign
relations. As shown by nations throughout human history, availability of natural resources, technological innovations,
and a productive workforce all contribute to economic growth. In the 18th century, Great Britain's Industrial Revolution
provided a historical example of unprecedented economic growth, and similar factors can be seen globally today.
Natural Resources
• The availability of natural resources allows a nation to produce material goods for its own use or foreign
trade. Food crops qualify as a natural resource. A surplus of food allows citizens to take time away from food
production and produce consumer goods--or act as consumers themselves. Non-food natural resources, such as
mineral deposits, can contribute to economic growth by providing the material for technological innovation, the
next factor in economic growth. During the Industrial Revolution, according to Steven Kreis, Ph.D., history
professor for the American Public University System, England had a large supply of coal to use for energy to
power machinery. Coal required no access to a water source. New crop rotation techniques provided greater
soil efficiency.
Today, an abundance of one of the most important natural resources, oil, is found in the Middle East. The
Middle Eastern country of Qatar, for example, had the second-highest per capita income in 2010, according to
the CIA World Factbook.
Technological Innovations
• A critical aspect of economic growth, technological innovation allows inventors and producers to use
existing technology to produce more food or goods in less time with less effort, thus enabling a higher rate of
production. This, in turn, creates a surplus of goods. Technological innovation can refer to new methods of
producing or preserving food, new types of machinery or more efficient energy sources to power machinery.
According to the Charles Davidson College of Engineering, the invention of James Watt's steam engine
converted the burning of fuel to mechanical work.
•
Population Growth

• If a nation has abundant natural resources and the technology to use them, it can support a larger
population. Population growth means more people will put money into an economy by buying necessities or
commodities. According to the Economic History Site, England's population grew from 7.7 million people to 13.2
million from 1791 to 1831, the height of the Industrial Revolution. However, unchecked population growth can
have a negative effect on a nation's economy when the number of people causes the demand for natural
resources and goods to exceed the supply or ability to produce. Today population outstrips natural resources in
many parts of the world. According to "National Geographic," 4.8 billion people live in underdeveloped
countries. A third of these people have no access to clean water because of overpopulation.
Increased foreign investment
• Foreign investment adds another source of income to a nation's economic growth. Foreign investments can
occur in the form of direct investment, with governments seeking to buy the rights to use technology or labor.
They can also occur by trading. The system of mercantilism, in which raw materials are bought from one nation,
processed into a finished product and resold at a profit, existed between England and the American colonies.
Although modern corporate globalization appears exploitative to some, it has improved several nations'
economies--China in particular. Columnist Robyn Meredith of "Forbes Magazine" states that China's per capita
income increased from $16 in 1978 to over $2,000 in 2007 due to the influx of American-owned companies such
as Starbucks, Walmart and McDonald's.
Social and Financial Capital
• Capital generally helps to increase economic growth, but there are two important and intangible types of
capital not related to resources. The first is human capital, the social aspect of the economy. When the skills,
attitudes and experience of the workforce increase, the economy grows as well. The second, financial capital,
refers to the direct funds that companies can use.
Policy
• Government policy also plays a very important role in economic growth. Governments can encourage or
discourage economic growth through taxes, tariffs and financial regulations. Governments also control what
types of international resources businesses can access, as well the types of technology or workforces companies
can use abroad.
B) is per capita income the only measure of economic development?
Per capita income, also known as income per person, is the mean income of the people in an economic unit
such as a country or city. It is calculated by taking a measure of all sources of income in the aggregate (such
asGDP or Gross national income) and dividing it by the total population. Per capita income as a measure of
prosperity
Per capita income is often used as average income, a measure of the wealth of the population of a nation,
particularly in comparison to other nations. Per capita income is often used to measure a country's standard of
living. It is usually expressed in terms of a commonly used international currency such as the Euro or United
States dollar, and is useful because it is widely known, easily calculated from readily-available GDP and
population estimates, and produces a useful statistic for comparison of wealth between sovereign territories.
This helps the country to know their development status.
Critics claim that per capita income has several weaknesses as an accurate measurement of prosperity:
• Comparisons of per capita income over time need to take into account changes in prices. Without using
measures of income adjusted for inflation, they will tend to overstate the effects of economic growth.
• International comparisons can be distorted by differences in the costs of living between countries that
aren't reflected in exchange rates. Where the objective of the comparison is to look at differences in living
standards between countries, using a measure of per capita income adjusted for differences in purchasing
power parity more accurately reflects the differences in what people are actually able to buy with their money.

• As it is a mean value, it does not reflect income distribution. If the distribution of income within a
country is skewed, a small wealthy class can increase per capita income far above that of the majority of the
population. In this respect Median income is a more useful measure of prosperity than per capita income,
because it is less influenced by the outliers.
• Economic activity that does not result in monetary income, such as services provided within the family,
or for barter, is usually not counted. The importance of these services varies widely among different economies.
Per capital income is a more meaningful measure of living standards than total national income. But it is not the final
test for development. But it is a very important test. In addition, we have to see whether the people under poverty line
have decreased. Whether unemployment has decreased. Whether there is too much variation in incomes. All these put
together will indicate whether there is proper development. Otherwise, while the economy may be growing, many
people may still be poor and suffering. The right growth is one where almost everyone benefits (our politicians call it
'inclusive' growth).
3. A) distinguish between gross national product and net national product/ define- GDP, GNP, NNP
GDP (or Gross Domestic Product) and GNP (Gross National Product) both measure the size and strength of the economy
but their definition, calculation and applications are different from each other.
GDP GNP
Stands for: Gross Domestic Product Gross National Product
Definition: An estimated value of the total worth of a
country’s production and services, on its land,
by its nationals and foreigners, calculated over
the course on one year
An estimated value of the total worth of
production and services, by citizens of a
country, on its land or on foreign land,
calculated over the course on one year
Formula
forCalculation:
GDP = consumption + investment +
(government spending) + (exports − imports)
GNP = GDP + NR (Net income inflow from
assets abroad or Net Income Receipts) - NP
(Net payment outflow to foreign assets)
Uses: Business, Economic Forecasting Business, Economic Forecasting
Application (Context in
which these terms are
used):
To see the strength of a country’s local
economy
To see how the nationals of a country are
doing economically
Layman Usage: Total value of products & Services produced
within the territorial boundary of a country
Total value of Goods and Services produced
by all nationals of a country (whether within
or outside the country)
Country with Highest
Per Capita (US$):
Luxembourg ($87,400) Luxembourg ($45,360)
Country with Lowest
Per Capita (US$):
Liberia ($16) Mozambique ($80)
Country with Highest
(Cumulative):
USA ($13.06 Trillion in 2006) USA (~ $11.5 Trillion in 2005)
GDP Definition
GDP stands for Gross Domestic Product, the total worth estimated in currency values of a nation’s production in a given
year, including service sector, research, and development. That translates to a sum of all industrial production,
work, sales, business and service sector activity in the country. Usually this is calculated over a period of one year, but
there may be analysis of short and long term trends to be used for economic forecast. Gross Domestic Product can also
be calculated on a per capita (or per person) basis to give a relative example of the economic development of nations.
How GDP is calculated
GDP of a country is defined as the total market value of all final goods and services produced within a country in a given
period of time (usually a calendar year). It is also considered the sum of value added at every stage of production
(the intermediate stages) of all final goods and services produced within a country in a given period of time.

The most common approach to measuring and understanding GDP is the expenditure method: GDP = consumption
+ investment + (government spending) + (exports – imports), or, GDP = C + I + G + (X-M)
GNP Definition
GNP stands for Gross National Product. In general terms, GNP means the total of all business production and service
sector industry in a country plus its gain on overseas investment. In some cases GNP will also be calculated by
subtracting the capital gains of foreign nationals or companies earned domestically. Through GNP an accurate portrait
of a nation’s yearly economy can be analyzed and studied for trends since GNP calculates the total income of all the
nationals of a country. This gives a far more realistic picture than the income of foreign nationals in the country as it is
more reliable and permanent in nature. Gross National Product can also be calculated on a per capita basis to
demonstrate the consumer buying power of an individual from a particular country, and an estimate of average wealth,
wages, and ownership distribution in a society.
How GNP is calculated
There are various ways of calculating GNP numbers. The expenditure approach determines aggregate demand, or Gross
National Expenditure, by summing consumption, investment, government expenditure and net exports. The income
approach and the closely related output approach sum wages, rents, [[interest, profits, non income charges, and net
foreign factor income earned. The three methods yield the same result because total expenditures on goods and
services (GNE) is equal to the value of goods and services produced (GNP) which is equal to the total income paid to the
factors that produced the goods and services (GNI)
Expenditure Approach to calculating GNP:GNP = GDP + NR (Net income from assets abroad (Net Income Receipts))
Applications of GDP and GNP numbers
GDP and GNP figures are both calculated on a per capita basis to give a portrait of a country's economic development.
GDP (or Gross Domestic Product) may be compared directly with GNP (or Gross National Product), to see the
relationship between a country's export business and local economy. A region's GDP is one of the ways of measuring the
size of its local economy whereas the GNP measures the overall economic strength of a country. These figures can also
be used to analyze the distribution of wealth throughout a society, or the average purchasing power of an individual in
the country etc.
Increase in exports of a country will lead to increase in both GDP and GNP of the country. Correspondingly, increase in
imports will decrease GDP and GNP. However, sometimes increase in exports might only lead to increase in GDP and not
GNP. The exact relationship will depend on the nationality status of the company doing the export or import, e.g., if
Microsoft Corporation has a 100% owned subsidiary in India, and that office exports US$2 Billion worth of services out of
India, then US$2 Billion will be added to the GDP of India. However, it will not be added to the GNP figure since the
export is done by a US company and not an Indian company.
Criticism
GDP is perhaps the most widely used metric to measure the health of economies. But some economists have argued
that GDP is a flawed metric because it does not measure the economic well being of society. For example, it's possible
that GDP is going up but median income going down and poverty rate increasing. GDP also does not measure
environmental impact of growth, nor sustainability. Other important metrics include health of the population,
infant mortality rates, and malnutrition rates, none of which are captured by GDP
Here's Nobel laureate Joseph Stiglitz offering a criticism of GDP. And at about the 4:45 mark, he talks about the
difference between GDP and GNP:
Stiglitz says that around 1990, GDP supplanted GNP as the primary measure of economic progress. He says that GNP
measures the income of the people within the country whereas GDP measures economic activity in the country. If
economic activity occurs in the country but the income from this activity accrues to foreigners, it will still be counted in
GDP but not in GNP. He cites the example of privatized mining. Often the state gets a royalty of 1-2% but the income
from privatized, foreign-owned mines accrues largely to shareholders. (Also see Stiglitz's article: GDP Fetishism)
Net national product (NNP)
Net national product (NNP) is the total market value of all final goods and services produced by residents in a country or
other polity during a given time period (gross national product or GNP) minus depreciation. Thenet domestic
product (NDP) is the equivalent application of NNP within macroeconomics, and NDP is equal to gross domestic
product (GDP) minus depreciation: NDP = GDP - depreciation.
Depreciation (also known as consumption of fixed capital) measures the amount of GNP that must be spent on
new capital goods to maintain the existing physical capital stock.
NNP is the amount of goods in a given year which can be consumed without reducing future consumption. Setting part
of NNP aside for investment permits capital stock growth (see economic growth and capital formation), and greater
future consumption.
NNP also equals total compensation of employees + net indirect tax paid on current production + operating surplus.
B) What is meant by the problem of double counting in the measurement of national income?
Double counting occurs when the same goods in an economy are counted twice. This can happen because goods go
through several stages of assembly before they find there why to their intended buyer such as counting cotton and
cotton textile both. In this illustration cotton has been counted twice.
C) How can the double counting problem be avoided?
The problem of double counting can be avoided in two ways.
Firstly, the value of only final goods should be counted. In the given illustration cotton is an intermediary good and
hence it should not be counted. That is, goods that have been purchased for final use by a consumer, with not
immediate intent of resale or further processing. Secondly, value added approach should be adopted. In this way, value
added in each stage of production should be ascertained.
D) What are the methods of computing the gross domestic product of a country?
Gross domestic product (GDP) is the market value of all officially recognized final goods and services produced within a
country in a given period of time.
GDP can be determined in three ways, all of which should, in principle, give the same result. They are the product (or
output) approach, the income approach, and the expenditure approach.
The most direct of the three is the product approach, which sums the outputs of every class of enterprise to arrive at the
total. The expenditure approach works on the principle that all of the product must be bought by somebody, therefore
the value of the total product must be equal to people's total expenditures in buying things. The income approach works
on the principle that the incomes of the productive factors ("producers," colloquially) must be equal to the value of their
product, and determines GDP by finding the sum of all producers' incomes.
Production approach
"Market value of all final goods and services calculated during 1 year."
The production approach is also called as Net Product or Value added method. This method consists of three stages:
1. Estimating the Gross Value of domestic Output in various economic activities;
2. Determining the intermediate consumption, i.e., the cost of material, supplies and services used to produce final
goods or services; and finally
3. Deducting intermediate consumption from Gross Value to obtain the Net Value of Domestic Output.
Symbolically,
Net Value Added = Gross Value of output – Value of Intermediate Consumption.
Value of Output = Value of the total sales of goods and services + Value of changes in the inventories.
The sum of Net Value Added in various economic activities is known as GDP at factor cost.
GDP at factor cost plus indirect taxes less subsidies on products is GDP at Producer Price.
For measuring gross output of domestic product, economic activities (i.e. industries) are classified into various sectors.
After classifying economic activities, the gross output of each sector is calculated by any of the following two methods:
1. By multiplying the output of each sector by their respective market price and adding them together and
2. By collecting data on gross sales and inventories from the records of companies and adding them together
Subtracting each sector's intermediate consumption from gross output, we get sectoral
factor cost. We, then add gross value of all sectors to get
at factor cost, we get GDP at Producer Prices
Income approach
"sum total of incomes of individuals living in a country during 1 year ."
Another way of measuring GDP is to measure total income. If GDP is calculated this way it is sometimes called Gross
Domestic Income (GDI), or GDP(I). GDI should provide the same amount as the expenditure method described below.
(By definition, GDI = GDP. In practice, however, measurement errors will make the two figures slightly off when reported
by national statistical agencies.)
This method measures GDP by adding incomes that firms pay households for factors of production they hire
labour, interest for capital, rent for land and profits for entrepreneurship.
The US "National Income and Expenditure Accounts" divide incomes into five categories
1. Wages, salaries, and supplementary labour income
2. Corporate profits
3. Interest and miscellaneous investment income
4. Farmers' income
5. Income from non-farm unincorporated businesses
These five income components sum to net domestic income at factor cost.
Two adjustments must be made to get GDP:
1. Indirect taxes minus subsidies are added to get from factor cost to market prices.
2. Depreciation (or Capital Consumption Allowance
product.
Total income can be subdivided according to various schemes, leading to various formulae for GDP measured by the
income approach. A common one is:
GDP = compensation of employees + gross operating surplus
and imports
GDP = COE + GOS + GMI + TP & M – SP & M
• Compensation of employees (COE) measures the total remuneration to employees for work done. It includes wages
and salaries, as well as employer contributions to
• Gross operating surplus (GOS) is the surplus due to owners of incorporated businesses. Often called
only a subset of total costs are subtracted from
• Gross mixed income (GMI) is the same measure as GOS, but for unincorpora
small businesses.
The sum of COE, GOS and GMI is called total factor income; it is the income of all of the factors of production in society.
It measures the value of GDP at factor (basic) prices. The difference bet
the expenditure calculation) is the total taxes and subsidies that the government has levied or paid on that production.
So adding taxes less subsidies on production and imports converts GDP at
Total factor income is also sometimes expressed as:
Total factor income = Employee compensation + Corporate profits + Proprietor's income + Rental income + Net interest
Yet another formula for GDP by the income method is:
where R : rents
I : interests
By multiplying the output of each sector by their respective market price and adding them together and
By collecting data on gross sales and inventories from the records of companies and adding them together
ach sector's intermediate consumption from gross output, we get sectoral
factor cost. We, then add gross value of all sectors to get GDP at factor cost. Adding indirect tax minus subsidies in GDP
ducer Prices.
"sum total of incomes of individuals living in a country during 1 year ."
Another way of measuring GDP is to measure total income. If GDP is calculated this way it is sometimes called Gross
DI should provide the same amount as the expenditure method described below.
(By definition, GDI = GDP. In practice, however, measurement errors will make the two figures slightly off when reported
P by adding incomes that firms pay households for factors of production they hire
labour, interest for capital, rent for land and profits for entrepreneurship.
The US "National Income and Expenditure Accounts" divide incomes into five categories:
Wages, salaries, and supplementary labour income
Interest and miscellaneous investment income
farm unincorporated businesses
These five income components sum to net domestic income at factor cost.
adjustments must be made to get GDP:
Indirect taxes minus subsidies are added to get from factor cost to market prices.
Capital Consumption Allowance) is added to get from net domestic product to gross domestic
subdivided according to various schemes, leading to various formulae for GDP measured by the
gross operating surplus + gross mixed income + taxes less subsidies on production
(COE) measures the total remuneration to employees for work done. It includes wages
and salaries, as well as employer contributions to social security and other such programs.
(GOS) is the surplus due to owners of incorporated businesses. Often called
only a subset of total costs are subtracted from gross output to calculate GOS.
(GMI) is the same measure as GOS, but for unincorporated businesses. This often includes most
is called total factor income; it is the income of all of the factors of production in society.
It measures the value of GDP at factor (basic) prices. The difference between basic prices and final prices (those used in
the expenditure calculation) is the total taxes and subsidies that the government has levied or paid on that production.
So adding taxes less subsidies on production and imports converts GDP at factor cost to GDP(I).
Total factor income is also sometimes expressed as:
Total factor income = Employee compensation + Corporate profits + Proprietor's income + Rental income + Net interest
Yet another formula for GDP by the income method is:
By multiplying the output of each sector by their respective market price and adding them together and
By collecting data on gross sales and inventories from the records of companies and adding them together
ach sector's intermediate consumption from gross output, we get sectoral Gross Value Added (GVA) at
. Adding indirect tax minus subsidies in GDP
Another way of measuring GDP is to measure total income. If GDP is calculated this way it is sometimes called Gross
DI should provide the same amount as the expenditure method described below.
(By definition, GDI = GDP. In practice, however, measurement errors will make the two figures slightly off when reported
P by adding incomes that firms pay households for factors of production they hire- wages for
:
) is added to get from net domestic product to gross domestic
subdivided according to various schemes, leading to various formulae for GDP measured by the
+ taxes less subsidies on production
(COE) measures the total remuneration to employees for work done. It includes wages
and other such programs.
(GOS) is the surplus due to owners of incorporated businesses. Often called profits, although
ted businesses. This often includes most
is called total factor income; it is the income of all of the factors of production in society.
ween basic prices and final prices (those used in
the expenditure calculation) is the total taxes and subsidies that the government has levied or paid on that production.
to GDP(I).
Total factor income = Employee compensation + Corporate profits + Proprietor's income + Rental income + Net interest

P : profits
SA : statistical adjustments (corporate income taxes, dividends, undistributed corporate profits)
W : wages
Note the mnemonic, "ripsaw".
Expenditure approach
"All expenditure incurred by individuals during 1 year."
In economics, most things produced are produced for sale, and sold. Therefore, measuring the total expenditure of
money used to buy things is a way of measuring production. This is known as the expenditure method of calculating
GDP. Note that if you knit yourself a sweater, it is production but does not get counted as GDP because it is never sold.
Sweater-knitting is a small part of the economy, but if one counts some major activities such as child-rearing (generally
unpaid) as production, GDP ceases to be an accurate indicator of production. Similarly, if there is a long term shift from
non-market provision of services (for example cooking, cleaning, child rearing, do-it yourself repairs) to market provision
of services, then this trend toward increased market provision of services may mask a dramatic decrease in actual
domestic production, resulting in overly optimistic and inflated reported GDP. This is particularly a problem for
economies which have shifted from production economies to service economies.
Components of GDP by expenditure
GDP (Y) is a sum of Consumption (C), Investment (I), Government Spending (G) and Net Exports (X – M).
Y = C + I + G + (X − M)
Here is a description of each GDP component:
• C (consumption) is normally the largest GDP component in the economy, consisting of private (household final
consumption expenditure) in the economy. These personal expenditures fall under one of the following
categories: durable goods, non-durable goods, and services. An example includes food, rent, jewelry, gasoline, and
medical expenses but does not include the purchase of new housing.
• I (investment) includes, for instance, business investment in equipment, but does not include exchanges of existing
assets. Examples include construction of a new mine, purchase of software, or purchase of machinery and equipment
for a factory. Spending by households (not government) on new houses is also included in Investment. In contrast to its
colloquial meaning, 'Investment' in GDP does not mean purchases of financial products. Buying financial products is
classed as 'saving', as opposed to investment. This avoids double-counting: if one buys shares in a company, and the
company uses the money received to buy plant, equipment, etc., the amount will be counted toward GDP when the
company spends the money on those things; to also count it when one gives it to the company would be to count two
times an amount that only corresponds to one group of products. Buying bonds or stocks is a swapping of deeds, a
transfer of claims on future production, not directly an expenditure on products.
• G (government spending) is the sum of government expenditures on final goods and services. It includes salaries
of public servants, purchase of weapons for the military, and any investment expenditure by a government. It does not
include any transfer payments, suchas social security or unemployment benefits.
• X (exports) represents gross exports. GDP captures the amount a country produces, including goods and services
produced for other nations' consumption, therefore exports are added.
• M (imports) represents gross imports. Imports are subtracted since imported goods will be included in the terms G, I,
or C, and must be deducted to avoid counting foreign supply as domestic.
A fully equivalent definition is that GDP (Y) is the sum of final consumption expenditure (FCE), gross capital
formation (GCF), and net exports (X – M).
Y = FCE + GCF+ (X − M)
FCE can then be further broken down by three sectors (households, governments and non-profit institutions serving
households) and GCF by five sectors (non-financial corporations, financial corporations, households, governments
and non-profit institutions serving households). The advantage of this second definition is that expenditure is
systematically broken down, firstly, by type of final use (final consumption or capital formation) and, secondly, by
sectors making the expenditure, whereas the first definition partly follows a mixed delimitation concept by type of final
use and sector.
Note that C, G, and I are expenditures on final goods and services; expenditures on intermediate goods and services do
not count. (Intermediate goods and services are those used by businesses to produce other goods and services within
the accounting year).
According to the U.S. Bureau of Economic Analysis, which is responsible for calculating the national accounts in the
United States, "In general, the source data for the expenditures components are considered more reliable than those for
the income components
E) Describe the problems in measuring the GDP of a country.
First, GDP figures omit production of goods and services that are not sold on markets. This component includes
housework, meals cooked at home, and child care provided by parents, as well as services volunteered for charities and
other groups. For example, when parents care for their own children, the value of their care does not appear in GDP.
However, when parents pay for child care, those services appear in GDP.
Second, GDP includes only a very imperfect estimate of production of goods and services sold on the underground
economy (or black market). This activity includes production of illegal goods and services (such as drugs and
prostitution). It also includes production of legal goods that goes unreported to avoid taxes. Many estimates suggest
that the underground economy in the United States amounts to between 5 and 10 percent of GDP; this figure is even
larger in many other countries.
Third, special measurement problems result when GDP includes certain goods that are not sold on markets. When you
rent a house or apartment, your expenses appear in GDP as payments for housing services. However, if you own the
house or apartment where you live, GDP includes the government’s estimate of the rent that you would pay if you were
renting.
Fourth: Substitution bias: As consumers' tastes change and as new technological improvements are introduced, the
relative prices of goods change. Such changes are independent of inflation so optimally we would like the real GDP
measure to take them into consideration. For example, as more people started using cellular phones, the cost of
supplying this service went down and so has price. In the real GDP the value of these services is measured using old,
higher prices, overstating the increase in the value of production.
New-good bias: it is very difficult to include new goods into the real GDP: In the base year they did not exist and hence
their price was infinite.
Quality-change bias: if you simply take the number of TV sets produced and multiply it by the price of a typical TV set in
the base year, the value of production is going to be underestimated, as this measure does not take into account the
improvements in quality.
GDP is the value of goods and services produce in a country during the time period of year. Measuring of economy on
GDP standards consist some drawbacks.
Double Counting Problem
Including the price of intermediate goods individually and with final product.
Self doing activities
Unrecorded economy in personal activities like the duties performed by oneself, housewives etcare not included in the
GDP.
Illegal Economy
The economy which can be shown incorrectly due to corruption, bribery and drugs business.
Statistical Errors
People measuring the economy not performing their duties with honesty or the standard they areusing are not current
to measure the accurate value of GDP.
Pollution Factor
Pollution factor cannot be included in GDP.
Facilities and living standards
facilities and living standards improvement cannot be indicated by GDP, to show whether the people of the country
are worst off or well off.
Quality Improvement
As the time passes quality improve with speed as compared to the price, GDP can only measurethe price as value
but not quality.
4. A) what is money? Discuss the functions of money.
Money is any object or record that is generally accepted as payment for goods and services and repayment of debts in a
given socio-economic context or country.
"Money is a matter of functions four, a medium, a measure, a standard, a store." That is, money functions as a medium
of exchange, a unit of account, a standard of deferred payment, and a store of value.
Medium of exchange
Main article: Medium of exchange
When money is used to intermediate the exchange of goods and services, it is performing a function as a medium of
exchange. It thereby avoids the inefficiencies of a barter system, such as the 'double coincidence of wants' problem.
Unit of account
Main article: Unit of account
A unit of account is a standard numerical unit of measurement of the market value of goods, services, and other
transactions. Also known as a "measure" or "standard" of relative worth and deferred payment, a unit of account is a
necessary prerequisite for the formulation of commercial agreements that involve debt. To function as a 'unit of
account', whatever is being used as money must be:
• Divisible into smaller units without loss of value; precious metals can be coined from bars, or melted down into bars
again.
• Fungible: that is, one unit or piece must be perceived as equivalent to any other, which is why diamonds, works
of art or real estate are not suitable as money.
• A specific weight, or measure, or size to be verifiably countable. For instance, coins are often milled with a reeded
edge, so that any removal of material from the coin (lowering its commodity value) will be easy to detect.
Store of value
Main article: Store of value
To act as a store of value, a money must be able to be reliably saved, stored, and retrieved – and be predictably usable
as a medium of exchange when it is retrieved. The value of the money must also remain stable over time. Some have
argued that inflation, by reducing the value of money, diminishes the ability of the money to function as a store of
value.[4]
Standard of deferred payment
Main article: Standard of deferred payment
While standard of deferred payment is distinguished by some texts,[5] particularly older ones, other texts subsume this
under other functions.[4][20][21] A "standard of deferred payment" is an accepted way to settle a debt – a unit in which
debts are denominated, and the status of money as legal tender, in those jurisdictions which have this concept, states
that it may function for the discharge of debts. When debts are denominated in money, the real value of debts may
change due to inflation anddeflation, and for sovereign and international debts via debasement and devaluation.
Measure of value
Money acts as a standard measure and common denomination of trade. It is thus a basis for quoting and bargaining of
prices. It is necessary for developing efficient accounting systems. But its most important usage is as a method for
comparing the values of dissimilar objects.
B) Why does government borrow?
Governments borrowing money doesn't create new money. When banks "borrow" money (i.e. take deposits), it does
effectively create money because the depositor expects to be able to get the money back at any time, but the bank
assumes that most won't actually do this and lends out most of the money to other people. If everyone did actually ask
for their money back at once, the illusion of the extra money created by this process would collapse, and the bank would
go bust.
In contrast when governments borrow money, the loan isn't repayable on demand, it has a fixed maturity and the
money is only repaid at the end of that period (plus interest at defined points during the period). So holders of
government debt don't have money they can spend (they can turn it into money they can spend but only by finding
someone else to buy it).
So government debt doesn't create inflation in itself. If they printed money, then they'd be devaluing the money of
everyone who had saved or invested, whereas if they borrow money and use taxes to repay it, the burden falls more
evenly across the economy and doesn't disproportionately penalise certain sets of people.
C) Distinguish between “balance of trade and balance of payment”
Following is the list which is showing difference between balance of trade and balance of payment. It has been made on
some basis.
Basis of
Difference
Balance of Trade (BOT)
Balance of Payment (BOP)
1. Definition
Balance of trade may be defined as
difference between export and
import of goods and services.
Balance of payment is flow of cash between domestic
country and all other foreign countries. It includes not
only import and export of goods and services but also
includes financial capital transfer.
2. Formula
BOT = Net Earning on
Export - Net payment for imports
BOP = BOT + (Net Earning
on foreign investment - payment made to foreign
investors) + Cash
Transfer + Capital Account +or - Balancing Item
or
BOP = Current Account + Capital Account + or -
Balancing item ( Errors and omissions)
3. Favourable
or
Unfavourable
If export is more than
import, at that time, BOT will be
favourable. If import is more than
export, at that time, BOT will be
unfavourable.
Balance of Payment will be
favourable, if you have surplus in current account for
paying your all
past loans in your capital account.
Balance of payment will be unfavourable, if you have
current account deficit and you took more loan from
foreigners. After this, you have to
pay high interest on extra loan and this will make your
BOP
unfavourable.
4. Solution of
Unfavourable
Problem
To Buy goods and services
from domestic country.
5. Factors
Following are main factors
which affect BOT
a) cost of production
b) availability of raw materials
c) Exchange rate
d) Prices of goods manufactured at
home
6. Meaning of
Debit and
Credit
If you see RBI' Overall
balance of payment report, it shows
debit and credit of current account.
Credit means total export of different
goods and services and debit means
total import of goods and services
current account.
5. A) what is unemployment and what are its various types?
Unemployment (or joblessness) occurs when people are without work and actively seeking work.
rate is a measure of the prevalence of unemployment and it is calculated as a percentage by divi
unemployed individuals by all individuals currently in the
experiences a relatively high unemployment rate.
197 million people globally are out of work or 6% of the world's
1) Structural unemployment:
Basically Bangladesh's unemployment is structural in nature. It is associated with the inadequacy of productive capacity to c
enough jobs for all those able and willing to work. In Bangladesh not only the productive capacity much below the needed quan
it is also found increasing at a slow rate. As against this, addition to labour force is being made at a first rate on accoun
rapidly growing population. Thus, while new productive jobs are on the increase, the rate of increasing being low th
number of unemployed persons is rising from year to year.
2) Disguised unemployment:
Disguised unemployment implies that many workers are engaged in productive work. For example, in Indian villages, where most
unemployment exists in this form, people are found to be apparently engaged in agricultural works. But such employment is mostly
a work sharing device i.e., the existing work is shared by the large number of workers. In such a situation, even if many wor
withdrawn, the same work will continue to be done by fewer people. It follows that all the workers are not needed to maintain the
existing level of production. The contribution of such workers to production is nothing. It is found that the very large numb
workers on Indian farms actually hinder agricultural works and thereby reduce production.
3) Cyclical unemployment:
Cyclical unemployment in caused by the trade or business cycles. It results from the profits and loss and fluctuations in the
deficiency of effective demand production is slowed down and there is a general state of depression which causes unemployment
periods of cyclical unemployment is longer and it generally affects all industries to a greater or smaller extent.
4) Seasonal unemployment:
Seasonal unemployment occurs at certain seasons of the year. It is a widespread phenomenon of Indian villages basically associated
with agriculture. Since agricultural work depends upon Nature, therefore, in a certain period of the year there is heavy work
the rest, the work is lean. For example, in the sowing and harvesting period, the agriculturists may to engage themselves day and
night. But the period between the post-harvest and pre sowing is almost workless, rendering many without work. Thus, seasonal
unemployment is largely visible after the end of agricultural works.
5) Underemployment:
Underemployment usually refers to that state in which the self
capacity. For example, a diploma holder in engin
To Buy goods and services
from domestic country.
To stop taking of loan
from foreign countries.
Following are main factors
a) cost of production
b) availability of raw materials
d) Prices of goods manufactured at
Following are main factors
which affect BOP
a) Conditions of foreign lenders.
b) Economic policy of Govt.
c) all the factors of BOT
RBI' Overall
balance of payment report, it shows
debit and credit of current account.
Credit means total export of different
goods and services and debit means
total import of goods and services in
Credit means to receipt and earning both current and
capital account and debit means total outflow of cash
both current and capital account and difference
between debit and credit will be net balance of
payment.
yment and what are its various types?
joblessness) occurs when people are without work and actively seeking work.
is a measure of the prevalence of unemployment and it is calculated as a percentage by divi
unemployed individuals by all individuals currently in the labor force. During periods of
experiences a relatively high unemployment rate.[2] According to International Labour Organization
197 million people globally are out of work or 6% of the world's workforces were without a job in 2
Basically Bangladesh's unemployment is structural in nature. It is associated with the inadequacy of productive capacity to c
enough jobs for all those able and willing to work. In Bangladesh not only the productive capacity much below the needed quan
it is also found increasing at a slow rate. As against this, addition to labour force is being made at a first rate on accoun
rapidly growing population. Thus, while new productive jobs are on the increase, the rate of increasing being low th
number of unemployed persons is rising from year to year.
Disguised unemployment implies that many workers are engaged in productive work. For example, in Indian villages, where most
rm, people are found to be apparently engaged in agricultural works. But such employment is mostly
a work sharing device i.e., the existing work is shared by the large number of workers. In such a situation, even if many wor
k will continue to be done by fewer people. It follows that all the workers are not needed to maintain the
existing level of production. The contribution of such workers to production is nothing. It is found that the very large numb
farms actually hinder agricultural works and thereby reduce production.
Cyclical unemployment in caused by the trade or business cycles. It results from the profits and loss and fluctuations in the
d production is slowed down and there is a general state of depression which causes unemployment
periods of cyclical unemployment is longer and it generally affects all industries to a greater or smaller extent.
yment occurs at certain seasons of the year. It is a widespread phenomenon of Indian villages basically associated
with agriculture. Since agricultural work depends upon Nature, therefore, in a certain period of the year there is heavy work
est, the work is lean. For example, in the sowing and harvesting period, the agriculturists may to engage themselves day and
harvest and pre sowing is almost workless, rendering many without work. Thus, seasonal
loyment is largely visible after the end of agricultural works.
Underemployment usually refers to that state in which the self-employed working people are not working according to their
capacity. For example, a diploma holder in engineering, if for wants of an appropriate job, start any business may be said to be
Following are main factors
a) Conditions of foreign lenders.
b) Economic policy of Govt.
s of BOT
Credit means to receipt and earning both current and
capital account and debit means total outflow of cash
both current and capital account and difference
between debit and credit will be net balance of
joblessness) occurs when people are without work and actively seeking work.[1] The unemployment
is a measure of the prevalence of unemployment and it is calculated as a percentage by dividing the number of
. During periods of recession, an economy usually
International Labour Organization report, more than
without a job in 2012
Basically Bangladesh's unemployment is structural in nature. It is associated with the inadequacy of productive capacity to create
enough jobs for all those able and willing to work. In Bangladesh not only the productive capacity much below the needed quantity,
it is also found increasing at a slow rate. As against this, addition to labour force is being made at a first rate on account of the
rapidly growing population. Thus, while new productive jobs are on the increase, the rate of increasing being low the absolute
Disguised unemployment implies that many workers are engaged in productive work. For example, in Indian villages, where most of
rm, people are found to be apparently engaged in agricultural works. But such employment is mostly
a work sharing device i.e., the existing work is shared by the large number of workers. In such a situation, even if many workers are
k will continue to be done by fewer people. It follows that all the workers are not needed to maintain the
existing level of production. The contribution of such workers to production is nothing. It is found that the very large numbers of
Cyclical unemployment in caused by the trade or business cycles. It results from the profits and loss and fluctuations in the
d production is slowed down and there is a general state of depression which causes unemployment
periods of cyclical unemployment is longer and it generally affects all industries to a greater or smaller extent.
yment occurs at certain seasons of the year. It is a widespread phenomenon of Indian villages basically associated
with agriculture. Since agricultural work depends upon Nature, therefore, in a certain period of the year there is heavy work, while in
est, the work is lean. For example, in the sowing and harvesting period, the agriculturists may to engage themselves day and
harvest and pre sowing is almost workless, rendering many without work. Thus, seasonal
employed working people are not working according to their
eering, if for wants of an appropriate job, start any business may be said to be
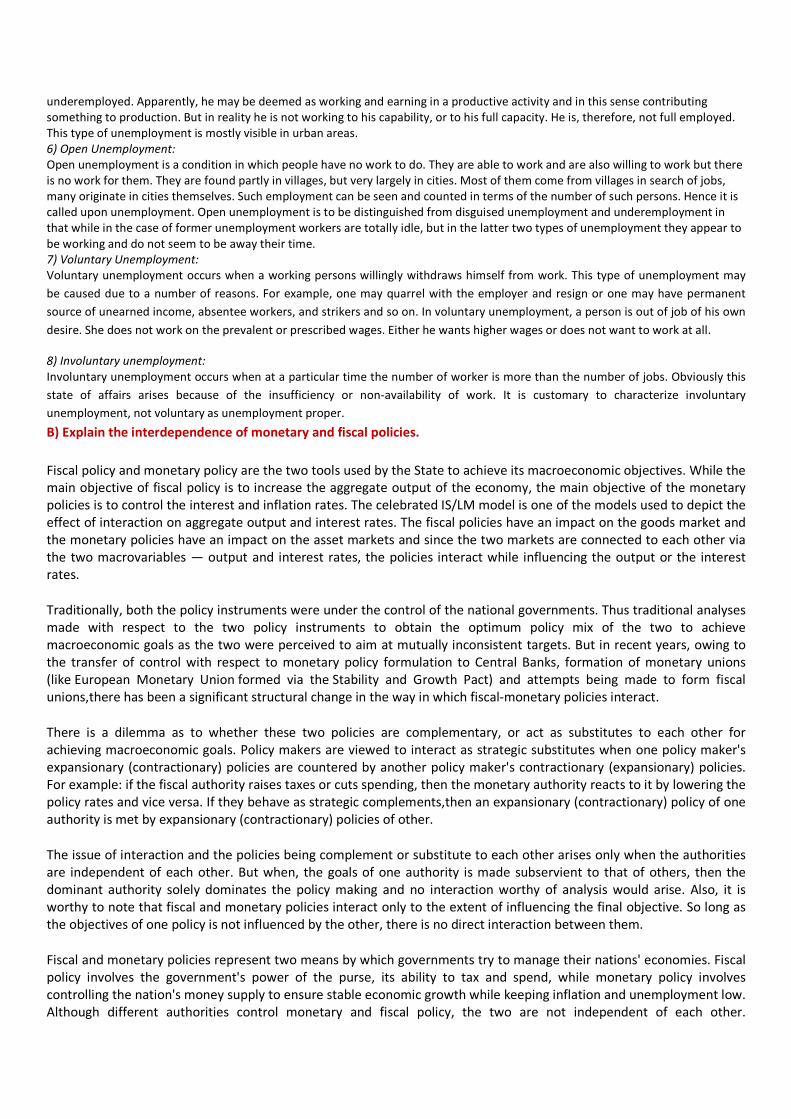
underemployed. Apparently, he may be deemed as working and earning in a productive activity and in this sense contributing
something to production. But in reality he is not working to his capability, or to his full capacity. He is, therefore, not full employed.
This type of unemployment is mostly visible in urban areas.
6) Open Unemployment:
Open unemployment is a condition in which people have no work to do. They are able to work and are also willing to work but there
is no work for them. They are found partly in villages, but very largely in cities. Most of them come from villages in search of jobs,
many originate in cities themselves. Such employment can be seen and counted in terms of the number of such persons. Hence it is
called upon unemployment. Open unemployment is to be distinguished from disguised unemployment and underemployment in
that while in the case of former unemployment workers are totally idle, but in the latter two types of unemployment they appear to
be working and do not seem to be away their time.
7) Voluntary Unemployment:
Voluntary unemployment occurs when a working persons willingly withdraws himself from work. This type of unemployment may
be caused due to a number of reasons. For example, one may quarrel with the employer and resign or one may have permanent
source of unearned income, absentee workers, and strikers and so on. In voluntary unemployment, a person is out of job of his own
desire. She does not work on the prevalent or prescribed wages. Either he wants higher wages or does not want to work at all.
8) Involuntary unemployment:
Involuntary unemployment occurs when at a particular time the number of worker is more than the number of jobs. Obviously this
state of affairs arises because of the insufficiency or non-availability of work. It is customary to characterize involuntary
unemployment, not voluntary as unemployment proper.
B) Explain the interdependence of monetary and fiscal policies.
Fiscal policy and monetary policy are the two tools used by the State to achieve its macroeconomic objectives. While the
main objective of fiscal policy is to increase the aggregate output of the economy, the main objective of the monetary
policies is to control the interest and inflation rates. The celebrated IS/LM model is one of the models used to depict the
effect of interaction on aggregate output and interest rates. The fiscal policies have an impact on the goods market and
the monetary policies have an impact on the asset markets and since the two markets are connected to each other via
the two macrovariables — output and interest rates, the policies interact while influencing the output or the interest
rates.
Traditionally, both the policy instruments were under the control of the national governments. Thus traditional analyses
made with respect to the two policy instruments to obtain the optimum policy mix of the two to achieve
macroeconomic goals as the two were perceived to aim at mutually inconsistent targets. But in recent years, owing to
the transfer of control with respect to monetary policy formulation to Central Banks, formation of monetary unions
(like European Monetary Union formed via the Stability and Growth Pact) and attempts being made to form fiscal
unions,there has been a significant structural change in the way in which fiscal-monetary policies interact.
There is a dilemma as to whether these two policies are complementary, or act as substitutes to each other for
achieving macroeconomic goals. Policy makers are viewed to interact as strategic substitutes when one policy maker's
expansionary (contractionary) policies are countered by another policy maker's contractionary (expansionary) policies.
For example: if the fiscal authority raises taxes or cuts spending, then the monetary authority reacts to it by lowering the
policy rates and vice versa. If they behave as strategic complements,then an expansionary (contractionary) policy of one
authority is met by expansionary (contractionary) policies of other.
The issue of interaction and the policies being complement or substitute to each other arises only when the authorities
are independent of each other. But when, the goals of one authority is made subservient to that of others, then the
dominant authority solely dominates the policy making and no interaction worthy of analysis would arise. Also, it is
worthy to note that fiscal and monetary policies interact only to the extent of influencing the final objective. So long as
the objectives of one policy is not influenced by the other, there is no direct interaction between them.
Fiscal and monetary policies represent two means by which governments try to manage their nations' economies. Fiscal
policy involves the government's power of the purse, its ability to tax and spend, while monetary policy involves
controlling the nation's money supply to ensure stable economic growth while keeping inflation and unemployment low.
Although different authorities control monetary and fiscal policy, the two are not independent of each other.
Identification
• The legislative and executive branches of government control fiscal policy in most nations. In the United
States, for example, the U.S. Congress has the most control over fiscal policy, as the branch of government that
appropriates money to fund government operations. Central banks, meanwhile, oversee monetary policy.
Examples include the Bank of England the U.S. Federal Reserve.
Theories/Speculation
• Governments use fiscal and monetary policies to respond to changes in the business cycle, defined as
the fluctuations in economic activity under a market economy. The business cycle has three phases: the
expansion, in which production and employment levels rise until they reach a peak; a recession, in which
production and employment falls until reaching the low point, or trough; and the recovery, in which economic
activity begins to rise again, ushering in a new expansion. English economist John Maynard Keynes, writing in
the 1930s, blamed wild swings in aggregate demand, or the total demand for goods and services, for large
fluctuations in business cycles. When consumer and business spending falls, aggregate demand declines, leading
to a recession.
Prevention/Solution
• Keynes argued that government should boost spending to increase aggregate demand, compensating
for lower consumer and business spending, to stimulate the economy. This is known as expansionary fiscal
policy. Central banks, meanwhile, can respond to a recession with lower interest rates and an expanded money
supply. This represents expansionary monetary policy. When the economy overheats, sparking inflation, central
banks respond with contractionary monetary policy that tightens credit through higher interest rates and a
reduced money supply.
Effects
• Expansionary monetary policy may result in large government deficits, fueling inflation if the
government prints more money to finance the budget gap. This can reduce the value of the currency, triggering
a need for the central bank to raise interest rates, dampening economic growth. The International Monetary
Fund warns that growing government budget deficits can lead to skyrocketing interest rates, further burdening
government finances by raising the costs of debt financing. This can result in severe national economic crises.
The IMF cited Mexico in the mid-1990s, Russia and Brazil in the late 1990s, and Argentina in 2001 as examples
What role can a direct foreign investment play in the economic development of a country?
Foreign direct investment (FDI) is a direct investment into production or business in a country by a company in another
country, either by buying a company in the target country or by expanding operations of an existing business in that
country.
There is a strong relationship between foreign investment and economic growth. Larger inflows of foreign investments
are needed for the country to achieve a sustainable high trajectory of economic growth. There are several irrefutable
reasons for this. For the economy to grow by 7 to 8 per cent a year there is a need to invest around 35 to 40 per cent of
GDP. National savings fall far short of this by nearly 10 per cent. Foreign borrowing and foreign investments have to
meet this investment-savings gap. This is generally recognized and successive governments have attempted to provide
various incentives to foreign investors. However the Sri Lankan record of foreign investment has been far below
expected levels and low in comparison with many other Asian countries.

Foreign investment comes in several forms. Portfolio investment, foreign loans and foreign direct investment are the
three important types. Of these foreign direct investments in industry and services are the most useful. Foreign loans
are generally used for investment in infrastructure. This is important as a serious bottleneck for domestic as well as
foreign investment is the poor state of infrastructure. However the development of infrastructure alone would not
suffice.
The significance of private FDI is that such investments are risk free to the country and bring with it the advantages of
advanced technology, management practices and assured markets. In due course there is a technology transfer as the
local workforce gains knowledge of the manufacturing processes and management practices. The value added in these
industries is a contribution to GDP and foreign exchange earnings. Therefore FDI contributes to foreign exchange
earnings, employment creation and increases in incomes, especially of skilled and semi-skilled workers in these
industries.
7. What is meant by deficit budget?
Definition of 'Budget Deficit'
A financial situation that occurs when an entity has more money going out than coming in. The term "budget deficit" is
most commonly used to refer to government spending rather than business or individual spending. When it refers to
federal government spending, a budget deficit is also known as the "national debt." The opposite of a budget deficit is a
budget surplus, and when inflows are equal to outflows, the budget is said to be balanced.
Government budget deficits can be cured by cutting spending, raising taxes or a combination of the two. Deficits must
be financed by borrowing money. Interest must be paid on borrowed funds, which worsens the deficit.
8. What are the instruments of monetary policy?
The instruments of monetary policy used by the Central Bank depend on the level of development of the economy,
especially its financial sector. The commonly used instruments are discussed below.
Reserve Requirement: The Central Bank may require Deposit Money Banks to hold a fraction (or a combination) of their
deposit liabilities (reserves) as vault cash and or deposits with it. Fractional reserve limits the amount of loans banks can
make to the domestic economy and thus limit the supply of money. The assumption is that Deposit Money Banks
generally maintain a stable relationship between their reserve holdings and the amount of credit they extend to the
public.
Open Market Operations: The Central Bank buys or sells ((on behalf of the Fiscal Authorities (the Treasury)) securities to
the banking and non-banking public (that is in the open market). One such security is Treasury Bills. When the Central
Bank sells securities, it reduces the supply of reserves and when it buys (back) securities-by redeeming them-it increases
the supply of reserves to the Deposit Money Banks, thus affecting the supply of money.
Lending by the Central Bank: The Central Bank sometimes provide credit to Deposit Money Banks, thus affecting the
level of reserves and hence the monetary base.
Interest Rate: The Central Bank lends to financially sound Deposit Money Banks at a most favourable rate of interest,
called the minimum rediscount rate (MRR). The MRR sets the floor for the interest rate regime in the money market (the
nominal anchor rate) and thereby affects the supply of credit, the supply of savings (which affects the supply of reserves
and monetary aggregate) and the supply of investment (which affects full employment and GDP).
Direct Credit Control: The Central Bank can direct Deposit Money Banks on the maximum percentage or amount of loans
(credit ceilings) to different economic sectors or activities, interest rate caps, liquid asset ratio and issue credit guarantee
to preferred loans. In this way the available savings is allocated and investment directed in particular directions.
Moral Suasion: The Central Bank issues licenses or operating permit to Deposit Money Banks and also regulates the
operation of the banking system. It can, from this advantage, persuade banks to follow certain paths such as credit
restraint or expansion, increased savings mobilization and promotion of exports through financial support, which
otherwise they may not do, on the basis of their risk/return assessment.

Prudential Guidelines: The Central Bank may in writing require the Deposit Money Banks to exercise particular care in
their operations in order that specified outcomes are realized. Key elements of prudential guidelines remove some
discretion from bank management and replace it with rules in decision making.
Exchange Rate: The balance of payments can be in deficit or in surplus and each of these affect the monetary base, and
hence the money supply in one direction or the other. By selling or buying foreign exchange, the Central Bank ensures
that the exchange rate is at levels that do not affect domestic money supply in undesired direction, through the balance
of payments and the real exchange rate. The real exchange rate when misaligned affects the current account balance
because of its impact on external competitiveness. Moral suasion and prudential guidelines are direct supervision or
qualitative instruments. The others are quantitative instruments because they have numerical benchmarks.
5. Bangladesh Economy
1. A) what should be the objectives of monetary policy in a developing country like BD?3.26
The primary objective of the Monetary Policy of Bangladesh is to outline the formulation and implementation of
monetary policy of the Bangladesh Bank (BB),and to convey its assessment of the recent and the expected monetary and
inflation developments to the stakeholders and the public at large. The Bangladesh Bank Order of 1972 outlines the
main objectives of monetary policy in Bangladesh, which comprises—
• To achieve the price stability
• To regulate currency and reserves
• To promote and maintain a high level of production, employment and realincome, and economic growth, since
independence BB operated under avariety of pegged exchange rate systems amid capital controls
• To manage the monetary and credit system
• To maintain the par value of domestic currency
• To promote growth and development of the country's productive resources in the best national interest
• Although the long term focus of monetary policy in Bangladesh is on growth with stability, the short-term
objectives are determined after a careful and realistic appraisal of the current economic situation of the country.
B) Indicate the main features of BB’s monetary policy statement for July-December, 2012.
2. A) Is foreign aid necessary for a developing country like BD? Present arguments in support of your answer.4.81
Foreign aid refers to transfer of real resources from governments or public institutions ofthe richer countries to
governments of less developed countries (LDCs) in the third world. Given the importance of foreign aid to the
economies of developing countries, it is important to understand its contribution to economic growth of developing
countries.
B) What measures should be taken by Bd to attract more FDR in BD/4.91
3. State and explain the components of money supply in Bangladesh.
1. Currency Outside banks
2. Deposits of Financial Institutions with Bangladesh Bank (except DMBs)
3. Demand Deposits with DMBs*Deposit money banks
4. Time Deposits with DMBs*
5. Money Supply (M1) (1+2+3)
6. Money Supply(M2) (4+5)
M1 consists of:
• Currency in circulation (C) which includes the notes and coins that we use
plus,
• Demand Deposits (DD) in the banking system. Deposits are also money,
because they can be converted into currency and are used to settle debts e.g,
current account, savings account, traveler's check etc.
So, we can write the equation as, M1= C+DD

Quasi Money (QM) includes time and savings deposit (TD) in the banking
system
and any foreign currency deposit (FC) of residents;
QM = TD+FC
Broad Money (M2) includes all liabilities of the banking system. It is defined
as:
Broad Money = Narrow money + Quasi money
So, M2 = M1+QM…………………….(3)
M2 includes everything in M1
Adds:
–Savings deposits (SD) e.g, Post Office savings deposit.
–Small denomination time deposits (TD) e.g, different fixed deposits,
–Foreign currency deposits ( FC)
So, this equation can also be written as, M2=M1+SD+TD+FC
4. A)Prepare an imaginary statement of balance of payment of BD according to BB and explain the components of
it.4.73
B) Describe the measures to be taken for wipe out the imbalance in balance of payment in BD.4.75
5. What are the reasons of recent high inflation in BD and explain remedies4.51,4.52
6. Discuss the domestic sources of government borrowing in BD and their likely effect on the economy.3.42
7. Account for the growing imbalance in BD’s balance of payments in recent months and suggest remedies.4.74, 4.75
8. Stages remedies for unemployment in BD?4.57
9. How deficit budget can be financed? Answer it in accordance with the financing the deficit budget of BD.
Government budget deficit have been common in Bangladesh like other developing countries. When a budget deficit
prevails in a given year, it means that government authorities cannot collect enough revenue from taxes and other
sources to cover their annual expenditure. To over the deficit, the government must borrow funds, so that it can meet
its expenses in the current fiscal year, thereby fulfilling its obligations. When the government borrows funds, it adds to
its debt.
Increase taxes or reduce government spending
If a reduction in a structural deficit is desired, either revenue must increase, spending must decrease, or both. Taxes
may be increased for everyone/every entity across the board or lawmakers may decide to assign that tax burden to
specific groups of people (higher-income individuals, businesses, etc.) Lawmakers may also decide to cut government
spending.
Like with taxes, they could decide to cut the budgets every government agency/entity by the same percentage or they
may decide to give a greater budget cut to specific agencies. Many, if not all, of these decisions made by lawmakers are
based on political ideology, popularity with their electorate, or popularity with their donors.
6. Write short notes on the following:
1. cross elasticity of demand
2. Monopolistic competition
3. Gresham’s law
4. terms of trade
5. Basel-II accord
6. Inferior goods
7. Cash reserve requirement
8. Disguised unemployment
9. Floating exchange rate
10. Consumer’s surplus
11. Quasi rent
Quasi-rent is the income of a seller of a good or service over and above its opportunity cost when the good is
temporarily in fixed supply. The concept was applied by Alfred Marshall to the determination of the price of capital in
the short run when supply of capital is fixed. The owners if capital receive a payment which differs from the opportunity
cost of leasing that service by the amount of quasi-rent/ in the long run when the supply of such a factor can be
augmented or depleted, the equilibrium price will reflect the cost of alternative uses. Quasi-rent arises because prices in
the short run are not in equilibrium. Marshall used this concept as an element in his explanation of rate of profit.
According to Marshall, Quasi Rent will emerge if the price of the product exceeds the prime cost in the shortperiod. The
Quasi Rent is measured by the extent of price over the prime cost in the short period Thus Quasi-Rent = Price - average
prime cost (Average variable cost).
The modern economists express Quasi-Rent as a short-run surplus over average variable cost. It is the difference
between total revenue and total variable cost in the short-period.
12. Public goods
1. Public Goods. A public good is a product or service that is (1) very costly and (2) you cannot exclude persons who do
not pay for it from benefitting. National defense is a simple example. If I hire some tribesmen to defend my property
against roving bands of barbarians it would be difficult to exclude my neighbors from the benefits even if they don't
contribute. Because the expense may far exceed the benefit I alone might receive I would not hire the defenders.
Community action arises when a group recognizes each individual's benefit may exceed their share of the total expense.
But with very large groups it becomes difficult to keep some individuals from "freeriding" on the efforts of others.
Governments are formed to compel participation by taxing members of the community to finance public goods such as
defense, police, courts, roads, and so on. The incentives (benefits and costs) of an individual acting alone as in a free
market can be very different from the incentives of an individual acting in a group. Consequently, a free market can fail
to allocate the resources that a group would desire.
I. Depreciation of currency
II. Giffen goods
III. Determinants of changes in price
In a competitive free market, price is determined by demand and supply.
IV. Index number


![Mankind is no_island[1]](https://img.pdfslide.net/doc/110x75/558bee32d8b42a195c8b45b2/mankind-is-noisland1.jpg)