Embed Size (px)
Citation preview

COMPARING 3D & 2D FACIAL PHOTOGRAPHY TO CLINICAL FACIAL FORM ANALYSIS FOR ORTHODONTIC DIAGNOSIS
by
Payam Zamani
Bachelor of Science, University of California, Irvine, 2007
Doctor of Dental Surgery, University of Southern California, 2012
Submitted to the Graduate Faculty of
School of Dental Medicine in partial fulfillment
of the requirements for the degree of
Master of Dental Science
University of Pittsburgh
2015

ii
UNIVERSITY OF PITTSBURGH
SCHOOL OF DENTAL MEDICINE
This thesis was presented
by
Payam Zamani
It was defended on
May 1, 2015
and approved by
Varun Kalra, D.D.S, M.S, M.D.S, B.D.S, D.Ortho.R.C.S., Clinical Associate Professor,
Department of Orthodontics and Dentofacial Orthopedics
John Burnheimer, D.M.D, M.S, Assistant Professor, Department of Orthodontics and
Dentofacial Orthopedics
Karen Cuenco, PhD , Adjunct Assistant Professor, Department of Human Genetics
Thesis Advisor: Varun Kalra, D.D.S, M.S, M.D.S, B.D.S, D.Ortho.R.C.S., Clinical Associate
Professor, Department of Orthodontics and Dentofacial Orthopedics

iii
Copyright © by Payam Zamani
2015

iv
The primary goal of orthodontic treatment is a functional dental occlusion as well as an aesthetic
smile in harmony with the lower 1/3 facial soft tissue. A 3-dimensional analysis of the patient’s
dentofacial relations is crucial for proper treatment planning and it is ultimately the soft tissue
that dictates the direction of the orthodontic treatment plan (Sarver 2001). The purpose of this
pilot study is to study the difference of three different medias (3D photography, 2D photography,
clinical patient evaluation) for facial form analysis. Specifically, to determine which
photographic method most closely mimics clinical analysis of facial form for the purpose of
orthodontic facial form diagnosis. Two orthodontists analyzed twelve facial measurements on 54
patients (21 male) via 3D photographs, 2D photographs and clinical evaluations. In addition,
twelve of these patients were randomly chosen for two extra evaluation sessions for intra-rater
reliability testing. The twelve categories are the most commonly used measurements by
orthodontists to evaluate lower 1/3 facial form for diagnosis and treatment planning purposes.
Krippendorff’s Alpha reliability testing was used with values >0.6 deemed substantially reliable.
Results showed poor intra-rater reliability for both evaluators across all three media (only 22 out
of 72 total categories substantially reliable) demonstrating the examiners were not reliably
consistent with their evaluations. Furthermore, results showed poor reliability testing between
the three different medias making comparisons of 3D vs. 2D vs. clinical evaluation difficult.
Lastly, results showed poor inter-rater reliability for the two evaluators across all three media
(zero substantially reliable categories) demonstrating that the two examiners did not agree on any
of the facial evaluations. In conclusion, the two orthodontist did not reliably diagnose most of the
12 facial categories using the three given media of clinical, 2D photography and 3D photography
and they also did not agree with each other’s diagnosis; therefore, it is difficult to determine if
2D or 3D photography provides more diagnosis similarities to clinical evaluation of facial form
diagnosis.
COMPARING 3D & 2D FACIAL PHOTOGRAPHY TO CLINICAL FACIAL FORM ANALYSIS FOR ORTHODONTIC DIAGNOSIS
Payam Zamani, D.D.S, M.D.S
University of Pittsburgh, 2015

v
LIST OF TABLES .................................................................................................................... VII
LIST OF FIGURES ................................................................................................................. VIII
PREFACE ..................................................................................................................................... X
1.0 INTRODUCTION ............................................................................................................... 1
1.1 FACIAL ATTRACTIVENESS .................................................................................. 1
1.2 ORTHODONTICS AND FACIAL FORM CHANGES .......................................... 2
1.3 FACIAL FORM DIAGNOSIS ................................................................................... 3
1.4 AMALGAMATION OF THE “GOLD STANDARD” OF FACIAL FORM
ANALYSIS ............................................................................................................................ 5
1.4.1 Frontal View (Figures 1-5): ............................................................................. 5
1.4.2 Profile view (Figures 6-9): ............................................................................. 13
1.5 3D STEREOPHOTOGRAMMETRY IMAGING ................................................. 18
1.6 AIM OF THIS STUDY ............................................................................................. 19
1.7 HYPOTHESIS ........................................................................................................... 20
2.0 METHODS ......................................................................................................................... 21
2.1 CANDIDATE RECRUITMENT ............................................................................. 21
2.2 CANDIDATE CONSENT ......................................................................................... 22
2.3 INCLUSION AND EXCLUSION CRITERIA ....................................................... 23
2.4 PHOTOGRAPHIC RECORDINGS ........................................................................ 23
2.4.1 3dMDface Digital Stereophotogrammetry .................................................. 24
2.4.2 2-D Digital Photography ................................................................................ 24
2.5 EVALUATORS ......................................................................................................... 25

vi
2.6 EVALUATIONS ........................................................................................................ 25
2.6.1 3-D Evaluation ................................................................................................ 27
2.6.2 2-D Evaluation ................................................................................................ 27
2.6.3 Clinical Evaluation ......................................................................................... 27
2.7 STATISTICAL ANALYSIS AND STUDY DESIGN RANDOMIZATION ........ 28
2.8 PRACTICE TRIAL ................................................................................................... 29
3.0 RESULTS ........................................................................................................................... 30
3.1.1 Intra-rater Reliability .................................................................................... 30
3.1.2 Reliability Between Media ............................................................................. 33
3.1.3 Inter-rater Reliablity ..................................................................................... 34
4.0 DISCUSSION ..................................................................................................................... 35
5.0 CONCLUSION .................................................................................................................. 38
BIBLIOGRAPHY ....................................................................................................................... 40

vii
LIST OF TABLES
Table 1: List of reliable categories ................................................................................................ 31
Table 2 Intra-rater reliability between two sessions of each media .............................................. 32
Table 3: Reliability between medias by each evaluator ................................................................ 33
Table 4 Inter-rater reliability of each media between the two evaluators ..................................... 34

viii
LIST OF FIGURES
Figure 1 Height to width relationship of the face. .......................................................................... 8
Figure 2 Transverse facial proportions and facial form .................................................................. 9
Figure 3 Vertical relations of the face ........................................................................................... 10
Figure 4: Cheekbone-nasal base-lip curve contour line from the frontal view ............................. 11
Figure 5 Facial proportions ........................................................................................................... 12
Figure 6 Nasolabial and labiomental angle ................................................................................... 14
Figure 7 Lip-chin-throat angle ...................................................................................................... 15
Figure 8 Cheekbone-nasal base-lip curve line in the profile view ................................................ 16
Figure 9 Esthetic evaluation of the lips and chin .......................................................................... 17
Figure 10 Sample evaluator questionnaire showing the 12 categories of facial form...................27

ix
x
PREFACE
Dedicated to my loving parents, Dr. Esmail Zamani, M.D. and Pari Dalili. Without their sacrifice
and constant love and support, none of this would have ever been possible. Merci!

1
1.0 INTRODUCTION
1.1 FACIAL ATTRACTIVENESS
It has been shown that attractive men and women are perceived as being more intelligent and
personable, having better job success and, in general, more socially fulfilled when compared to
their less attractive counterparts (Dion 1972, Langlois 2000). Studies have shown that
attractiveness plays a role at the voting polls in political races and in the classroom with teacher
and student interactions (Clifford 1973, Efran 1974). Attractiveness impacts more than how one
is perceived by others it has also been shown to influence the individual’s personality
development, which can dictate their social, emotional and intellectual traits (Van der Geld
2007). The importance of human attractiveness to social interaction has proven to be at least
partially innate. For example, the medial orbito cortex, the cranial region associated with
stimulus and reward, is activated by attractive faces. Interestingly, a smile also activates this
cranial region, signifying a physiological connection between attractiveness, smiling and our
perception of others (O’Doherty 2003). We respond to beautiful faces as early as several weeks
after birth, as infants have been shown to prefer attractive faces versus unattractive faces
(O’Doherty 2003).
The human face has been shown to be the most important aspect of physical
attractiveness (Riggio 1991). People normally judge initial personality based on facial
appearance (Jornung and Fardal 2007). On the face, the eyes and teeth have been shown to be
the most important aspect of attractiveness as well as the centers of attention during social
interaction (Thompson 2004, Jornug 2007). The smile and dental aesthetics have been shown to
be important contributors to facial attractiveness. Individuals who smile more often have even
been shown to be perceived as more trustworthy (Krishnan 2008). For these reasons, it is

2
important for orthodontists to consider the hard and soft tissue aspects of a smile when treating
patients.
1.2 ORTHODONTICS AND FACIAL FORM CHANGES
The primary goal of orthodontic treatment is a functional dental occlusion as well as an
aesthetic smile in harmony with the lower 1/3 facial soft tissue. For complete patient
satisfaction, the aesthetic balance between tooth alignment, gingival contour, and their relation
to the nose, lips and chin must be achieved (Janzen 1977). Most patients can be treated with
orthodontics alone. For patients who have severe dental and/or skeletal discrepancies, the
orthodontist and surgeon must plan an interdisciplinary treatment that addresses both functional
dental occlusion as well as hard and soft tissue aesthetics. These patients often have severe
facial soft tissue form disharmony that could be perceived as aesthetically unpleasing. For
example, patients with skeletal discrepancies, vertical excess, protrusion, retrusion and/or cant
of the maxilla and/or mandible, require orthognathic surgery for proper dental and facial soft
tissue alignment and harmony. Clinically significant changes due to orthodontic and/or
orthognathic treatment can specifically be seen in the upper and lower lips, angulation of the tip
of the nose and alar base, strain of the mentalis muscle and/or the position and size of the chin.
For these orthodontic/orthognathic patients, evaluation of the soft tissue is even more crucial in
the preliminary diagnoses and treatment planning phase.
The clinician must also take into account the complexity of the growing face and the
physical changes that occur with the aging process. The majority of facial changes occur up to
the age of 18 years with minor growth and facial form change occurring throughout life. With
age, the nose and chin enlarge and the lips thin and become more retrusive resulting in a more
concave profile (Nanda 1990). Orthodontic treatment has the ability to expand the dental
arches, which may extend the soft tissue envelope and provide better support for the upper and
lower lips as well as the perioral tissue. This increased soft tissue fullness counteracts the effects
of aging, including decreased perioral and lip support, and results in a younger appearance for

3
the patient (Sarver 2001). This paradigm can direct the orthodontic diagnosis and determine a
treatment option of tooth extraction and arch constriction or a non-extraction treatment with
dental arch expansion.
The effects of orthodontic treatment, particularly dental extraction and incisor position
change, has been significantly studied and published in dental literature and there seems to be a
range of theories. Spahl stated, “extraction of teeth makes the dental arches smaller, ‘sinked in’
lip support and makes the smile smaller, constricted and makes the extraction patient seem
older” (Spahl 1986). Other studies determined that orthodontic treatment can alter the profile
and lip support, but the variation in this soft tissue support is vast and it is difficult to reliably
predict soft tissue change with orthodontic treatment (Rudee 1964, Hershey 1972, Roos 1977,
Collett 2006). A careful diagnosis of incisor and lip procumbency can indicate dental extraction,
which will result in better facial harmony and attractiveness (Bowman 2000). In fact, one study
determined that in certain cases facial attractiveness will be compromised without the inclusion
of dental extraction in the orthodontic treatment (Kocadereli 2002).
1.3 FACIAL FORM DIAGNOSIS
For the reasons stated above, a 3-dimensional analysis of the patient’s dentofacial relations is
crucial for proper treatment planning and it is ultimately the soft tissue that dictates the direction
of the orthodontic treatment plan (Sarver 2001). Currently, an orthodontic diagnosis and
treatment plan is based on clinical, radiographic and photographic analysis and measurements.
High quality photographs are necessary to document the pre-treatment status as well as the post
treatment results of the patient, to aid in patient education and communication, for medico-legal
purposes, for pre-surgical planning, and also for the teaching of orthodontic residents (Honrado
2004).
Orthodontists normally evaluate soft tissue form via a clinical exam with 2D
photographs and a cephalometric radiograph, with extraoral 2D profile photographs normally
the primary soft tissue evaluation tool. In the private clinic setting, clinicians use the facial

4
photographs to either confirm what they remember from their clinical patient soft tissue analysis
or simply use the photographs as their primary tool for facial analysis. In orthodontic residency
programs, 2D photography is the primary tool for facial form analysis due to the academic
setting where pictures are used as a teaching tool. It has been suggested this technique is
inadequate as 2D profile photographs are an, “imperfect reflection of what exists clinically” and
they fail to show how the public sees the patient and how the patient see themselves. Treatment
planning a 3D patient in 2D is insufficient as, “facial depth and shape are not accounted for”
(Da Silveira 2003). 2D facial photographs are prone to distortions in magnification, the patient’s
head posture/position as well as the camera position and the 2D frontal photographs often fail to
reveal skeletal asymmetries (Sarver 2001).
The experienced clinician also currently uses the cephalometric soft and hard tissue
measurements as a confirmation for the clinically based facial form diagnoses. We cannot rely
on hard tissue dentoskeletal cephalometric measurements to predict facial soft tissue aesthetics
(Park, Burstone, 1986). “Orthodontic treatment, by altering the dentoskeletal framework, may
produce desirable or undesirable alterations in the external or integmental contours of the face”
(Burstone 1958). Burstone demonstrated over fifty years ago that cephelometric measurements
of the dental and skeletal structures cannot predictably determine the soft tissue drape because,
“soft tissue may vary in different persons in thickness, length, and postural tone” and it is
necessary to directly evaluate the soft tissue. Cephalometric soft tissue readings are inadequate
as they solely show the midsaggital soft tissue while ignoring most of the other facial soft tissue
(Honrado 2004). Raiedel attempted to quantify beauty using angular and linear cephalometric
measurements by analyzing 30 beauty queens. The study showed significant individual
variation, for example the lip thickness of the subject ranged from 8.5 to 16mm, showing
cephalometric numbers could not define beauty (Ridel 1957).
In 2001, Sarver explained, “Because orthodontics does not yet have morphometric tools
for soft tissue evaluation that are comparable in quality and accuracy to those measuring dental
and skeletal components, orthodontists must place greater emphasis on the physical examination
of the patient. This examination requires using skills they have not performed to a great degree
previously and therefore are not accustomed to using.” (Sarver 2001) Because 2D and
cephalometric soft tissue analysis have been shown to be an imperfect means for facial form
diagnosing, we must currently rely on clinical patient soft tissue evaluation. The following list is

5
an amalgamation of the “gold standard” of facial form analysis. However, most orthodontists do
not analyze every facial form measurement described below because there is currently a myriad
of facial form analysis that orthodontists use without a major consensus on which is the most
appropriate and practical. Finally, it is important to remember, “facial evaluation is not the
search for a deviation from the norm of a single subunit, but the appraisal of proportions.”
(Reynak 2012).
1.4 AMALGAMATION OF THE “GOLD STANDARD” OF FACIAL FORM
ANALYSIS
The following list demonstrates frontal and profile view facial measurements that could be used
for orthodontic hard and soft tissue diagnosis. This list does not include every facial form
analysis, but rather the major measurements analyzed by orthodontists. The italicized captions
following the images are directly copied from the Reyneke, 2012 article.
1.4.1 Frontal View (Figures 1-5):
1) Facial Form (Reyneke 2012)
The proportion of facial width to length is most important when evaluating the facial
form. The height width proportion (trichion to menton: bizygomatic width) is 1.3:1 for
females and 1.35:1 for males with the bigonial width being 30% less than the
bizygomatic width (Farkas LG 1987).
2) Vertical proportions of the frontal view of the face at rest (Sarver 2001)

6
a. The most accepted aesthetic proportions are equal heights of facial thirds. Within
the lower facial third, the upper lip should comprise 1/3 and the lower lip + chin
should comprise 2/3 of the vertical height.
b. You must evaluate the philthrum height and its relation to the commissure.
Ideally, the philthrum should be 2-3mm shorter than the commissure height.
c. You must evaluate lip vermilion show, lip incompetence, mentalis strain, and
mandibular asymmetries.
d. Normal upper lip length is 20 +/- 2mm for females and 22 +/- 2mm for males
when measured from subnasale to stomion superiorus. Normal lower lip length is
40+/- 2mm for females and 44 +/- 2mm for males when measured from stomion
inferiorus and B point. Certain conditions like a deep bite or vertical maxillary
excess or deficiency can alter these numbers (Reyneke 2012).
3) Transverse Dimensions (Reyneke 2012)
The face is divided into five equal parts starting from the helix of the outer ear.
4) Facial asymmetry (Reyneke 2012)
Evaluate facial asymmetries in the nose, maxilla, mandible, the chin, or any
combination of the above. A dental evaluation for a cant must be conducted as this can
also result in skeletal asymmetries.
5) Lips (Reyneke 2012)
a. Evaluate for lip asymmetry that could be caused due to myriad of causes
including dentoskeletal deformities.
b. Evaluate interlabial gap in repose, with 1-4mm considered optimal.
c. Evaluate vermilion area, with the lower lip generally showing 25% more
vermillion than the upper lip. Protrusion or retrusion of the upper and lower incisors
will alter the vermillion show.

7
6) Nose
The nasal shape can be altered with orthognathic surgery and the nose is also considered
a component of treatment for many orthognathic surgeons. For this reason, the
orthodontist should evaluate the nose size, shape and symmetry (including alar base,
nostrils, and dorsum.) (Reyneke 2012)
7) Cheeks
There should be a smooth soft tissue line starting from the front of the ear and extending
over the cheekbone and down over the maxilla adjacent to the ala of the nose and finally
ending next to the lip commissures. Any discontinuity of this line may indicate
maxillary or mandibular skeletal deformity. (Reyneke 2012)

8
Figure 1 Height to Width relationship of the face. The relationship of the height of the face (Tr-Me) to the width
(Za-Za) should be 1.3:1 for females and 1.35 for males. The bigonial (Go-Go) width should be approximately
30% less than the bizygomatic (Za-Za) width. (Reynake 2012)
9
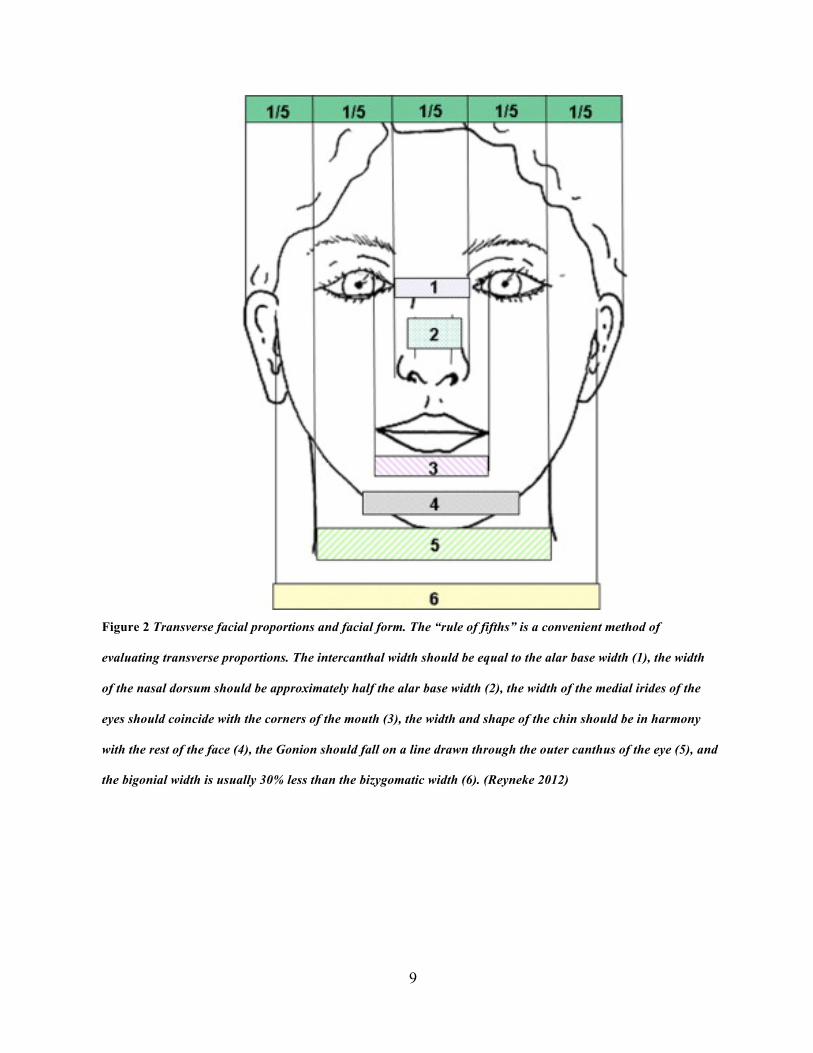
Figure 2 Transverse facial proportions and facial form. The “rule of fifths” is a convenient method of
evaluating transverse proportions. The intercanthal width should be equal to the alar base width (1), the width
of the nasal dorsum should be approximately half the alar base width (2), the width of the medial irides of the
eyes should coincide with the corners of the mouth (3), the width and shape of the chin should be in harmony
with the rest of the face (4), the Gonion should fall on a line drawn through the outer canthus of the eye (5), and
the bigonial width is usually 30% less than the bizygomatic width (6). (Reyneke 2012)

10
Figure 3 Vertical relations. The face can be divided into 3 parts from trichion to menton. The upper third from
trichion (Tr) to glabella (G), the middle third from glabella (G) to subnasale (Sn), and the lower third from
subnasale (Sn) to menton (Me). The lower third can further be divided into an upper third, the upper lip, which
from subnasale (Sn) extends to upper-lip vermillion, and a lower two-thirds, which extends from the lower-lip
vermillion to menton (Me). The labiomental fold will divide the lower-lip/chin area into equal parts. The
vermillion of the lower lip is usually about 25% larger than the upper-lip vermillion. (Reyneke 2012)

11
Figure 4: The cheekbone–nasal base–upper lip–lower lip curve contour line from the frontal view. (A) The
contour line is interrupted (arrow) in the nasal base area, indicating maxillary anteroposterior deficiency. (B)
The improvement in the continuity of the contour of the patient in (A) is evident after maxillary advancement.
The contour line forms a smooth continuous contour without interruptions. (C) There is a double break in the
contour line in this patient. The interruption of the line in the nasal base area (top arrow) indicates maxillary
anteroposterior deficiency, and in the lower-lip area, the interruption of the line (bottom arrow) is ahead of the
curve, indicating mandibular anteroposterior excess. (Reyneke 2012)

12
Figure 5 The concept of facial proportions is illustrated by digitally modifying a face considered to have ideal
facial proportions (Mona Lisa—Leonardo da Vinci [1452-1519]). (A) The face shows a harmonious balance
between the vertical and horizontal dimensions. (B) The transverse dimension is maintained, but the vertical one
is increased with obvious loss of proportion. (C) Maintaining the vertical but increasing the transverse
dimension also leads to loss of facial proportion. (D) By an equal increase of the transverse and the vertical
dimensions, facial proportion is reestablished. The importance of proportion between facial parameters and the
error of relying on absolute values is clearly illustrated. (Reyneke 2012)

13
1.4.2 Profile view (Figures 6-9):
The patient’s head should be in a natural head posture with the lips relaxed (Arnett
1993).
a. Evaluate the nasolabial angle which should ideally measure from 85-105 degrees
from the columella of the nose to the most anterior portion of the upper lip
(Reynak 2012). Excessive retraction of the upper incisors will result in less upper
lip tissue support and an aesthetically unpleasant nasolabial angle.
b. Evaluate the labiomental angle which should ideally be 120 +/- 10 degrees when
measuring from the most anterior/inferior portion of the lower lip and the
pogonion. This angle will become more acute in severe class II patients or those
with macrogenia. This angle will become more obtuse in class III patients with
retroclined mandibular incisors or those with microgenia.
c. Evaluate lip-chin-throat angle as well as the chin-throat length. An aesthetic lip-
chin-throat angle is between 100-120 degrees and 38-48mm, respectively.
d. Evaluate facial contour angle, classifying the face as convex, flat or concave. The
measurement is from soft tissue glabella to subnasale to pogonion. The aesthetic
angle for females is -13 +/- 4 degrees (convex) and -11 +/- 4 degrees for male
(convex). Other facial aesthetic research has shown when the facial form is
evaluated from the profile view, that a straighter profile is preferred for men and a
more convex profile for women (Czarnecki 1993). This angle can be influenced
with clockwise or counterclockwise rotation of the mandible, a result of
orthodontic dental movement or maxillary vertical skeletal growth.
e. Allows proper examination of the upper and lower lip relationship. In females, it
is aesthetically desirable to have a more prominent upper lip compared to the
lower lip. Also, the lower lip should be slightly anterior to the chin in an anterior-
posterior projection. In males, the aesthetic opinion is to have equally
proportioned lips and at the same A-P position as the chin.

14
Figure 6 (A) The nasolabial angle, measured between the columella of the nose and the upper lip, should be 85-
105 degrees. Poor support of the upper lip by the incisors (excessive orthodontic retraction of the upper incisors)
or a hanging columella will result in an obtuse angle, whereas this angle will be acute in Class III cases or in
patients with overclosed bites. (B) The labiomental angle is formed by the lower lip and chin tangent. The angle
will be acute in patients with Class II malocclusion and increased overjet or macrogenia, whereas it will be
obtuse in patients with Class III malocclusion and/or microgenia. (Reyneke 2012)

15
Figure 7 The lip–chin–throat angle (C) is measured between the lower lip and the submental tangent and
should be ±110 degrees. The angle will be obtuse in patients with microgenia, excessive submental adipose
tissue, and protrusive lower incisors, whereas it will be acute in Class III cases and patients with macrogenia.
The chin–throat length (D) can be measured from the chin–throat angle to the soft-tissue menton. The
approximate length should be 42 ± 6 mm and will be longer in Class III cases and shorter in Class II cases. The
facial contour angle (E) is formed by the upper facial plane (UFP) by connecting glabella (G) to subnasale (Sn)
and the lower facial plane (LFP) by connecting subnasale (Sn) to soft-tissue pogonion Po'. It is deemed as
negative if the LFP is ahead of the UFP and positive if the UFP is ahead of the LFP. Males tend to have a
straighter profile (−11 ± 4 degrees), and a more convex profile is considered esthetically pleasing for females
(−13 ± 4 degrees). (Reyneke 2012)

16
Figure 8 The cheekbone–nasal base–lip curve contour line in the profile view. (A) The contour line forms a
smooth continuous curve without interruptions in an individual with a well-balanced facial profile. (B) The
curve is interrupted in 2 places. The concavity in the upper-lip area suggests maxillary anteroposterior
deficiency (top arrow), whereas the lower end of the curve is further forward than it should be, suggesting
mandibular anteroposterior excess (bottom arrow). (C) The curve is interrupted in the upper-lip area, indicating
maxillary anteroposterior deficiency. The curve is continuous at the lower end, indicating that the mandible is in
harmony with the rest of the face. (Reyneke 2012)
17
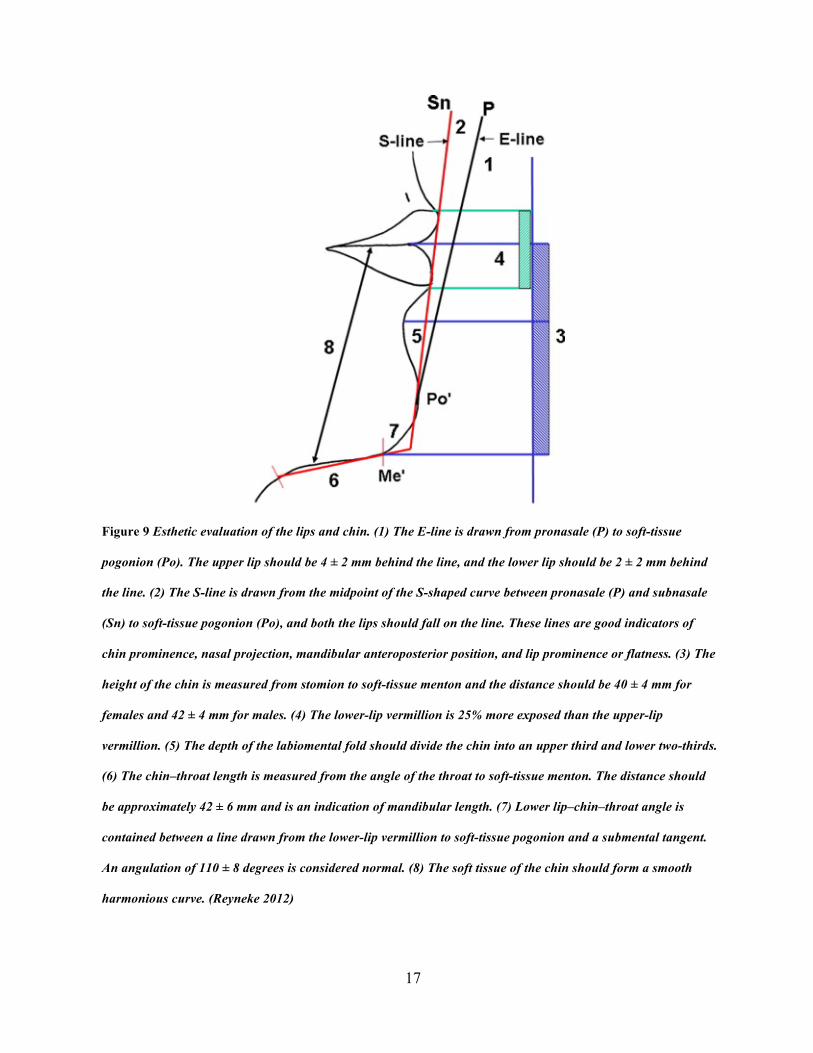
Figure 9 Esthetic evaluation of the lips and chin. (1) The E-line is drawn from pronasale (P) to soft-tissue
pogonion (Po). The upper lip should be 4 ± 2 mm behind the line, and the lower lip should be 2 ± 2 mm behind
the line. (2) The S-line is drawn from the midpoint of the S-shaped curve between pronasale (P) and subnasale
(Sn) to soft-tissue pogonion (Po), and both the lips should fall on the line. These lines are good indicators of
chin prominence, nasal projection, mandibular anteroposterior position, and lip prominence or flatness. (3) The
height of the chin is measured from stomion to soft-tissue menton and the distance should be 40 ± 4 mm for
females and 42 ± 4 mm for males. (4) The lower-lip vermillion is 25% more exposed than the upper-lip
vermillion. (5) The depth of the labiomental fold should divide the chin into an upper third and lower two-thirds.
(6) The chin–throat length is measured from the angle of the throat to soft-tissue menton. The distance should
be approximately 42 ± 6 mm and is an indication of mandibular length. (7) Lower lip–chin–throat angle is
contained between a line drawn from the lower-lip vermillion to soft-tissue pogonion and a submental tangent.
An angulation of 110 ± 8 degrees is considered normal. (8) The soft tissue of the chin should form a smooth
harmonious curve. (Reyneke 2012)

18
1.5 3D STEREOPHOTOGRAMMETRY IMAGING
Recent advances in imaging technology have made available 3D photography for the use of
facial form analysis. Three-dimensional (3D) soft tissue imaging allows the capture of surface
tissue in three dimensions, overcoming the limitations of two-dimensional analysis by providing
enough information for the analysis of all the facial components (Souccar 2012). This capture of
surface tissue is not dependent on proper head position and/or camera orientation (Ferrario
1996). There are several modalities of 3D soft tissue capture and analysis, with photogrammetry
and laser scanners being the two most popular and widely used (Hennessy 2005). Both systems
use multiple cameras to capture illuminated objects, are non-invasive and without objecting the
patient to radiation (Hennessy 2006). Laser scanners triangulate soft tissue form using
geometric principles with the use of a light source, the object being measured, and a receiver.
The laser beam reflects scattered light off of the target, which is recorded by the receiver,
ultimately analyzing the object’s spacial location (Blais 2004). Stereophotogrammetry also uses
triangulation, utilizing mathematical algorithms to analyze points captured from a light mesh
projected on the object being measured. A minimum of two cameras in a stereo pair with a
known focal length in relation to the patient are needed to accurately formulate the shape of the
object. These cameras at different angles to the object overlap the different light patterns
reflected from the object, allowing a continuous 360-degree 3D image of the object (Lane
2008). The stereophotogrammetry system has a much faster capture time (1 second), an
accuracy of approximately 0.5mm, a resolution of 40,000 polygons, a 24-bit color image, and
does not need the patient to close eyes for risk of damage from a laser beam. These factors
make the stereophotogrammetry system the ideal method for facial form capture, particularly in
younger patients that are difficult to keep still (Honrado 2004, Souccar 2012).
Two methods for the examination of the 3D image are a) millmetric/angular/volumetric
measurements between operator appointed landmarks and b) the use of facial averages to
examine facial natural development and orthodontic/surgical treatment changes (Souccar 2012).
Landmark placement for the use of facial measurement with the 3D stereophotogrammetry
system has been shown to be precise, repeatable, and accurate for soft tissue analysis (Aldridge
2005). The drawback of this technique is the limited number of identifiable landmarks. In
contrast, the facial averages method superimposes two captured images using stable and

19
identifiable landmarks, allowing linear measurements and surface volumetric evaluation
between the two objects (Zhurov 2010).
Furthermore, 3D surface imaging has been used to isolate specific diagnostic traits in
craniofacial syndromic populations. Identifying specific diagnostic facial markers, for example
in Fetal Alcohol Syndrome or non-syndromic cleft lip/palate, aids in the rapid screening and
identification of affected populations (Douglas 2010).
1.6 AIM OF THIS STUDY
The aim of this pilot study is to study the difference of 3D photography versus 2D photography
for facial form analysis to determine which photographic method most closely mimics clinical
analysis of facial form. Through our photographic and clinical facial form evaluations, the aim
is to a) compare candidate facial form analysis from 2D photographs to clinical facial form
analysis in the 12 mentioned facial form criteria b) compare candidate facial form analysis from
3D photographs to clinical facial form analysis in the 12 criteria c) compare the differences
between 3D and 2D facial form analysis when compared to clinical facial form analysis in the
12 criteria, d) evaluate facial form analysis (2D, 3D, and Clinical) of the 12 criteria between the
two evaluators, E) evaluate consistency of facial form analysis (2D, 3D, and Clinical) of the 12
criteria by each evaluator within each medium used. Ultimately, the hope is to add to the body
of knowledge for using the 3-D Stereophotogrammetry system in evaluating facial form and
also improving upon the facial form diagnosis process, which every orthodontist undergoes with
each patient.

20
1.7 HYPOTHESIS
We hypothesize that facial form diagnosis using 3D photographs more closely match clinical
facial form diagnosis when compared to using 2D photographs. We further hypothesize a high
reliability of facial form diagnosis between the two evaluators using the same medium of 2D
photographs, 3D photographs or clinical evaluation. Lastly, we hypothesize a high reliability of
facial form diagnosis within the same raters using the three different mediums.

21
2.0 METHODS
This research study was credentialed by the University of Pittsburgh Health Sciences
and approved by the University of Pittsburgh Institutional Review Board. University of
Pittsburgh dental and dental hygiene students were recruited for this research project, none of
whom were below 18 years of age. This population was targeted for potential candidates
because dental and dental hygiene students were easily accessible within the dental building, in
high numbers, and anticipated to be willing and eager to participate in dental related research.
Also it was unlikely that the two orthodontic faculty evaluators had much, if any, contact with
the potential candidates, which helped with candidate anonymity. Lastly, this group of potential
candidates could have been the typical patient pool seen in an orthodontic clinic.
2.1 CANDIDATE RECRUITMENT
Candidate recruitment was conducted by Payam Zamani, DDS, a third-year University of
Pittsburgh orthodontic resident, in the dental school building. Dr. Zamani presented a 5-minute
PowerPoint presentation to the dental and dental hygiene students in one of their regular
lectures (acquired permission by course professor) on the advances of facial imaging and 3D
imaging and why it is important for orthodontic diagnosing and treatment planning. Any
interested candidates were asked to email the orthodontic resident to be scheduled for a
screening.
All efforts were taken to assure recruitment did not have undue influences on the
potential candidates. It was stressed to the potential candidates that participation is completely

22
voluntary and their only benefit for participation is knowledge that they are advancing scientific
research and they will be able to experience the process of facial form diagnosing and 3D
imaging, tools which might help them in their future practices.
2.2 CANDIDATE CONSENT
Every potential candidate was required to review and sign an informed consent form. The
informed consent form was given to the potential candidate prior to any screening protocols or
3D/2D photography. Candidates were told, “Your participation is completely voluntary and
there will be no negative repercussions if you decline to participate. You will not be
compensated in any way. You may read the consent form now and I can answer any questions
you may have. We can begin the screening process today or you may take up to one week to
decide if you will like to participate in the study” to ensure there is no coercion or undue
influence. As for the orthodontic evaluators, Dr. Zamani obtained verbal consent from the
evaluators. The orthodontic faculty evaluators were given up to two weeks to decide to
participate in the study.
Study candidates were first asked to read and sign the informed consent form,
which outlined the research process, what was expected of them and how we may utilize
research information in terms of data publication. Dr. Zamani was responsible for explaining
and documenting candidate consent forms. Dr. Zamani clearly answered any questions
regarding the consent form and the expectation of the candidates and also outlined the process
of the research study, including photos, facial evaluations, and general timeline. Candidates had
one week after they were handed the consent form and explained the process of the research
study to determine if they wanted to join the study. They were asked to email Dr. Zamani with
their decision. As for the orthodontic faculty evaluators, Dr. Zamani read to the potential
examiners a recruitment script. As stated in the script, the evaluators had up to two weeks to
decide to participate in the project. Dr. Zamani answered any questions regarding the verbal
23
consent form and the expectation of the candidates and outlined the process of the research
study, including evaluating photos, facial evaluations, and general timeline of the project.
2.3 INCLUSION AND EXCLUSION CRITERIA
The inclusion criteria for candidates included dental and dental hygiene students who were at
least 18 years of age. All types of facial forms were accepted into the study.
The exclusion criteria included any facial trauma, swelling, scars, large visible
acne, which could have changed in appearance within the three months post photograph capture.
Also, those who planed to undergo facial altering like facial injectables, surgery and/or
microabrasion in the 3 months needed for facial form evaluation were excluded from the study.
Also, those who were currently in orthodontic treatment were excluded from the study. Any
candidate who experienced any of these facial soft tissue alterations mid-study were also
excluded.
2.4 PHOTOGRAPHIC RECORDINGS
Candidates who were accepted into the study had 3D full facial and 2D frontal and profile
photographs taken in the repose position. Candidates were asked to shave or shortly trim any
facial hair and to not use facial makeup in order to ensure consistency of facial form between
the 2D, 3D and clinical evaluations and also allow the 3D camera to capture the proper skin
tone of the candidates. Candidates had a bite registration taken before any recordings to insure
the position of the mandible and occlusion remained constant throughout the photographic
recordings and evaluations. Candidates were asked to wear large black sunglasses covering the
eyes and a black head beanie covering the hair to insure subject anonymity. Candidates were
asked to lick their lips, softly bite into their pre-registered bite registrations, and to relax their
facial muscles/face for the picture. One operator took all of the 3D and 2D photographs and

24
each candidate had the 3D and 2D photos taken at the same session to prevent any facial
changes. All 3D and 2D photographs were taken in the basement 3D camera room in the dental
school.
2.4.1 3dMDface Digital Stereophotogrammetry
The 3D images was taken using a 3dMDface digital stereophotogrammetry system at the
University of Pittsburgh School of Dental Medicine building. The system was pre-calibrated at
the measured focal point and on a fixed tri-pod stand. This validated system is capable of
acquiring the geometry and skin texture of the facial surface in less than 1 second. All subjects
were seated four feet away from the 3dMDface digital camera system and patients were asked
to be in the natural head posture facing straight between the cameras, as it is a reproducible
position as the picture is taken (Chiu 1991). Multiple 3D photographs were taken if the
rendering of the original photograph resulted in empty spaces on the soft tissue as a result of
improper lighting on the skin from the flash. A white screen was the background for all 3D
photographs.
2.4.2 2D Digital Photography
The photographic set-up included a PowerShot A2400 IS HD Canon 16.0 megapixel 5x optical
zoom digital camera. The camera was on “portrait” mode with flash off to eliminate any
shadowing effect. The camera was held five feet from a marked line where the candidates were
asked to stand. All effort was taken to maintain the horizontal optical axis of the lens.
Candidates were asked to stand on the drawn line on the floor and face forward (frontal picture)
and turn the entire body to the left (profile picture) in the natural head position outlined in Chiu
1991. A white screen was the background for all 2D photographs.

25
2.5 EVALUATORS
The evaluators were two orthodontic faculty members at the University if Pittsburgh School of
Dental Medicine. Evaluator #1 (D.M.D., M.D.S., Ph.D.) and evaluator #2 (D.M.D., M.S.) were
both ABO certified orthodontist and assistant professors at the University of Pittsburgh
department of Orthodontics and Dentofacial Orthopedics. Evaluator #1 has 25 years of private
practice experience as well as 20 years in academics. Evaluator #2 has 30 years in private
practice experience and 5 years in academics. The evaluators did not have ties of any kind to the
subjects being evaluated. One evaluator did not have any tie to the current research project
while the other was asked to be on the research project masters committee. However, this
evaluator did not have any specific knowledge of any project details until after the evaluations
were complete. No compensation of any kind was given to the evaluators.
2.6 EVALUATIONS
Evaluations were conducted in the orthodontic department of the school of dental medicine. All
evaluations were conducted in a private orthodontic conference room. Evaluators were not
given any information on the candidates except that they were a dental or dental hygiene
student. Evaluators analyzed 12 categories of facial form of the subjects using a continuous
scale of 1-10. These 12 categories were chosen because they are the most used measurements at
the University if Pittsburgh orthodontics department and they also encompass most of the main
facial form categories previously mentioned. The 12 different categories of facial form can be
seen in Figure 10.

26
Figure 10 Sample evaluator questionnaire showing the 12 categories of facial form

27
2.6.1 3D Evaluation
Evaluators were given a 5-minute tutorial by Dr. Zamani to demonstrate how to control facial
movement on the laptop screen (rotation/tipping of the face) using a sample model as well as to
give instructions for this segment of evaluation. 3D full facial digital photographs of each
candidate were shown on a computer laptop screen (property of the school of dental medicine)
that allowed the evaluator to view the face from all angles at the operators’ control. The 3D
photographs were available to analyze for the above-mentioned 12 criteria for a maximum of 2
minutes. The evaluators were given the option to choose to rate each category at the end of the 2
minutes or within their allotted time for facial analysis. The evaluations by the two evaluators
were conducted simultaneously in the same room. Each evaluator sat on either side of the
operator, Dr. Zamani. The operator would display the next 3D photograph upon the request of
both evaluators.
2.6.2 2D Evaluation
The 2D facial and profile photographs were displayed on a PowerPoint presentation. The 2D
photographs were available to analyze for the above-mentioned 12 categories for a maximum of
2 minutes. The operator were given the option to choose to rate each category at the end of the 2
minutes or within their allotted time for facial analysis. The evaluations by the two evaluators
were conducted simultaneously in the same room. Each evaluator sat on either side of the
operator, Dr. Zamani. The operator would display the next 2D photograph upon the request of
both evaluators.
2.6.3 Clinical Evaluation
Candidates were seated in a private orthodontic room wearing the same clothing/sun glasses,
head beanie as the previously taken 2D/3D photographs. Candidates were given the same
instructions as before (bite registration, repose face, etc.), they were asked to not open their
28
mouth, speak, or change their facial expression and were seated in front of a white screen to
mimic a similar background to the 2D and 3D photos. They were allowed to move their head
side to side and up and down, per the evaluators request. Evaluators were not permitted to touch
the candidates. The candidates were available to be analyzed for the above-mentioned 12
categories for a maximum of 2 minutes. The operator were given the option to choose to rate
each category at the end of the 2 minutes or within their allotted time for facial analysis. The
evaluations by the two evaluators were conducted simultaneously in the same room.
2.7 STATISTICAL ANALYSIS AND STUDY DESIGN RANDOMIZATION
The subjects were photographed in a random order based on the subject’s schedule. The order in
which the evaluators had the opportunity to evaluate each subject’s 3D photographs, 2D
photographs, and the clinical facial form analysis was also randomized for all subjects using a
random number generator on http://graphpad.com/quickcalcs/randomN1.cfm. The order in
which the evaluators evaluated via each medium was also random using the same random
number generator. In order to insure evaluators did not memorize/remember patient soft tissue
form between evaluations sessions (in addition to having each subject cover their eyes and hair),
each evaluation session was separated by a 24-hour time span.
To analyze intra-rater reliability, two extra evaluation sessions were conducted for the
2D, 3D and clinical evaluations. These subjects were chosen randomly and the evaluations were
conducted under the same protocol and scheduling as the original evaluation sessions.
Intra-rater and inter-rater reliability testing was conducted using Krippendorff’s Alpha-
Reliability test. A measure is said to have a high reliability if it produces similar results under
consistent conditions; in other words, reliability is consistency (Eisinga 2012). Intra-rater
reliability is the degree of agreement among repeated tests performed by a single rater and inter-
rater reliability is the degree of agreement among raters. We followed Landis and Koch’s (1977)
guidelines for interpreting reliability values, with values from 0.0 to 0.2 indicating slight
29
agreement, 0.21 to 0.40 indicating fair agreement, 0.41 to 0.60 indicating moderate agreement,
0.61 to 0.80 indicating substantial agreement, and 0.81 to 1.0 indicating almost perfect or
perfect agreement. Any negative alpha values in the results indicate evaluator disagreement and
Error indicates to variability within the evaluators analysis; and therefore, reliability could not
be calculated
2.8 PRACTICE TRIAL
In order to train the orthodontic evaluators with the evaluation process and time-line of this
project, a practice trial was conducted consisting of five 2D, 3D and clinical evaluations. The
evaluators received a 15-minute PowerPoint presentation on facial form analysis and pictures to
clearly define what the 12 categories specifically measure. They also received a verbal lesson on
the outline of the project. The results of the practice trial are included in the final statistical
analysis.

30
3.0 RESULTS
A total of 77 candidates were recruited and met the inclusion criteria for this study and no
candidates were excluded once the study commenced. All candidates had 2D and 3D
photographs taken. Due to concerns of evaluator fatigue, 54 candidates were randomly chosen
from the group of 77 to be included in the study. This group consisted of 21 males and 33
females. In addition to the three practice evaluations, there were a total of nine evaluation
sessions: Clinical 54 candidates, 2D 54 candidates, 3D 54 candidates; 2 times of Clinical 12
candidates, 2D 12 candidates, 3D 12 candidates. The purpose of the 12 candidate evaluation
sessions was for intra-rater reliability testing and they were randomly selected from the 54
candidates. The nine evaluation sessions were spread over two-weeks with the order of
evaluation type and candidate order within each evaluation session chosen randomly. The
evaluation form was grouped from the 1-10 continuous scale to an ordinal scale of 1-3, 4-6, and
7-10.
3.1.1 Intrarater Reliability
Krippendorff’s Alpha was used to analyze intra-rater reliability (Tables 1 and 2) following
Landis and Koch’s (1977) guidelines for interpreting reliability values; values from 0.0 to 0.2
indicating slight agreement, 0.21 to 0.40 indicating fair agreement, 0.41 to 0.60 indicating
moderate agreement, 0.61 to 0.80 indicating substantial agreement, and 0.81 to 1.0 indicating
almost perfect or perfect agreement. As shown in Table 1, Examiner #1 diagnosed nine out of
the total 36 possible categories (12 categories per media) with substantial reliability. These nine
are lower lip procumbency, overall lip procumbency, mandibular position in the A-P plane,
labiomental angle, mentalis muscle strain, and lower 1/3 facial height. Out of these nine, only

31
category #7 (labiomental angle) was diagnosed with substantial reliability in all three medias.
Examiner #2 diagnosed six substantially reliable and seven perfectly reliable categories out of
the total 36 possible (12 questions per media). Out of these thirteen, only category #12 (lower
1/3rd height) was diagnosed with substantial reliability in all three medias; however, within
Examiner #2’s evaluations, categories #3 (overall lip procumbency) and #6 (nasolabial angle)
were at least substantially reliable in the live and 3D evaluations, category #7 (labiomental
angle) was at least substantially reliable in the clinical and 2D evaluations and category #11
(mentalis muscle strain) was at least substantially reliable in the 2D and 3D evaluations.
Table 1: List of reliable facial form categories rated by each examiner in each of the three medias. Listed categories demonstrate substantial reliability (alpha>0.6) and perfect* reliability (alpha>0.8), N=12, 2 sessions.
Table 1: List of reliable categories
Categories -‐ Clinical Categories -‐2D Categories -‐ 3D
Examiner #1 2,3,4,7 4,7,11 7,12
Examiner #2 1*,3,6,7,12 7*,11*,12* 2*,3*,6*,11,12

32
Table 2: Reliability (alpha values) between 2 sessions of each media within Examiner #1 and Examiner #2. NA: negative alpha; ERROR: No variation, alpha can't be computed.
Table 2 Intra-rater reliability between two sessions of each media
Categories Examiner #1
Clinical Examiner #1
2D Examiner #1
3D Examiner #2
Clinical Examiner #2
2D Examiner #2
3D 1 NA NA 0.34 0.84 0.57 NA 2 0.69 0.30 0.36 0.24 0.00 1.00 3 0.62 0.28 0.42 0.67 ERROR 1.00 4 0.69 0.66 0.23 0.51 NA 0.42 5 0.27 NA NA 0.03 NA NA 6 0.50 0.29 0.03 0.61 0.04 1.00 7 0.70 0.60 0.60 0.67 1.00 0.75 8 NA 0.11 NA 0.03 NA NA 9 NA 0.11 NA 0.03 NA NA 10 0.19 0.13 0.00 0.00 0.00 ERROR 11 0.04 0.73 0.10 0.42 1.00 0.64 12 0.34 0.37 0.63 0.62 1.00 0.66
AGREEMENT Perfect (alpha>0.8) Substantial (alpha>0.6)

33
3.1.2 Reliability Between Media
Krippendorff’s Alpha was used to analyze the reliability between the three different media for
both examiners (Table 3). There was no substantial reliability (alpha >0.6) found between
Examiner #1 evaluations. There were five substantially reliable values for Examiner #2.
However, only three of the five category combinations (Category #11 2D-3D, Category #7
Clinical-2D, Category #12 Clinical-2D) included combinations of both categories that
previously demonstrated substantial reliability (Table 2).
Table 3: Reliability (alpha values) between medias within Examiner #1 and Examiner #2. NA: negative alpha; ERROR: No variation, alpha can't be computed.
Table 3: Reliability between medias by each evaluator
Categories Examiner #1 Clinical-‐2D
Examiner #1 Clinical-‐3D
Examiner #1 2D-‐3D
Examiner #2 Clinical-‐2D
Examiner #2 Cliniacl-‐3D
Examiner #2 2D-‐3D
1 0.41 0.34 0.38 0.45 0.48 0.6 2 0.39 0.34 0.15 0.5 0.55 0.38 3 0.38 0.2 0.22 0.45 0.59 0.37 4 0.37 -‐0.1 0.12 0.31 0.28 0.47 5 -‐0.21 -‐0.1 0.01 -‐0.27 -‐0.24 -‐0.01 6 0.17 0.22 0.39 0.51 0.49 0.69 7 0.51 0.31 0.57 0.65 0.55 0.66 8 0.12 -‐0.1 -‐0.11 0.1 0.19 -‐0.1 9 0.14 -‐0.2 0.04 0.14 0.25 -‐0.1 10 0.25 -‐0.1 -‐0.19 ERROR ERROR ERROR 11 0.2 0.27 0.25 0.55 0.33 0.68 12 0.34 0.15 0.4 0.63 0.46 0.36
AGREEMENT Perfect (alpha>0.8) Substantial (alpha>0.6)

34
3.1.3 Interrater Reliablity
Lastly, Krippendorff’s Alpha was used to analyze the interrater reliability for each media (Table
4). However, there were no substantially reliable results from this analysis.
Table 4: Reliability (alpha values) between two examiners for each media.
Table 4 Interrater reliability of each media between the two evaluators
Categories Clinical 2D 3D 1 0.39 0.2 0.34 2 0.5 0.25 0.46 3 0.36 0.33 0.49 4 0.13 0.1 0.02 5 0.13 0 -‐0.13 6 0.24 0.39 0.24 7 0.47 0.52 0.29 8 0.15 0.22 0 9 0.34 0.15 -‐0.04 10 -‐0.02 -‐0.27 -‐0.05 11 0.28 0.31 0.39 12 0.27 0.39 -‐0.14
AGREEMENT Perfect (alpha>0.8) Substantial (alpha>0.6)

35
4.0 DISCUSSION
Lower third facial form diagnosis is an integral component of orthodontic treatment planning
process. The results of this study indicate an overall low level of facial form diagnosis reliability
within evaluators using any of the three media. Examiner #2 demonstrated overall higher
reliability in facial form diagnosis when compared to Examiner #1, but still at a low level. The
overall low level of reliability could be due to several factors including, but not limited to,
inadequate training of evaluators for what exactly was being evaluated and/or evaluator fatigue.
Possible solutions for evaluator fatigue could be to reduce the number of categories the
evaluators analyze, reduce the number of candidates in the evaluation process, and change the
1-10 scale to a more simple 1-3 scale.
At the University of Pittsburgh department of Orthodontic, 2D photographs are
the main media used to discuss and teach facial form diagnosis; 3D cameras are not yet
available in the clinic due to their expense and it is not feasible for all residents to evaluate each
patient in person (clinical). In our study, the two examiners diagnosed only six out of 24
categories (12 categories per examiner) with substantial reliability using the 2D photographs.
Out of these, only categories #7 and #11 were diagnosed with substantial reliability by both
examiners. This questions the appropriateness of using 2D photographs in facial form
diagnosis as a teaching tool and for treatment planning. However, diagnosis using clinical
analysis and 3D photographs did not result in much more reliable categories (nine out of 24
categories for clinical and seven for 3D photography) which questions the value of facial form
diagnosis with any of the three media.
Clinical evaluations resulted in higher overall numbers of reliability when
compared to 3D and 2D photographic evaluations. The two examiners diagnosed seven of the
categories with substantial reliability using 3D photographs, six of the categories using 2D
photographs and nine of the categories using clinical evaluations. This result supports our initial

36
expectation for the clinical evaluation to be the gold standard because it demonstrated the most
categories diagnosed with substantial reliability. However, the examiners still only diagnosed
nine out of 24 categories (12 categories per examiner) with substantial reliability using 3D
photographs, which makes clinical evaluations an imperfect system for facial form diagnosing.
This information is particularly useful for a private practice orthodontist who could rely on
clinical evaluations for facial form diagnosis and treatment plan. As mentioned above, this is
not the case in an educational setting.
Krippendorff’s Alpha inter-rater reliability analysis was used to evaluate
diagnosis similarities between the two evaluators. Facial diagnosing is very subjective for many
reasons, including the educational background of the orthodontist, their opinion of aesthetic
beauty and balance, and/or experience in facial form diagnosis. Only categories that both
evaluators diagnosed with substantial intra-rater reliability can be used to analyze inter-rater
reliability. Category #3 Clinical (overall lip procumbency), #7 Clinical and 2D (labiomental
angle), #11 2D (mentalis muscle strain), and #12 3D (lower 1/3 facial height) demonstrated
substantial intra-rater reliability by both evaluators. However, when looking at table 4 for inter-
rater reliability, none of the categories demonstrated substantial reliability. This finding
supports the idea that facial form analysis is a subjective skill and the two evaluators, much like
many orthodontists with differing diagnosis, did not agree with each other’s analysis.
Lastly, Krippendorff’s Alpha reliability testing was used to determine if
diagnosis using either 2D or 3D photographs more closely resembled clinical diagnosis. Only
categories previously diagnosed with substantial reliability using all three medias were analyzed
(Table 2). This resulted in Examiner #2’s diagnosis of category #12 (lower 1/3 facial height)
and Examiner #1’s diagnosis of category #7 (labiomental angle). Based on these results,
Examiner #2’s 2D diagnosis of lower 1/3 facial height more closely and reliably resembled the
clinical evaluation when compared to the 3D evaluation of lower 1/3 facial height (Clinical-2D
alpha of 0.63 vs. Clinical-3D alpha of 0.46). Examiner #1’s 2D evaluation of the labiomental
angle more closely and reliably resembled the clinical evaluation when compared to the 3D
evaluation of the labiomental angle (Clinical-2D alpha of 0.51 vs. Clinical-3D alpha of 0.31).
However, it is important to note that Examiner #1’s Clinical-2D evaluation alpha, although
higher than the Clinical-3D alpha, did not meet the >0.6 threshold to be considered substantially
reliable. Although 2D photographs are shown here to more closely resemble clinical

37
evaluations when evaluating lower 1/3 facial height and labiomental fold, these are only two of
twelve criteria; therefore, it is difficult to conclude facial diagnosis using 2D photography more
closely resembles clinical diagnosis than using 3D photographs.
This pilot study had several downfalls that could have affected the results. The
two evaluators were provided with five clinical, 2D and 3D practice sessions along with a
PowerPoint presentation of the 12 criteria and their exact meaning. It is possible that a more
extensive practice session was needed prior to the study. Also, the 1-10 continuous scale, which
the evaluators used for diagnosis, was grouped to the ordinal scale of 1-3, 4-6, and 7-10. This
was due to the fact that three categories are more clinically applicable than a 1-10 scale. Also,
the 1-10 scale could not have been divided into three even groups as the first two groups
contained three numbers each (1,2,3 and 4,5,6) and the third group contained four (7,8,9,10).
This difference could have ultimately altered the results. A 1-3 categorical scale might have
been more appropriate for the evaluation sheet and recommended for future studies. Also, the
educational background and/or personal bias of facial attractiveness and norms could have
played a large role in the subjective analysis of facial form diagnosis and possibly played a rold
in the greater consistency of one evaluator over the other. Lastly, evaluator fatigue could have
altered the results. This could easily be solved in a future study by using a smaller sample size,
lower number of categories per questionnaire for the evaluators to analyze and a greater
timespan between the evaluations.
38
5.0 CONCLUSION
This project is a pilot study to analyze how orthodontists evaluate and diagnose facial form.
Facial form diagnosis is important because it partially dictates the orthodontic treatment plan,
which can include extraction of teeth, use of functional appliances or orthognathic surgery to
move teeth and facial bones. There are many criteria in the literature for lower 1/3 facial form
analysis. We chose the most common 12 criteria to be included in this study. Some
orthodontists use none of the criteria for analysis and some use most of them. We were
interested to analyze three questions:
1) Can an orthodontist reliably diagnose any of the 12 criteria using the 3 given media of
clinical, 2D photography and 3D photography?
2) Does 2D or 3D photography provide more diagnosis similarities to clinical evaluation
of facial form?
3) Can the two evaluating orthodontists have similar facial form diagnosis results?
The results indicated the two examiners did not reliably diagnose most of the 12 facial form
categories using the three media. Because of the low intra-rater reliability for the 12 categories
within the two orthodontists, it is difficult to properly answer questions 2 and 3.

39
ACKNOWLEDGEMENTS
I would like to thank Dr. Varun Kalra and Dr. Karen Cuenco for their help in the study design. I
would also like to thank Dr. John Burnheimer and Dr. Jan Robison for their efforts in this
project. Lastly, I would like to thank David Cole and Elyssa Barnett for their aid in project
management.

40
BIBLIOGRAPHY
Aldridge K, Boyadjiev SA, Capone GT, et al: Precision and error of three-dimensional phenotypic measures acquired from 3dMD photogrammetric images. Am J
Med Genet A 138A:247-253, 2005
Arnett, G. W., & Bergman, R. T. (1993). Facial keys to orthodontic diagnosis and treatment planning. Part I. American journal of orthodontics and dentofacial orthopedics, 103(4), 299-312.
Blais F: Review of 20 years of range sensor development. J Electron Imaging 13:231-240,
2004 Bokas J, Collett T: Effects of upper premolar extractions on the position of the upper lip.
Aust Orthod J 22:31-37, 2006
Bowman SJ, Johnston LE: The esthetic impact of extraction and non-extraction treatments on Caucasian patients. Angle Orthod 70:3-10, 2000
Burstone CJ: The integumental profile. Am J Orthod 44:1-25, 1958
Chiu, C. S. W., & Clark, R. K. F. (1991). Reproducibility of natural head position. Journal of Dentistry, 19(2), 130-131.
Clifford M, Walster E. (1973). The effect of physical attractiveness on teacher expectations. Sociol Educ. ;46:248–258.
Czarnecki ST, Nanda RS, Currier GF: Perceptions of a balanced facial profile. Am J Orthod Dentofacial Orthop 104:180-187, 1993
Da Silveira AC, Daw JL, Kusnoto B, et al.: Craniofacial applications of threedimensional
laser surface scanning. J Craniofac Surg 2003, 14:449–456.
Dion K, Berscheid E, Walster E. (1972). What is beautiful is good. J Pers Soc Psychol. ;24:285– 290.
Douglas TS, Mutsvangwa TE: A review of facial image analysis for delineation of the facial phenotype associated with fetal alcohol syndrome. Am J Med Genet A 152A:528-536, 2010
Efran MG, Patterson EWJ. (1974). Voters vote beautiful: the effect of physical appearance on a national election. Can J Behav Sci.;6:352–356.

41
Eisinga, Rob, Manfred Te Grotenhuis, and Ben Pelzer. "The reliability of a two-item scale: Pearson, Cronbach, or Spearman-Brown?." International journal of public health 58.4 (2013): 637-642.
Farkas LG, Munro JR:Anthropometric Facial Proportions in Medicine. Springfield, Charles C. Thomas, 1987
Ferrario VF, Sforza C, Poggio CE, Serrao G. Facial three-dimensional morphometry. American Journal of Orthodontics and Dentofacail Orthopedics 1996b;109,86-93. Hennessy RJ, McLearie S, Kinsella A, et al: Facial surface analysis by 3D laser scanning and geometric morphometrics in relation to sexual dimorphism in cerebral- Craniofacial morphogenesis and cognitive function. J Anat 207:283-295, 2005 Hennessy RJ, McLearie S, Kinsella A, et al: Facial shape and asymmetry by three-dimensional laser surface scanning covary with cognition in a sexually dimorphicmanner. J Neuropsychiatry Clin Neurosci 18:73-80, 2006 Hershey HG: Incisor tooth retraction and subsequent profile change in postadolescent female patients. Am J Orthod 61:45-54, 1972 Honrado, C. P., & Larrabee Jr, W. F. (2004). Update in three-dimensional imaging in facial plastic surgery. Current opinion in otolaryngology & head and neck surgery, 12(4), 327- 331. Janzen EK. (1977). A balanced smile—a most important treatment objective. Am J Orthod ;72:359–372 Jørnung J, Fardal . Perceptions of patients’ smiles: a comparison of patients’ and dentists’ opinions. J Am Dent Assoc 2007;138:1544–53. Kocadereli I: Changes in soft tissue profile after orthodontic treatment with and without extractions. Am J Orthod Dentofacial Orthop 122:67-72, 2002 Krishnan V, Daniel ST, Lazar D, Asok A. (2008). Characterization of posed smile by using visual analog scale, smile arc, buccal corridor measures, and modified smile index. Am J Orthod Dentofacial Orthop.;133:515–523 Landis JR, Koch GG. The measurement of observer agreement for categorical data. Biometrics. 1977;33(1):159–174 Lane C, Harrell W Jr: Completing the 3-dimensional picture. Am J Orthod Dentofacial Orthop 133:612-620, 2008

42
Langlois JH, Kalakanis L, Rubenstein AJ, Larson A, Hallam M, Smoot M. (2000). Maxims or myths of beauty? A meta-analytic and theoretical review. Psychol Bull. ;126:390–423. Nanda RS, Megn H, Kapila S, Goorhuis J. Growth changes in the soft tissue facial profile. Angle Orthod 1009;60:177-90 Park, Y. C., & Burstone, C. J. (1986). Soft-tissue profile-fallacies of hard-tissue standards in treatment planning. American Journal of Orthodontics and Dentofacial Orthopedics, 90(1), 52-62. O’Doherty J, Winston J, Critchley H, Perrett D, Burt DM, Dolan RJ. (2003). Beauty in a smile: the role of medial orbitofrontal cortex in facial attractiveness. Neuropsychologia. ;41:147–155. Reyneke, J. P., & Ferretti, C. (2012, September). Clinical Assessment of the Face. In Seminars in Orthodontics (Vol. 18, No. 3, pp. 172-186). WB Saunders. Riedel RA: An analysis of dentofacial relationships. Am J Orthod 43:103-119, 1957 Riggio Rf, Widaman KF, Tucker JS (1991). Beauty is more than skin deep: Components of attractiveness. Basic Appl Soc Psychol; 12(1):423-439 Roos N: Soft-tissue profile changes in Class II treatment. Am J Orthod 72:165-175, 1977 Rudee AD: Proportional profile changes concurrent with orthodontic therapy. Am J Orthod 50:421-434, 1964 Sarver, D. M. (2001). The face as the determinant of treatment choice. CRANIOFACIAL GROWTH SERIES, 38, 19-54. Souccar, N. M., & Kau, C. H. (2012, September). Methods of Measuring the Three-Dimensional Face. In Seminars in Orthodontics (Vol. 18, No. 3, pp. 187-192). WB Saunders. Spahl TJ, Witzig JW: The clinical management of basic maxillofacial orthopedic appliances, in Mechanics, Vol 1. Littleton, MA, PSG Publishing Co, 1986 Thompson L, Malmberg J, Goodell N, Boring R (2004). The distrivution of attention across a talkers face. Discourse Processes 38:145-168 Van der Geld P, Oosterveld P, Van Heck G, Kuijpers-Jagtman AM. (2007). Smile attractiveness. Self-perception and influence on personality. Angle Orthod. ;77:759–765. Zhurov A, Richmond S, Kau CH, et al: Averaging facial images. Three Dimensional Imaging for Orthodontics and Maxillofacial Surgery. United Kingdom, Wiley Blackwell, 2010