Embed Size (px)
Citation preview
Comparing Accident Pattern & Characteristics on National Highways in India
Presented byHasan Mehdi Naqvi
Chief General Manager (T) & Regional Officer-Tamil Nadu,
National Highways Authority of India
WRM Paper ID-640
November 14, 2017
IRF World Road Meeting 2017, November 14-17, 2017, Delhi, India
Outline of the Presentation1. Introduction2. Literature review3. Data description4. Fatal crash data analysis5. Conclusions6. Recommendations
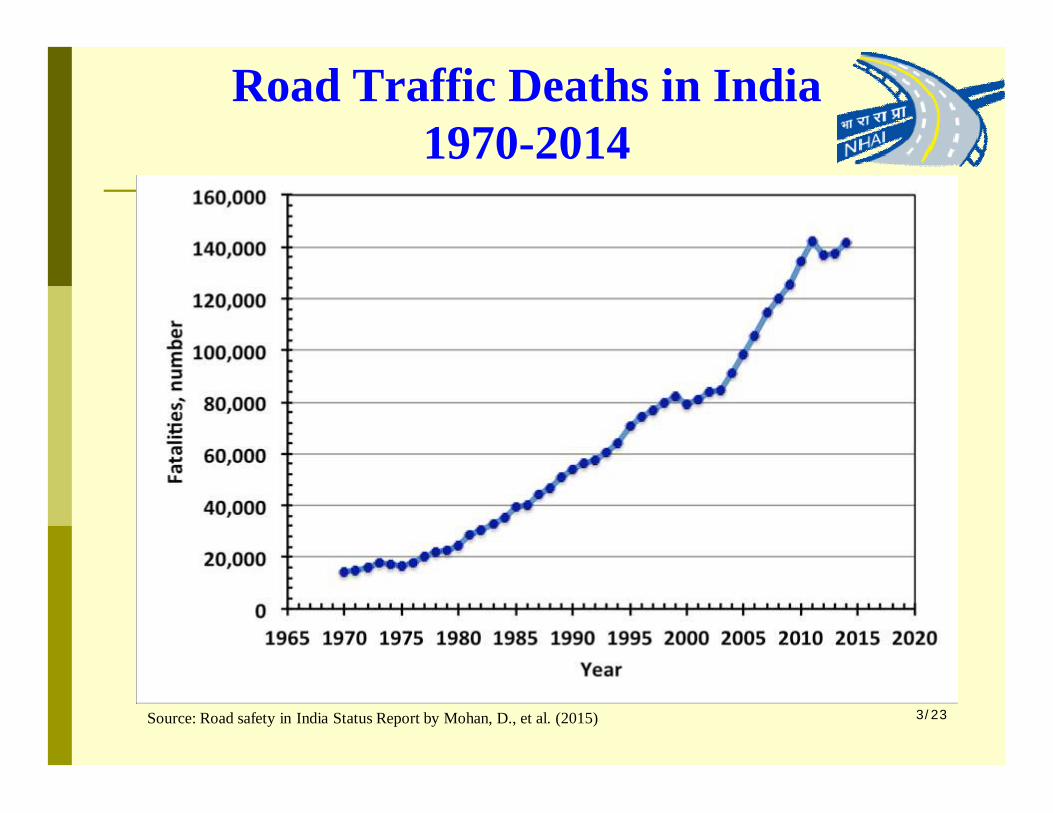
Road Traffic Deaths in India 1970-2014
3/23Source: Road safety in India Status Report by Mohan, D., et al. (2015)
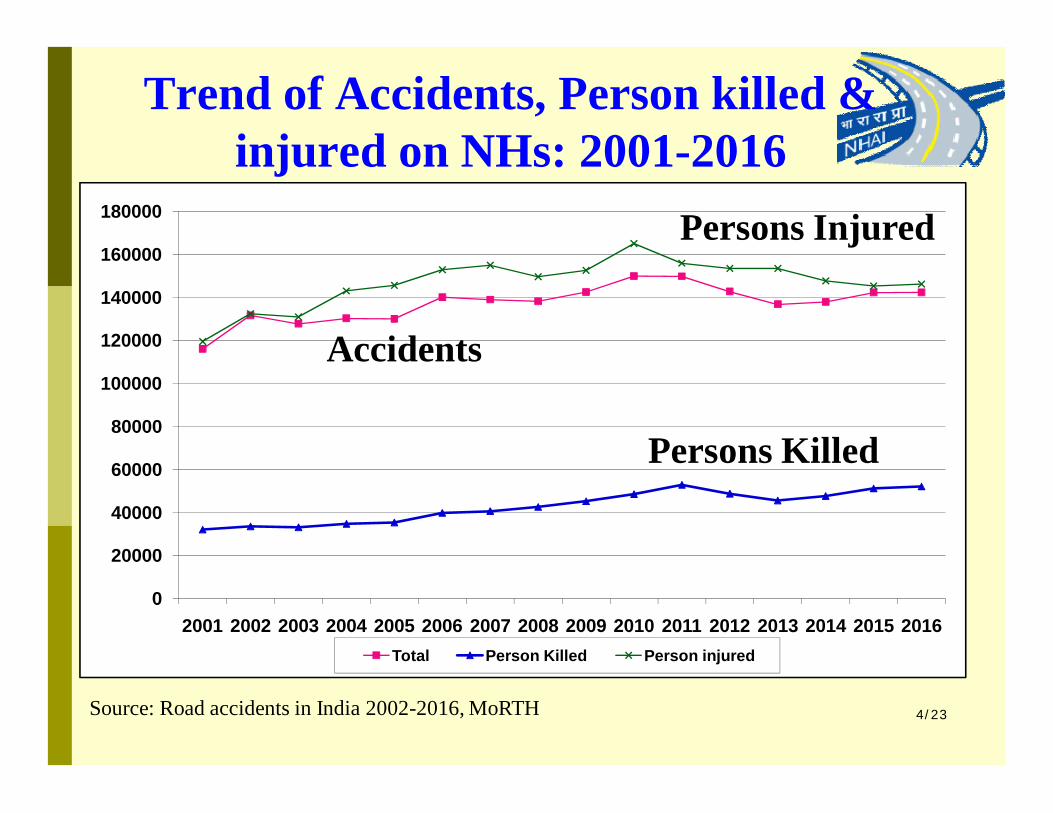
Trend of Accidents, Person killed &injured on NHs: 2001-2016
4/23
0
20000
40000
60000
80000
100000
120000
140000
160000
180000
2001 2002 2003 2004 2005 2006 2007 2008 2009 2010 2011 2012 2013 2014 2015 2016Total Person Killed Person injured
Accidents
Persons Injured
Source: Road accidents in India 2002-2016, MoRTH
Persons Killed
Literature ReviewSalient findings of the research work on accident pattern and characteristics on NHs in India and abroad: (Vaishnav et al. 1997) study for two-lane NH-8B in Gujarat showed that
head-on collisions were observed highest (26%), trucks involved accidents (19%), pedestrian accidents (~14.4%) and accident density was found 1.10 accidents/km/year
(Chandra and Bhuyan 2004) study for two-lane roads in UP & Uttarakhandshowed heavy vehicles (trucks/bus) were involved in almost 21% and pedestrians in 16% of accidents, followed by two-wheelers (17.8%), cars and pedestrians (16.4% each).
Owing large share of accidents on NHs and absence of comprehensive research on accidents on NHs in India, there is an urgent need to carry out comprehensive accident analysis on NHs.
5/23
National Highways Sections In this study, author has examined and compares
fatal road accidents pattern and characteristics two-lane section of NH-8 namely, from Beawar to Gomti
chouraha in Rajasthan for the period 2008-2012, four-lane section of NH-24 (Delhi border to Masoori in
Uttar Pradesh) during 2010-2013, and, six-lane section of NH-1 (from Delhi border to Panipat
border in Haryana) for the period 2009-2013.
6/23
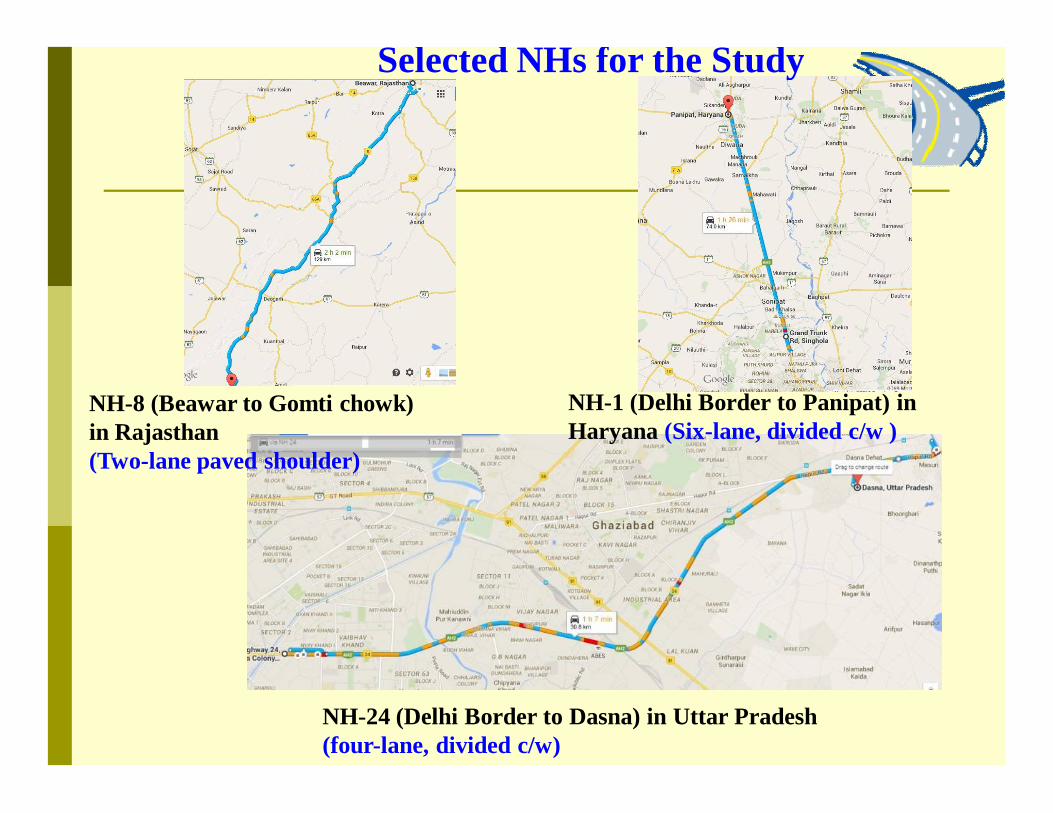
NH-8 (Beawar to Gomti chowk) in Rajasthan (Two-lane paved shoulder)
NH-1 (Delhi Border to Panipat) in Haryana (Six-lane, divided c/w )
NH-24 (Delhi Border to Dasna) in Uttar Pradesh (four-lane, divided c/w)
Selected NHs for the Study
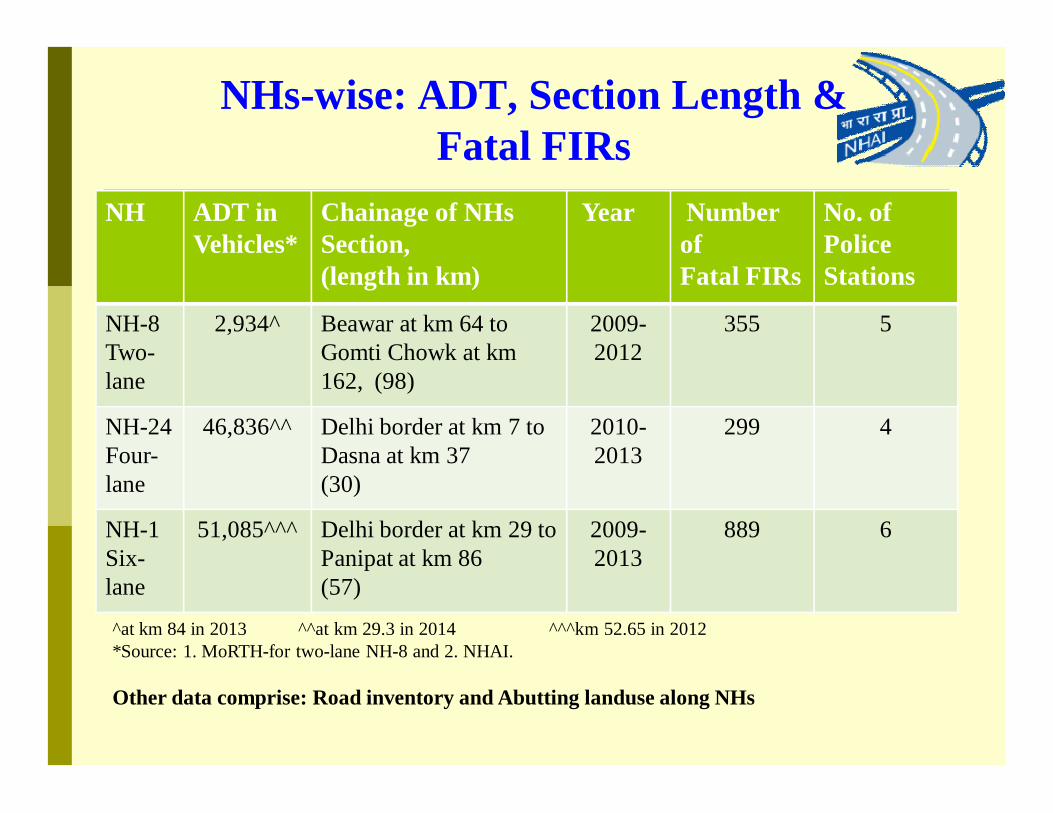
NHs-wise: ADT, Section Length & Fatal FIRs
NH ADT inVehicles*
Chainage of NHs Section, (length in km)
Year Number ofFatal FIRs
No. of PoliceStations
NH-8Two-lane
2,934^ Beawar at km 64 to Gomti Chowk at km 162, (98)
2009-2012
355 5
NH-24Four-lane
46,836^^ Delhi border at km 7 to Dasna at km 37(30)
2010-2013
299 4
NH-1Six-lane
51,085^^^ Delhi border at km 29 to Panipat at km 86(57)
2009-2013
889 6
^at km 84 in 2013 ^^at km 29.3 in 2014 ^^^km 52.65 in 2012*Source: 1. MoRTH-for two-lane NH-8 and 2. NHAI.
Other data comprise: Road inventory and Abutting landuse along NHs
Fatal Crash Data Analysis
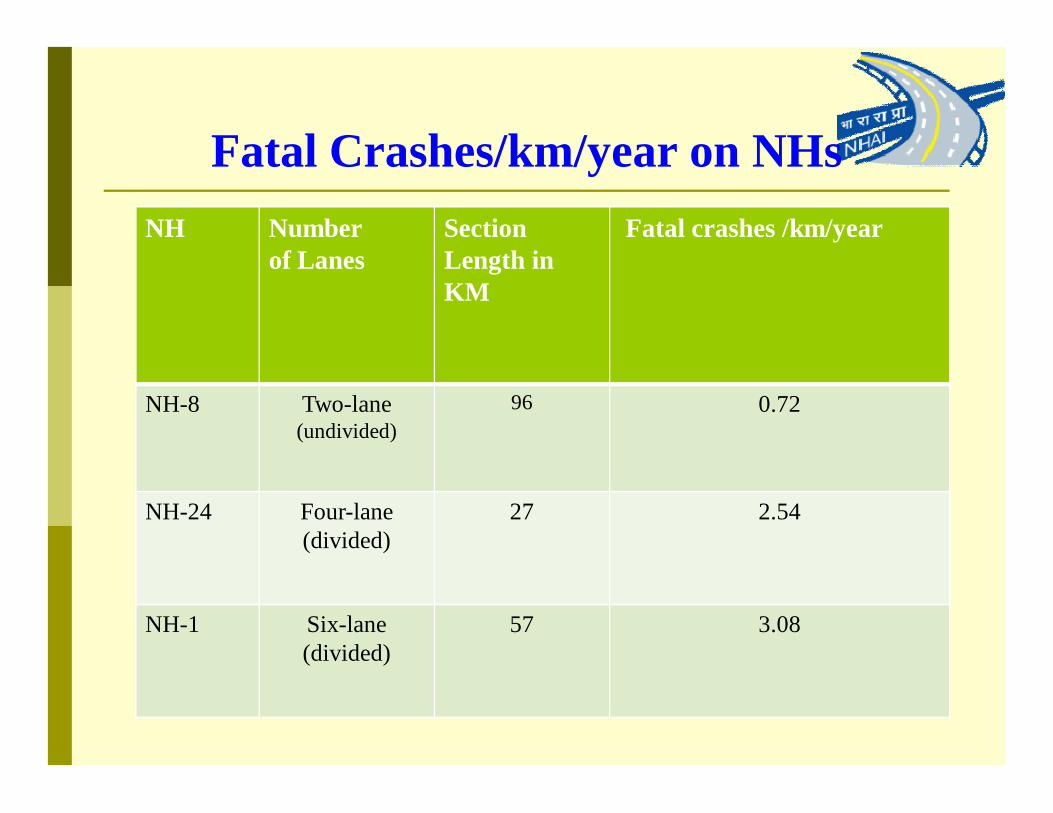
Fatal Crashes/km/year on NHsNH Number
of LanesSection Length in KM
Fatal crashes /km/year
NH-8 Two-lane(undivided)
96 0.72
NH-24 Four-lane(divided)
27 2.54
NH-1 Six-lane(divided)
57 3.08
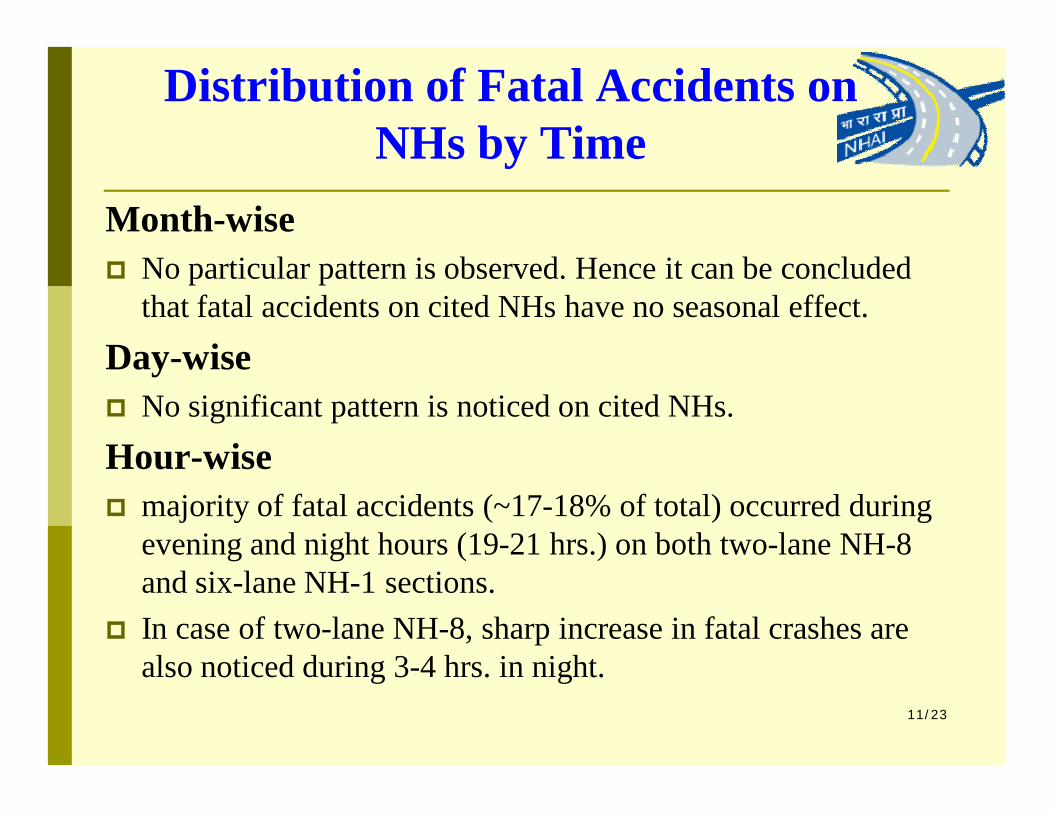
Distribution of Fatal Accidents on NHs by Time
Month-wise No particular pattern is observed. Hence it can be concluded
that fatal accidents on cited NHs have no seasonal effect.Day-wise No significant pattern is noticed on cited NHs.Hour-wise majority of fatal accidents (~17-18% of total) occurred during
evening and night hours (19-21 hrs.) on both two-lane NH-8 and six-lane NH-1 sections.
In case of two-lane NH-8, sharp increase in fatal crashes are also noticed during 3-4 hrs. in night.
11/23
Inferences: Poor visibility during evening and night hours on
two-lane NH-8 and six-lane NH-1 could be the possible reason for increase in accidents apart from other factors such as driver fatigue and drink-driving in the evening.
Naqvi H. M. 12/23
Distribution of Fatal Accidents on NHs by Time
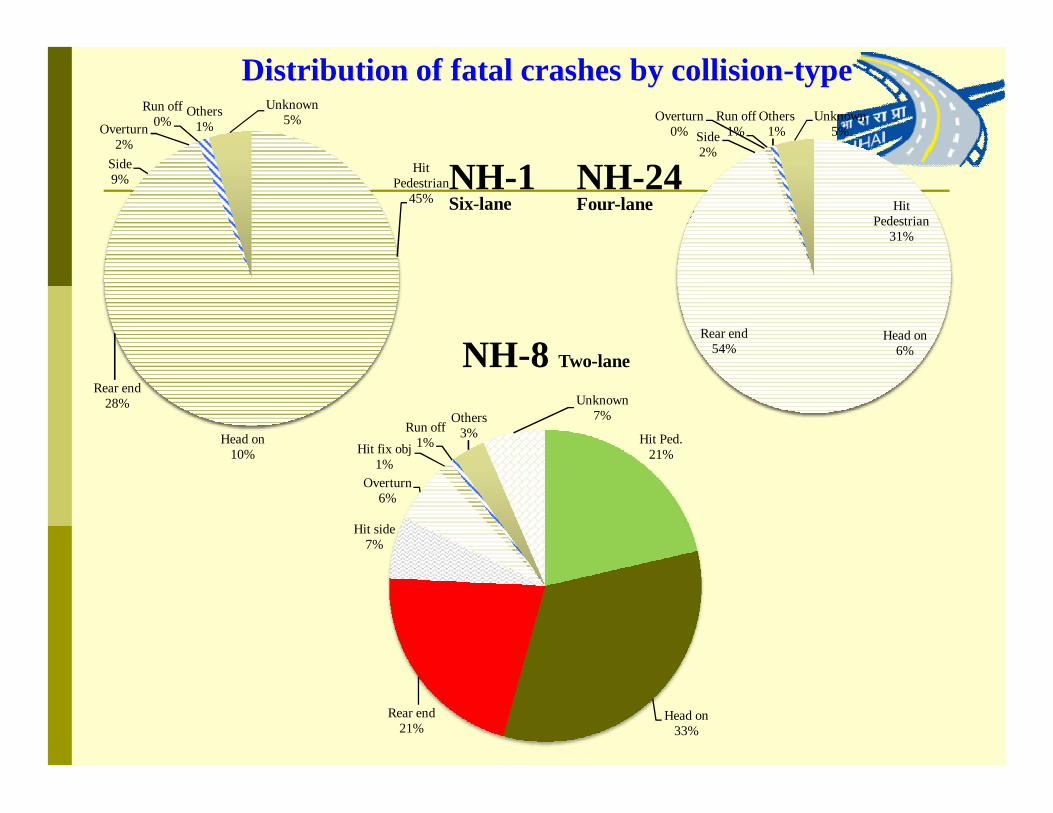
Hit Pedestrian
45%
Head on10%
Rear end28%
Side9%
Overturn2%
Run off0%
Others1%
Unknown5%
Hit Pedestrian
31%
Head on6%
Rear end54%
Side2%
Overturn0%
Run off1%
Others1%
Unknown5%
Hit Ped.21%
Head on33%
Rear end21%
Hit side7%
Overturn6%
Hit fix obj1%
Run off1%
Others3%
Unknown7%
NH-1 NH-24
NH-8 Two-lane
Six-lane Four-lane
Distribution of fatal crashes by collision-type
Inferences Highest share of “head-on” collision on two-lane NH-8
section: in line with the general trend of accidents for two-lane NHs (without median).
Rear-end collisions are observed on NH-8, NH-24 and NH-1 sections mainly due to parking of vehicles on highway to do minor repair or change of tyres, etc. without using parking indicators or other warning signals.
On six-lane NH-1, high share of “hit pedestrians” were mainly due to adjoining residential/commercial development along NH.
14/23
Distribution of Fatal Crashes by Collision-type
15/25
Victims’ Vehicle
Striking VehicleTruck Bus Car Three-
wheelerMotorcycle
Tractor Other vehicle
Unkno-wn
Total
Truck 19.0 (72.7)
6.3 (2.3)
1.6 (2.3)
0.0(0.0)
0.0(0.0)
0.0(0.0)
27.0(22.7)
0.0(0.0)
12.5(100)
Bus 4.2 (50.0)
0.0 (0.0)
0.0 (0.0)
0.0(0.0)
0.0(0.0)
4.6(7.1)
16.2(42.8)
0.0(0.0)
4.0(100)
Car 17.9 (62.5)
12.5 (4.2)
8.2 (10.4)
0.0(0.0)
0.0(0.0)
0.0(0.0)
18.9 (14.6)
13.8 (8.3)
13.6(100)
Three-wheeler
4.2 (38.9)
12.5 (11.1)
3.3 (11.1)
0.0(0.0)
0.0(0.0)
9.1(11.1)
13.5(27.8)
0.0(0.0)
5.1(100)
Motorcycle 38.7(43.9)
43.8(4.7)
50.8(20.9)
33.3(0.7)
58.8(6.8)
40.9(6.1)
24.3 (6.1)
55.2(10.8)
41.9(100)
Tractor 0.6 (100.0)
0.0 (0.0)
0.0(0.0)
0.0(0.0)
0.0(0.0)
0.0(0.0)
0.0(0.0)
0.0(0.0)
0.3(100)
Bicycle 1.8 (37.5)
0.0(0.0)
3.3 (25.0)
0.0(0.0)
5.9 (12.5)
4.5(12.5)
0.0(0.0)
3.5 (12.5)
2.3(100)
Pedestrian 13.7 (32.4)
25 (5.6)
31.2(26.8)
66.7(2.8)
35.3(8.4)
40.9(12.7)
0.0(0.0)
27.6 (11.3)
20.1(100)
Other vehicle
0.0 (0.0)
0.0 (0.0)
1.6(100.0)
0.0(0.0)
0.0(0.0)
0.0(0.0)
0.0(0.0)
0.0(0.0)
0.3(100)
Total 100(47.6)
100(4.5)
100(17.3)
100(0.8)
100(4.8)
100(6.2)
100(10.5)
100(8.2)
100.0(100)
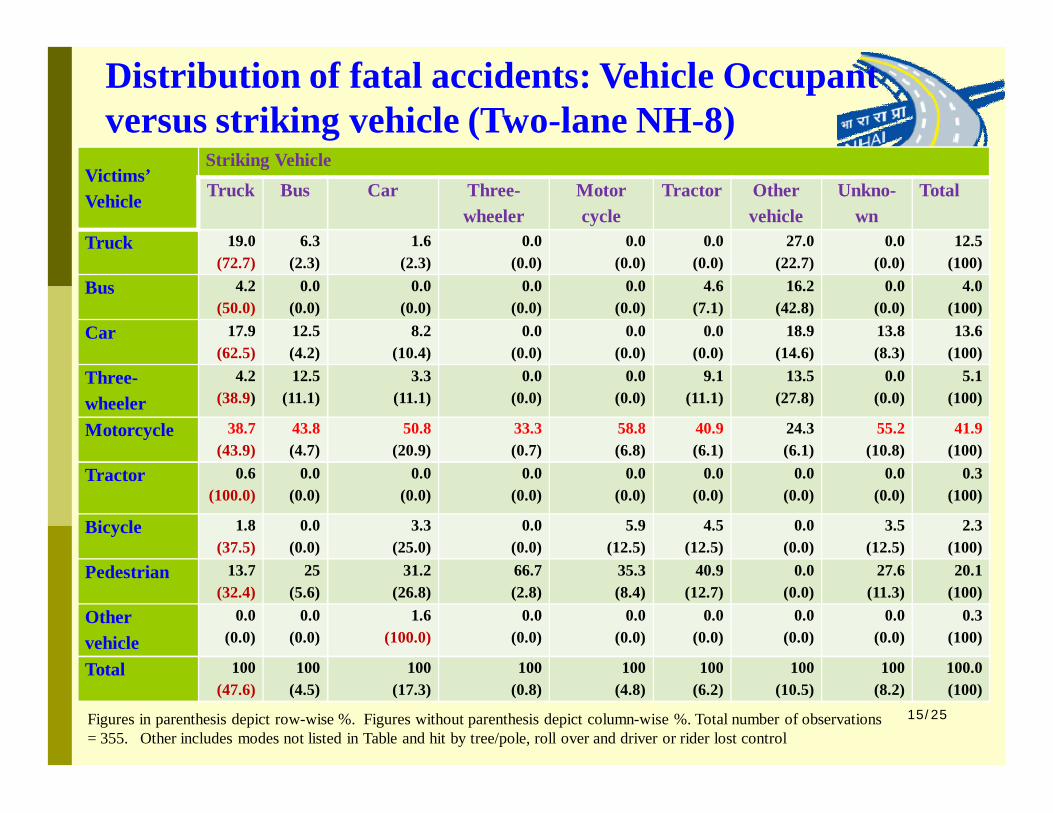
Distribution of fatal accidents: Vehicle Occupant versus striking vehicle (Two-lane NH-8)
Figures in parenthesis depict row-wise %. Figures without parenthesis depict column-wise %. Total number of observations = 355. Other includes modes not listed in Table and hit by tree/pole, roll over and driver or rider lost control
Naqvi H. M. 16/25
Victims’ Vehicle
Striking VehicleTruck Bus Car Three-wheeler Motor-
cycleTractor Other
vehicleUnknown Total
Truck6.8
(83.3)6.1
(11.1)0.0
(0.0)0.0
(0.0)0.0
(0.0)0.0
(0.0)0.0
(0.0)1.4
(5.6)4.4
(100)
Bus1.4
(33.3)0.0
(0.0)0.0
(0.0)0.0
(0.0)0.0
(0.0)21.4
(33.3)100
(33.3)0.0
(0.0)2.2
(100)
Car11.3
(75.8)6.1
(6.1)7.7
(9.1)0.0
(0.0)0.0
(0.0)0.0
(0.0)0.0
(0.0)4.1
(9.1)8.0
(100)
Three-wheeler
6.8 (71.4)
0.0 (0.0)
7.7(14.3)
0.0(0.0)
0.0(0.0)
0.0 (0.0)
0.0(0.0)
4.1 (14.3)
5.1(100)
Motorcycle42.5
(52.2)54.5
(10.0)41.0(8.9)
40.0(3.3)
50.0(3.3)
57.1(4.4)
0.0(0.0)
43.2(17.8)
43.8(100)
Tractor0.0
(0.0)9.1
(100.0)0.0
(0.0)0.0
(0.0)0.0
(0.0)0.0
(0.0)0.0
(0.0)0.0
(0.0)0.7
(100)
Bicycle6.3
(63.6)6.1
(9.1)0.0
(0.0)6.7
(4.5)8.3
(4.5)7.1
(4.5)0.0
(0.0)4.1
(13.6)5.4
(100)
Pedestrian19.9
(39.3)18.2 (5.4)
43.6(15.2)
53.3(7.1)
41.7(4.5)
14.3 (1.8)
0.0 (0.0)
40.5 (26.8)
27.3(100)
Other vehicle
4.5 (100.0)
0.0(0.0)
0.0(0.0)
0.0(0.0)
0.0(0.0)
0.0(0.0)
0.0(0.0)
0.0(0.0)
2.4(100)
Unknown0.5
(33.3)0.0
(0.0)0.0
(0.0)0.0
(0.0)0.0
(0.0)0.0
(0.0)0.0
(0.0)2.7
(66.7)0.7
(100)
Total100
(53.8)100
(8.0)100
(9.5)100
(3.6)100
(2.9)100
(3.4)100
(0.7)100
(18.0)100
(100)
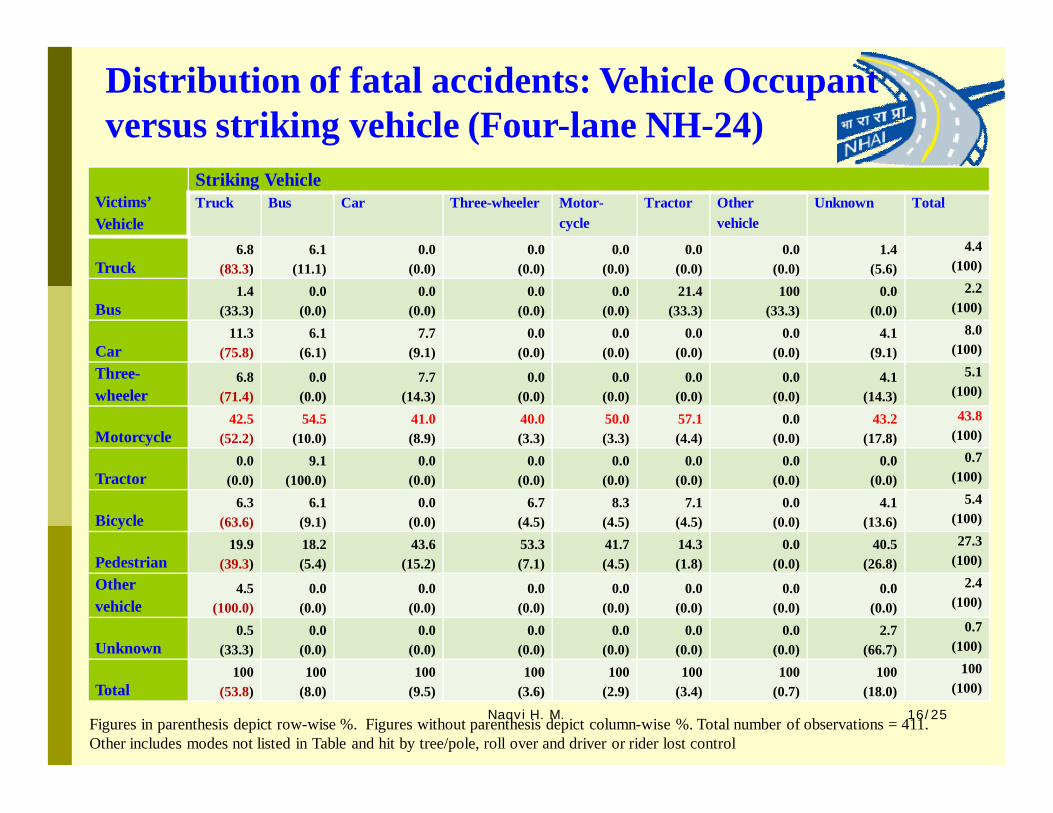
Distribution of fatal accidents: Vehicle Occupant versus striking vehicle (Four-lane NH-24)
Figures in parenthesis depict row-wise %. Figures without parenthesis depict column-wise %. Total number of observations = 411. Other includes modes not listed in Table and hit by tree/pole, roll over and driver or rider lost control
17/25
Victim’s Vehicle
Striking VehicleTruck Bus Car Three-
wheelerMotorcycle
Tractor Other Unknown Total
Truck 55.8(98.1)
6.1 (0.4)
0.0(0.0)
0.0(0.0)
16.7 (0.8)
4.0 (0.2)
14.3 (0.2)
1.2 (0.2)
41.2(100)
Bus 0.5 (100.0)
0.0(0.0)
0.0(0.0)
0.0 (0.0)
0.0(0.0)
0.0 (0.0)
0.0(0.0)
0.0(0.0)
0.3(100)
Car 5.0 (60.9)
12.1 (5.8)
5.6 (11.6)
50.0 (4.3)
0.0(0.0)
24.0 (8.7)
0.0 (0.0)
7.1 (8.7)
5.9(100)
Three-wheeler
3.5 (57.7)
9.1 (5.8)
7.0(19.2)
0.0 (0.0)
4.2 (1.9)
8.0(3.8)
42.9(5.8)
3.6 (5.8)
4.4(100)
Motorcycle 5.1 (37.1)
18.2 (5.2)
30.1 (37.1)
16.7 (0.9)
25.0(5.2)
28.0(6.0)
42.9 (2.6)
8.3(6.0)
9.9(100)
Tractor 0.6 (55.6)
0.0(0.0)
2.1 (33.3)
0.0 (0.0)
4.2 (11.1)
0.0 (0.0)
0.0(0.0)
0.0 (0.0)
0.8(100)
Bicycle 1.5 (38.2)
6.1 (5.9)
8.4 (35.3)
0.0 (0.0)
12.5 (8.8)
12.0(8.8)
0.0 (0.0)
1.2 (2.9)
2.9(100)
Pedestrian 27.9 (59.4)
48.5(4.0)
45.5 (16.3)
33.3 (0.5)
37.5(2.3)
24.0(1.5)
0.0 (0.0)
76.2(16.0)
34.1(100)
Other vehicle
0.1 (20.0)
0.0 (0.0)
1.4 (40.0)
0.0 (0.0)
0.0 (0.0)
0.0 (0.0)
0.0 (0.0)
2.4 (40.0)
0.3(100)
Total 100 (72.5)
100 (2.8)
100 (12.2)
100 (0.5)
100 (2.1)
100 (2.1)
100 (0.6)
100 (7.2)
100(100)
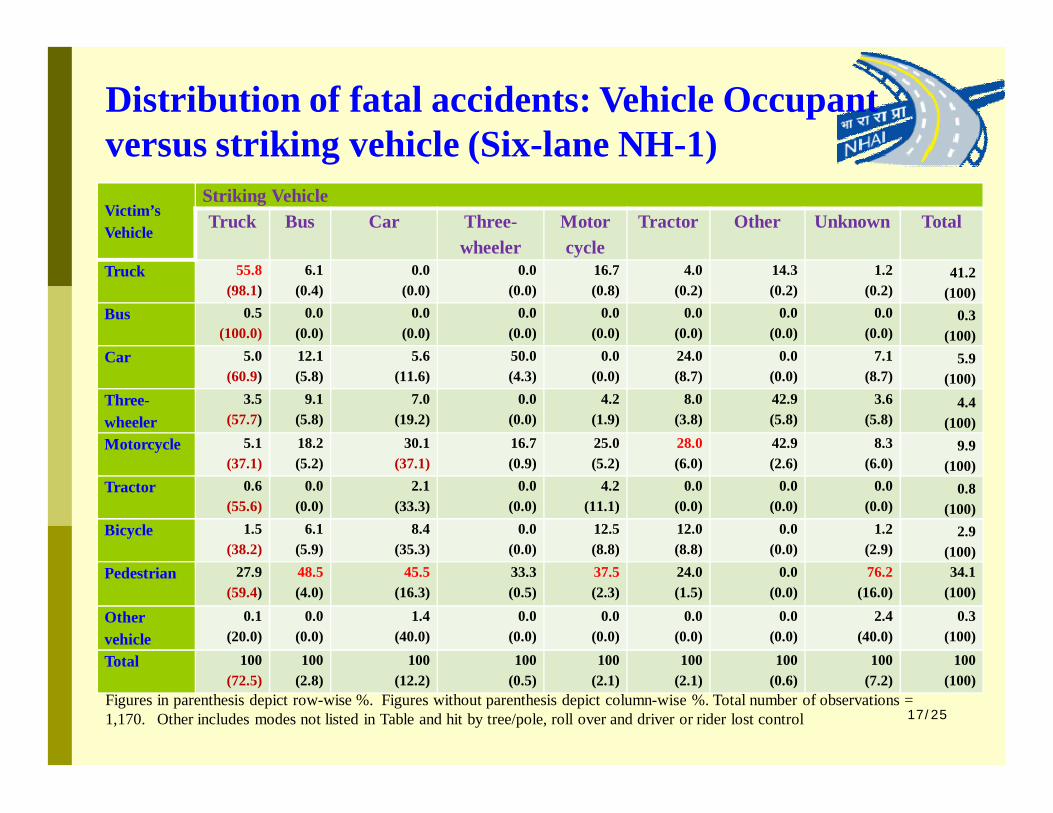
Distribution of fatal accidents: Vehicle Occupant versus striking vehicle (Six-lane NH-1)
Figures in parenthesis depict row-wise %. Figures without parenthesis depict column-wise %. Total number of observations = 1,170. Other includes modes not listed in Table and hit by tree/pole, roll over and driver or rider lost control

ConclusionsTwo-lane NH-8 Trucks (Multi Axle Vehicle and standard truck) constitute highest share
(46%) of total traffic, followed by car (30%) and LCV (7%). “Head-on” collisions (33%) were observed to be highest, followed by
“rear-end” i.e. 21% and “hit pedestrian” i.e. 21% of total fatal accidents. In 47% of total fatal accidents on two-lane NH-8 section, trucks (both
multi-axle and 2-axle) struck victims of other modes including pedestrians, and followed by car (17%).
Four-lane NH-24 “Rear-end” collisions (54%) were observed to be highest, followed by “Hit
pedestrian” i.e. 31% and “head on” i.e. 6% of total fatal accidents. On four-lane NH-24, % share of striking vehicle as truck in fatal crash
against the respective victims’ vehicle namely, motorcycle is observed to be highest (43%), followed by pedestrian (20%) and car (11%).
18/23
Six-lane NH-1 Highest share of cars (57%) and multi-axle vehicles
(15%) were observed. Highest number of collisions were observed as “hit
pedestrian” i.e. 45%, followed by “rear-end” i.e. 21% and “head on” i.e. 10%.
72% of total fatal accidents trucks (both multi-axle and 2-axle) struck victims of other modes including pedestrians, followed by car (12%) and unknown (7%) and tractor/motorcycle (2.1%).
Naqvi H. M. 19/23
Conclusions – contd.
Recommendations Owing to heterogeneous traffic (heavy versus light modes and fast versus
slow moving modes) movement on cited NHs and number of abutting access roads (cross roads) catering to local traffic, suitable traffic calming measures are recommended at junctions or NHs
sections having heaving abutting land use. to designate lanes for light and heavy vehicles through gantry/overhead signs
boards Highway police should discourage on-street parking of vehicles on
highways near dhabhas, vehicle garage(s), etc. to reduce rear-end collisions.
short/medium-term remedial measures for vulnerable modes of transport including pedestrians moving along and across
long-term remedial measures such as vehicular underpass, service roads, flyover, etc. based on the accident study
Naqvi H. M. 20/23