Embed Size (px)
Citation preview

ISSN 1608-7143
OECD Journal on Budgeting
Volume 7 – No. 1
© OECD 2007
Comparing Budget and Accounting Measures of the Federal Government’s Fiscal Condition
byThe Congressional Budget Office*
This paper by the Congressional Budget Office examines two reportson fiscal policy in the United States: the budget and the government’sfinancial statements. The reports differ in concept and scope. Neitherprovides all of the relevant information about federal finances, buttogether they offer a more comprehensive perspective on the fiscalimplications of present policies.
* This article was originally published in December 2006 by the Congressional BudgetOffice of the United States Congress, available at www.cbo.gov.
1

COMPARING BUDGET AND ACCOUNTING MEASURES OF THE FEDERAL GOVERNMENT’S FISCAL CONDITION
Preface, signed by Donald B. Marron, Acting Director, Congressional Budget Office
This Congressional Budget Office (CBO) paper, prepared at the request ofthe Chairman and Ranking Member of the Senate Budget Committee, examinestwo reports on fiscal policy: the budget and the government’s financialstatements. The reports differ in concept and scope. Neither provides all of therelevant information about federal finances, and together they offer a morecomprehensive perspective on the fiscal implications of present policies. Inkeeping with CBO’s mandate to provide objective, impartial analysis, the papermakes no recommendations.
David Torregrosa wrote the paper under the direction of Robert Dennisand Marvin Phaup. Andrew Gisselquist assisted with the preparation of thefigures, and Linda Lewis Harris assisted with the preparation of the tables.
Edward (Sandy) Davis, Peter Fontaine, Mark Hadley, Jeffrey Holland, ArleneHolen, Wendy Kiska, Noah Meyerson, John Sabelhaus, and Robert Sunshine ofCBO provided useful suggestions. So did Wendy Comes, Richard Fontenrose,and Eileen Parlow of the Federal Accounting Standards Advisory Board;Robert B. Anderson, Audrey Duchesne, Patrick Locke, Justine F. Rodriguez,and Arthur Stigile of the Office of Management and Budget; Ron Feldman ofthe Federal Reserve Bank of Minneapolis; and Allan Lund, formerly of theDepartment of the Treasury. The assistance of external reviewers implies noresponsibility for the final product, which rests solely with CBO.
John Skeen edited the paper. Maureen Costantino took the photographfor the cover and prepared the paper for publication, and Lenny Skutnikproduced the printed copies.
1. Summary and introduction1
The federal government issues two different reports of its fiscalperformance: the budget and the Financial Report of the United States
Government. Both contain useful information for policy makers, and takentogether they provide a richer perspective than can be obtained from eitherreport singly. But to make best use of the reports, it is important to understandtheir differences and the strengths and limitations of each.
The federal budget largely measures cash flows in and out of the USTreasury and, for the most part, reports those cash flows in the year in whichthey occur. The financial report, by contrast, primarily uses an accrual basis of
OECD JOURNAL ON BUDGETING – VOLUME 7 – No. 1 – ISSN 1608-7143 – © OECD 20072

COMPARING BUDGET AND ACCOUNTING MEASURES OF THE FEDERAL GOVERNMENT’S FISCAL CONDITION
accounting to measure assets, liabilities, revenues, and expenses.2 Theprincipal difference between cash and accrual accounting is the timing ofrecognition. An accrual system generally recognises transactions when aneconomic event occurs rather than when the resulting cash flows take place.
The differences between cash and accrual measures are particularlyevident in presentations of retirement benefits for federal employees and offederal insurance programmes and in the treatment of the federal government’scapital investments:
● The federal budget reports outlays for pension and health benefits to retiredfederal civilian and military personnel when those payments are made. Incontrast, the financial statements report an operating expense for theestimated cost of retirement benefits when those benefits are earned.
● The budget reports payments for federally insured losses when thegovernment pays the claims.3 In contrast, the financial report records asoperating expenses any new insurance claims that are received during theyear regardless of when they will be paid.
● The budget reports expenditures on capital investments – property, plant,and equipment – as outlays. In contrast, the financial statements reportthose expenditures as an exchange of assets on the government’s balancesheet and report the associated depreciation expense of those assets as anannual operating cost.
Because of differences in the timing of the recognition of costs, the summarymeasures of the budget and the financial statements differ significantly from oneanother. In 2005, the budget recorded a deficit – the amount by which totaloutlays exceeded total revenues – of USD 319 billion.4 The financial report’s netoperating cost – the excess of the cost of operations over revenues – for 2005 wasUSD 760 billion. That difference resulted largely from increases in retirementliabilities that are reflected in the net operating cost but not in the budget figure.
The budget and the financial report serve different and complementarypurposes. The President and the Congress use the budget to set spending and taxpriorities. It reports actual cash inflows and outflows for past years and estimatesfor the current and future years, and it is organised by function and agency.Financial reporting explains changes in the government’s financial positionbased on an accrual-based balance sheet and operating statement. Financialreporting also assists in demonstrating accountability to taxpayers for moneyraised and expenses incurred through its requirements for agencies to preparefinancial reports that are then audited, together with internal accounting andadministrative controls. Like the budget, the financial statements largely describewhat has already happened, but in comparison, they are more forward-looking inthat they reflect the liabilities for some cash flows that will show up in the budgetin later years.
OECD JOURNAL ON BUDGETING – VOLUME 7 – No. 1 – ISSN 1608-7143 – © OECD 2007 3

COMPARING BUDGET AND ACCOUNTING MEASURES OF THE FEDERAL GOVERNMENT’S FISCAL CONDITION
The federal government has reported consolidated budget information for atleast 85 years (since the enactment of the Budget and Accounting Act of 1921); incontrast, the financial reports have been used for only about 10 years. The firstaudited financial statement for the United States was issued by the Departmentof the Treasury in 1997, so it is a work in progress. A comprehensive set ofaccounting standards is still being developed (and revised).
2. The budgetThe federal budget is the basic tool used by the President and the
Congress to set the government’s fiscal policy. It focuses on revenues andoutlays – generally the cash flows that occur with the collection of taxes andother forms of federal income, and the disbursement of funds for variousfederal programmes and activities. Each year, the President transmits to theCongress a proposed budget, which provides historical budget data, estimatesof revenues and outlays under current law, and the projected impact of theAdministration’s proposals for the current and future fiscal years. (Recentbudgets have provided detailed estimates spanning the next five years andsome information for the subsequent five years.) Spending in the budget isdivided into thousands of individual budget accounts, which determine thepurposes for which money can be spent by government agencies. Thatinformation, along with similar estimates prepared by the CongressionalBudget Office (CBO), is used in policy deliberations by the Congress, whichusually adopts a budget plan in the form of a congressional budget resolution.The Congress implements and enforces its budget plan by measuring theimpact of subsequent legislation relative to the amounts specified in thebudget resolution. Ultimately, the surplus or deficit in any year is the result ofthe spending that occurs and the revenues that are collected under existinglaw, as well as the effects of new legislation.
Budget rules and practices have a variety of sources. For example, theconcept of a single, unified budget was a key recommendation of theOctober 1967 Report of the President’s Commission on Budget Concepts, whichremains influential today. The Office of Management and Budget’s (OMB’s)Circular No. A-11 provides detailed guidance to agencies on preparing andsubmitting their budgets. The Congressional Budget and ImpoundmentControl Act of 1974 governs much of the congressional budget process.5 Itestablishes the procedures by which the Congress determines its annualbudgetary priorities and then implements and enforces them through thelegislative process.
2.1. Budget measures
Although the budget is mostly on a cash basis, in some cases it counts asoutlays amounts that are obligated now but will be paid or received in the
OECD JOURNAL ON BUDGETING – VOLUME 7 – No. 1 – ISSN 1608-7143 – © OECD 20074

COMPARING BUDGET AND ACCOUNTING MEASURES OF THE FEDERAL GOVERNMENT’S FISCAL CONDITION
future – that is, some programmes or activities are reported on an accrualbasis. The most significant of those are credit programmes and interest on thepublic debt:
● The Federal Credit Reform Act of 1990 requires the present value of expectedfuture cash flows from new direct loans and loan guarantees to be recognisedin the budget when the loans are disbursed rather than over the life of theloans.6 That approach was intended to place those credit programmes on amore equal footing with one another and with other programmes in thebudget. The financial statements have also adopted that approach for creditprogrammes.
● Interest on federal debt is also included in the budget as an outlay when theexpense is incurred rather than when it is paid. Most debt requires periodicinterest payments, so over the course of a year, accruing interest costs isusually not substantially different from reporting interest on a cash basis.But in instances in which interest payments are deferred – as with Treasurysavings bonds, other zero-coupon debt7 and Treasury Inflation-ProtectedSecurities (TIPS) – the timing differences can be significant.
The budget’s summary measures include total receipts, total outlays, andthe difference, which is the surplus or deficit.8, 9 In 2005, the budget deficitwas USD 319 billion, or 2.6 per cent of gross domestic product (GDP) (seeTable 1 and Figure 1).10
When the government spends more than it collects, it must borrow fromthe public. If it collects more than it spends, it reduces the debt. In general,government debt held by the public is the cumulative sum of budgetaryimbalances over time – that is, the sum of all past budget surpluses and deficitsadjusted for small changes in other sources of financing.11 At the end offiscal year 2005, that debt totaled USD 4.6 trillion, or 37.4 per cent of GDP (seeFigure 2).12
Table 1. The federal government’s budget surplus or deficit and net operating cost
Billions of US dollars
1995 1996 1997 1998 1999 2000 2001 2002 2003 2004 2005
Budget surplus or deficit (–) –164 –107 –22 69 126 236 128 –158 –378 –413 –319
Net operating cost –255 –198 –3 –110 101 53 –515 –365 –668 –616 –760
Difference 91 91 –19 179 25 183 643 207 290 203 441
Note: The Department of the Treasury published the first audited financial statements in 1997; datafor 1995 and 1996 are from prototype reports.Source: Congressional Budget Office based in part on data from the Department of the Treasury,Financial Report of the United States Government (1995 to 2005).
OECD JOURNAL ON BUDGETING – VOLUME 7 – No. 1 – ISSN 1608-7143 – © OECD 2007 5

COMPARING BUDGET AND ACCOUNTING MEASURES OF THE FEDERAL GOVERNMENT’S FISCAL CONDITION
Figure 1. The budget surplus or deficit and net operating costPercentage of gross domestic product
Note: The Department of the Treasury began publishing audited financial statements in 1997; datafor 1995 and 1996 are from prototype reports.
Source: Congressional Budget Office based in part on data from the Department of the Treasury,Financial Report of the United States Government (1995 to 2005).
Figure 2. The federal government’s debt, assets, liabilities, and net positionPercentage of gross domestic product
Note: The Department of the Treasury began publishing audited financial statements in 1997; datafor 1995 and 1996 are from prototype reports.
Source: Congressional Budget Office based in part on data from the Department of the Treasury,Financial Report of the United States Government (1995 to 2005).
���� ���� ���� ���� ���� � �� � ������
�
��
�
��
��
����������������������� ����������� ������
���� ���� ���� ���� ���� � �� � ������
�
�
�
�
�
�
�
�
!�"��#����"$��#����"��� %��"������� ������&�� ���������� '�����
OECD JOURNAL ON BUDGETING – VOLUME 7 – No. 1 – ISSN 1608-7143 – © OECD 20076

COMPARING BUDGET AND ACCOUNTING MEASURES OF THE FEDERAL GOVERNMENT’S FISCAL CONDITION
2.2. Long-term budget projections
To enable policy makers to see projected budgets over a longer planninghorizon, both OMB and CBO prepare long-term budget projections, includingsome with 50 to 100-year spans.13 Those projections are based on assumptionsabout the continuation of current laws and policies; long-run rates of productivitygrowth and growth of the labour force; and alternative paths for several variables,including health care costs, spending on Social Security, and defence spending.
Long-term projections help to illustrate the uncertainty about the budgetbecause several factors that are difficult to predict – especially the growth ofhealth spending relative to overall GDP – have major implications for thebudget over time. Long-term projections can highlight that uncertainty byshowing outcomes under various assumptions for those variables. Also,long-term budget projections show the path of potential future fiscalimbalances, which is useful in identifying the timing for remedial policies.
3. The federal government’s financial statements
The Financial Report of the United States Government – like the financialstatements of private companies – consists of a balance sheet, an incomestatement, a cash flow statement, and notes to those financial statements. TheDepartment of the Treasury consolidates the financial reports of individualfederal agencies and now issues the government-wide report each December.
In particular, the consolidated report includes a balance sheet showingassets, liabilities, and net position (assets minus liabilities), and statements ofgovernment operations and changes in net position, showing revenues,expenses, and net operating cost (tax revenues minus the net cost of governmentoperations). Those statements follow accounting standards developed by theFederal Accounting Standards Advisory Board (FASAB) (see Box 1). The financialreport also includes numerous notes and substantial supplementary informationon long-term projections for social insurance programmes.14
3.1. The balance sheet
The Department of the Treasury’s government-wide balance sheetindicates the government’s financial position in terms of the assets it owns orcontrols as well as the liabilities it owes at the reporting date (see Table 2). Thelist of reportable assets and liabilities for the federal government depends onthe federal financial accounting standards as issued by FASAB. As noted, thosestandards are still in the process of being developed and, in some cases, revised.
Currently, the balance sheet includes as assets these categories of holdings:
● Property, plant, and equipment. This category includes buildings,structures, computer software, and other assets used to provide goodsand services. Items are reported at original cost minus accumulated
OECD JOURNAL ON BUDGETING – VOLUME 7 – No. 1 – ISSN 1608-7143 – © OECD 2007 7

COMPARING BUDGET AND ACCOUNTING MEASURES OF THE FEDERAL GOVERNMENT’S FISCAL CONDITION
ygh
lol
dll,t
)gedd
d,s.)dat,tet
yel
ynd
l
Box 1. The role of the Federal Accounting Standards Board
The Department of the Treasury, the Office of Management and Budget, and what is nowthe Government Accountability Office created the Federal Accounting Standards AdvisorBoard (FASAB) as a federal advisory committee in 1990 to develop federal accountinprinciples. FASAB’s three sponsors have authority under various laws to establisaccounting and financial reporting standards for the government.
Through a series of legislative acts, the Congress sought to improve the financiamanagement and accountability of the federal government by requiring agencies tproduce audited financial statements tied to performance reports. The Chief FinanciaOfficers Act of 1990 required some agencies to produce audited financial statements, anthe Government Management Reform Act of 1994 extended that requirement to aagencies and to government-wide, or consolidated, financial statements. In additionthe Government Performance and Results Act of 1993 required agencies to submiperformance reports comparing performance measures and related costs.
FASAB promulgates what are termed generally accepted accounting principles (GAAPfor the federal government.1 Its role is thus similar to that of the Financial AccountinStandards Board, which promulgates private-sector accounting standards, and thGovernmental Accounting Standards Board, which promulgates standards for state anlocal governments. FASAB’s standards and concepts affect only financial accounting anhave no effect on budgetary accounting.
FASAB must follow certain procedures before issuing final accounting standards. Proposestandards typically are first issued as “exposure drafts” in order to solicit public commentswhich come from the accounting community and federal agencies. (In some cases, proposalare first issued as “preliminary views” for public comment and then as exposure draftsStandards are issued only after a majority vote of the 10 members. Six of the 10 boarmembers are now from outside the federal government because independence is requirement of FASAB’s status as a GAAP-setting body. Two of the three founding governmenmembers, the Office of Management and Budget and the Government Accountability Officeeffectively retain veto power over standards because the heads of those agencies may preventhe issuance of a standard by objecting during a 90-day review period. The Department of thTreasury voluntarily gave up that power. In addition to the three founding governmenmembers, a representative from the Congressional Budget Office sits on the board.
FASAB continues to issue new accounting standards – most recently for fiduciaractivities, which cover reporting on the Indian trust funds.2 Its current projects includstatements for federal oil and natural gas resources, and revisions to accounting for sociainsurance. FASAB also issues concept statements, which are lower in the GAAP hierarchthan standards. For example, FASAB recently issued a draft concept statement oproposed new definitions of assets and liabilities. Finally, FASAB issues interpretations anguidance on existing accounting standards, and white papers.
1. The American Institute of Certified Public Accountants designated FASAB as a GAAP-setting body in 1999.2. See Federal Accounting Standards Advisory Board, Accounting for Fiduciary Activities, Statement of Federa
Financial Accounting Standards 31, 24 October 2006, available at www.fasab.gov/pdffiles/sffas_31.pdf.
OECD JOURNAL ON BUDGETING – VOLUME 7 – No. 1 – ISSN 1608-7143 – © OECD 20078
COMPARING BUDGET AND ACCOUNTING MEASURES OF THE FEDERAL GOVERNMENT’S FISCAL CONDITION
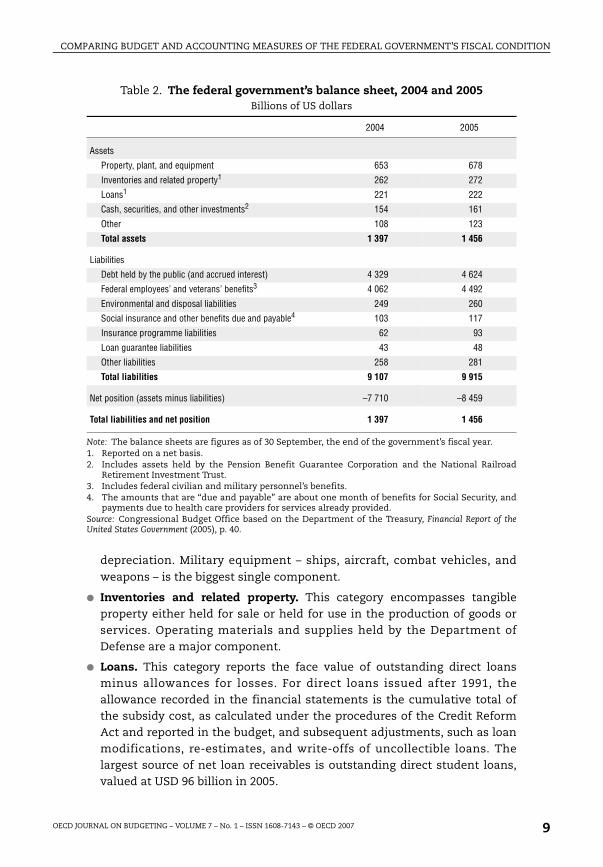
depreciation. Military equipment – ships, aircraft, combat vehicles, andweapons – is the biggest single component.
● Inventories and related property. This category encompasses tangibleproperty either held for sale or held for use in the production of goods orservices. Operating materials and supplies held by the Department ofDefense are a major component.
● Loans. This category reports the face value of outstanding direct loansminus allowances for losses. For direct loans issued after 1991, theallowance recorded in the financial statements is the cumulative total ofthe subsidy cost, as calculated under the procedures of the Credit ReformAct and reported in the budget, and subsequent adjustments, such as loanmodifications, re-estimates, and write-offs of uncollectible loans. Thelargest source of net loan receivables is outstanding direct student loans,valued at USD 96 billion in 2005.
Table 2. The federal government’s balance sheet, 2004 and 2005Billions of US dollars
2004 2005
Assets
Property, plant, and equipment 653 678
Inventories and related property1 262 272
Loans1 221 222
Cash, securities, and other investments2 154 161
Other 108 123
Total assets 1 397 1 456
Liabilities
Debt held by the public (and accrued interest) 4 329 4 624
Federal employees’ and veterans’ benefits3 4 062 4 492
Environmental and disposal liabilities 249 260
Social insurance and other benefits due and payable4 103 117
Insurance programme liabilities 62 93
Loan guarantee liabilities 43 48
Other liabilities 258 281
Total liabilities 9 107 9 915
Net position (assets minus liabilities) –7 710 –8 459
Total liabilities and net position 1 397 1 456
Note: The balance sheets are figures as of 30 September, the end of the government’s fiscal year.1. Reported on a net basis.2. Includes assets held by the Pension Benefit Guarantee Corporation and the National Railroad
Retirement Investment Trust.3. Includes federal civilian and military personnel’s benefits.4. The amounts that are “due and payable” are about one month of benefits for Social Security, and
payments due to health care providers for services already provided.Source: Congressional Budget Office based on the Department of the Treasury, Financial Report of theUnited States Government (2005), p. 40.
OECD JOURNAL ON BUDGETING – VOLUME 7 – No. 1 – ISSN 1608-7143 – © OECD 2007 9

COMPARING BUDGET AND ACCOUNTING MEASURES OF THE FEDERAL GOVERNMENT’S FISCAL CONDITION
● Cash, securities, and other investments. This category includes cashbalances, international monetary assets (including official reserves of foreigncurrency and gold), and securities held by the Pension Benefit GuarantyCorporation and the National Railroad Retirement Investment Trust.15
The balance sheet currently excludes the government’s vast holdings ofpublic lands and other natural resources because FASAB has tentativelyconcluded that the value of those resources cannot be reliably estimated.However, FASAB will soon propose reporting the value of federally owned oil andgas resources on the balance sheet, as measured by the expected stream ofroyalty payments to the government, and will consider adding other federalresources.16 The balance sheet also excludes the income expected from futuretaxes under current law. One consideration favouring that exclusion is theabsence of a legally enforceable claim to taxes until the taxable income is earned.
Six main categories of liabilities are recognised on the balance sheet:
● Debt held by the public (and accrued interest). This is federal debt held outsidethe government and excludes debt held by government trust funds. The largestitem on the balance sheet, this is a legal obligation of the government.
● Federal employees’ and veterans’ benefits. This category includes actuarialestimates of the present value of pension benefits and health care benefitsearned to date that are to be provided to federal civilian employees andmilitary personnel in their retirement and of compensation for disabledveterans and their survivors. Those benefits are the second largest liabilitieson the balance sheet. Although those benefits are not legal obligations of thegovernment and could be modified by future legislation, they are recognisedbecause they are part of the compensation costs for federal personnel – apractice consistent with the private sector’s.
● Environmental and disposal liabilities. This category includes the expectedcleanup costs of hazardous and radioactive wastes that the governmentgenerated and is required to remediate by law or regulation. Only costs forremediable conditions that can be reasonably estimated and cleaned upusing today’s technology are reported. Most of the liabilities are attributableto the Department of Energy – which is responsible for managing the cleanupof contamination caused by the production, storage, and disposal of nuclearweapons – and to the Department of Defense – which is responsible fordisposing of nuclear-powered vessels and cleaning up contamination atdefence sites.
● Social insurance and other benefits that are due and payable. This categoryincludes amounts for social insurance programmes, including Social Securityand Medicare, and other mandatory benefit programmes, including grants tostates for Medicaid. The amounts that are “due and payable” are about one
OECD JOURNAL ON BUDGETING – VOLUME 7 – No. 1 – ISSN 1608-7143 – © OECD 200710
COMPARING BUDGET AND ACCOUNTING MEASURES OF THE FEDERAL GOVERNMENT’S FISCAL CONDITION
month of benefits for Social Security, and payments due to health careproviders for services already provided. Those amounts are reported asliabilities because they are legal obligations of the government.
● Insurance programme liabilities. The balance sheet reports unpaid insuranceclaims that have already been incurred. At the end of 2005, the amountsincluded USD 70 billion in insurance liabilities for the Pension Benefit GuarantyCorporation and the Federal Emergency Management Agency’s estimate ofUSD 23 billion for the National Flood Insurance Program, mostly for claimsarising from Hurricane Katrina.
● Loan guarantee liabilities. The long-term cost of outstanding guaranteedloans is measured by the subsidy cost at disbursement, with adjustmentsfor modifications, re-estimates, amortisation, and write-offs. Guaranteedstudent loans constitute an estimated USD 30 billion in liabilities.
The balance sheet does not include the present value of future benefitpayments for Social Security and Medicare until they are due and payablebecause those anticipated payments for entitlements do not represent acurrent liability under existing accounting principles. Also excluded are futureoutlays for veterans’ health services because those services are provided onan “as available” basis, that is, subject to space limitations and annualappropriations. Nor does the balance sheet report contingent liabilities forexpected future losses on risks assumed in federal insurance programmes.Those amounts are disclosed in the notes to the financial statements.
At the end of fiscal year 2005 (30 September 2005), the government reportedliabilities in excess of assets, or a negative net position, of USD 8.5 trillion (or68.8 per cent of GDP), largely reflecting the government’s borrowing to financedeficits and its liabilities for federal employees’ and veterans’ post-employmentbenefits.17 That measure is about twice as large as the public debt. Both liabilitiesand the negative net position have been rising steadily as a percentage of GDP(and faster than debt as a percentage of GDP) since 2000.
The government’s net position and the corresponding measure for aprivate firm, its net equity, differ significantly in meaning. A negative netposition for the federal government provides an indication of the extent towhich the cost of past government activities will have to be paid in the future.It is not a measure of solvency, however, because the government has thepower to tax and can reduce spending. Moreover, the government can borrowto pay off its liabilities as they come due, even with a negative net position.Nevertheless, an ever-growing burden of federal debt – as indicated by thedebt-to-GDP ratio – would have a detrimental and potentially contractionaryeffect on the economy. At some point, the economy would be unable toprovide enough resources for the government to pay interest on the debt.18
OECD JOURNAL ON BUDGETING – VOLUME 7 – No. 1 – ISSN 1608-7143 – © OECD 2007 11

COMPARING BUDGET AND ACCOUNTING MEASURES OF THE FEDERAL GOVERNMENT’S FISCAL CONDITION
3.2. Net operating cost
The “Statement of Net Cost” and “Statement of Operations and Changesin Net Position” depict the effect of operations during the reporting period onthe government’s financial position.19 In 2005, the government’s cost ofoperations exceeded revenues by USD 760 billion, resulting in a negative netoperating cost of 6.2 per cent of GDP (see Table 1 and Figure 1).20 Just as thebudget deficit affects changes in the debt held by the public, the government’snet operating cost for a particular year corresponds to the change in thegovernment’s net position.21 A loss approximates the increase in liabilitiesminus the increase in assets.22
Net operating cost includes as current expenses the cost of deferredcompensation for federal military and civilian employees earned during thereporting period, as well as interest on existing liabilities for federal pensionsand retirement health benefits, increases in liabilities for federal insuranceprogrammes and for environmental cleanup, and the depreciation of assets.However, net operating cost is not a comprehensive accrual measure. Forexample, it does not include revenues from taxes on income earned in theperiod that are not yet owed. Nor does it include costs for future expectedlosses on insurance programmes.23
4. Comparing the measures
The federal budget is used to plan and control the allocation of fiscalresources. Financial reporting – with its requirements for audited statementsand internal accounting and administrative controls – imposes a differentmethod of accountability. Such audits and controls may improve the reliabilityof the numbers in the budget. The financial report includes a morecomprehensive list of liabilities than the budget. At the agency level, financialreporting is also used to support management by matching programmaticexpenses with outputs.24 For example, decisions such as whether to contractout work or to offer buyouts or early retirements require a full cost accountingof labour resources – including salaries, expenses for pensions and retirees’health care – that budgetary accounting is not as well designed to accomplish.25
4.1. Reconciling net operating cost and the budget deficit
The net operating cost reported in the financial statements for 2005 ofUSD 760 billion differs from the budget deficit of USD 319 billion largelybecause it reflects liabilities that the budget does not include (see Table 3).Those additional items in net cost include the following:
● Accruals for federal civilian and military employees’ benefits. The differencebetween the accrued expenses in the financial statements and the paymentsof benefits recorded in the budget is the increase in estimated liabilities
OECD JOURNAL ON BUDGETING – VOLUME 7 – No. 1 – ISSN 1608-7143 – © OECD 200712
COMPARING BUDGET AND ACCOUNTING MEASURES OF THE FEDERAL GOVERNMENT’S FISCAL CONDITION
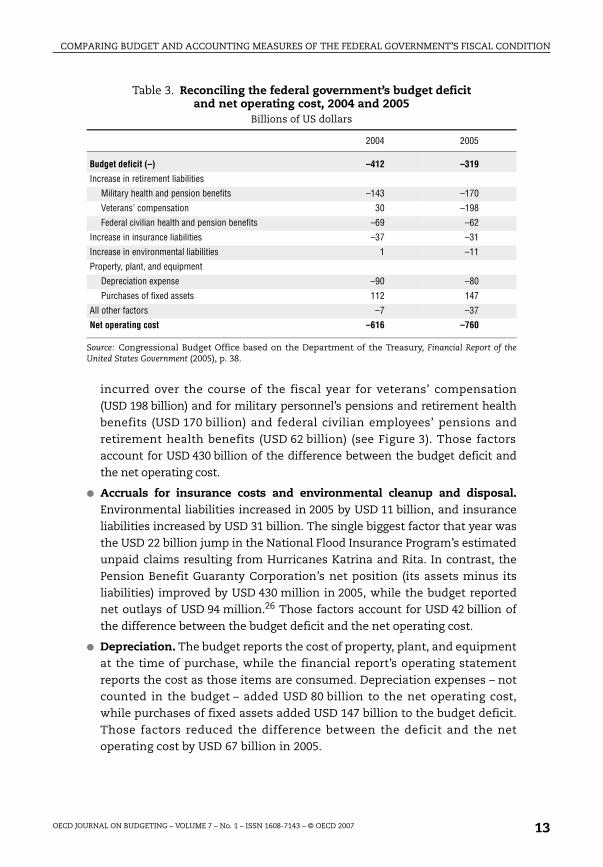
incurred over the course of the fiscal year for veterans’ compensation(USD 198 billion) and for military personnel’s pensions and retirement healthbenefits (USD 170 billion) and federal civilian employees’ pensions andretirement health benefits (USD 62 billion) (see Figure 3). Those factorsaccount for USD 430 billion of the difference between the budget deficit andthe net operating cost.
● Accruals for insurance costs and environmental cleanup and disposal.Environmental liabilities increased in 2005 by USD 11 billion, and insuranceliabilities increased by USD 31 billion. The single biggest factor that year wasthe USD 22 billion jump in the National Flood Insurance Program’s estimatedunpaid claims resulting from Hurricanes Katrina and Rita. In contrast, thePension Benefit Guaranty Corporation’s net position (its assets minus itsliabilities) improved by USD 430 million in 2005, while the budget reportednet outlays of USD 94 million.26 Those factors account for USD 42 billion ofthe difference between the budget deficit and the net operating cost.
● Depreciation. The budget reports the cost of property, plant, and equipmentat the time of purchase, while the financial report’s operating statementreports the cost as those items are consumed. Depreciation expenses – notcounted in the budget – added USD 80 billion to the net operating cost,while purchases of fixed assets added USD 147 billion to the budget deficit.Those factors reduced the difference between the deficit and the netoperating cost by USD 67 billion in 2005.
Table 3. Reconciling the federal government’s budget deficit and net operating cost, 2004 and 2005
Billions of US dollars
2004 2005
Budget deficit (–) –412 –319
Increase in retirement liabilities
Military health and pension benefits –143 –170
Veterans’ compensation 30 –198
Federal civilian health and pension benefits –69 –62
Increase in insurance liabilities –37 –31
Increase in environmental liabilities 1 –11
Property, plant, and equipment
Depreciation expense –90 –80
Purchases of fixed assets 112 147
All other factors –7 –37
Net operating cost –616 –760
Source: Congressional Budget Office based on the Department of the Treasury, Financial Report of theUnited States Government (2005), p. 38.
OECD JOURNAL ON BUDGETING – VOLUME 7 – No. 1 – ISSN 1608-7143 – © OECD 2007 13

COMPARING BUDGET AND ACCOUNTING MEASURES OF THE FEDERAL GOVERNMENT’S FISCAL CONDITION
In general, the accruals left out of the budget make it likely that in mostyears, the shortfall in the financial report’s statement of operations will belarger than the budget deficit.27 In fact, the net loss in the financial statementshas exceeded the budget deficit in all but one year since 1995 (see Table 1). Theaccrued expenses for federal employees’ retirement, a big part of which is the
Figure 3. Accrued expenses and outlays for federal employees’ pensions and retirement health benefits
Billions of US dollars
Note: Costs for pensions and retirement health benefits are for both federal civilian and militarypersonnel. Those costs were accrued as expenses in the financial report beginning in 1997.
Source: Congressional Budget Office based on data from the Department of the Treasury, FinancialReport of the United States Government (1997 to 2005); and Budget of the US Government, Fiscal Year 2007:Historical Tables, Table 11.3.
���� ���� ���� � �� � ������
��
�
��
�
�
�
�
��
�
�
��
��
�
���� ���� ���� � �� � ������
'��������(�� ��� )����$�
��������
�������� ��� ��������
OECD JOURNAL ON BUDGETING – VOLUME 7 – No. 1 – ISSN 1608-7143 – © OECD 200714

COMPARING BUDGET AND ACCOUNTING MEASURES OF THE FEDERAL GOVERNMENT’S FISCAL CONDITION
increase in the present value of the liabilities as the date of the future paymentsnears, are likely to exceed the cash payments to retirees as long as the federalworkforce is large relative to the number of retired federal employees.28 Thatmay not always be the case, however. Other factors could also narrow or reversethe gap between the net operating cost and the budget deficit. Capitalexpenditures depend on investment flows, so the treatment of capital assetscan have varying effects over time. The extent of insurance liabilities dependson events – flood losses, bank and thrift failures, and bankruptcies ofcorporations with underfunded pension plans. Because of such contingencies,the budget deficit could exceed the net operating cost in the future.
4.2. Sources of change
Several factors must be taken into account in comparing the budgetdeficit with the net operating cost over time. Changes in accounting, policies,and actuarial assumptions can lead to big swings in any given year.
4.2.1. Accounting changes
Both the budget and the financial statements are subject to changes inaccounting. For example, the Federal Credit Reform Act of 1990 significantlychanged the budgetary accounting for direct loans and loan guarantees.However, major changes in budgetary accounting are infrequent. In contrast,financial accounting standards are still being developed and added. FASAB hasrecently proposed new definitions for assets and liabilities, which could affectwhat is reported on the balance sheet in the future.29
The government’s net position depends on the comprehensiveness ofthe balance sheet. For example, the prototype financial statements issuedbefore 1997 did not report the future cost of federal retirees’ health benefits as anexpense or a liability. In addition, USD 655 billion in national defence assets weretaken off the balance sheet in 1998, causing a jump in the negative net position,before such assets were restored to the balance sheet in 2003 (see Figure 2).30
A number of new financial accounting initiatives will or could affect thebalance sheet. FASAB recently issued a new interpretation of reporting forasbestos-related cleanup costs.31 The board is currently debating whether torecognise greater liabilities for Social Security and Medicare and other socialinsurance programmes and whether to recognise federal oil and gas resourcesas an asset.32 The outcome of those debates could have significant effects onthe government’s reported liabilities, assets, net position, and net operatingcost, but changes in the balance sheet would not alter the budget’s treatmentof the federal programmes.
OECD JOURNAL ON BUDGETING – VOLUME 7 – No. 1 – ISSN 1608-7143 – © OECD 2007 15

COMPARING BUDGET AND ACCOUNTING MEASURES OF THE FEDERAL GOVERNMENT’S FISCAL CONDITION
4.2.2. Policy changes
Policy changes can affect the budget and financial statements differently.For example, the National Defense Authorization Act of 2001 extended benefitsfrom TRICARE – the Department of Defense’s health insurance programme forthe military – to military retirees and their survivors and dependents even ifthey were eligible for Medicare, enhanced drug benefits, and reduced the cap onparticipants’ out-of-pocket payments. Financial statements recognised all ofthe increase in liabilities of USD 293 billion – the present value of the benefitsearned to date and to be paid out over coming years – and a correspondingincrease in net operating cost (see Figure 3).33 However, for the cash-basedbudget, which recognises increased costs as they are paid, CBO estimatedthose costs as about USD 200 million in 2001, USD 1.8 billion in 2002, andUSD 40 billion over 10 years.34
4.2.3. Changes in actuarial assumptions
Unlike the budget, the financial statements are sensitive to changes inactuarial assumptions. The divergence that occurred between the budgetdeficit and the net operating cost from 2004 to 2005 – as the former measuredeclined and the latter measure grew – was caused partly by changes inactuarial assumptions. Specifically, estimates of liabilities for veterans’compensation increased by USD 198 billion in 2005 following a USD 30 billiondecline in 2004: changes in interest rates and other actuarial assumptions,including ones about the number of veterans and dependents receivingpayments, did not affect the budget but did affect the net operating cost.35 Inaddition, changes in assumptions about the costs of military retirees’ healthbenefits increased that liability by over USD 50 billion in 2005.36
Notes
1. Numbers in the text and tables may not add up to totals because of rounding.
2. See Department of the Treasury, Financial Report of the United States Government(December 2005), available at www.fms.treas.gov/fr/05frusg/05frusg.pdf. See alsoCongressional Budget Office, Measures of the US Government’s Fiscal Position UnderCurrent Law (August 2004).
3. “Insurance programmes”, as referred to in this paper, include ones providing deposit,flood, and pension insurance, for example, but not social insurance programmes suchas Social Security and Medicare.
4. In 2006, the budget deficit declined to USD 248 billion. This paper uses 2005numbers because the financial statements for 2006 are not yet available.
5. Significant amendments to that law were made by the Balanced Budget andEmergency Deficit Control Act of 1985, the Budget Enforcement Act of 1990, andthe Unfunded Mandates Reform Act of 1995. See House Committee on the Budget,Compilation of Laws and Rules Relating to the Congressional Budget Process, Serial
OECD JOURNAL ON BUDGETING – VOLUME 7 – No. 1 – ISSN 1608-7143 – © OECD 200716
COMPARING BUDGET AND ACCOUNTING MEASURES OF THE FEDERAL GOVERNMENT’S FISCAL CONDITION
No. CP-4 (May 2000). See also Senate Committee on the Budget, The CongressionalBudget Process: An Explanation, S. Prt. 105-67 (Revised December 1998). A number ofthose provisions have expired in recent years.
6. For details on credit reform accounting, see Congressional Budget Office,Estimating the Value of Subsidies for Federal Loans and Loan Guarantees (August 2004)and Credit Subsidy Reestimates, 1993-1999 (September 2000).
7. Zero-coupon bonds, which are sold at a discount to par value, provide a singlepayment at maturity. Interest payments are, therefore, implicit in the bonds’appreciation over time.
8. The Social Security trust funds and the cash flow of the Postal Service aredesignated “off budget” while the rest of the budget is “on budget”. For manypurposes, those two categories are combined to yield a total, or unified, surplus ordeficit. In 2005, the unified budget deficit of USD 319 billion comprised anon-budget deficit of USD 494 billion and an off-budget surplus of USD 175 billion.
9. Another set of accounts – the national income and product accounts (NIPAs),which are maintained by the Department of Commerce’s Bureau of EconomicAnalysis – also records the federal government’s transactions but with differentobjectives. The NIPAs are intended to provide a comprehensive measure of currentproduction and related income generated by the US economy. Because the aims ofthe NIPAs differ from those of the budget, the two accounting systems treat somegovernment transactions differently. Receipts and expenditures in the NIPAsusually differ slightly from those in the budget. For details, see CongressionalBudget Office, The Treatment of Federal Receipts and Expenditures in the National Incomeand Product Accounts (September 2006).
10. See Congressional Budget Office, The Budget and Economic Outlook: Fiscal Years 2007to 2016 (January 2006).
11. In addition to borrowing from the public, the deficit is financed by some othermeans, including drawdowns of the government’s holdings of coins, currency, andbank deposits and net cash inflows to credit-financing accounts.
12. Another measure that some analysts emphasise is gross federal debt, which isdebt held by the public plus debt held by government accounts (including those forSocial Security), some of which constitutes amounts that the government owes toitself. Gross federal debt was USD 7.9 trillion in 2005, or 64 per cent of GDP. Of thatamount, USD 3.3 trillion was debt held by government accounts.
13. For the latest such projections, see Congressional Budget Office, The Long-TermBudget Outlook (December 2005); and Office of Management and Budget, Budget ofthe US Government, Fiscal Year 2007: Analytical Perspectives, pp. 184-194. Seealso Government Accountability Office, The Nation’s Long-Term Fiscal Outlook,GAO-06-1077R (September 2006), available at www.gao.gov/special.pubs/longterm/.
14. Since 1997, the report has been subject to audit – by what is now the GovernmentAccountability Office – but it has yet to receive an unqualified opinion because ofa number of deficiencies. See Department of the Treasury, Financial Report of theUnited States Government (2005), pp. 135–154.
15. Federal gold holdings (258 713 310 troy ounces) are carried on the books at a priceof USD 42.22 per ounce, as specified by statute, but the market price of gold ishigher: USD 473 on 30 September 2005. See Department of the Treasury, FinancialReport of the United States Government (2005), p. 85.
OECD JOURNAL ON BUDGETING – VOLUME 7 – No. 1 – ISSN 1608-7143 – © OECD 2007 17

COMPARING BUDGET AND ACCOUNTING MEASURES OF THE FEDERAL GOVERNMENT’S FISCAL CONDITION
16. See Federal Accounting Standards Advisory Board, “Statement of Federal FinancialAccounting Standards: Accounting for Federal Oil and Gas Resources” (exposuredraft, forthcoming in 2007).
17. The Office of Management and Budget releases an unaudited statement of assetsand liabilities that reports a smaller negative net position, of USD 5.7 trillion, mainlybecause it reports estimated values for federal land and mineral rights as assets.OMB’s presentation does not follow all FASAB standards (see the Annex). See Officeof Management and Budget, Budget of the US Government, Fiscal Year 2007: AnalyticalPerspectives, pp. 181-183.
18. Congressional Budget Office, The Long-Term Budget Outlook (December 2005), p. 2.
19. Agencies’ statements of net cost arrive at that measure by starting with their grosscosts and subtracting any earned revenues.
20. In years in which revenues exceed the net cost of government operations, suchas 2000, a positive net cost is reported.
21. The government’s net position at the beginning of 2005 was USD –7 710 billion andUSD –8 459 billion at the end of the year – a change of USD 749 billion. TheUSD 11 billion difference between that change and the net operating cost ofUSD 760 billion results from USD 3.6 billion attributable to a change in accountingprinciples and USD 7.5 billion in adjustments for prior periods.
22. More generally, net operating cost is the change in assets minus the change inliabilities. Since the audited financial reports were first issued in 1997, liabilitieshave increased every year except 1999 and 2000. Assets declined only in 1998, butthat decline derived solely from the removal of the Department of Defense’sproperty, plant, and equipment from the balance sheet.
23. See Congressional Budget Office, The Risk Exposure of the Pension Benefit GuarantyCorporation (September 2005).
24. See Federal Accounting Standards Advisory Board, FASAB’s Strategic Directions:Clarifying FASAB’s Near-Term Role in Achieving the Objectives of Federal Financial Reporting(November 2006), available at www.fasab.gov/pdffiles/stratobjectivesnov2006.pdf.
25. Federal agencies currently pay the accrual charges for federal pensions (but not forcivilian employees’ health care in retirement). The payments to the government’sretirement accounts are intragovernmental and do not affect total budget outlaysor, therefore, the budget surplus or deficit, but they do require appropriations andare recognised as agencies’ obligations. See Congressional Budget Office, ThePresident’s Proposal to Accrue Retirement Costs for Federal Employees (June 2002).
26. The Pension Benefit Guaranty Corporation’s assets increased more than its liabilitiesdid in 2005, which resulted in an improvement in its net worth. Changes in interestrates had favourable effects on revaluations of assets and liabilities, and the agency’sinvestment returns were strong. See Pension Benefit Guaranty Corporation,Performance and Accountability Report: Fiscal Year 2005, 15 November 2005, pp. 4and 18-19, available at www.pbgc.gov/docs/2005par.pdf. See also Congressional BudgetOffice, A Guide to Understanding the Pension Benefit Guaranty Corporation(September 2005).
27. The shortfall in the statement of operations could be less than the budget deficitin years in which liabilities declined. Drops in liabilities could occur, for example,because of a rise in interest rates, which would reduce the present value of futurebenefit payments, or reductions in federal retirement benefits.
OECD JOURNAL ON BUDGETING – VOLUME 7 – No. 1 – ISSN 1608-7143 – © OECD 200718

COMPARING BUDGET AND ACCOUNTING MEASURES OF THE FEDERAL GOVERNMENT’S FISCAL CONDITION
28. Accrued expenses include three main components: the accruing liabilities toworkers derived from their current year’s work, the effect of changes in benefitplans, and interest on pre-existing retirement liabilities for payment in future years.(The accrued expenses differ from the change in liabilities because the lattersubtracts out benefits paid in the current year.) Interest costs arise because thepre-existing liabilities for payment in future years are one year closer to being paidthan they were the previous year. The resulting change in their discounted presentvalue is labeled “interest”. In 2005, such interest amounted to USD 189 billion – justover half of the total accrued expense.
29. See Federal Accounting Standards Advisory Board, “Proposed Statement of FederalFinancial Accounting Concepts: Definitions and Recognition of Elements ofAccrual-Basis Financial Statements” (exposure draft, 7 June 2006), available atwww.fasab.gov/pdffiles/elementsed06072006.pdf.
30. National defence assets, which had been reported as property, plant, andequipment, were taken off the balance sheet in 1998 and reported instead as“stewardship assets” in the notes to the statements. See Department of theTreasury, Financial Report of the United States Government (1998), pp. 68 and 75,available at www.fms.treas.gov/fr/98frusg/98notes.pdf. Beginning in 2003, FASABrequired the Department of Defense to report the value of its military equipment,which added USD 325 billion to the amount of property, plant, and equipmentreported that year.
31. Federal Accounting Standards Advisory Board, Recognition and Measurement ofAsbestos-Related Clean Up Costs, Technical Bulletin 2006-1, 28 September 2006,available at www.fasab.gov/pdffiles/techbulletin_2006.pdf.
32. Federal Accounting Standards Advisory Board, “Accounting for Social Insurance”(revised preliminary view, 23 October 2006), available at www.fasab.gov/pdffiles/socialinsurance_pv.pdf.
33. Department of the Treasury, Financial Report of the United States Government(updated 30 March 2003), p. 110.
34. That estimate included the costs for the new benefit and increased costs inexisting programmes, including Medicare. CBO also projected an increase ofUSD 59 billion over 10 years in intragovernmental accrual payments by theDepartment of Defense to a fund for retirees’ health care. See the cost estimate ofthe Congressional Budget Office for H.R. 4205, National Defense Authorization Actfor Fiscal Year 2001 (Health Care for Military Retirees), 11 October 2000.
35. See Department of the Treasury, Financial Report of the United States Government(2005), p. 101.
36. Ibid., p. 96.
References
Congressional Budget Office (2000a), Credit Subsidy Reestimates, 1993-1999, September,CBO, Washington DC.
Congressional Budget Office (2000b), “Cost Estimate for H.R. 4205, National DefenseAuthorization Act for Fiscal Year 2001 (Health Care for Military Retirees)”,11 October, CBO, Washington DC.
Congressional Budget Office (2002), The President’s Proposal to Accrue Retirement Costs forFederal Employees, June, CBO, Washington DC.
OECD JOURNAL ON BUDGETING – VOLUME 7 – No. 1 – ISSN 1608-7143 – © OECD 2007 19

COMPARING BUDGET AND ACCOUNTING MEASURES OF THE FEDERAL GOVERNMENT’S FISCAL CONDITION
Congressional Budget Office (2004a), Measures of the US Government’s Fiscal PositionUnder Current Law, August, CBO, Washington DC.
Congressional Budget Office (2004b), Estimating the Value of Subsidies for Federal Loansand Loan Guarantees, August, CBO, Washington DC.
Congressional Budget Office (2005a), The Risk Exposure of the Pension Benefit GuarantyCorporation, September, CBO, Washington DC.
Congressional Budget Office (2005b), A Guide to Understanding the Pension BenefitGuaranty Corporation, September, CBO, Washington DC.
Congressional Budget Office (2005c), The Long-Term Budget Outlook, December, CBO,Washington DC.
Congressional Budget Office (2006a), The Budget and Economic Outlook: Fiscal Years 2007to 2016, January, CBO, Washington DC.
Congressional Budget Office (2006b), The Treatment of Federal Receipts and Expenditures inthe National Income and Product Accounts, September, CBO, Washington DC.
Department of the Treasury (1998), Financial Report of the United States Government,available at www.fms.treas.gov/fr/98frusg/98notes.pdf, Department of the Treasury,Washington DC.
Department of the Treasury (2003), Financial Report of the United States Government,updated March, Department of the Treasury, Washington DC.
Department of the Treasury (2005), Financial Report of the United States Government,December, available at www.fms.treas.gov/fr/05frusg/05frusg.pdf, Department of theTreasury, Washington DC.
Federal Accounting Standards Advisory Board (2006a), “Proposed Statement ofFederal Financial Accounting Concepts: Definitions and Recognition of Elementsof Accrual-Basis Financial Statements”, exposure draft, 7 June, available atwww.fasab.gov/pdffiles/elementsed06072006.pdf, FASAB, Washington DC.
Federal Accounting Standards Advisory Board (2006b), Recognition and Measurement ofAsbestos-Related Clean Up Costs, Technical Bulletin 2006-1, 28 September, availableat www.fasab.gov/pdffiles/techbulletin_2006.pdf, FASAB, Washington DC.
Federal Accounting Standards Advisory Board (2006c), “Accounting for SocialInsurance”, revised preliminary view, 23 October, available at www.fasab.gov/pdffiles/socialinsurance_pv.pdf, FASAB, Washington DC.
Federal Accounting Standards Advisory Board (2006d), Accounting for FiduciaryActivities, Statement of Federal Financial Accounting Standards 31, 24 October,available at www.fasab.gov/pdffiles/sffas_31.pdf, FASAB, Washington DC.
Federal Accounting Standards Advisory Board (2006e), FASAB’s Strategic Directions:Clarifying FASAB’s Near-Term Role in Achieving the Objectives of Federal FinancialReporting, November, available at www.fasab.gov/pdffiles/stratobjectivesnov2006.pdf,FASAB, Washington DC.
Federal Accounting Standards Advisory Board (2007), “Statement of Federal FinancialAccounting Standards: Accounting for Federal Oil and Gas Resources”, exposuredraft, forthcoming, FASAB, Washington DC.
Government Accountability Office (2006), The Nation’s Long-Term Fiscal Outlook,GAO-06-1077R, September, available at www.gao.gov/special.pubs/longterm, GAO,Washington DC.
OECD JOURNAL ON BUDGETING – VOLUME 7 – No. 1 – ISSN 1608-7143 – © OECD 200720

COMPARING BUDGET AND ACCOUNTING MEASURES OF THE FEDERAL GOVERNMENT’S FISCAL CONDITION
House Committee on the Budget (2000), Compilation of Laws and Rules Relating to theCongressional Budget Process, Serial No. CP-4, May, House of Representatives of theUnited States Congress, Washington DC.
Office of Management and Budget (2006a), Budget of the US Government, Fiscal Year 2007,OMB, Washington DC.
Office of Management and Budget (2006b), Budget of the US Government, Fiscal Year 2007:Analytical Perspectives, OMB, Washington DC.
Office of Management and Budget (2006c), Budget of the US Government, Fiscal Year 2007:Historical Tables, OMB, Washington DC.
Pension Benefit Guaranty Corporation (2005), Performance and Accountability Report:Fiscal Year 2005, 15 November, available at www.pbgc.gov/docs/2005par.pdf, PBGC,Washington DC.
Senate Committee on the Budget (1998), The Congressional Budget Process: AnExplanation, S. Prt. 105-67, revised December, Senate of the United States Congress,Washington DC.
OECD JOURNAL ON BUDGETING – VOLUME 7 – No. 1 – ISSN 1608-7143 – © OECD 2007 21

COMPARING BUDGET AND ACCOUNTING MEASURES OF THE FEDERAL GOVERNMENT’S FISCAL CONDITION
ANNEX
Comparing the Department of the Treasury’s Balance Sheet and OMB’s Asset
and Liability Presentation
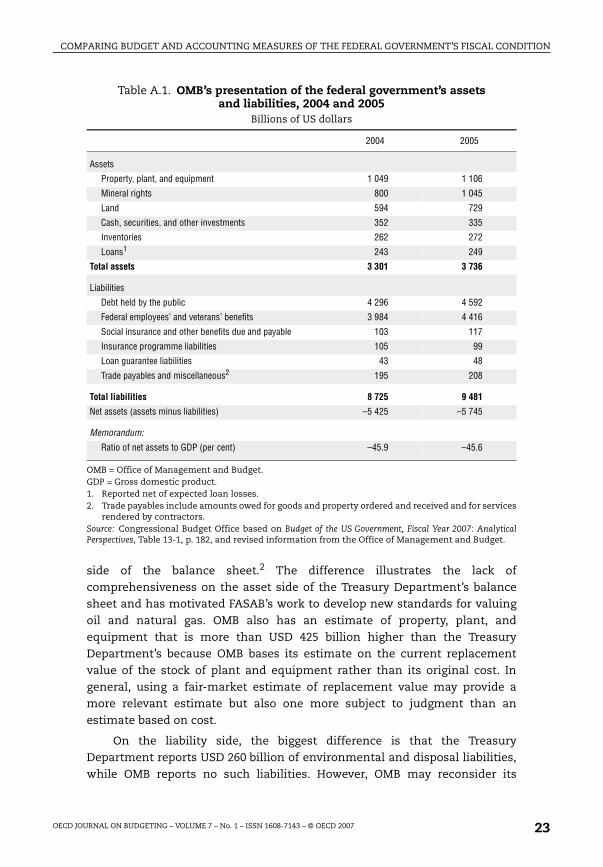
The Office of Management and Budget (OMB) has issued an annualstatement of federal assets and liabilities since 1993 (see Table A.1).1 Thatpresentation of assets and liabilities – which is not audited – includes “bestestimates” that might not be reliable enough for an audited balance sheet.OMB does not call the presentation a balance sheet because its presentationdoes not exclusively use generally accepted accounting principles to measureassets and liabilities. The agency does not calculate the annual change in netassets, which would correspond to the net operating cost in the Department ofthe Treasury’s Financial Report of the United States Government, but a generalunderstanding of OMB’s presentation helps illustrate the strengths andweaknesses of the government’s official audited accounting report prepared inaccordance with standards by the Federal Accounting Standards AdvisoryBoard (FASAB).
For 2005, OMB reported federal assets of USD 3 736 billion, liabilities ofUSD 9 481 billion, and a negative net position (assets minus liabilities) ofUSD 5 745 billion. In contrast, the Treasury Department reported federalassets of USD 1 456 billion, liabilities of USD 9 915 billion, and a negative netposition of USD 8 459 billion.
While there is much overlap in reporting in the two documents, OMB’spresentation of assets and liabilities differs from the Treasury Department’spresentation in several respects. Some of the differences relate to scope, butsome relate to the use of different valuation measures. The differences aremost apparent in the reporting of assets: OMB includes values for federal land(USD 729 billion) and mineral rights (USD 1 045 billion) that the TreasuryDepartment does not report. Those estimates do not meet generally acceptedaccounting principles but indicate how important the items are to the asset
OECD JOURNAL ON BUDGETING – VOLUME 7 – No. 1 – ISSN 1608-7143 – © OECD 200722
COMPARING BUDGET AND ACCOUNTING MEASURES OF THE FEDERAL GOVERNMENT’S FISCAL CONDITION
side of the balance sheet.2 The difference illustrates the lack ofcomprehensiveness on the asset side of the Treasury Department’s balancesheet and has motivated FASAB’s work to develop new standards for valuingoil and natural gas. OMB also has an estimate of property, plant, andequipment that is more than USD 425 billion higher than the TreasuryDepartment’s because OMB bases its estimate on the current replacementvalue of the stock of plant and equipment rather than its original cost. Ingeneral, using a fair-market estimate of replacement value may provide amore relevant estimate but also one more subject to judgment than anestimate based on cost.
On the liability side, the biggest difference is that the TreasuryDepartment reports USD 260 billion of environmental and disposal liabilities,while OMB reports no such liabilities. However, OMB may reconsider its
Table A.1. OMB’s presentation of the federal government’s assets and liabilities, 2004 and 2005
Billions of US dollars
2004 2005
Assets
Property, plant, and equipment 1 049 1 106
Mineral rights 800 1 045
Land 594 729
Cash, securities, and other investments 352 335
Inventories 262 272
Loans1 243 249
Total assets 3 301 3 736
Liabilities
Debt held by the public 4 296 4 592
Federal employees’ and veterans’ benefits 3 984 4 416
Social insurance and other benefits due and payable 103 117
Insurance programme liabilities 105 99
Loan guarantee liabilities 43 48
Trade payables and miscellaneous2 195 208
Total liabilities 8 725 9 481
Net assets (assets minus liabilities) –5 425 –5 745
Memorandum:
Ratio of net assets to GDP (per cent) –45.9 –45.6
OMB = Office of Management and Budget.GDP = Gross domestic product.1. Reported net of expected loan losses.2. Trade payables include amounts owed for goods and property ordered and received and for services
rendered by contractors.Source: Congressional Budget Office based on Budget of the US Government, Fiscal Year 2007: AnalyticalPerspectives, Table 13-1, p. 182, and revised information from the Office of Management and Budget.
OECD JOURNAL ON BUDGETING – VOLUME 7 – No. 1 – ISSN 1608-7143 – © OECD 2007 23

COMPARING BUDGET AND ACCOUNTING MEASURES OF THE FEDERAL GOVERNMENT’S FISCAL CONDITION
treatment of those liabilities.3 The two documents have similar estimates forfederal employees’ and veterans’ benefits, insurance programmes, and socialinsurance and other benefits that are due and payable. The TreasuryDepartment also includes USD 35 billion of accrued interest payable on debtheld by the public, while OMB does not.
The reporting differences result in OMB’s showing a smaller negative netposition relative to GDP (45.6 per cent) than the Treasury Department does(68.8 per cent). That difference has persisted for several years (see Figure A.1).
Notes
1. OMB does not, however, separately report operating costs on an accrual basis. SeeBudget of the US Government, Fiscal Year 2007: Analytical Perspectives, Table 13-1, p. 182.
2. Estimates for those two categories are based on earlier published estimates byresearchers. The estimates are adjusted each year as market prices change for oil,natural gas, and land. The mineral rights include both proven and unprovenreserves; however, OMB does not adjust quantities of those reserves either fordepletion of existing stocks of reserves over time or new discoveries. Personalcommunication to the Congressional Budget Office by a staff member of the Officeof Management and Budget, 11 July 2006. See Michael J. Boskin, Marc S. Robinson,
Figure A.1. Debt, Treasury’s estimate of negative net position, and OMB’s estimate of negative net position
Percentage of gross domestic product
Note: The Department of the Treasury began publishing audited financial statements in 1997; datafor 1995 and 1996 are from prototype reports. OMB = Office of Management and Budget.
Source: Congressional Budget Office based in part on data from the Department of the Treasury,Financial Report of the United States Government (1995 to 2005) and Budget of the US Government, FiscalYear 2007: Analytical Perspectives, Table 13-1, p. 182, with revisions from OMB staff.
���� ���� ���� ���� ���� � �� � ������
�
�
�
�
�
�
�
*������$+�� �����&�� ���������� ), +�� �����&�� ���������� !�"��#����"$��#����"���
OECD JOURNAL ON BUDGETING – VOLUME 7 – No. 1 – ISSN 1608-7143 – © OECD 200724

COMPARING BUDGET AND ACCOUNTING MEASURES OF THE FEDERAL GOVERNMENT’S FISCAL CONDITION
and Alan M. Huber, Government Saving, Capital Formation and Wealth in theUnited States, 1947-1985, Working Paper No. 2352, National Bureau of EconomicResearch, Cambridge, Massachusetts, August 1987, pp. 28-35.
3. When OMB originally set up its framework for reporting assets and liabilities – wellbefore FASAB was established – there were no estimates of the federal government’senvironmental and disposal liabilities. OMB is considering adding FASAB’s estimatesin its future presentations of stewardship activities. Personal communication to theCongressional Budget Office by a staff member of the Office of Management andBudget, 11 July 2006.
Reference
Boskin, Michael J., Marc S. Robinson and Alan M. Huber (1987), Government Saving,Capital Formation and Wealth in the United States, 1947-1985, Working Paper No. 2352,August, National Bureau of Economic Research, Cambridge, Massachusetts,United States.
OECD JOURNAL ON BUDGETING – VOLUME 7 – No. 1 – ISSN 1608-7143 – © OECD 2007 25