Embed Size (px)
Citation preview
Comparing Cameras Using EMVA 1288
Dr. Friedrich Dierks Head of Software Development Components
© Basler AG, 2006, Version 1.2
2© Basler AG, 2006 Dierks: EMVA 1288
www.standard1288.org
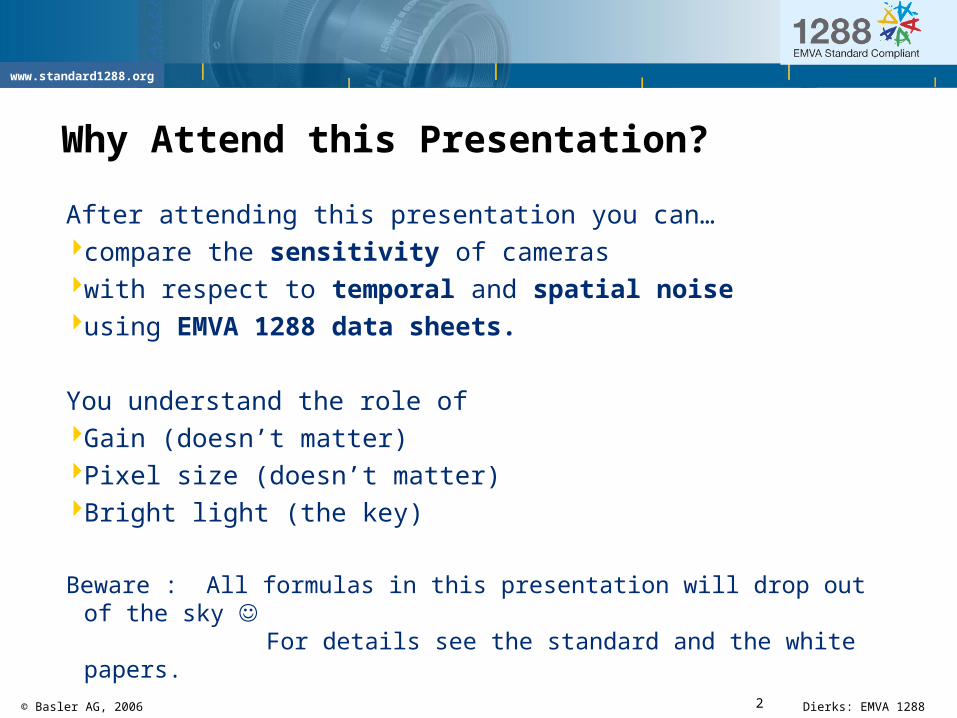
Why Attend this Presentation?
After attending this presentation you can…compare the sensitivity of cameraswith respect to temporal and spatial noiseusing EMVA 1288 data sheets.
You understand the role of Gain (doesn’t matter)Pixel size (doesn’t matter)Bright light (the key)
Beware : All formulas in this presentation will drop out of the sky For details see the standard and the white papers.
3© Basler AG, 2006 Dierks: EMVA 1288
www.standard1288.org
Outline
Some BasicsTemporal Noise Spatial Noise
4© Basler AG, 2006 Dierks: EMVA 1288
www.standard1288.org
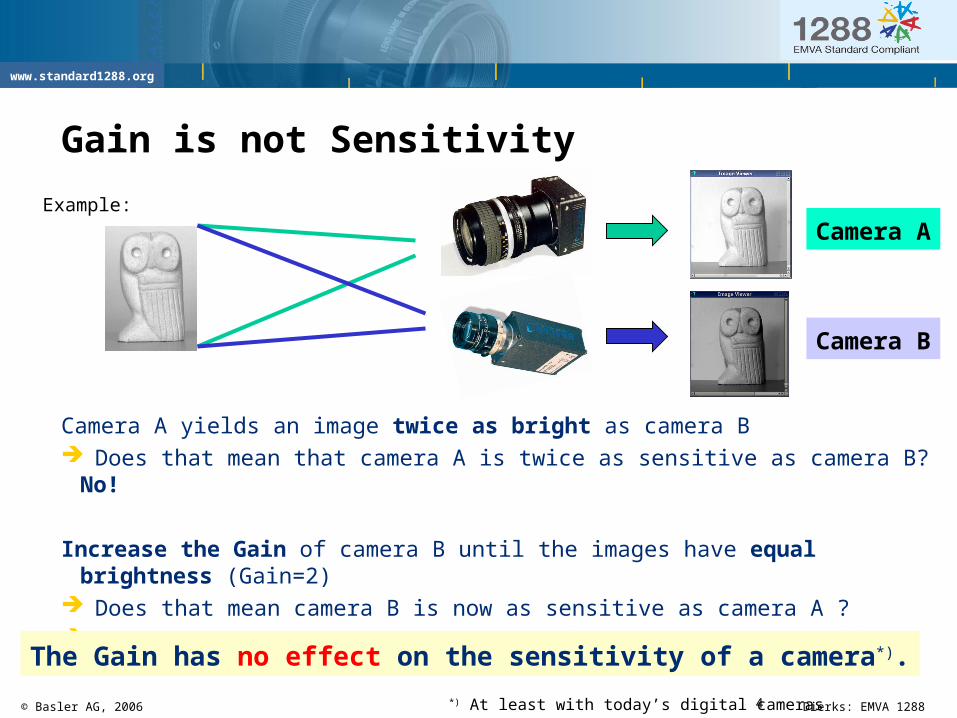
Gain is not Sensitivity
Camera A yields an image twice as bright as camera B Does that mean that camera A is twice as sensitive as camera B? No!
Increase the Gain of camera B until the images have equal brightness (Gain=2) Does that mean camera B is now as sensitive as camera A ? No! Multiplying each pixel x2 in software has the same effect…
Camera A
Camera B
Example:
The Gain has no effect on the sensitivity of a camera*).
*) At least with today’s digital cameras
5© Basler AG, 2006 Dierks: EMVA 1288
www.standard1288.org
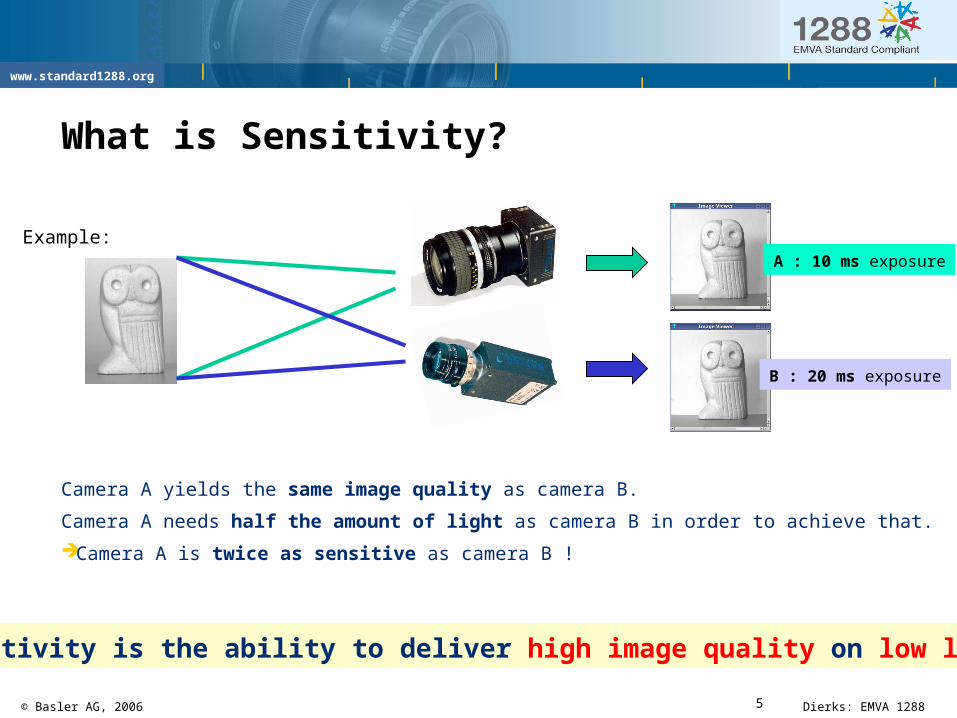
What is Sensitivity?
Camera A yields the same image quality as camera B.
Camera A needs half the amount of light as camera B in order to achieve that.
Camera A is twice as sensitive as camera B !
Example:
Sensitivity is the ability to deliver high image quality on low light.
A : 10 ms exposure
B : 20 ms exposure

6© Basler AG, 2006 Dierks: EMVA 1288
www.standard1288.org
Defining Image Quality
Image Quality = Signal-to-Noise Ratio (SNR)
bright signal – dark signal
noise
SNR does not depend on Gain. Gain increases signal as well as noise. SNR does not depend on Offset. Offset shifts dark signal as well as bright signal.There are different kinds of noise:
total noise = temporal noise + spatial noise
=
7© Basler AG, 2006 Dierks: EMVA 1288
www.standard1288.org
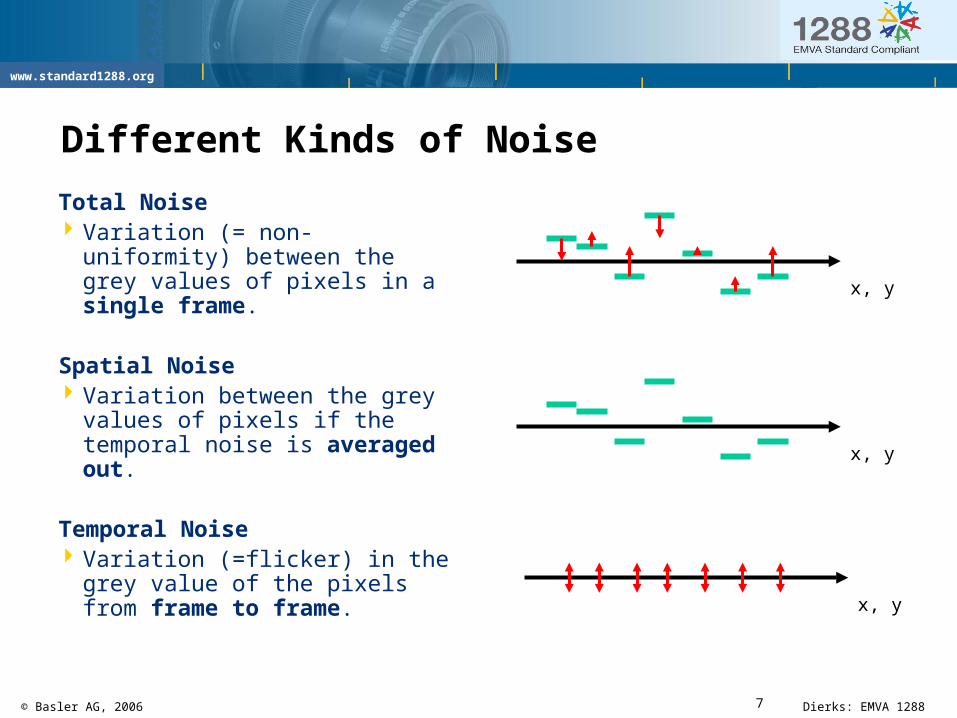
Different Kinds of Noise
Total Noise Variation (= non-uniformity)
between the grey values of pixels in a single frame.
Spatial Noise Variation between the grey
values of pixels if the temporal noise is averaged out.
Temporal Noise Variation (=flicker) in the grey
value of the pixels from frame to frame.
x, y
x, y
x, y
8© Basler AG, 2006 Dierks: EMVA 1288
www.standard1288.org
Outline
Some BasicsTemporal Noise Spatial Noise
9© Basler AG, 2006 Dierks: EMVA 1288
www.standard1288.org
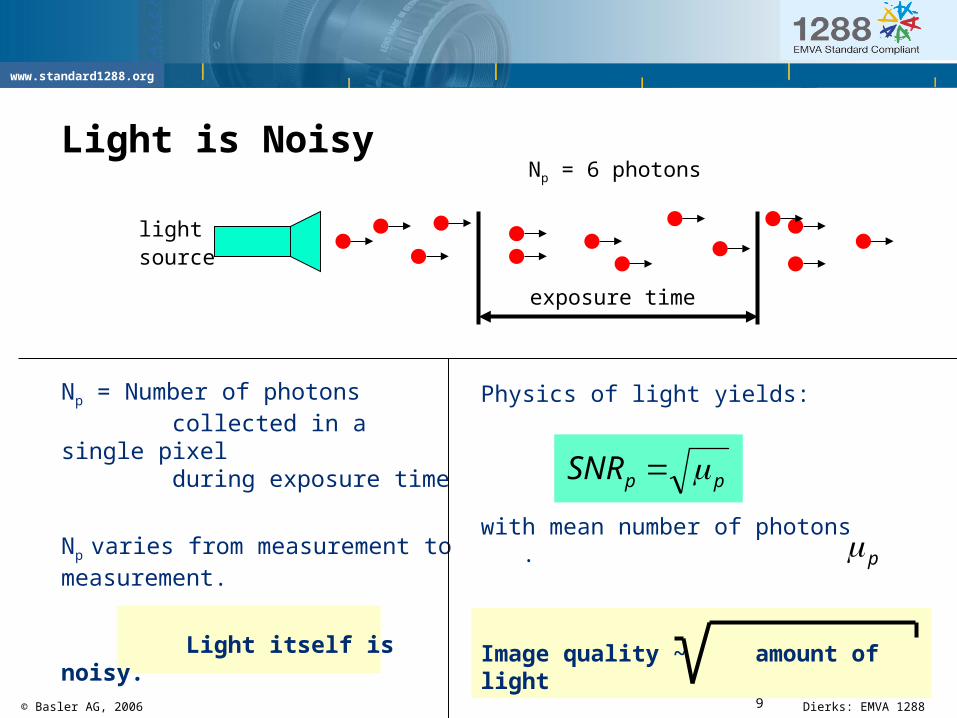
Light is Noisy
Np = Number of photons collected in a single pixel during exposure time
Np varies from measurement to measurement.
Light itself is noisy.
Physics of light yields:
with mean number of photons .
Image quality ~ amount of light
light source
exposure time
Np = 6 photons
ppSNR
p
10© Basler AG, 2006 Dierks: EMVA 1288
www.standard1288.org
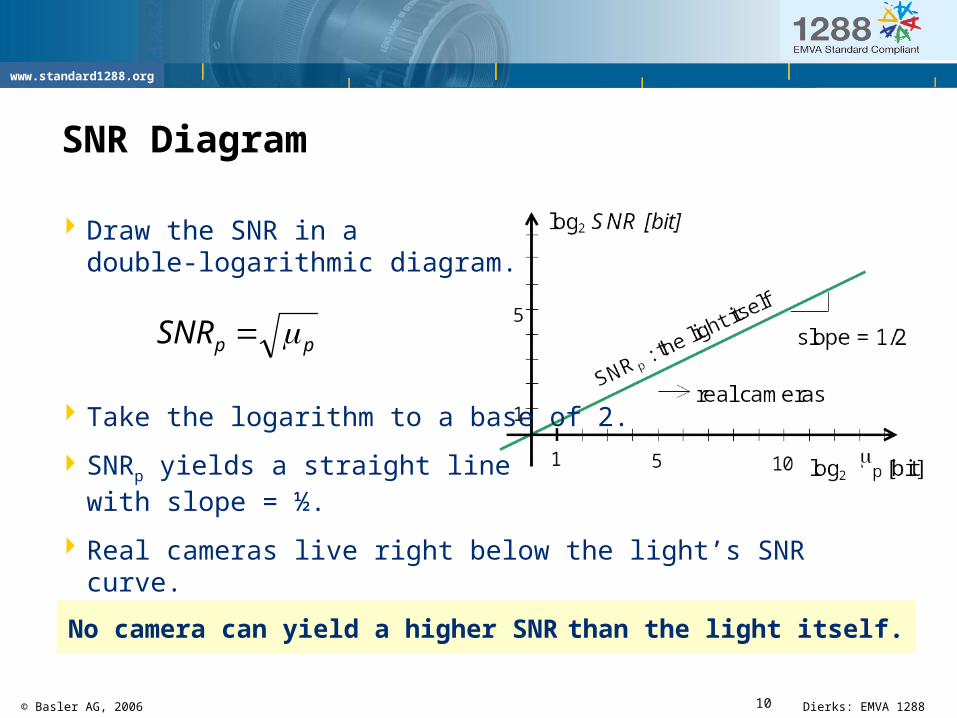
SNR Diagram
Draw the SNR in a double-logarithmic diagram.
Take the logarithm to a base of 2.
SNRp yields a straight line with slope = ½.
Real cameras live right below the light’s SNR curve.
ppSNR
No camera can yield a higher SNR than the light itself.
11© Basler AG, 2006 Dierks: EMVA 1288
www.standard1288.org
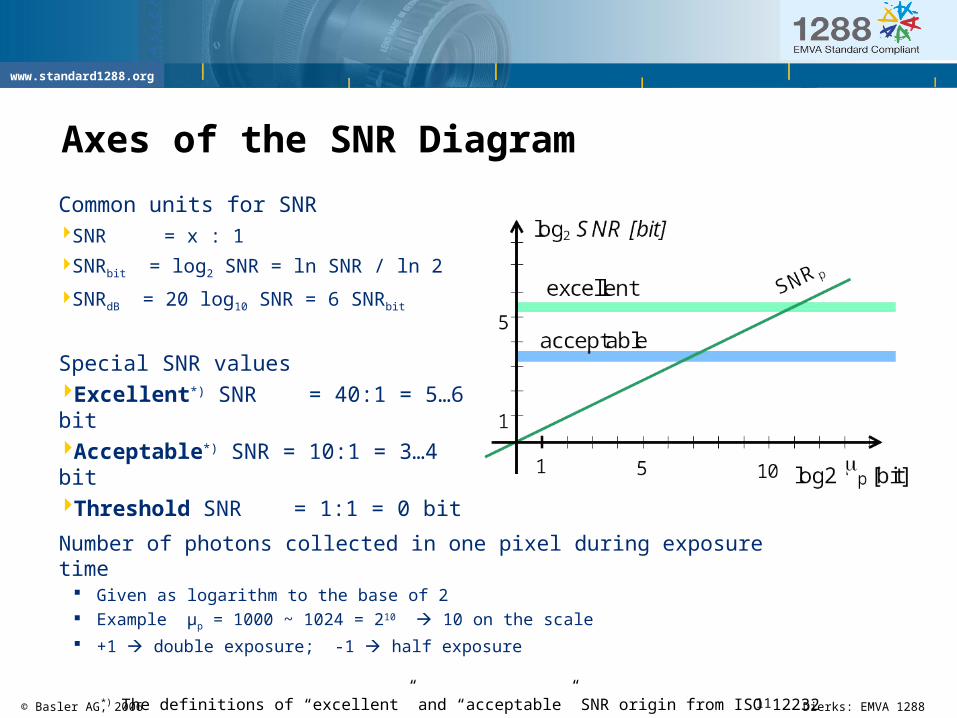
Axes of the SNR Diagram
Common units for SNRSNR = x : 1
SNRbit = log2 SNR = ln SNR / ln 2
SNRdB = 20 log10 SNR = 6 SNRbit
Special SNR valuesExcellent*) SNR = 40:1 = 5…6 bitAcceptable*) SNR = 10:1 = 3…4 bitThreshold SNR = 1:1 = 0 bit
Number of photons collected in one pixel during exposure time Given as logarithm to the base of 2 Example µp = 1000 ~ 1024 = 210 10 on the scale
+1 double exposure; -1 half exposure
*) The definitions of “excellent” and “acceptable” SNR origin from ISO 12232
12© Basler AG, 2006 Dierks: EMVA 1288
www.standard1288.org
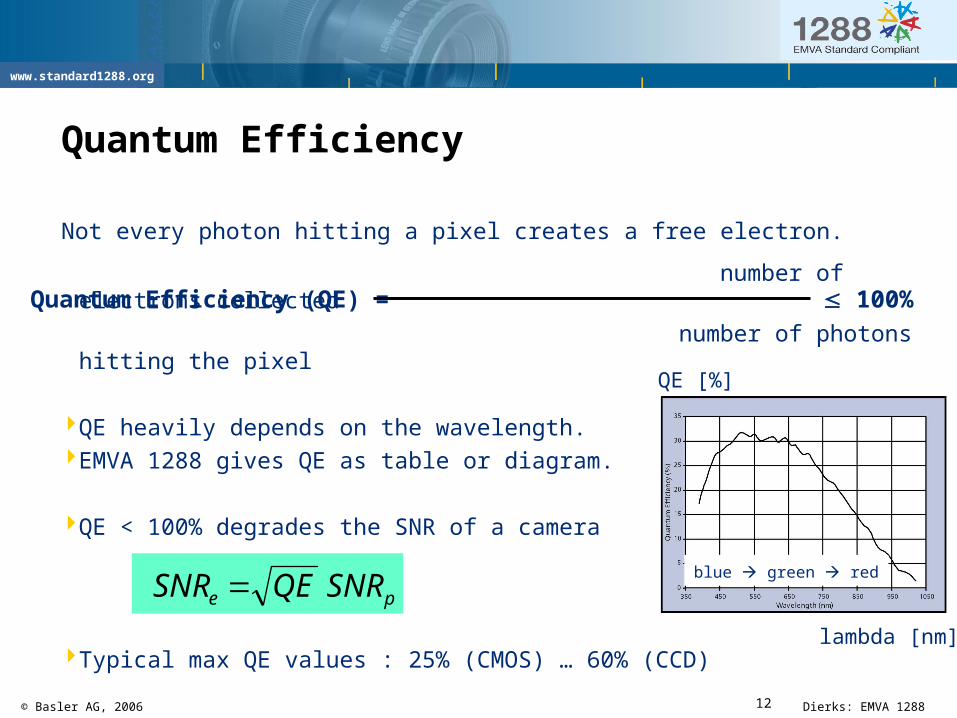
Quantum Efficiency
Not every photon hitting a pixel creates a free electron.
number of electrons collected
number of photons hitting the pixel
QE heavily depends on the wavelength.EMVA 1288 gives QE as table or diagram.
QE < 100% degrades the SNR of a camera
Typical max QE values : 25% (CMOS) … 60% (CCD)
Quantum Efficiency (QE) =
pe SNRQESNR
QE [%]
lambda [nm]
blue green red
100%
13© Basler AG, 2006 Dierks: EMVA 1288
www.standard1288.org
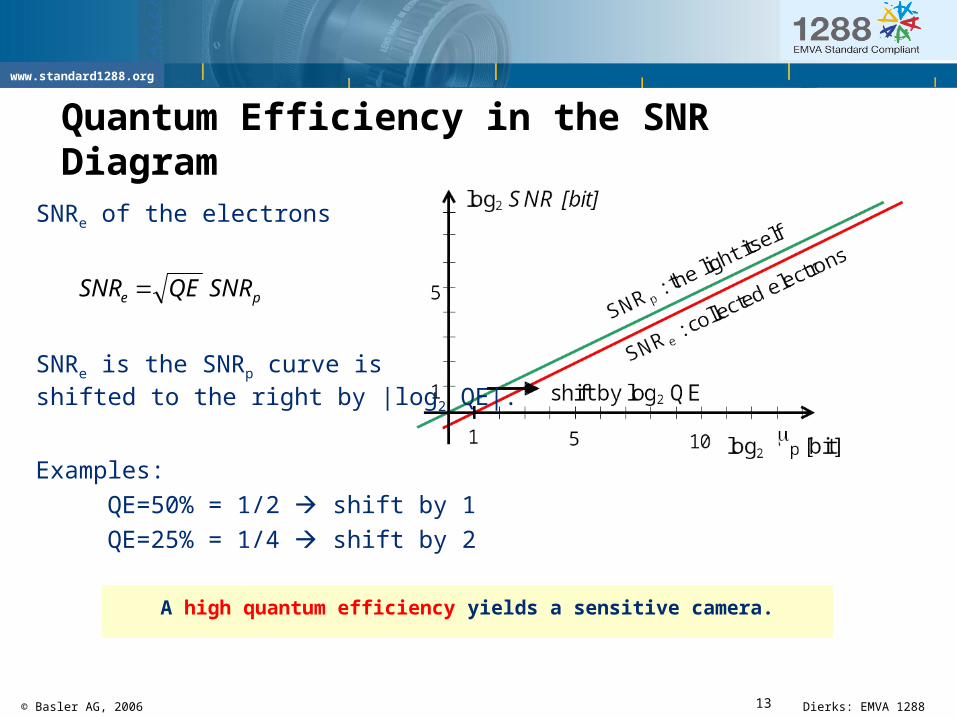
Quantum Efficiency in the SNR Diagram
SNRe of the electrons
SNRe is the SNRp curve is shifted to the right by |log2 QE|.
Examples:
QE=50% = 1/2 shift by 1
QE=25% = 1/4 shift by 2
pe SNRQESNR
A high quantum efficiency yields a sensitive camera.
14© Basler AG, 2006 Dierks: EMVA 1288
www.standard1288.org
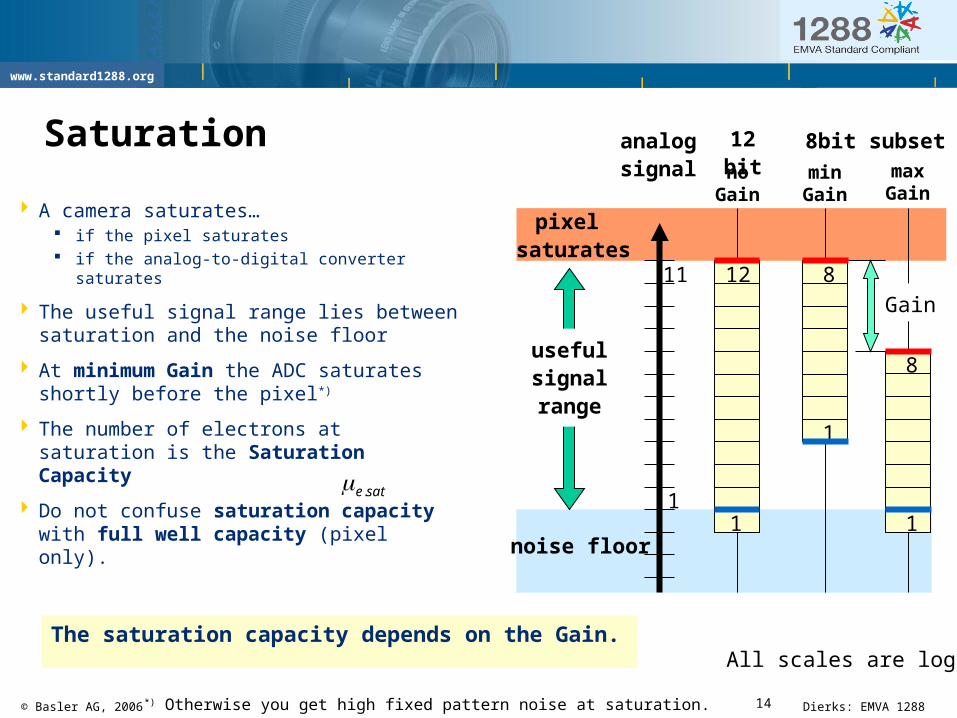
Saturation
A camera saturates… if the pixel saturates if the analog-to-digital converter saturates
The useful signal range lies between saturation and the noise floor
At minimum Gain the ADC saturates shortly before the pixel*)
The number of electrons at saturation is the Saturation Capacity
Do not confuse saturation capacity with full well capacity (pixel only).
sate.
All scales are log2
pixel saturates
noise floor
11
1
analogsignal
12
1
12 bit
8
1
8bit subset
minGain
Gain
usefulsignalrange
8
1
maxGain
The saturation capacity depends on the Gain.
noGain
*) Otherwise you get high fixed pattern noise at saturation.
15© Basler AG, 2006 Dierks: EMVA 1288
www.standard1288.org
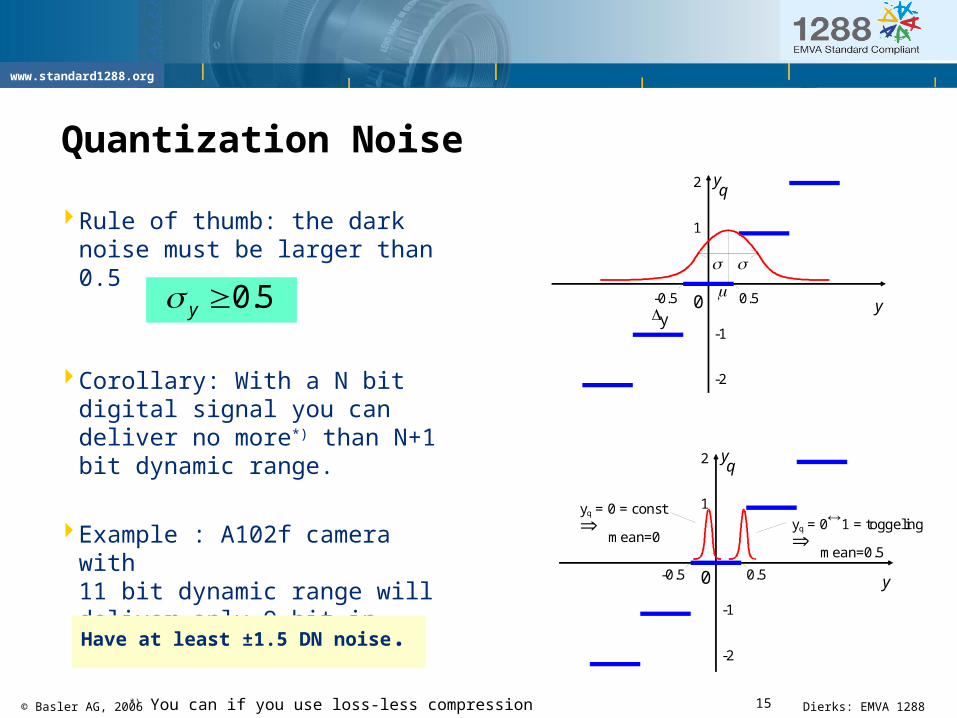
Quantization Noise
Rule of thumb: the dark noise must be larger than 0.5
Corollary: With a N bit digital signal you can deliver no more*) than N+1 bit dynamic range.
Example : A102f camera with 11 bit dynamic range will deliver only 9 bit in Mono8 mode. Use Mono16!
y
y
yq
1
2
-1
-2
0 0.5-0.55.0y
Have at least ±1.5 DN noise.
*) You can if you use loss-less compression
y
yq
1
2
-1
-2
0 0.5-0.5
yq = 0 = const
mean=0yq = 01 = toggeling
mean=0.5
16© Basler AG, 2006 Dierks: EMVA 1288
www.standard1288.org
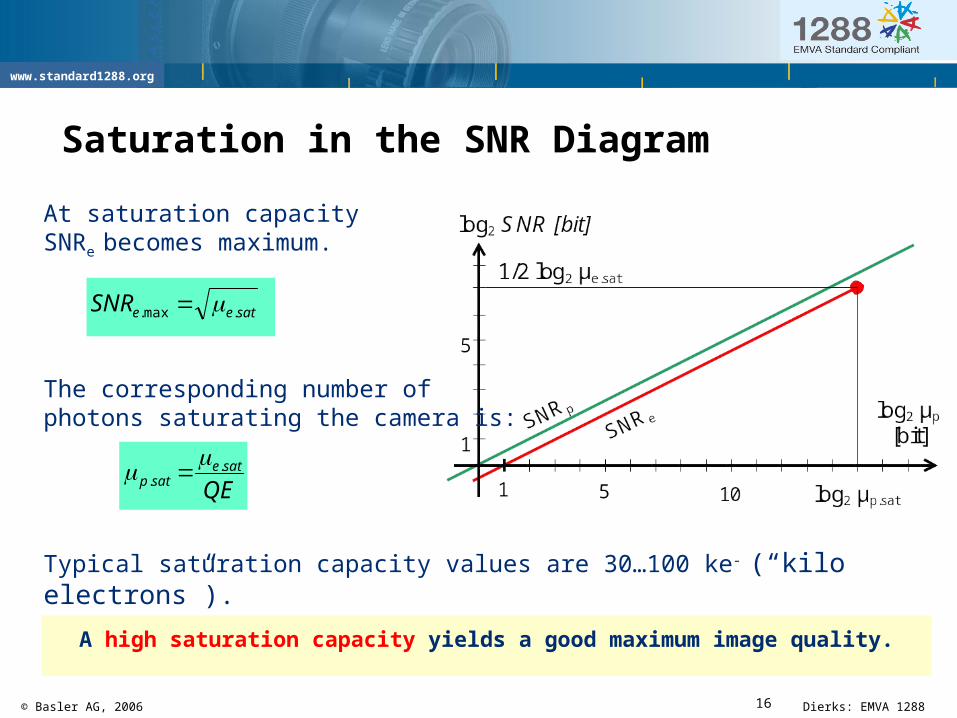
Saturation in the SNR Diagram
At saturation capacity SNRe becomes maximum.
The corresponding number of photons saturating the camera is:
Typical saturation capacity values are 30…100 ke- (“kilo electrons”).
sateeSNR .max.
A high saturation capacity yields a good maximum image quality.
QEsate
satp.
.
17© Basler AG, 2006 Dierks: EMVA 1288
www.standard1288.org
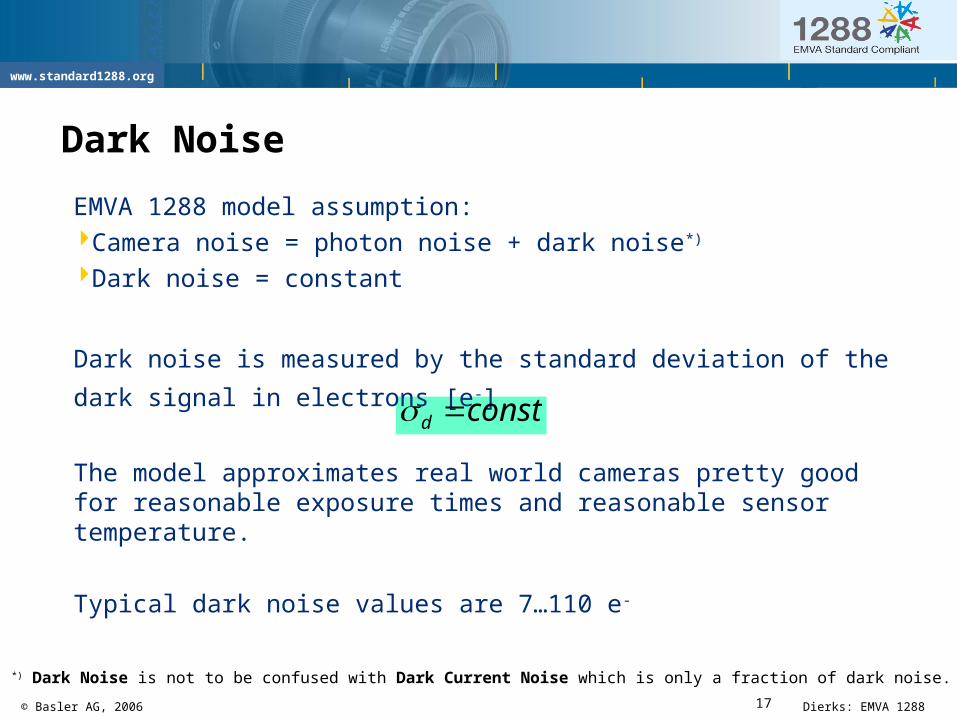
Dark Noise
EMVA 1288 model assumption:Camera noise = photon noise + dark noise*)
Dark noise = constant
Dark noise is measured by the standard deviation of the
dark signal in electrons [e-]
The model approximates real world cameras pretty good for reasonable exposure times and reasonable sensor temperature.
Typical dark noise values are 7…110 e-
constd
*) Dark Noise is not to be confused with Dark Current Noise which is only a fraction of dark noise.
18© Basler AG, 2006 Dierks: EMVA 1288
www.standard1288.org
Dark Noise in the SNR Diagram
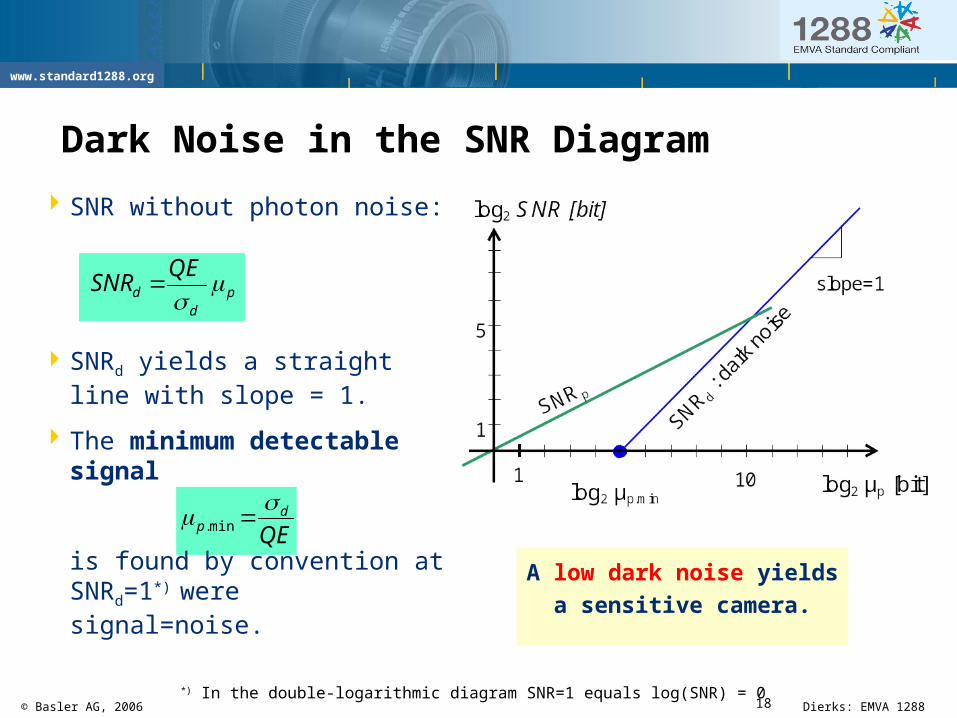
SNR without photon noise:
SNRd yields a straight line with slope = 1.
The minimum detectable signal
is found by convention at SNRd=1*) were signal=noise.
pd
d
QESNR
QEd
p
min.
A low dark noise yields
a sensitive camera.
*) In the double-logarithmic diagram SNR=1 equals log(SNR) = 0
19© Basler AG, 2006 Dierks: EMVA 1288
www.standard1288.org
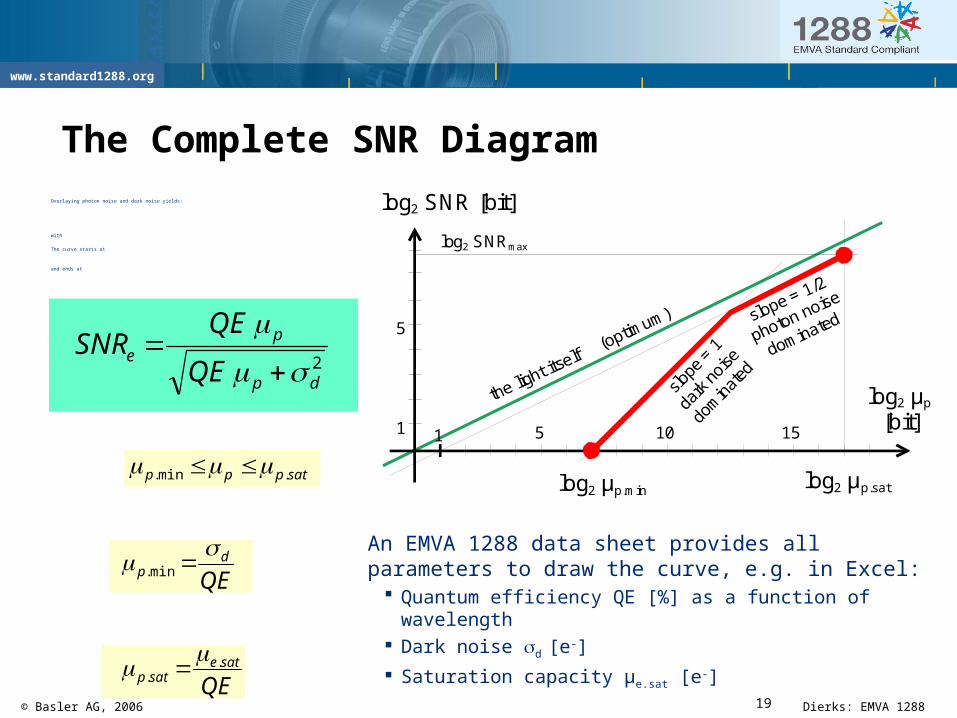
The Complete SNR DiagramOverlaying photon noise and dark noise yields:
with
The curve starts at
and ends at
2dp
pe
QE
QESNR
log2 SNR [bit]
slope = 1/2
photon noise
dominated
slope
= 1
dark
noi
se
dom
inat
ed
51 10 151
5
the light itself
(optimum)
log2 µp.min log2 µp.sat
log2 µp [bit]
log2 SNRmax
An EMVA 1288 data sheet provides all parameters to draw the curve, e.g. in Excel:
Quantum efficiency QE [%] as a function of wavelength Dark noise d [e-]
Saturation capacity µe.sat [e-]
satppp .min.
QEd
p
min.
QEsate
satp.
.

20© Basler AG, 2006 Dierks: EMVA 1288
www.standard1288.org
Dynamic Range
Limits within one image The brightest spot in the
image is limited by µp.sat
The darkest spot in the image is limited by µp.min
Dynamic Range = brightest / darkest spot
*) This equation holds true only for sensors with a linear response.
log2 SNR [bit]
51 10 151
5
log2 DYN
the light itself
(optimum)
log2 µp.min log2 µp.sat
log2 µp [bit]
d
sate
p
satpDYN
.
min.
.
A high dynamic range is especially important for natural scenes.
*)
21© Basler AG, 2006 Dierks: EMVA 1288
www.standard1288.org
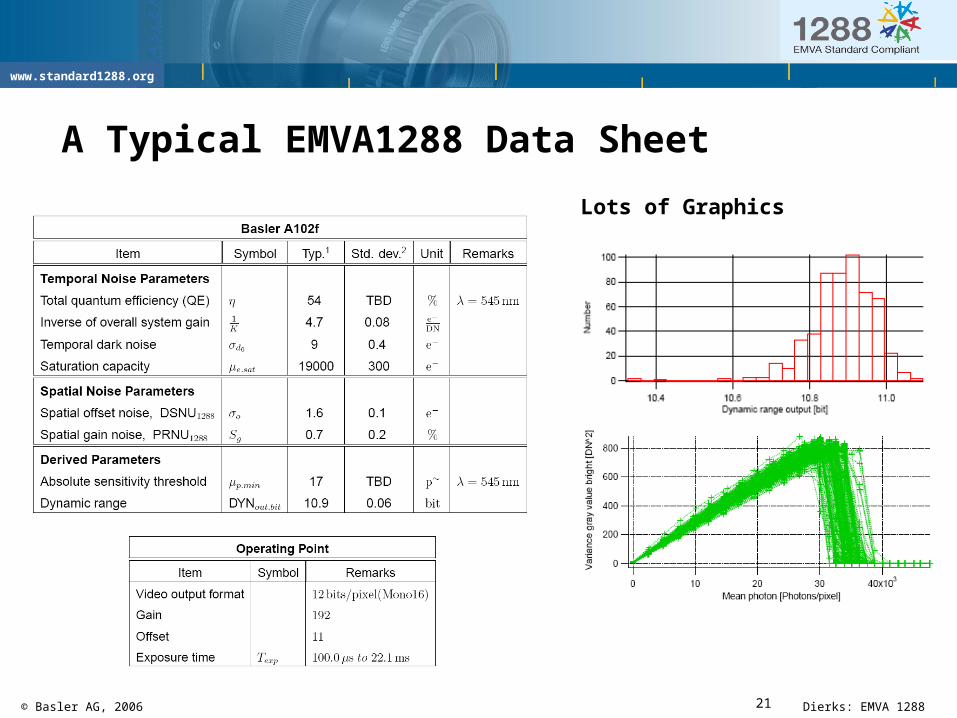
A Typical EMVA1288 Data Sheet
Lots of Graphics
22© Basler AG, 2006 Dierks: EMVA 1288
www.standard1288.org
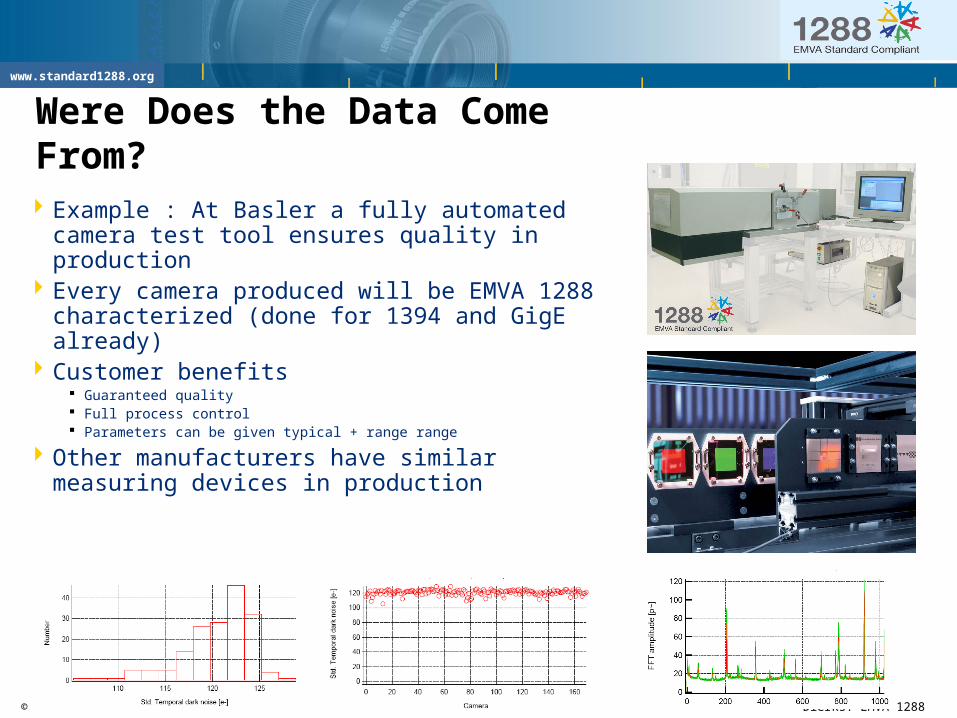
Were Does the Data Come From?
Example : At Basler a fully automated camera test tool ensures quality in production
Every camera produced will be EMVA 1288 characterized (done for 1394 and GigE already)
Customer benefits Guaranteed quality Full process control Parameters can be given typical + range range
Other manufacturers have similar measuring devices in production
23© Basler AG, 2006 Dierks: EMVA 1288
www.standard1288.org
Cam
era
Typ
e
No
ise
Typ
e
Sen
sor
Ty
pe
Res
olu
tio
n
Fra
me
Ra
te [
fps
]
Pix
el s
ize
[µm
]
QE
[%
] @
54
5 n
m
Dar
k n
ois
e [e
-]
Sat
. ca
pac
ity
[k
e-]
DS
NU
.128
8 [e
-]
PR
NU
.128
8 [%
]
1 / C
on
vers
in G
ain
[e
+/D
N]
Ab
s. S
en
sit
ivit
y [
p~
]
Dyn
am
ic r
ang
e [b
it]
SN
R.t
em
p m
ax [
bit
]
SN
R.t
ota
l m
ax
[bit
]
# p
ho
ton
s s
at
[bit
]
Gai
n [
raw
]
Off
set
[ra
w]
Vid
eo
Fo
rmat
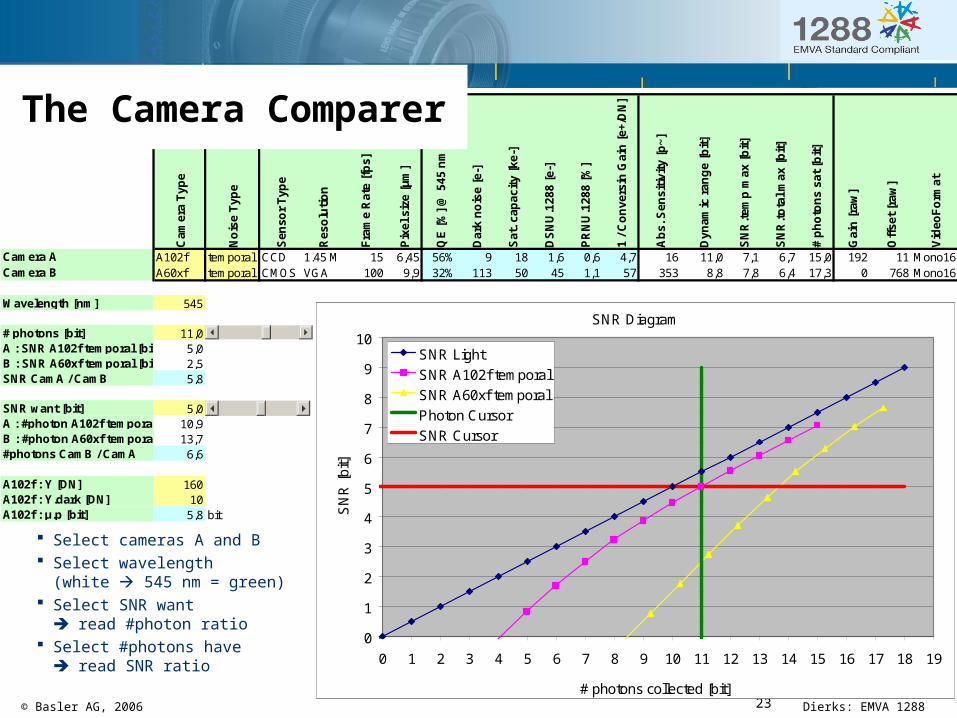
Camera A A102f temporal CCD 1.45 M 15 6,45 56% 9 18 1,6 0,6 4,7 16 11,0 7,1 6,7 15,0 192 11 Mono16Camera B A60xf temporal CMOS VGA 100 9,9 32% 113 50 45 1,1 57 353 8,8 7,8 6,4 17,3 0 768 Mono16
temporalWavelength [nm] 545 spatial
# photons [bit] 11,0A : SNR A102f temporal [bit] 5,0B : SNR A60xf temporal [bit] 2,5SNR CamA / CamB 5,8
SNR want [bit] 5,0A : #photon A102f temporal [bit]10,9B : #photon A60xf temporal [bit]13,7#photons CamB / CamA 6,6
A102f : Y [DN] 160A102f : Y.dark [DN] 10A102f : µ.p [bit] 5,8 bit
SNR Diagram
0
1
2
3
4
5
6
7
8
9
10
0 1 2 3 4 5 6 7 8 9 10 11 12 13 14 15 16 17 18 19
# photons collected [bit]
SN
R [
bit]
SNR Light
SNR A102f temporal
SNR A60xf temporal
Photon Cursor
SNR Cursor
The Camera Comparer
Select cameras A and B Select wavelength
(white 545 nm = green) Select SNR want
read #photon ratio Select #photons have
read SNR ratio
24© Basler AG, 2006 Dierks: EMVA 1288
www.standard1288.org
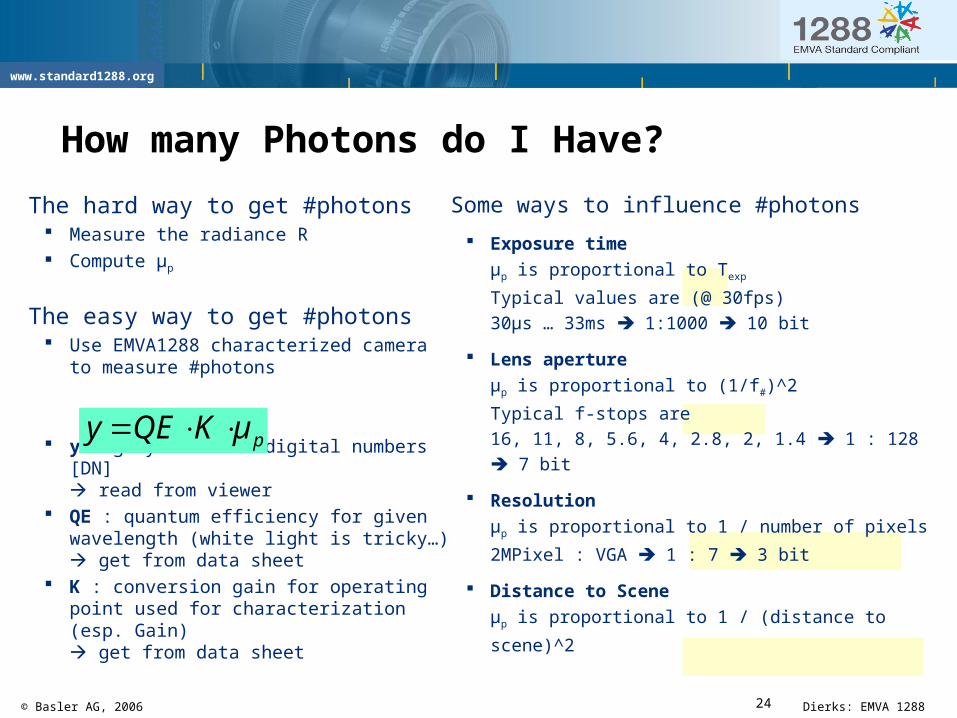
How many Photons do I Have?
The hard way to get #photons Measure the radiance R Compute µp
The easy way to get #photons Use EMVA1288 characterized camera to
measure #photons
y : grey value in digital numbers [DN] read from viewer
QE : quantum efficiency for given wavelength (white light is tricky…) get from data sheet
K : conversion gain for operating point used for characterization (esp. Gain) get from data sheet
Some ways to influence #photons
Exposure time
µp is proportional to Texp
Typical values are (@ 30fps)
30µs … 33ms 1:1000 10 bit
Lens aperture
µp is proportional to (1/f#)^2
Typical f-stops are
16, 11, 8, 5.6, 4, 2.8, 2, 1.4 1 : 128 7 bit
Resolution
µp is proportional to 1 / number of pixels
2MPixel : VGA 1 : 7 3 bit
Distance to Scene
µp is proportional to 1 / (distance to scene)^2
pµKQEy
25© Basler AG, 2006 Dierks: EMVA 1288
www.standard1288.org
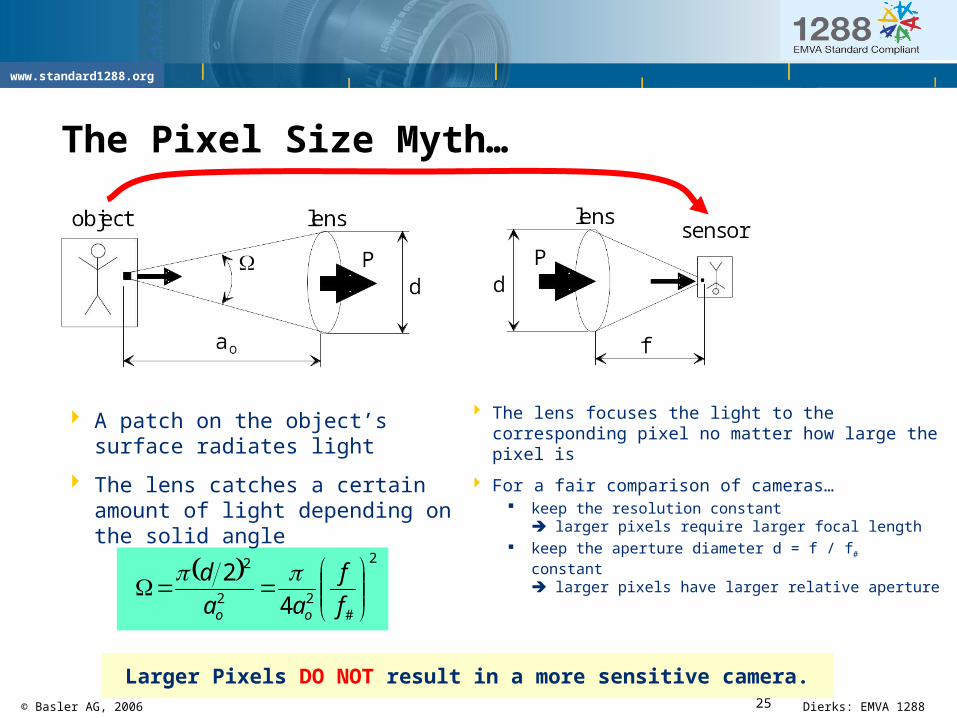
The Pixel Size Myth…
A patch on the object’s surface radiates light
The lens catches a certain amount of light depending on the solid angle
The lens focuses the light to the corresponding pixel no matter how large the pixel is
For a fair comparison of cameras… keep the resolution constant
larger pixels require larger focal length keep the aperture diameter d = f / f# constant
larger pixels have larger relative aperture
Larger Pixels DO NOT result in a more sensitive camera.
2
#22
2
4
2
f
f
aa
d
oo
26© Basler AG, 2006 Dierks: EMVA 1288
www.standard1288.org
2f
2d
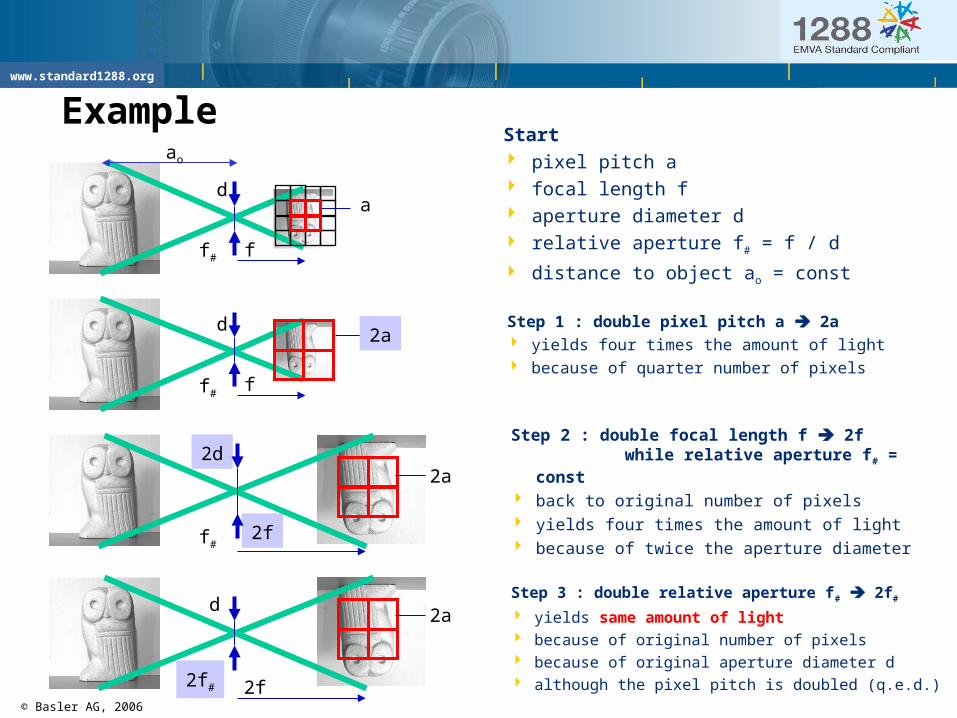
Example
d
d
d
f
f
2f
a
2a
2a
2a
Start pixel pitch a focal length f aperture diameter d relative aperture f# = f / d
distance to object ao = const
Step 1 : double pixel pitch a 2a yields four times the amount of light because of quarter number of pixels
Step 2 : double focal length f 2f while relative aperture f# = const
back to original number of pixels yields four times the amount of light because of twice the aperture diameter
f#
f#
f#
2f#
Step 3 : double relative aperture f# 2f#
yields same amount of light because of original number of pixels because of original aperture diameter d although the pixel pitch is doubled (q.e.d.)
ao
27© Basler AG, 2006 Dierks: EMVA 1288
www.standard1288.org
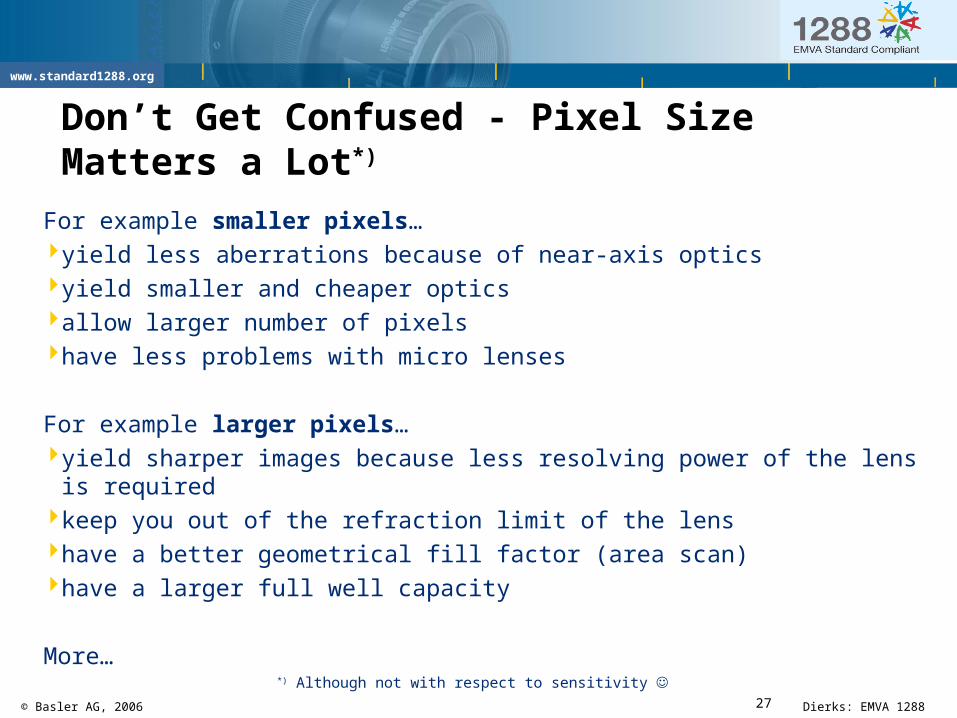
Don’t Get Confused - Pixel Size Matters a Lot*)
For example smaller pixels…yield less aberrations because of near-axis opticsyield smaller and cheaper opticsallow larger number of pixelshave less problems with micro lenses
For example larger pixels…yield sharper images because less resolving power of the lens is requiredkeep you out of the refraction limit of the lenshave a better geometrical fill factor (area scan)have a larger full well capacity
More…*) Although not with respect to sensitivity
28© Basler AG, 2006 Dierks: EMVA 1288
www.standard1288.org
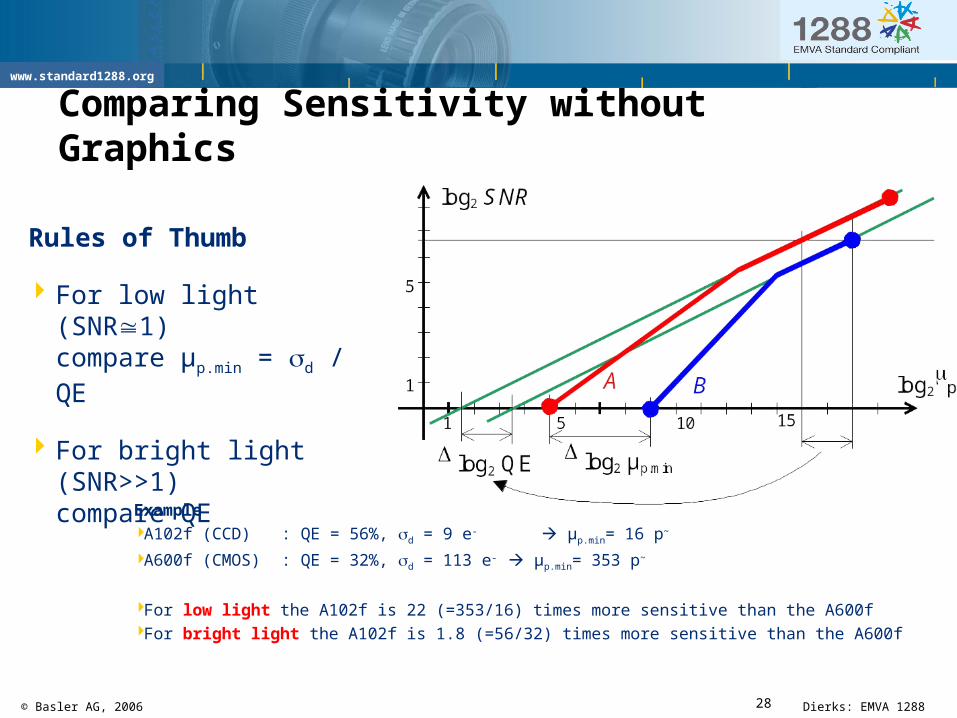
Comparing Sensitivity without Graphics
Rules of Thumb
For low light (SNR1) compare µp.min = d / QE
For bright light (SNR>>1) compare QE
Example A102f (CCD) : QE = 56%, d = 9 e- µp.min= 16 p~
A600f (CMOS) : QE = 32%, d = 113 e- µp.min= 353 p~
For low light the A102f is 22 (=353/16) times more sensitive than the A600fFor bright light the A102f is 1.8 (=56/32) times more sensitive than the A600f
29© Basler AG, 2006 Dierks: EMVA 1288
www.standard1288.org
Outline
Some BasicsTemporal Noise Spatial Noise
30© Basler AG, 2006 Dierks: EMVA 1288
www.standard1288.org
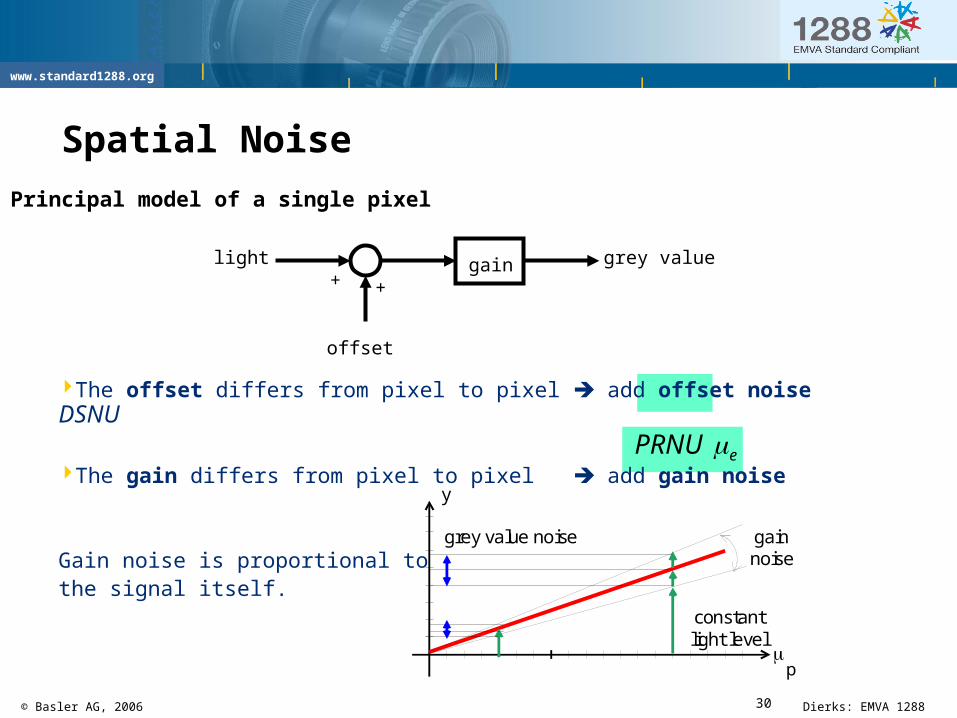
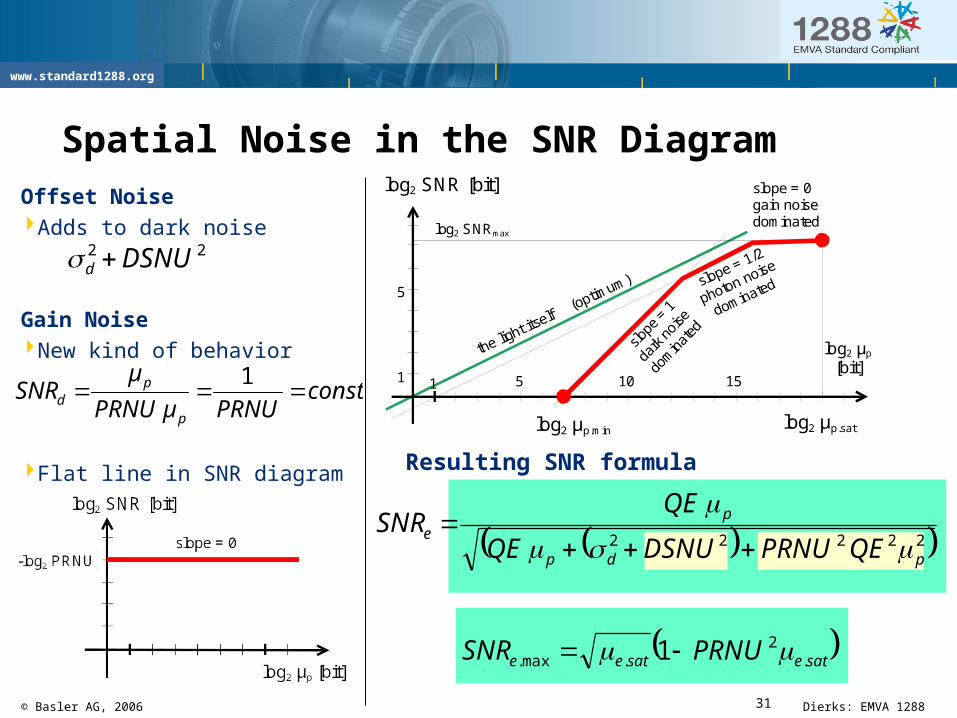
Spatial Noise
The offset differs from pixel to pixel add offset noise DSNU
The gain differs from pixel to pixel add gain noise
Gain noise is proportional tothe signal itself.
offset
gain++
grey valuelight
Principal model of a single pixel
p
y
gainnoise
constantlight level
grey value noise
ePRNU
31© Basler AG, 2006 Dierks: EMVA 1288
www.standard1288.org
Spatial Noise in the SNR DiagramOffset NoiseAdds to dark noise
Gain NoiseNew kind of behavior
Flat line in SNR diagram
log2 SNR [bit]
slope = 1/2
photon noise
dominated
slope
= 1
dark
noi
se
dom
inat
ed
51 10 151
5
the light itself
(optim
um)
log2 µp.min log2 µp.sat
log2 µp [bit]
log2 SNRmax
slope = 0gain noisedominated
22222pdp
pe
QEPRNUDSNUQE
QESNR
22 DSNUd
constPRNUµPRNU
µSNR
p
pd
1
Resulting SNR formula
satesatee PRNUSNR .2
.max. 1
32© Basler AG, 2006 Dierks: EMVA 1288
www.standard1288.org
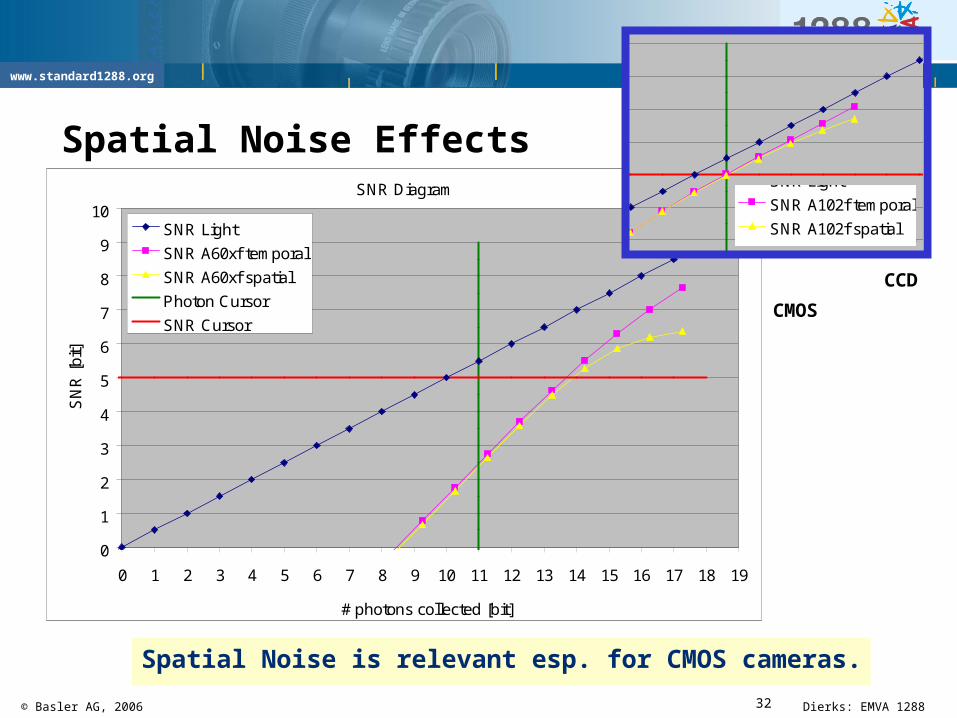
Spatial Noise Effects
Spatial Noise is relevant esp. for CMOS cameras.
SNR Diagram
0
1
2
3
4
5
6
7
8
9
10
0 1 2 3 4 5 6 7 8 9 10 11 12 13 14 15 16 17 18 19
# photons collected [bit]
SN
R [
bit]
SNR Light
SNR A60xf temporal
SNR A60xf spatial
Photon Cursor
SNR Cursor0
1
2
3
4
5
6
7
8
9
10
0 1 2 3 4 5 6 7 8 9 10 11 12 13 14 15 16 17 18 19
0
1
2
3
4
5
6
7
8
9
10
0 1 2 3 4 5 6 7 8 9 10 11 12 13 14 15 16 17 18 19
SNR Light
SNR A102f temporal
SNR A102f spatial
Photon Cursor
SNR Cursor
CMOS
CCD
33© Basler AG, 2006 Dierks: EMVA 1288
www.standard1288.org
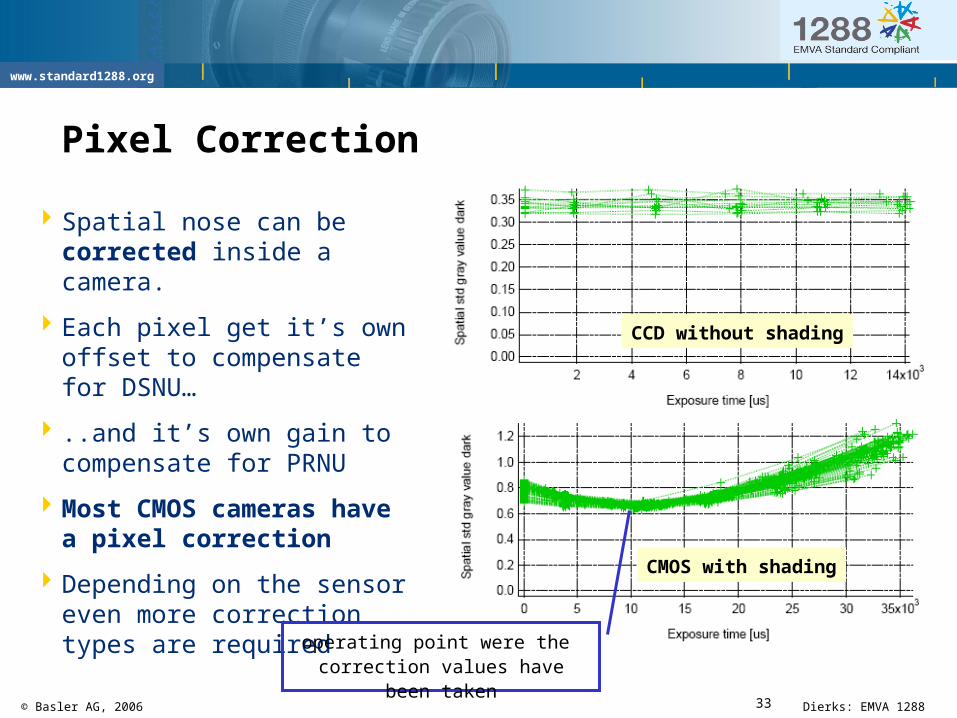
Pixel Correction
Spatial nose can be corrected inside a camera.
Each pixel get it’s own offset to compensate for DSNU…
..and it’s own gain to compensate for PRNU
Most CMOS cameras have a pixel correction
Depending on the sensor even more correction types are required
CMOS with shading
CCD without shading
operating point were the correction values have been taken
34© Basler AG, 2006 Dierks: EMVA 1288
www.standard1288.org
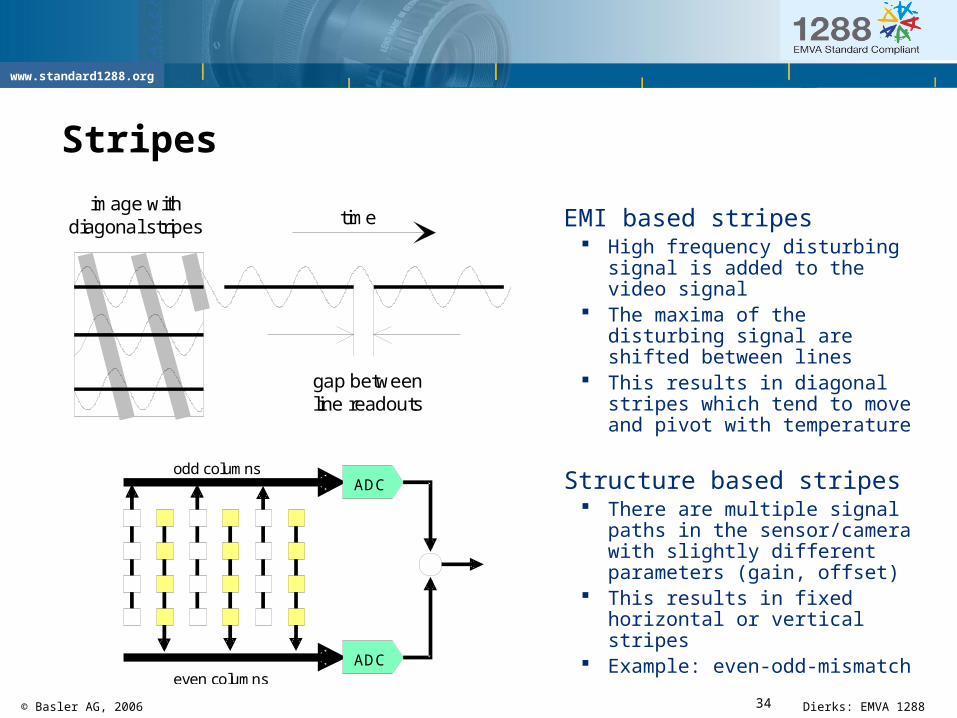
Stripes
EMI based stripes High frequency disturbing signal
is added to the video signal The maxima of the disturbing
signal are shifted between lines This results in diagonal stripes
which tend to move and pivot with temperature
Structure based stripes There are multiple signal paths
in the sensor/camera with slightly different parameters (gain, offset)
This results in fixed horizontal or vertical stripes
Example: even-odd-mismatch
gap betweenline readouts
timeimage with
diagonal stripes
odd columns
even columns
ADC
ADC
35© Basler AG, 2006 Dierks: EMVA 1288
www.standard1288.org
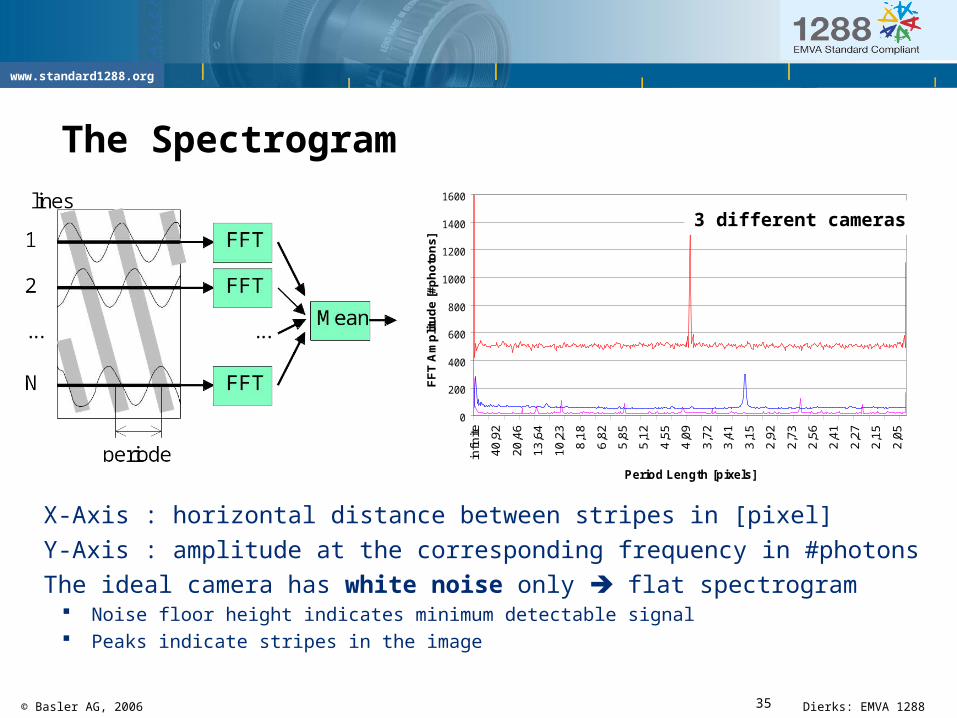
The Spectrogram
X-Axis : horizontal distance between stripes in [pixel]
Y-Axis : amplitude at the corresponding frequency in #photons
The ideal camera has white noise only flat spectrogram Noise floor height indicates minimum detectable signal Peaks indicate stripes in the image
0
200
400
600
800
1000
1200
1400
1600
infin
ite
40
,92
20
,46
13
,64
10
,23
8,1
8
6,8
2
5,8
5
5,1
2
4,5
5
4,0
9
3,7
2
3,4
1
3,1
5
2,9
2
2,7
3
2,5
6
2,4
1
2,2
7
2,1
5
2,0
5
Period Length [pixels]
FF
T A
mp
litu
de
[#
ph
oto
ns
]
3 different cameras
36© Basler AG, 2006 Dierks: EMVA 1288
www.standard1288.org
Conclusion
With EMVA 1288 data sheet you can… compare the sensitivity of cameras with respect to temporal and spatial noise
Remember: Gain doesn’t matter Pixel size doesn’t matter Nothing beats having enough light
Get Started: Get the camera comparer and play around with the parameters. Get a camera with EMVA1288 data sheet and determine
the #photons in your application.
37© Basler AG, 2006 Dierks: EMVA 1288
www.standard1288.org
Thank you for your attention!
More info : www.basler-vc.com > Technologies > EMVA 1288
Contact me : [email protected]