Embed Size (px)
Citation preview
Comparing Conceptual Structures:Consensus, Conflict, Correspondence and Contrast
Mildred L. G. Shaw and Brian R. GainesKnowledge Science Institute
University of CalgaryAlberta, Canada T2N 1N4
Abstract
One problem of eliciting knowledge from several experts is that experts may share only parts oftheir terminologies and conceptual systems. Experts may use the same term for differentconcepts, use different terms for the same concept, use the same term for the same concept, oruse different terms and have different concepts. Moreover, clients who use an expert system haveeven less likelihood of sharing terms and concepts with the experts who produced it. This paperoutlines a methodology for eliciting and recognizing such individual differences. It can be usedto focus discussion between experts on those differences between them which require resolution,enabling them to classify them in terms of differing terminologies, levels of abstraction,disagreements, and so on. The methodology promotes the full exploration of the conceptualframework of a domain of expertise by encouraging experts to operate in a “brain-storming”mode as a group, using differing viewpoints to develop a rich framework. It reduces socialpressures forcing an invalid consensus by providing objective analysis of separately elicitedconceptual systems.
1 Introduction
The elicitation of knowledge from one expert presents enough problems that elicitation frommany might seem an unnecessary complication. However, a major reason for practical interest inexpert systems is that in many domains, such as quality control, expertise is essentiallydistributed over many experts, and the purpose of the system is to bring it together (Hayes-Roth1984). More fundamentally, the use of multiple experts in ‘brain-storming’ or synectics sessionshas been found valuable in problem-solving, and is an attractive technique to prevent individualsexperts ‘blocking’ and failing fully to explore and express their conceptual domains.
In a well-established scientific domain it is reasonable to suppose that there will be consensusamong experts as to relevant distinctions and terms—that is, objective knowledge independent ofindividuals (Popper, 1968). However, the “expert systems” approach to system development hasbeen developed for domains where such objective knowledge is not yet available, and theprimary sources of knowledge are the conceptual structures of individual experts (Gaines,1987b). When multiple experts are available for a domain where a consensus has not yet beenreached, it is important to be able to compare their conceptual structures, both among themselvesand with those of potential clients for the resultant knowledge-based system (Gaines & Shaw1989).
It is important to note in dealing with multiple experts that consensual agreement upon domainconcepts is only one of many significant possibilities. Experts may legitimately have differentterminologies for the same domain concept. They may describe it at different levels of
2
abstraction. One expert may describe a concept in operational terms and another in descriptiveterms. They may also legitimately use the same terminology for different domain concepts. Theymay be using the same term distinguished by different contexts. One expert may have a verydifferent conceptual framework or strategy from another. These differences may be carriedthrough to an expert system design that allows users to obtain advice based on different andmixed sources of expertise. Compton and Jansen (1989) have found this important in practicalsystem development, and suggest that the diversity of conceptual structures is fundamental to theway in which, through insight, individuals subsume data as knowledge. These differences maybe carried through to an expert system design that allows users to obtain advice based ondifferent and mixed sources of expertise. Boose & Bradshaw (1987) have incoporporatedconflicting expertise in Aquinas enabling the user to ask for ask for dissenting opinions.
Thus, in a knowledge acquisition system, it is important not to attempt to force a false consensuson a group of experts on the assumption that there is some ‘correct’ terminology and conceptualframework. However, it is also important to bring to light differences among the experts andmake these clearly available for discussion. Some of them may reflect errors in elicitation, othersdifferences in terminology, others differences in conceptual frameworks. In any event, thediscussion of these differences is in itself a significant stage in the knowledge elicitation process.
The next section establishes a theoretical framework for knowledge elicitation from mutipleexperts. The following sections describe a practical methodology based on this framework, acomputer tool implementing this methodology, and results of using this tool to apply themethodology to practical knowledge elicitation.
2 Conceptual Systems in a Domain Community
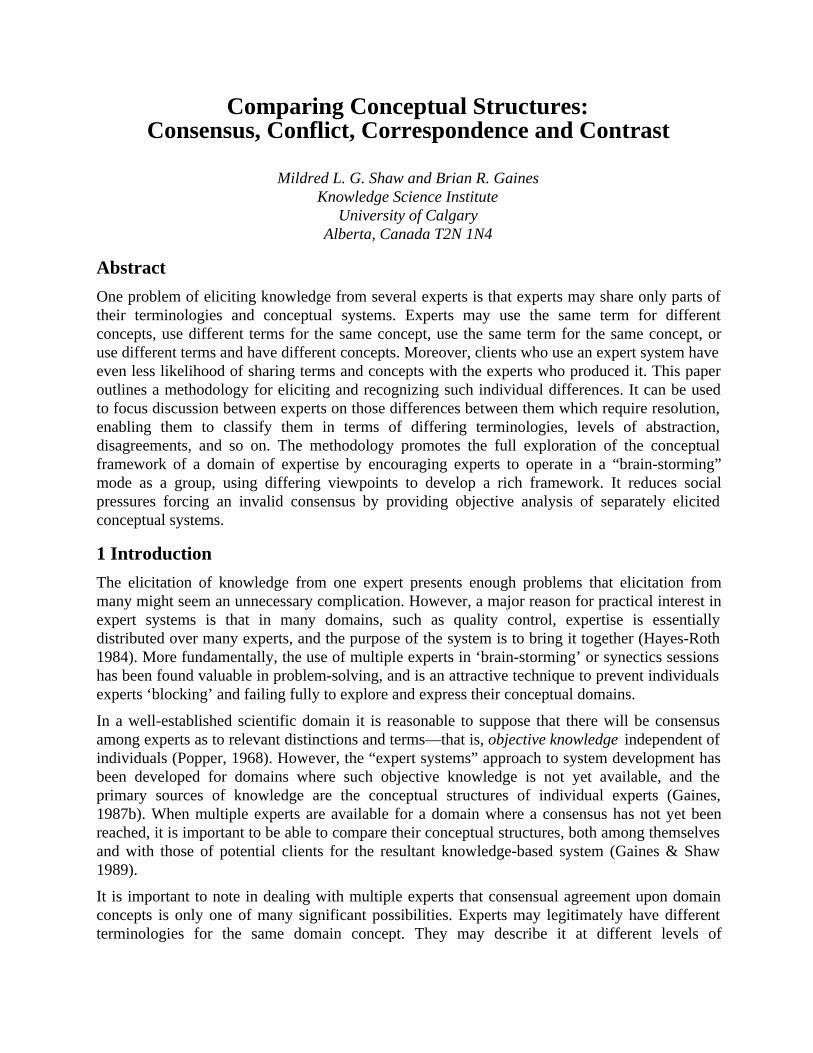
Figure 1 shows a domain in which an expert system could be constructed from the knowledge ofexisting experts. The two “experts” shown, Expert 1 and Expert 2, are best thought of as roles inthe individuals involved. These expert roles are distinguished by involving conceptual systemswhich, when applied to problem solving in the domain, lead to recognition of the individualsplaying the roles as beings “experts” in the domain. The individuals will also have other rolesinvolving other conceptual systems appropriate to other domains in which they may, or may not,be experts.
conceptualsystem
Expert 2Expert 1
Domain
conceptualsystem
Figure 1 Experts acting in the same domain
3
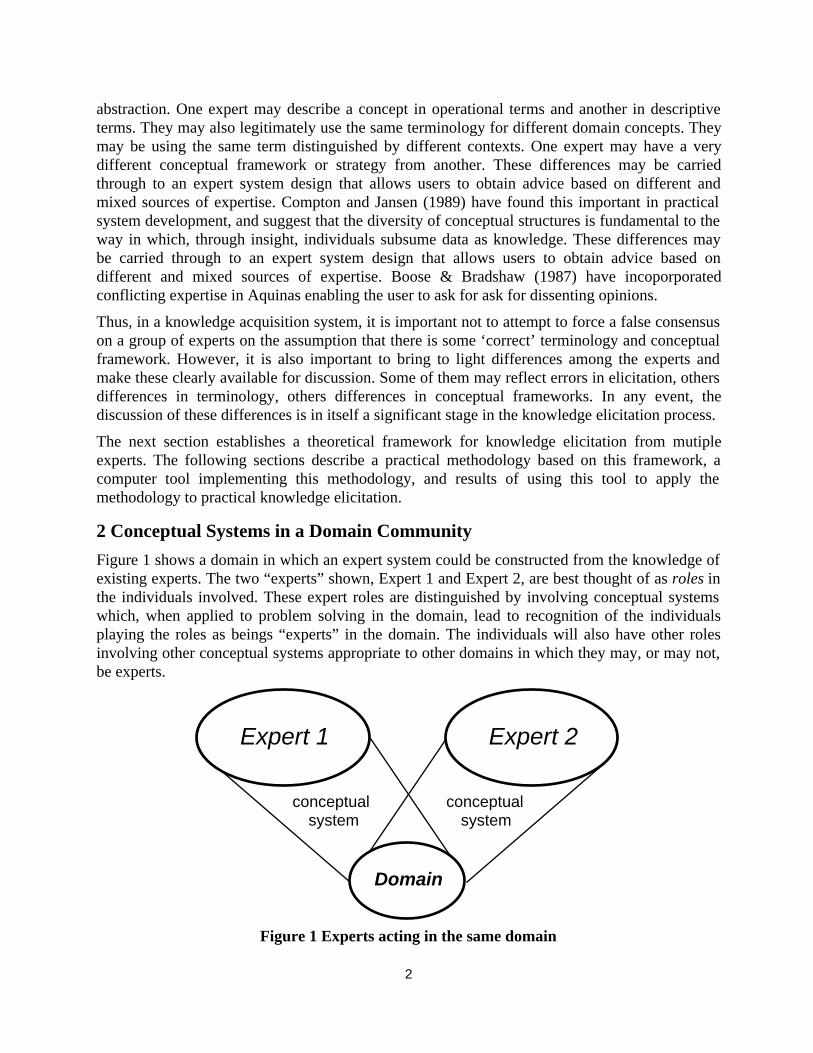
The figure shows an overlap in the two conceptual systems indicating corresponding concepts.The experts will each have distinctions and terms for expressing the concepts involved. Thepossible overlaps between distinctions and terms leads to four relations which can occur betweenparts of the conceptual systems as summarized in Figure 2 and illustrated in Figures 3 through 6.
Terminology
Attr
ibut
es
Same
Sam
e
Different
Diff
eren
tConsensus
ContrastConflict
Correspondence
Experts use terminology and concepts in the
same way
Experts use different
terminology for the same concepts
Experts usesame terminology
for different concepts
Experts differ in terminology and
concepts
Figure 2 Consensus, conflict, correspondence and contrast among experts
In Figure 3: consensus arises if the conceptual systems assign the same term to the samedistinction.
ConceptualSystem
Expert/Client 2
Terminologyfor Domain
Distinctionsin Domain
ConceptualSystem
Expert/Client 1
SameTerminology
SameDistinction
term
term
term
term
term
term
term
term
term
term
term
termte
rm
term
Figure 3 Consensus when the same terms are used for the same distinctions
In Figure 4: conflict arises if the conceptual systems assign the same term to differentdistinctions.

4
ConceptualSystem
Expert/Client 2
Terminologyfor Domain
Distinctionsin Domain
ConceptualSystem
Expert/Client 1
SameTerminology
DifferentDistinctions
term
term
term
term
term
term
term
term
term
term
term
termte
rm
term
Figure 4 Conflict when the same terms are used for different distinctions
In Figure 5: correspondence arises if the conceptual systems assign different terms to the samedistinction.
ConceptualSystem
Expert/Client 2
Terminologyfor Domain
Distinctionsin Domain
ConceptualSystem
Expert/Client 1
DifferentTerminology
SameDistinction
term
term
term
term
term
term
term
term
term
term
term
termte
rm
term
Figure 5 Correspondence when different terms are used for the same distinctions

5
In Figure 6: contrast arises if the conceptual systems assign different terms to differentdistinctions.
ConceptualSystem
Expert/Client 2
Terminologyfor Domain
Distinctionsin Domain
ConceptualSystem
Expert/Client 1
DifferentTerminology
DifferentDistinctions
term
term
term
term
term
term
term
term
term
term
term
termte
rm
term
Figure 6 Contrast when different terms are used for different distinctions
The recognition of consensual concepts is important because it establishes a basis forcommunication using shared concepts and terminologies.
The recognition of conflicting concepts is important because it establishes a basis for avoidingconfusion over the labeling of differing concepts with same term.
The recognition of corresponding concepts is important because it establishes a basis for mutualunderstanding of differing terms through the availability of common concepts.
The recognition of contrasting concepts is important because it establishes that there are aspectsof the differing expertise about which communication and understanding may be very difficult,even though this should not lead to confusion. Such contrasts are more common than is generallyrealized. For example, it is possible to derive the same theorem in mathematics either by using analgebraic perspective, or a geometric one. There is nothing in common in these two approachesexcept the final result. It may still be possible to discuss the same domain using consensual andcorresponding concepts that were not fundamental to the problem solving activities.
These considerations also apply to clients of the experts whose concepts and terminologies maybe evaluated along these four dimensions in relation to those of the expert. The recognition ofpossible conflicts between the experts’ and clients’ use of terminology, and the provision of avariety of corresponding concepts, are major factors in the usability of an expert system.
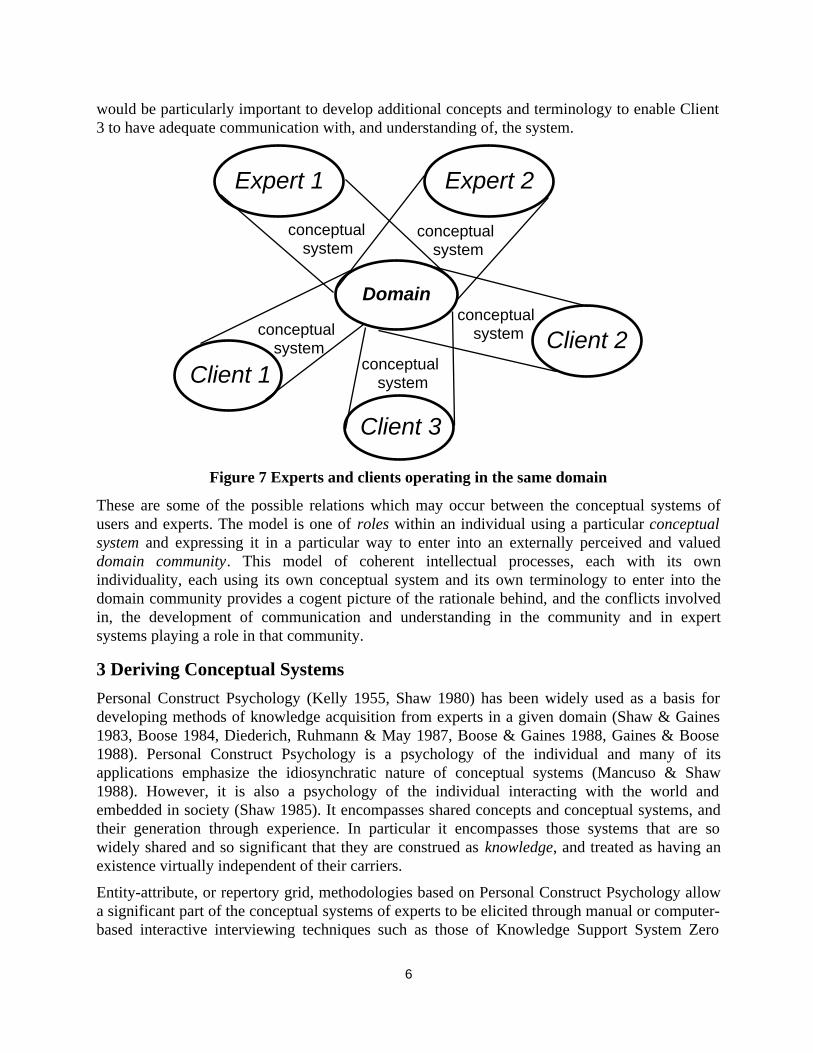
In Figure 7, Client 1 is shown as having overlap only with Expert 1. He or she has no overlapwhatsoever with any other individual in the figure, expert or user. Client 2 has overlap both withClient 3 and with the two experts. He or she is able to understand the concepts of Expert 2 and toa lesser extent those of Expert 1. Client 3 has no overlap with either expert, but has sufficientoverlap with Client 2 that Client 2 can explain to him the advice given. In the development of anexpert system, Client 1 may choose not to take advantage of Expert 2’s expertise in the system. It
6
would be particularly important to develop additional concepts and terminology to enable Client3 to have adequate communication with, and understanding of, the system.
conceptualsystem
Expert 2Expert 1
conceptualsystem
Domain
Client 1
Client 3
Client 2conceptual
system
conceptualsystem
conceptualsystem
Figure 7 Experts and clients operating in the same domain
These are some of the possible relations which may occur between the conceptual systems ofusers and experts. The model is one of roles within an individual using a particular conceptualsystem and expressing it in a particular way to enter into an externally perceived and valueddomain community. This model of coherent intellectual processes, each with its ownindividuality, each using its own conceptual system and its own terminology to enter into thedomain community provides a cogent picture of the rationale behind, and the conflicts involvedin, the development of communication and understanding in the community and in expertsystems playing a role in that community.
3 Deriving Conceptual Systems
Personal Construct Psychology (Kelly 1955, Shaw 1980) has been widely used as a basis fordeveloping methods of knowledge acquisition from experts in a given domain (Shaw & Gaines1983, Boose 1984, Diederich, Ruhmann & May 1987, Boose & Gaines 1988, Gaines & Boose1988). Personal Construct Psychology is a psychology of the individual and many of itsapplications emphasize the idiosynchratic nature of conceptual systems (Mancuso & Shaw1988). However, it is also a psychology of the individual interacting with the world andembedded in society (Shaw 1985). It encompasses shared concepts and conceptual systems, andtheir generation through experience. In particular it encompasses those systems that are sowidely shared and so significant that they are construed as knowledge, and treated as having anexistence virtually independent of their carriers.
Entity-attribute, or repertory grid, methodologies based on Personal Construct Psychology allowa significant part of the conceptual systems of experts to be elicited through manual or computer-based interactive interviewing techniques such as those of Knowledge Support System Zero
7
(KSS0, Gaines 1987a, Gaines & Shaw 1987) and Aquinas (Boose and Bradshaw 1987). Theresultant data structure is one in which the terms for entities and attributes in a domain have beenspecified by the expert, together with the values of those entities along the dimensions of theattributes. The entities are usually concrete items in the domain whose nature, definition andnames can be agreed by experts and clients. The attributes reflect individual conceptual systemsand may be used, and labeled, idiosynchratically.
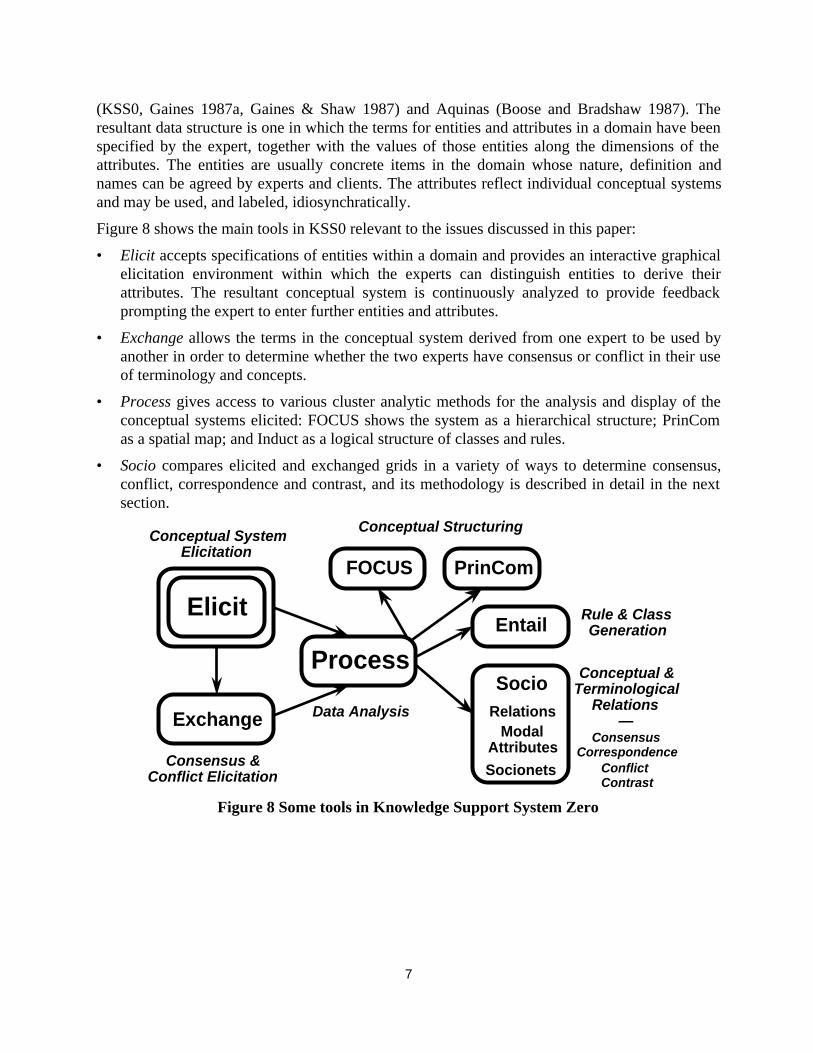
Figure 8 shows the main tools in KSS0 relevant to the issues discussed in this paper:
• Elicit accepts specifications of entities within a domain and provides an interactive graphicalelicitation environment within which the experts can distinguish entities to derive theirattributes. The resultant conceptual system is continuously analyzed to provide feedbackprompting the expert to enter further entities and attributes.
• Exchange allows the terms in the conceptual system derived from one expert to be used byanother in order to determine whether the two experts have consensus or conflict in their useof terminology and concepts.
• Process gives access to various cluster analytic methods for the analysis and display of theconceptual systems elicited: FOCUS shows the system as a hierarchical structure; PrinComas a spatial map; and Induct as a logical structure of classes and rules.
• Socio compares elicited and exchanged grids in a variety of ways to determine consensus,conflict, correspondence and contrast, and its methodology is described in detail in the nextsection.
Elicit
Exchange
Process
FOCUS PrinCom
Entail
ModalAttributes
Socionets
SocioRelations
Conceptual Structuring
Rule & ClassGeneration
Conceptual & Terminological
Relations—
ConsensusCorrespondence
Conflict Contrast
Conceptual System Elicitation
Data Analysis
Consensus & Conflict Elicitation
Figure 8 Some tools in Knowledge Support System Zero
8
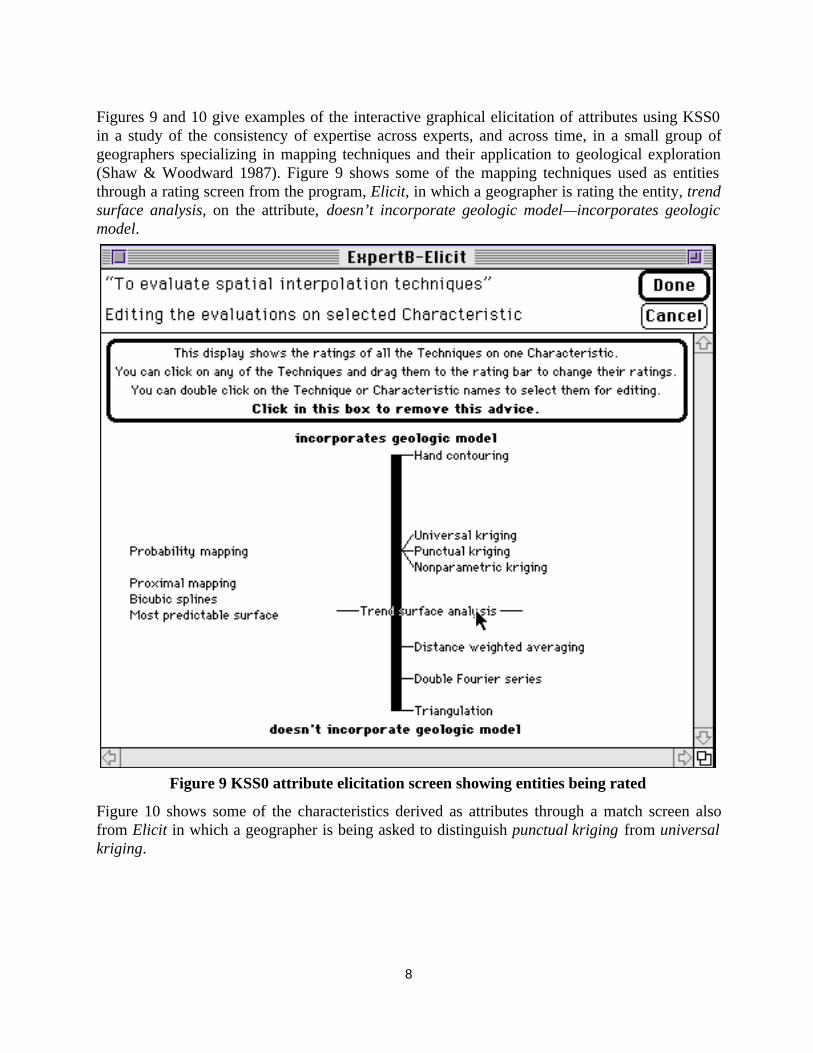
Figures 9 and 10 give examples of the interactive graphical elicitation of attributes using KSS0in a study of the consistency of expertise across experts, and across time, in a small group ofgeographers specializing in mapping techniques and their application to geological exploration(Shaw & Woodward 1987). Figure 9 shows some of the mapping techniques used as entitiesthrough a rating screen from the program, Elicit, in which a geographer is rating the entity, trendsurface analysis, on the attribute, doesn’t incorporate geologic model—incorporates geologicmodel.
Figure 9 KSS0 attribute elicitation screen showing entities being rated
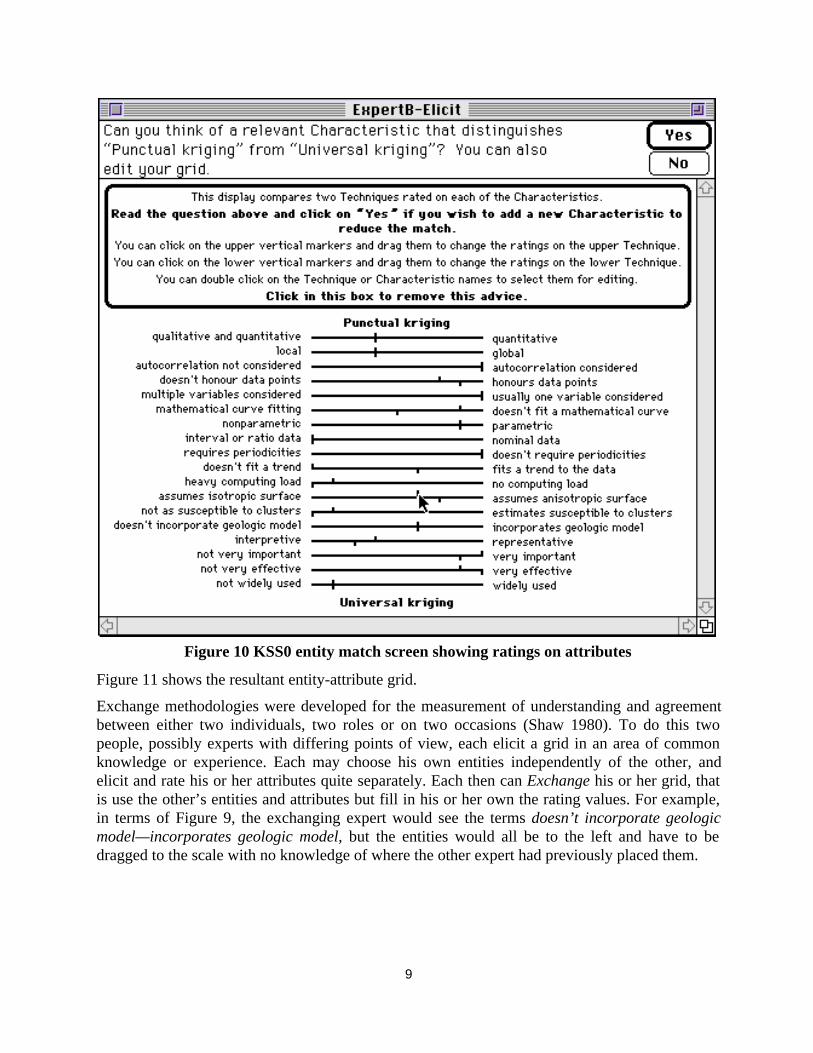
Figure 10 shows some of the characteristics derived as attributes through a match screen alsofrom Elicit in which a geographer is being asked to distinguish punctual kriging from universalkriging.
9
Figure 10 KSS0 entity match screen showing ratings on attributes
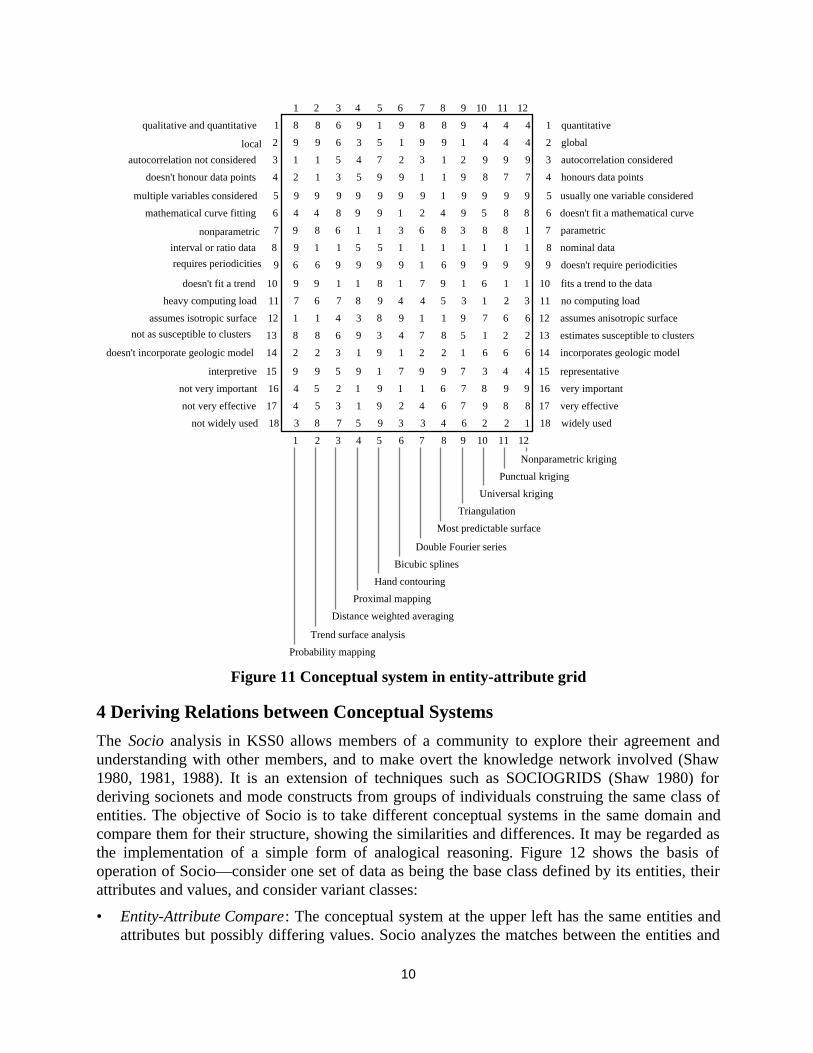
Figure 11 shows the resultant entity-attribute grid.
Exchange methodologies were developed for the measurement of understanding and agreementbetween either two individuals, two roles or on two occasions (Shaw 1980). To do this twopeople, possibly experts with differing points of view, each elicit a grid in an area of commonknowledge or experience. Each may choose his own entities independently of the other, andelicit and rate his or her attributes quite separately. Each then can Exchange his or her grid, thatis use the other’s entities and attributes but fill in his or her own the rating values. For example,in terms of Figure 9, the exchanging expert would see the terms doesn’t incorporate geologicmodel—incorporates geologic model, but the entities would all be to the left and have to bedragged to the scale with no knowledge of where the other expert had previously placed them.
10
1 2 3 4 5 6 7 8 9 10 11 12
qualitative and quantitative 1 8 8 6 9 1 9 8 8 9 4 4 4 1 quantitative
local 2 9 9 6 3 5 1 9 9 1 4 4 4 2 global
autocorrelation not considered 3 1 1 5 4 7 2 3 1 2 9 9 9 3 autocorrelation considered
doesn't honour data points 4 2 1 3 5 9 9 1 1 9 8 7 7 4 honours data points
multiple variables considered 5 9 9 9 9 9 9 9 1 9 9 9 9 5 usually one variable considered
mathematical curve fitting 6 4 4 8 9 9 1 2 4 9 5 8 8 6 doesn't fit a mathematical curve
nonparametric 7 9 8 6 1 1 3 6 8 3 8 8 1 7 parametric
interval or ratio data 8 9 1 1 5 5 1 1 1 1 1 1 1 8 nominal data
requires periodicities 9 6 6 9 9 9 9 1 6 9 9 9 9 9 doesn't require periodicities
doesn't fit a trend 10 9 9 1 1 8 1 7 9 1 6 1 1 10 fits a trend to the data
heavy computing load 11 7 6 7 8 9 4 4 5 3 1 2 3 11 no computing load
assumes isotropic surface 12 1 1 4 3 8 9 1 1 9 7 6 6 12 assumes anisotropic surface
not as susceptible to clusters 13 8 8 6 9 3 4 7 8 5 1 2 2 13 estimates susceptible to clusters
doesn't incorporate geologic model 14 2 2 3 1 9 1 2 2 1 6 6 6 14 incorporates geologic model
interpretive 15 9 9 5 9 1 7 9 9 7 3 4 4 15 representative
not very important 16 4 5 2 1 9 1 1 6 7 8 9 9 16 very important
not very effective 17 4 5 3 1 9 2 4 6 7 9 8 8 17 very effective
not widely used 18 3 8 7 5 9 3 3 4 6 2 2 1 18 widely used
1 2 3 4 5 6 7 8 9 10 11 12
Nonparametric kriging
Punctual kriging
Universal kriging
Triangulation
Most predictable surface
Double Fourier series
Bicubic splines
Hand contouring
Proximal mapping
Distance weighted averaging
Trend surface analysis
Probability mapping
Figure 11 Conceptual system in entity-attribute grid
4 Deriving Relations between Conceptual Systems
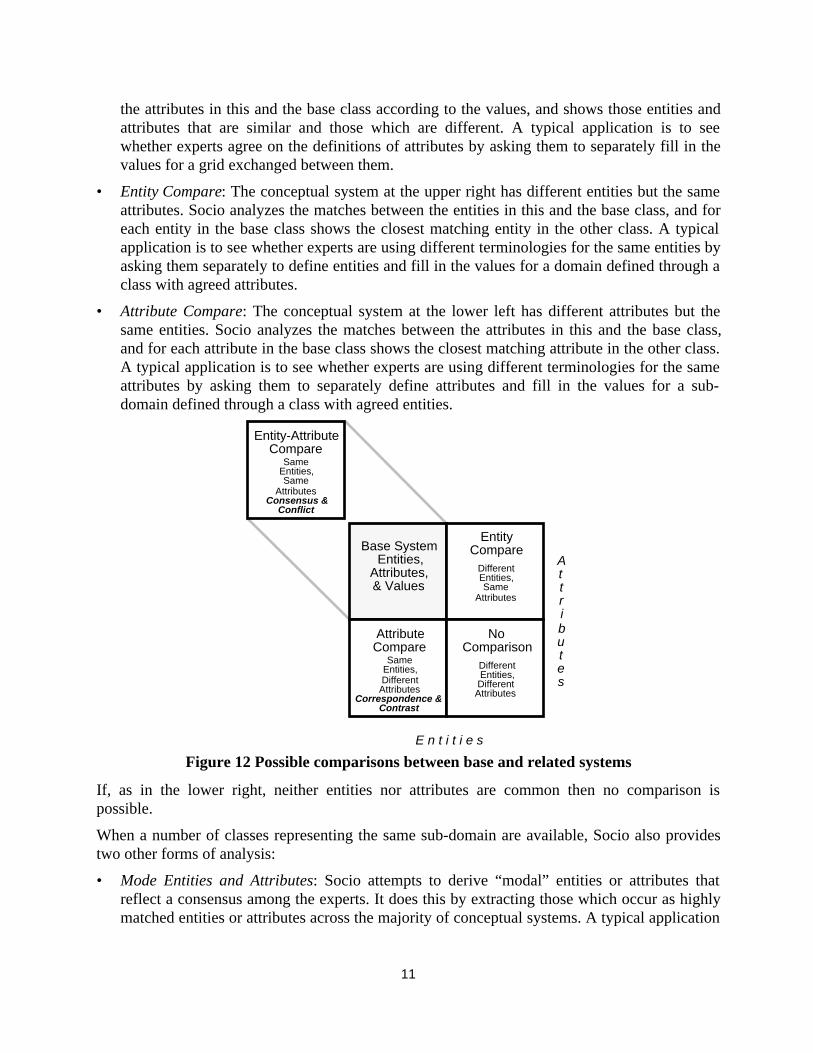
The Socio analysis in KSS0 allows members of a community to explore their agreement andunderstanding with other members, and to make overt the knowledge network involved (Shaw1980, 1981, 1988). It is an extension of techniques such as SOCIOGRIDS (Shaw 1980) forderiving socionets and mode constructs from groups of individuals construing the same class ofentities. The objective of Socio is to take different conceptual systems in the same domain andcompare them for their structure, showing the similarities and differences. It may be regarded asthe implementation of a simple form of analogical reasoning. Figure 12 shows the basis ofoperation of Socio—consider one set of data as being the base class defined by its entities, theirattributes and values, and consider variant classes:
• Entity-Attribute Compare: The conceptual system at the upper left has the same entities andattributes but possibly differing values. Socio analyzes the matches between the entities and
11
the attributes in this and the base class according to the values, and shows those entities andattributes that are similar and those which are different. A typical application is to seewhether experts agree on the definitions of attributes by asking them to separately fill in thevalues for a grid exchanged between them.
• Entity Compare: The conceptual system at the upper right has different entities but the sameattributes. Socio analyzes the matches between the entities in this and the base class, and foreach entity in the base class shows the closest matching entity in the other class. A typicalapplication is to see whether experts are using different terminologies for the same entities byasking them separately to define entities and fill in the values for a domain defined through aclass with agreed attributes.
• Attribute Compare: The conceptual system at the lower left has different attributes but thesame entities. Socio analyzes the matches between the attributes in this and the base class,and for each attribute in the base class shows the closest matching attribute in the other class.A typical application is to see whether experts are using different terminologies for the sameattributes by asking them to separately define attributes and fill in the values for a sub-domain defined through a class with agreed entities.
Base SystemEntities,
Attributes,& Values
DifferentEntities,Same
Attributes
EntityCompare
SameEntities,DifferentAttributes
Correspondence & Contrast
AttributeCompare
DifferentEntities,DifferentAttributes
NoComparison
SameEntities,Same
AttributesConsensus &
Conflict
Entity-AttributeCompare
Attributes
E n t i t i e s
Figure 12 Possible comparisons between base and related systems
If, as in the lower right, neither entities nor attributes are common then no comparison ispossible.
When a number of classes representing the same sub-domain are available, Socio also providestwo other forms of analysis:
• Mode Entities and Attributes: Socio attempts to derive “modal” entities or attributes thatreflect a consensus among the experts. It does this by extracting those which occur as highlymatched entities or attributes across the majority of conceptual systems. A typical application
12
is to reach consensus on critical concepts that are associated with a rich vocabulary atdiffering levels of abstraction.
• Socionets: Socio derives a socionet showing the degree to which each expert is able to makethe same distinctions as another expert, even if they use different terminology. A typicalapplication is to validate the knowledge acquisition process by determining whether thestructure derived conforms with known relations between the experts.
5 Consensus, Conflict, Correspondence and Contrast
Using the concepts developed above it is possible to develop a complete methodology foreliciting and analyzing consensus, conflict, correspondence and contrast in a group of experts,and implement this as an automatic process using the tools in KSS0. The methodology has threephases shown in Figures 13 through 15.
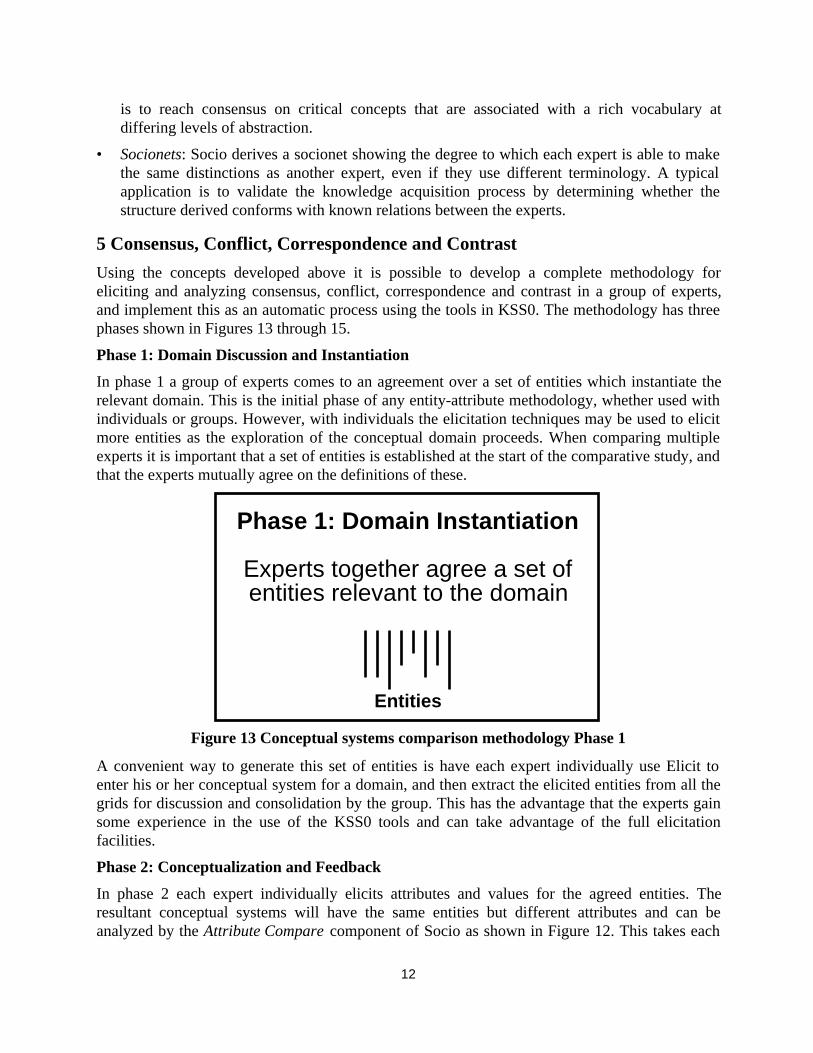
Phase 1: Domain Discussion and Instantiation
In phase 1 a group of experts comes to an agreement over a set of entities which instantiate therelevant domain. This is the initial phase of any entity-attribute methodology, whether used withindividuals or groups. However, with individuals the elicitation techniques may be used to elicitmore entities as the exploration of the conceptual domain proceeds. When comparing multipleexperts it is important that a set of entities is established at the start of the comparative study, andthat the experts mutually agree on the definitions of these.
Entities
Phase 1: Domain Instantiation
Experts together agree a set of entities relevant to the domain
Figure 13 Conceptual systems comparison methodology Phase 1
A convenient way to generate this set of entities is have each expert individually use Elicit toenter his or her conceptual system for a domain, and then extract the elicited entities from all thegrids for discussion and consolidation by the group. This has the advantage that the experts gainsome experience in the use of the KSS0 tools and can take advantage of the full elicitationfacilities.
Phase 2: Conceptualization and Feedback
In phase 2 each expert individually elicits attributes and values for the agreed entities. Theresultant conceptual systems will have the same entities but different attributes and can beanalyzed by the Attribute Compare component of Socio as shown in Figure 12. This takes each

13
attribute in one grid and determines the best matching attribute in the other grid, if there is one.The result is a mapping from the attributes in one expert’s grid to those in another’s as shown inFigure 14.
EntitiesEntities
Phase 2: Conceptualization
Experts individually conceptualize entities in terms of attributes and values
Values1 Values2
Attributes with arrows between showCorrespondences
Attributes with no arrows between showContrasts
Attributes1 Attributes2
G1 G2
Arrows go to best match above threshold
Figure 14 Conceptual systems comparison methodology Phase 2
In evaluating this mapping we are not particularly interested in the terminology used but ratherwhether one expert has an attribute that can be used to make the same distinctions between theentities as does the other expert, regardless of whether these distinctions are called by the sameterms. If such a correspondence occurs then the experts have a basis for mutual understanding ofthe underlying concept.
If an attribute in one system has no matching attribute in the other then it stands in contrast to allthe other expert’s attributes, and it may be very difficult for the other expert to understand theuse of this term.
Note that the arrows in Figure 14 need not be symmetric. Attribute A in G1 may be best matchedby attribute B in G2, but attribute B in G2 may be best matched by attribute C in G1. The onlyconstraint is that if an attribute has an incoming arrow then it will have an outgoing arrow.
Thus, the second phase provides the basis for analysis of correspondence and contrast as alreadydiscussed.
14
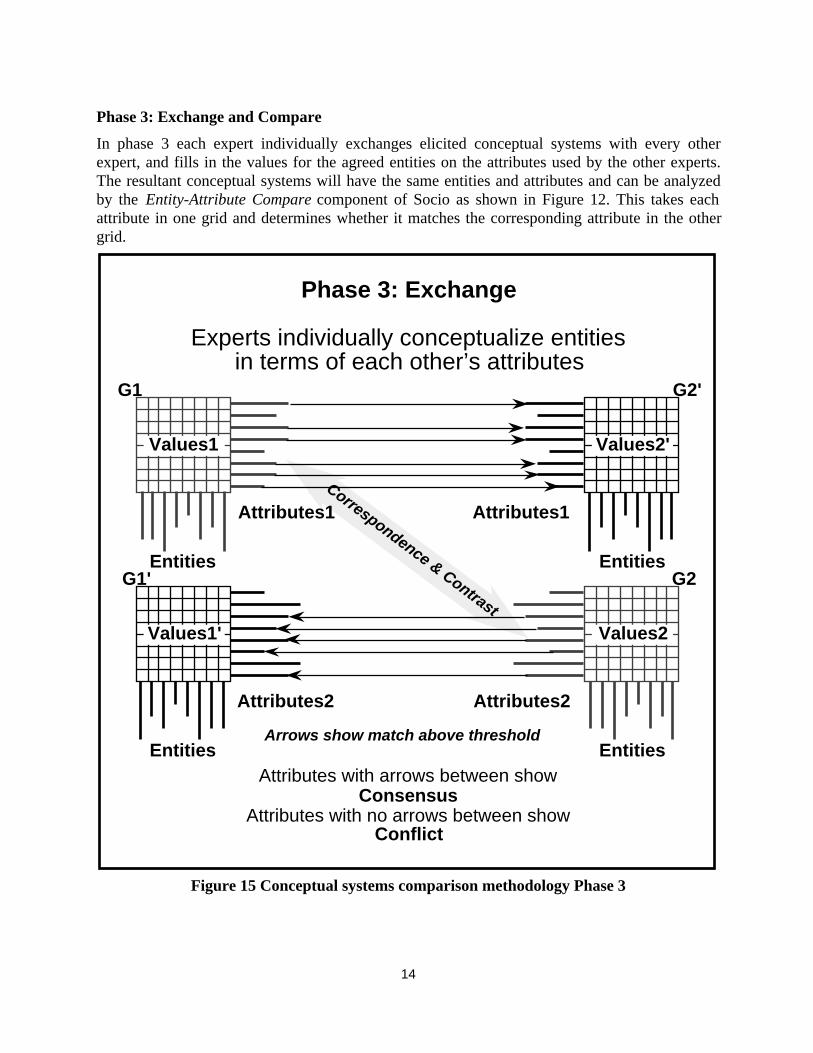
Phase 3: Exchange and Compare
In phase 3 each expert individually exchanges elicited conceptual systems with every otherexpert, and fills in the values for the agreed entities on the attributes used by the other experts.The resultant conceptual systems will have the same entities and attributes and can be analyzedby the Entity-Attribute Compare component of Socio as shown in Figure 12. This takes eachattribute in one grid and determines whether it matches the corresponding attribute in the othergrid.
Correspondence & Contrast
Phase 3: Exchange
Experts individually conceptualize entities in terms of each other’s attributes
Attributes with arrows between showConsensus
Attributes with no arrows between showConflict
Entities
Values1
Attributes1
Entities
Values2
Attributes2
Entities
Values1'
Attributes2
Entities
Values2'
Attributes1
G1
G2G1'
G2'
Arrows show match above threshold
Figure 15 Conceptual systems comparison methodology Phase 3

15
The result is a map showing consensus when attributes with the same labels are used in the sameway and conflict when they are not as shown in Figure 15. Thus, the third phase provides thebasis for analysis of consensus and conflict as already discussed.
Figure 15 also shows the correspondence and contrast relations analyzed in phase 2 as a relationsbetween two of the grids used in phase 3. Thus, for two experts, four grids obtained by oneelicitation and one exchange each, are sufficient to classify the relations between attributes interms of consensus, conflict , correspondence and contrast. The methodology scales up linearlyfor each expert, so that n experts will be involved in n elicitations, one base elicitation and n-1exchanges.
These three phases result in the experts’ conceptual systems having become overt and inter-related. They lead naturally to later phases in which classes, objects and rules can be developedincorporating consensual, corresponding, and some of the contrasting attributes as kernelknowledge and, possibly, the conflicting and remaining contrasting attributes as ‘other opinions.’
6 Examples of the Methodology in Action
This section gives an example of the methodology in action using data from the study ofgeographers specializing in mapping techniques previously cited (Shaw & Woodward 1987).
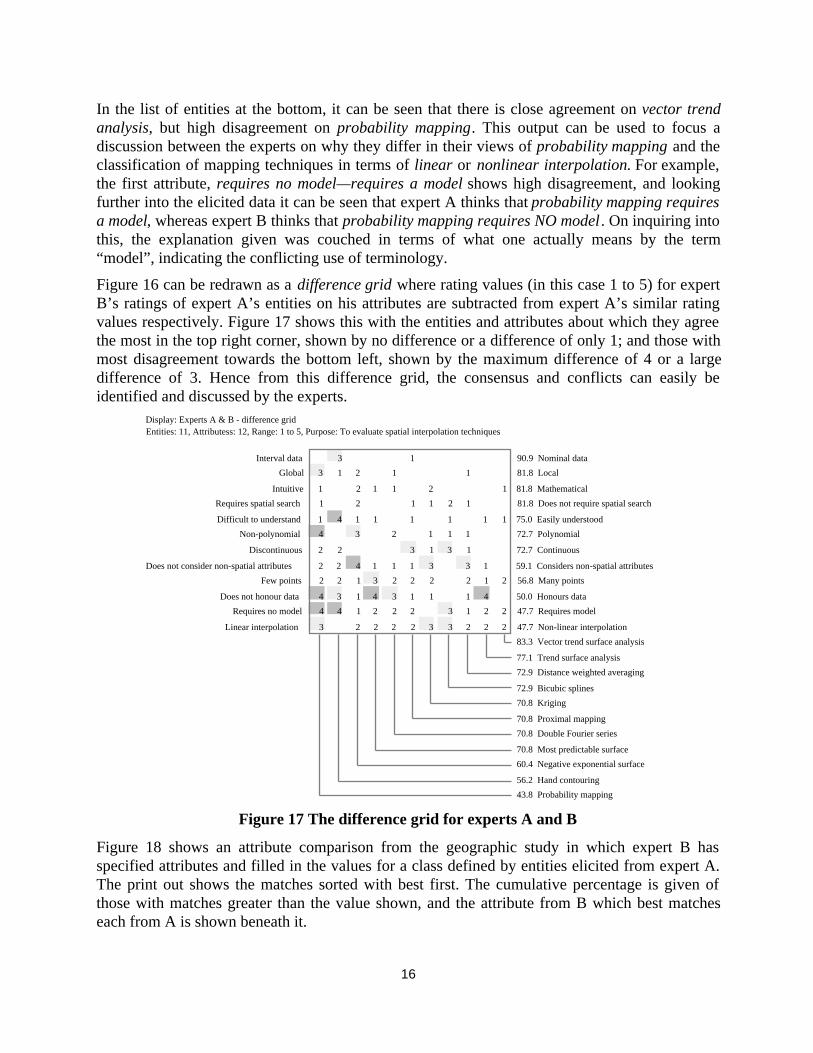
Figure 16 shows an entity-attribute comparison from the geographic study in which expert B hasfilled in the values for a class defined by entities and attributes elicited from expert A. The printout shows the matches sorted with best first. The cumulative percentage is given of the numberof attributes with matches greater than the value shown. In the list of attributes at the top, it canbe seen that there is consensus on interval data—nominal data, but conflict on requires nomodel—requires a model and linear interpolation—nonlinear interpolation. There is clearconsensus on the top four attributes, clear conflict on the lower five, and uncertainty about theremaining three.
G1:G2 33.3% over 80.0 (ExpertB attribute-consistency-with ExpertA) 1: 8.3% ≥ 90.9 A2: Interval data - Nominal data 2: 81.8 A4: Global - Local 3: 81.8 A5: Intuitive - Mathematical 4: 33.3% ≥ 81.8 A6: Requires spatial search - Does not require spatial search 5: 41.7% ≥ 75.0 A10: Difficult to understand - Easily understood 6: 72.7 A3: Non-polynomial - Polynomial 7: 58.3% ≥ 72.7 A7: Discontinuous - Continuous 8: 66.7% ≥ 59.1 A12: Does not consider non-spatial attributes - Considers non -
spatial 9: 75.0% ≥ 56.8 A11: Few points - Many points 10: 83.3% ≥ 50.0 A8: Does not honour data - Honours data 11: 47.7 A1: Requires no model - Requires model 12: 100.0% ≥ 47.7 A9: Linear interpolation - Non-linear interpolation
G1:G2 8.3% over 80.0 (ExpertB entity-consistency-with ExpertA) 1: 9.1% ≥ 83.3 E11: Vector trend surface analysis 2: 18.2% ≥ 77.1 E2: Trend surface analysis 3: 72.9 E4: Distance weighted averaging 4: 36.4% ≥ 72.9 E7: Bicubic splines 5: 70.8 E3: Kriging 6: 70.8 E5: Proximal mapping 7: 70.8 E8: Double Fourier series 8: 72.7% ≥ 70.8 E9: Most predictable surface 9: 81.8% ≥ 60.4 E10: Negative exponential surface 10: 90.9% ≥ 56.2 E6: Hand contouring 11: 100.0% ≥ 43.8 E1: Probability mapping
Figure 16 Entity-attribute comparison of expert B with expert A
16
In the list of entities at the bottom, it can be seen that there is close agreement on vector trendanalysis, but high disagreement on probability mapping. This output can be used to focus adiscussion between the experts on why they differ in their views of probability mapping and theclassification of mapping techniques in terms of linear or nonlinear interpolation. For example,the first attribute, requires no model—requires a model shows high disagreement, and lookingfurther into the elicited data it can be seen that expert A thinks that probability mapping requiresa model, whereas expert B thinks that probability mapping requires NO model . On inquiring intothis, the explanation given was couched in terms of what one actually means by the term“model”, indicating the conflicting use of terminology.
Figure 16 can be redrawn as a difference grid where rating values (in this case 1 to 5) for expertB’s ratings of expert A’s entities on his attributes are subtracted from expert A’s similar ratingvalues respectively. Figure 17 shows this with the entities and attributes about which they agreethe most in the top right corner, shown by no difference or a difference of only 1; and those withmost disagreement towards the bottom left, shown by the maximum difference of 4 or a largedifference of 3. Hence from this difference grid, the consensus and conflicts can easily beidentified and discussed by the experts.
Display: Experts A & B - difference gridEntities: 11, Attributess: 12, Range: 1 to 5, Purpose: To evaluate spatial interpolation techniques
Interval data 3 1 90.9 Nominal data
Global 3 1 2 1 1 81.8 Local
Intuitive 1 2 1 1 2 1 81.8 Mathematical
Requires spatial search 1 2 1 1 2 1 81.8 Does not require spatial search
Difficult to understand 1 4 1 1 1 1 1 1 75.0 Easily understood
Non-polynomial 4 3 2 1 1 1 72.7 Polynomial
Discontinuous 2 2 3 1 3 1 72.7 Continuous
Does not consider non-spatial attributes 2 2 4 1 1 1 3 3 1 59.1 Considers non-spatial attributes
Few points 2 2 1 3 2 2 2 2 1 2 56.8 Many points
Does not honour data 4 3 1 4 3 1 1 1 4 50.0 Honours data
Requires no model 4 4 1 2 2 2 3 1 2 2 47.7 Requires model
Linear interpolation 3 2 2 2 2 3 3 2 2 2 47.7 Non-linear interpolation
83.3 Vector trend surface analysis
77.1 Trend surface analysis
72.9 Distance weighted averaging
72.9 Bicubic splines
70.8 Kriging
70.8 Proximal mapping
70.8 Double Fourier series
70.8 Most predictable surface
60.4 Negative exponential surface
56.2 Hand contouring
43.8 Probability mapping
Figure 17 The difference grid for experts A and B
Figure 18 shows an attribute comparison from the geographic study in which expert B hasspecified attributes and filled in the values for a class defined by entities elicited from expert A.The print out shows the matches sorted with best first. The cumulative percentage is given ofthose with matches greater than the value shown, and the attribute from B which best matcheseach from A is shown beneath it.
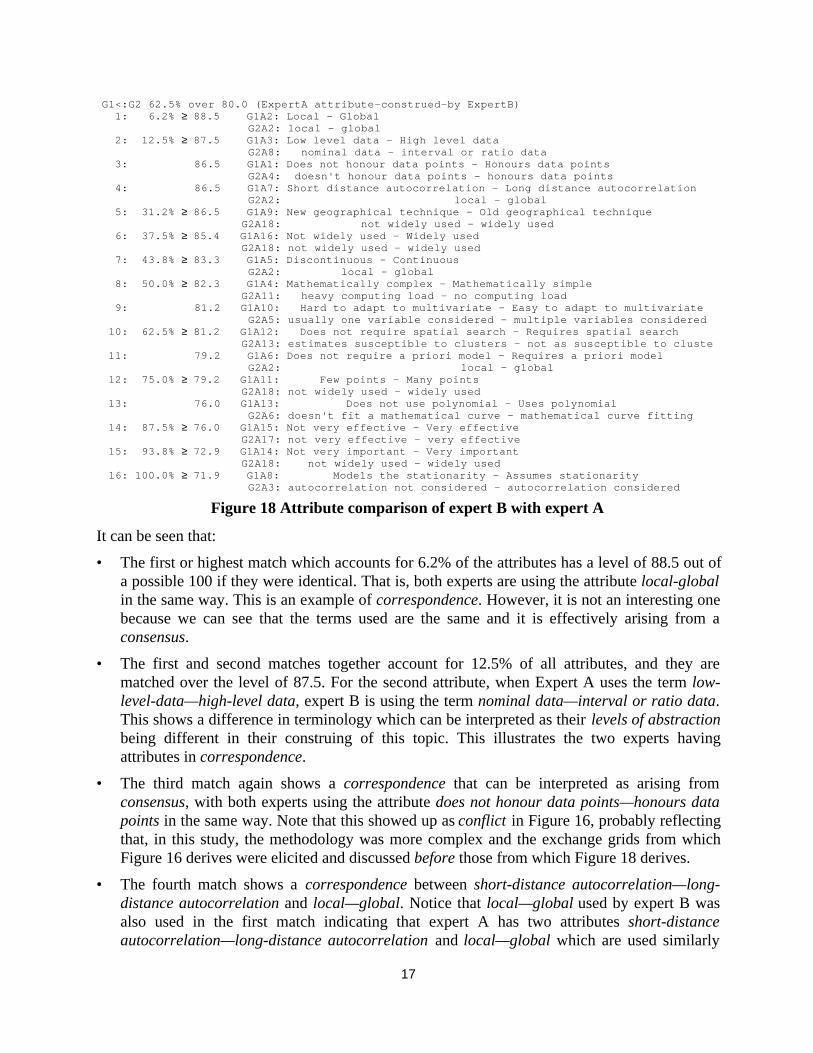
17
G1<:G2 62.5% over 80.0 (ExpertA attribute-construed-by ExpertB) 1: 6.2% ≥ 88.5 G1A2: Local - Global G2A2: local - global 2: 12.5% ≥ 87.5 G1A3: Low level data - High level data G2A8: nominal data - interval or ratio data 3: 86.5 G1A1: Does not honour data points - Honours data points G2A4: doesn't honour data points - honours data points 4: 86.5 G1A7: Short distance autocorrelation - Long distance autocorrelation G2A2: local - global 5: 31.2% ≥ 86.5 G1A9: New geographical technique - Old geographical technique G2A18: not widely used - widely used 6: 37.5% ≥ 85.4 G1A16: Not widely used - Widely used G2A18: not widely used - widely used 7: 43.8% ≥ 83.3 G1A5: Discontinuous - Continuous G2A2: local - global 8: 50.0% ≥ 82.3 G1A4: Mathematically complex - Mathematically simple G2A11: heavy computing load - no computing load 9: 81.2 G1A10: Hard to adapt to multivariate - Easy to adapt to multivariate G2A5: usually one variable considered - multiple variables considered 10: 62.5% ≥ 81.2 G1A12: Does not require spatial search - Requires spatial search G2A13: estimates susceptible to clusters - not as susceptible to clusters 11: 79.2 G1A6: Does not require a priori model - Requires a priori model G2A2: local - global 12: 75.0% ≥ 79.2 G1A11: Few points - Many points G2A18: not widely used - widely used 13: 76.0 G1A13: Does not use polynomial - Uses polynomial G2A6: doesn't fit a mathematical curve - mathematical curve fitting 14: 87.5% ≥ 76.0 G1A15: Not very effective - Very effective G2A17: not very effective - very effective 15: 93.8% ≥ 72.9 G1A14: Not very important - Very important G2A18: not widely used - widely used 16: 100.0% ≥ 71.9 G1A8: Models the stationarity - Assumes stationarity G2A3: autocorrelation not considered - autocorrelation considered
Figure 18 Attribute comparison of expert B with expert A
It can be seen that:
• The first or highest match which accounts for 6.2% of the attributes has a level of 88.5 out ofa possible 100 if they were identical. That is, both experts are using the attribute local-globalin the same way. This is an example of correspondence. However, it is not an interesting onebecause we can see that the terms used are the same and it is effectively arising from aconsensus.
• The first and second matches together account for 12.5% of all attributes, and they arematched over the level of 87.5. For the second attribute, when Expert A uses the term low-level-data—high-level data, expert B is using the term nominal data—interval or ratio data.This shows a difference in terminology which can be interpreted as their levels of abstractionbeing different in their construing of this topic. This illustrates the two experts havingattributes in correspondence.
• The third match again shows a correspondence that can be interpreted as arising fromconsensus, with both experts using the attribute does not honour data points—honours datapoints in the same way. Note that this showed up as conflict in Figure 16, probably reflectingthat, in this study, the methodology was more complex and the exchange grids from whichFigure 16 derives were elicited and discussed before those from which Figure 18 derives.
• The fourth match shows a correspondence between short-distance autocorrelation—long-distance autocorrelation and local—global. Notice that local—global used by expert B wasalso used in the first match indicating that expert A has two attributes short-distanceautocorrelation—long-distance autocorrelation and local—global which are used similarly
18
to each other but with different terminology, whereas expert B has only one. In fact, lookingon to the seventh and eleventh matches, it can be seen that expert A has two more attributesdiscontinuous—continuous and does not require a priori model—requires a priori modelwhich correspond to expert B's single attribute local—global. This shows a differences inrichness of concepts not necessarily making new distinctions in the class so far defined bythe entities.
• The eighth match, still over the level of 82, again shows correspondence. It shows theattribute heavy computing load—no computing load is being used by expert B to correspondto mathematically complex—mathematically simple used by expert A. We can interpret thisas a difference in terminology corresponding to a correlation in the real-world.
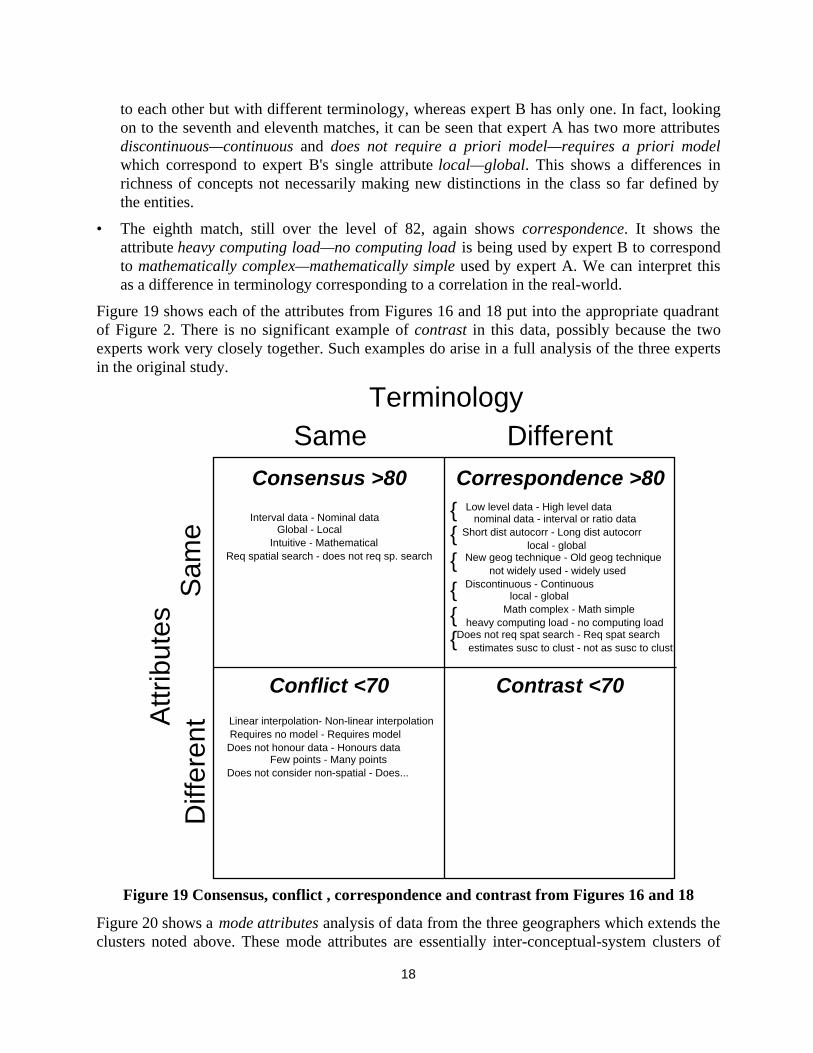
Figure 19 shows each of the attributes from Figures 16 and 18 put into the appropriate quadrantof Figure 2. There is no significant example of contrast in this data, possibly because the twoexperts work very closely together. Such examples do arise in a full analysis of the three expertsin the original study.
Terminology
Attr
ibut
es
Same
Sam
e
Different
Diff
eren
t
Consensus >80
Contrast <70Conflict <70
Correspondence >80 Low level data - High level data nominal data - interval or ratio data Short dist autocorr - Long dist autocorr local - global New geog technique - Old geog technique not widely used - widely used Discontinuous - Continuous local - global Math complex - Math simple heavy computing load - no computing loadDoes not req spat search - Req spat search estimates susc to clust - not as susc to clust
{
{{{{{
Interval data - Nominal data Global - Local Intuitive - MathematicalReq spatial search - does not req sp. search
Linear interpolation- Non-linear interpolation Requires no model - Requires modelDoes not honour data - Honours data Few points - Many pointsDoes not consider non-spatial - Does...
Figure 19 Consensus, conflict , correspondence and contrast from Figures 16 and 18
Figure 20 shows a mode attributes analysis of data from the three geographers which extends theclusters noted above. These mode attributes are essentially inter-conceptual-system clusters of
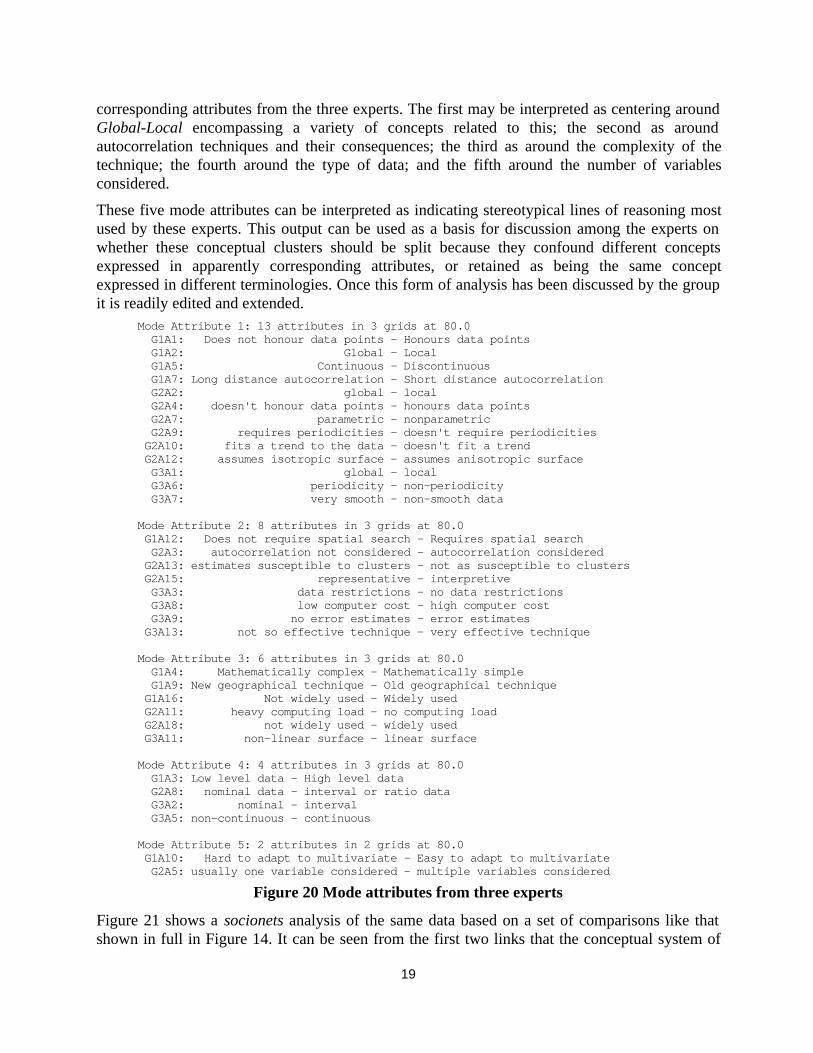
19
corresponding attributes from the three experts. The first may be interpreted as centering aroundGlobal-Local encompassing a variety of concepts related to this; the second as aroundautocorrelation techniques and their consequences; the third as around the complexity of thetechnique; the fourth around the type of data; and the fifth around the number of variablesconsidered.
These five mode attributes can be interpreted as indicating stereotypical lines of reasoning mostused by these experts. This output can be used as a basis for discussion among the experts onwhether these conceptual clusters should be split because they confound different conceptsexpressed in apparently corresponding attributes, or retained as being the same conceptexpressed in different terminologies. Once this form of analysis has been discussed by the groupit is readily edited and extended.
Mode Attribute 1: 13 attributes in 3 grids at 80.0 G1A1: Does not honour data points - Honours data points G1A2: Global - Local G1A5: Continuous - Discontinuous G1A7: Long distance autocorrelation - Short distance autocorrelation G2A2: global - local G2A4: doesn't honour data points - honours data points G2A7: parametric - nonparametric G2A9: requires periodicities - doesn't require periodicities G2A10: fits a trend to the data - doesn't fit a trend G2A12: assumes isotropic surface - assumes anisotropic surface G3A1: global - local G3A6: periodicity - non-periodicity G3A7: very smooth - non-smooth data
Mode Attribute 2: 8 attributes in 3 grids at 80.0 G1A12: Does not require spatial search - Requires spatial search G2A3: autocorrelation not considered - autocorrelation considered G2A13: estimates susceptible to clusters - not as susceptible to clusters G2A15: representative - interpretive G3A3: data restrictions - no data restrictions G3A8: low computer cost - high computer cost G3A9: no error estimates - error estimates G3A13: not so effective technique - very effective technique
Mode Attribute 3: 6 attributes in 3 grids at 80.0 G1A4: Mathematically complex - Mathematically simple G1A9: New geographical technique - Old geographical technique G1A16: Not widely used - Widely used G2A11: heavy computing load - no computing load G2A18: not widely used - widely used G3A11: non-linear surface - linear surface
Mode Attribute 4: 4 attributes in 3 grids at 80.0 G1A3: Low level data - High level data G2A8: nominal data - interval or ratio data G3A2: nominal - interval G3A5: non-continuous - continuous
Mode Attribute 5: 2 attributes in 2 grids at 80.0 G1A10: Hard to adapt to multivariate - Easy to adapt to multivariate G2A5: usually one variable considered - multiple variables considered
Figure 20 Mode attributes from three experts
Figure 21 shows a socionets analysis of the same data based on a set of comparisons like thatshown in full in Figure 14. It can be seen from the first two links that the conceptual system of
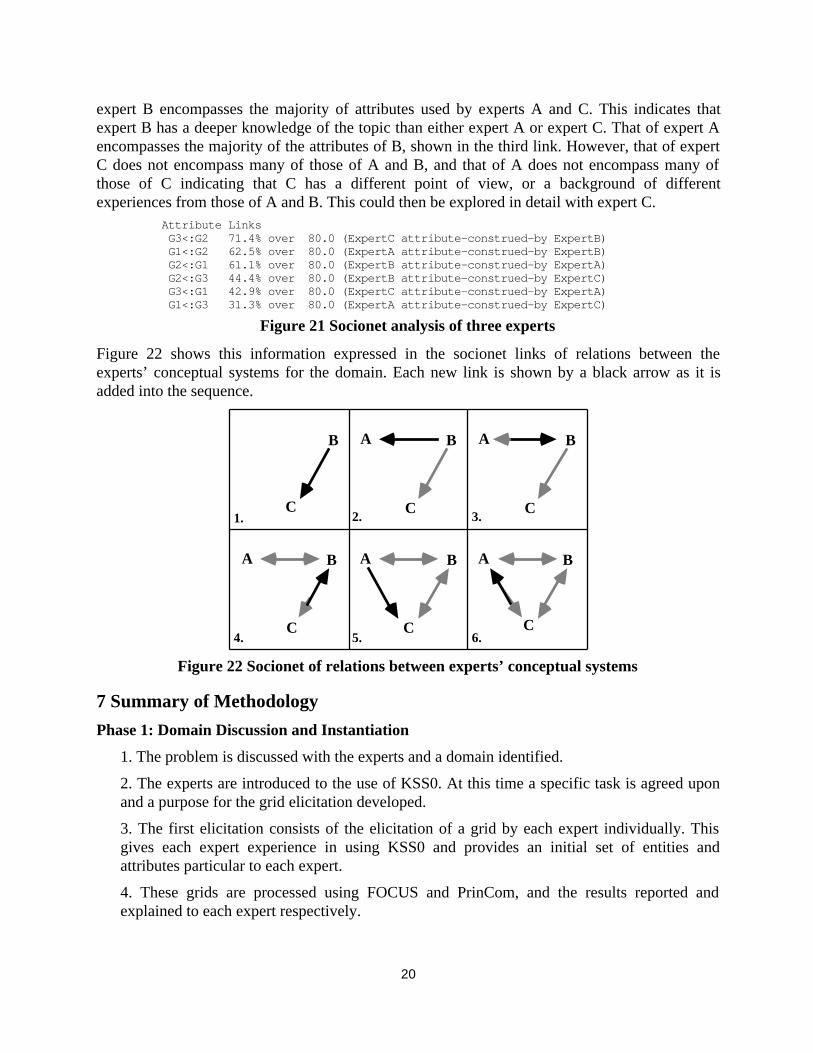
20
expert B encompasses the majority of attributes used by experts A and C. This indicates thatexpert B has a deeper knowledge of the topic than either expert A or expert C. That of expert Aencompasses the majority of the attributes of B, shown in the third link. However, that of expertC does not encompass many of those of A and B, and that of A does not encompass many ofthose of C indicating that C has a different point of view, or a background of differentexperiences from those of A and B. This could then be explored in detail with expert C.
Attribute Links G3<:G2 71.4% over 80.0 (ExpertC attribute-construed-by ExpertB) G1<:G2 62.5% over 80.0 (ExpertA attribute-construed-by ExpertB) G2<:G1 61.1% over 80.0 (ExpertB attribute-construed-by ExpertA) G2<:G3 44.4% over 80.0 (ExpertB attribute-construed-by ExpertC) G3<:G1 42.9% over 80.0 (ExpertC attribute-construed-by ExpertA) G1<:G3 31.3% over 80.0 (ExpertA attribute-construed-by ExpertC)
Figure 21 Socionet analysis of three experts
Figure 22 shows this information expressed in the socionet links of relations between theexperts’ conceptual systems for the domain. Each new link is shown by a black arrow as it isadded into the sequence.
AAA
AA
B
C
B B
BBB
CC
CCC1.
6.5.4.
3.2.
Figure 22 Socionet of relations between experts’ conceptual systems
7 Summary of Methodology
Phase 1: Domain Discussion and Instantiation
1. The problem is discussed with the experts and a domain identified.
2. The experts are introduced to the use of KSS0. At this time a specific task is agreed uponand a purpose for the grid elicitation developed.
3. The first elicitation consists of the elicitation of a grid by each expert individually. Thisgives each expert experience in using KSS0 and provides an initial set of entities andattributes particular to each expert.
4. These grids are processed using FOCUS and PrinCom, and the results reported andexplained to each expert respectively.

21
5. The experts meet together to discuss each set of entities, review and revise the purpose orcontext of the elicitations, and agree on a common set of entities which all understand.
Phase 2: Conceptualization and Feedback
6. This common entity set provides the basis for the next phase of data collection whichconsists of the elicitation of a grid by each expert using the set of common entities and acommon rating scale. This elicitation is done separately for each expert.
7. These grids are also processed on FOCUS and PrinCom, and the results reported andexplained to each expert respectively.
8. This data is then processed on Socio, and attributes of correspondence and contrastidentified.
Phase 3: Exchange and Compare
9. The next phase of data collection consists of the experts exchanging their grids elicited inphase 2 with each other expert in the group to produce other grids.
10. This data is then processed on Socio, and attributes of consensus and conflict identified.
11. From the Socio results a mode grid is produced to identify the content of the shared linesof thought emanating from the distinctions made by all the experts together.
12. From the Socio results the socionet sequence is produced to identify the subgroups ofexperts who think and act in similar ways, and any who are different in their thinking fromthe main lines of thought in the group.
Phase 4: Rule Derivation and Validation
13. This data is then processed using Induct to produce rules, classes and/or objects withwhich to prime an expert system shell (Gaines 1989).
14. The final data collection phase consists of giving each expert a selected list of entailmentsgenerated from this grid. A set of examples from four separate levels of significance ofentailment are then selected and randomly presented to the expert who is asked to rate eachrule on a four point scale from correct to incorrect. This data is used to check that the set ofrules produced by Induct is an accurate one.
15. The rules are tagged with any information resulting from these analyses, such as the nameof the expert, his contribution to the group of experts, and his relationship with the otherexperts in the group with respect to the sub-domain under consideration.
8 Conclusions
Any comparison of conceptual systems necessarily involves approximation since a completeconceptual system may involve indefinitely complex relations and different concepts will neverbe identical in all respects. However, in the initial phases of knowledge acquisition, highlightinggross similarities and differences is itself valuable in promoting directed discussion amongexperts and clients that can lead to the exposure of more subtle relationships. As a start onewishes to elicit the major distinctions that an individual uses in a domain, the terminology usedfor them, and the relation of such distinctions and terminology to those of others.
22
Entity-attribute grid elicitation is an extensional approach in that individuals are asked to specifya set of entities in a domain, then make distinctions among them, naming the distinctions andclassifying all the specified entities in terms of them. The extension of a distinction determinedin this way is only an approximation to the underlying concept since critical entities may bemissing in the classification. However, both manual and computer-based elicitation techniquesattempt to prompt the individual for additional entities to discriminate between extensionallyrelated distinctions (that is making the same, or similar, classifications).
Group comparisons, as developed in this paper, have similar dynamics—an extensionallyapparent consensus or correspondence may be accepted or rejected, and the rejection may bebased on the specification of additional entities as counter-examples. Knowledge acquisition isessentially a negotiation process leading to approximations to conceptual structures that areadequate for some practical purpose such as system development.
The methodology described in this paper provides facilities for revealing the similarities anddifferences in the concept systems of different experts, or the same experts at different times,construing a domain defined through common entities or attributes. It can be used to focusdiscussion between experts on those differences between them which require resolution, enablingthem to classify them in terms of differing terminologies, levels of abstraction, disagreements,and so on.
Note that the derivation of consensual, conflicting, corresponding and contrasting attributes iscompletely algorithmic, based solely on the data in the grids. This derivation is done by acomputer program, not a knowledge engineer, and its basis can be demonstrated clearly to theexperts through computer output such as the difference grid of Figure 17. Thus, there are noopinons being expressed about the correctness of the use of the attributes and terminology, thatthe differences highlighted are ‘right’ or ‘wrong.’ It is open to the experts to consider, discussand explain these differences, changing or retaining them as they wish. Conflicts can be retainedin the final system if desired by tagging classes, objects and rules with the sources from whichthey derive.
Note also that the methodology described applies equally to the relations between the conceptualstructures of experts and representative clients for the system. The differences in conceptualsystems shown in Figure 7 and the problems that may arise from them may be made overt, andthe methods for overcoming these for the different classes of clients, may be analyzed in detailusing the derivation of consensual, corresponding, conflicting and contrasting attributes fromexperts and clients.
The methodology promotes the full exploration of the conceptual framework of a domain ofexpertise by encouraging experts to operate in a “brain-storming” mode as a group, usingdiffering viewpoints to develop a rich framework. It reduces social pressures forcing an invalidconsensus by providing objective analysis of separately elicited conceptual systems.
Acknowledgements
Financial assistance for this work has been made available by the Natural Sciences andEngineering Research Council of Canada. The KSS0 system was made available by the Centrefor Person Computer Studies. We are grateful to many colleagues at the knowledge acquisitionworkshops for discussions which have highlighted many of the issues raised in this paper.

23
ReferencesBoose, J.H. (1984). Personal construct theory and the transfer of human expertise. Proceedings
AAAI-84, 27-33. California: American Association for Artificial Intelligence.
Boose, J.H. & Bradshaw, J.M. (1987) Expertise transfer and complex problems: usingAQUINAS as a knowledge acquisition workbench for knowledge-based systems.International Journal of Man-Machine Studies 26, 3-28.
Boose, J.H. & Gaines, B.R., Eds. (1988). Knowledge Acquisition Tools for Expert Systems.London, Academic Press.
Compton, P. & Jansen, R. (1989). A philosophical basis for knowledge acquisition. Proceedingsof the Third European Workshop on Knowledge Acquisition for Knowledge-BasedSystems (EKAW’89). Paris, France (June).
Diederich, J., Ruhmann, I. & May, M. (1987) KRITON: a knowledge-acquisition tool for expertsystems. International Journal of Man-Machine Studies 26, 29-40.
Gaines, B.R. (1987a) Rapid prototyping for expert systems. Oliff, M. (Ed). IntelligentManufacturing: Proceedings from First International Conference on Expert Systems andthe Leading Edge in Production Planning and Control. pp.45-73. Menlo Park, California,Benjamin Cummins.
Gaines, B.R. (1987b) An overview of knowledge acquisition and transfer. InternationalJournal of Man-Machine Studies 26(4), 453-472 (April).
Gaines, B.R. (1989) An Ounce of Knowledge is Worth a Ton of Data: Quantitative Studies ofthe Trade-Off between Expertise and Data based on Statistically Well-Founded EmpiricalInduction. Proceedings of 6th International Workshop on Machine Learning, CornellUniversity, Ithaca.
Gaines, B.R. & Boose, J.H., Eds. (1988). Knowledge Acquisition for Knowledge-BasedSystems. London, Academic Press.
Gaines, B.R. & Shaw, M.L.G. (1987). Knowledge support systems. ACM MCC-UniversityResearch Symposium. Austin, Texas: MCC. pp.47-66.
Gaines, B.R. & Shaw, M.L.G. (1989). Comparing the conceptual structures of experts.Proceedings IJCAI-89. California: American Association for Artificial Intelligence.
Hayes-Roth, F. (1984). The industrialization of knowledge engineering. Reitman, W., Ed.Artificial Intelligence Applications for Business. pp. 159-177. Norwood, New Jersey:Ablex.
Kelly, G.A. (1955). The Psychology of Personal Constructs. New York: Norton.
Mancuso, J.C. & Shaw, M.L.G., Eds. (1988). Cognition and Personal Structure: ComputerAccess and Analysis. New York: Praeger Press.
Popper, K.R. (1968). Epistemology without a knowing subject. Van Rootselaar, B. (Ed.). Logic,Methodology and Philosophy of Science III. pp. 333-373. Amsterdam, Holland: North-Holland.
Shaw, M.L.G. (1980). On Becoming a Personal Scientist. London: Academic Press.
Shaw, M.L.G., Ed. (1981). Recent Advances in Personal Construct Technology . London:Academic Press.

24
Shaw, M.L.G. (1985). Communities of knowledge. Epting, F. & Landfield, A.W., Eds.Anticipating Personal Construct Psychology. pp. 25-35. Lincoln: University of NebraskaPress.
Shaw, M.L.G. (1988). An interactive knowledge-based system for group problem-solving. IEEESystem, Man and Cybernetics 18, 610-617.
Shaw, M.L.G. & Gaines, B.R. (1983). A computer aid to knowledge engineering. Proceedingsof British Computer Society Conference on Expert Systems, 263-271 (December).Cambridge.
Shaw, M.L.G. & Woodward, J.B. (1987) Validation in a knowledge support system: construingand consistency with multiple experts. International Journal of Man-Machine Studies 29,329-350.