Embed Size (px)
Citation preview
33
It. W. Hafer and Scott E. Hem
A. Vi Hafer is a research officer at the Federal Reserve Bankot St. Louis. Scott E. Hem is the First National Bank at Lub-bock Distinguished Scho!a, Department of Finance, TexasTech University Kevin L. Kllesen provided research assistance
Comparing Futures andSurvey Forecasts of Near-Term Treasury Bill Rates
REVIOUS research indicates that Treasurybill futures rates are better predictors of thefuture Treasury bill rate than forward rates. Ina recent paper, MacDonald and Hem (1989)analyze 44 separate contracts delivered duringthe period 1977-87 for forecast horizons rang-ing from two days ahead to 91 days ahead.Their evidence shows that the Treasury billfutures rate generally delivers a smaller forecasterror of the three-month ‘rreasury bill i-ate thanthe forward rate implicit in the spot market,and that the forward rate adds little informa-tion about future Treasury bill rates that is notalready incorporated into the futures rate.There also is evidence from other studies thatsurvey forecasts of future Treasury bill ratescontain information that improve upon forwardrate forecasts. Studies by Friedman (1979) andThroop (1981), for example, reveal that surveyforecasts often are more accurate than theforecasts from implicit forward rates.
Given the results of this research, a naturalquestion to ask is “Does the Treasury bill fu-tures rate provide a better forecast of future
short-term interest rates than do survey fore-casts?” In addition, since theories of financialmarket efficiency suggest that financial assetprices should include all available information, arelated question is “Could omie improve upon theTreasury bill futures forecasts using the infor-mation contained in the survey projections?”
Addressing these questions, the object of thispaper, is interesting for several reasons. One isthat forecasts of future interest rates are acrucial factor in forming investment strategiesor purchasing plans. Incorrect interest ratefoi-ecasts can have large effects on investors’wealth. Moreover, to the extent that interestrate risk is directly related to the level of in-terest rates, accurately predicting the futurelevel of rates is an important avenue to reduc-ing interest rate risk exposure.’ In a relatedvein, policymnakers often consider the effect oninterest rates as an important factor in predic-ting the outcome of policy changes. Knowingthat the futures market provides an accurategauge of the market’s expectation for futurerates provides a practical benchmark prediction
10n this, see Betongia and Santoni (1987).
MAY/JUNE 1989

34
to which policymakers can compare theirforecasts.’
This article compares futures market andsurvey forecasts of short-term Treasury billrates in two ways. First, considering general ac-curacy, we compare forecasting results of thetwo predictions over the 10-year period,1977-87. General forecast accuracy is comparedalong with the extent of bias in the tworeported forecasts.’ Second, we investigatewhether information in the survey forecastcould reduce the forecast error of the Treasurybill futures market prediction. This relates tothe efficiency of the Treasury bill futuresmarket, an issue that previously has been ad-dressed by comparing futures and forwardrates in terms of the arbitrage opportunitiesthat differentials in these two rates indicate.~
THE DATA
This study uses two quarterly interest rateforecasts: one from a widely circulated surveyof market participants; the other from theTreasury bill futures market.
Survey Forecasts
The survey forecasts are published in the Bond
and Money Market Letter.5 This survey has beentaken quarterly since 1969. On each surveydate, approximately 40 to 50 financial market
analysts representing a variety of financial insti-tutions are asked for their point forecast of anumber of different interest rates, three monthsand six months hence.° In this study, we focuson the survey forecasts of the three-monthTreasury bill rate. The respondents’ forecastsare compiled, and the mean value is publishedin the Letter. Since the approximate date of thesurvey response is easily identified, theseforecasts can be easily matched with futuresmarket rates for similar dates.~This featuremakes the survey more attractive than other ex-isting surveys for empirical comparison with in-terest rate forecasts from the futures market.~
Futures Market Rates
Trading in Treasury bill futures contractstakes place on the International Monetary Mar-ket (1MM) of the Chicago Mercantile Exchangebetween the hours of 8 am. and 2 p.m.9 Thefutures contracts traded call for delivery of $1million of Treasury bills maturing 90 days fromthe delivery day of the futures contract. The in-strument and maturity of the dehverable instru-ment match well with the survey forecasts ofthe Treasury bill rate. These contracts call fordelivery four times a year: March, June,September and December10
The futures market forecasts were gatheredso that the futures market rate was taken onthe same approximate date that the survey
‘As Poole (1978) notes, “Unless policymakers have solidevidence that their own forecasts are more accurate thanmarket forecasts, they cannot afford to ignore the T-billfutures market.” (p. 18)
‘Belongia (1987) also compares the relative accuracy offutures and survey forecasts of Treasury bill rates, usingthe semiannual survey published by the Wall StreetJournal.
4For examples of such studies, see Hegde and Branch(1985) or MacDonald, et at (1988) and the references citedtherein.
5We would like to thank the publishers of the Letter forallowing us to use their survey results in this study. Forprevious analyses of this survey data, often referred to asthe Goldsmith-Nagan survey, see Prell (1973), Friedman(1980), Throop (1981) and Dua (1988).
6The survey actually asks for forecasts of 11 different in-terest rates, ranging from the federal funds rate to conven-tional mortgage rates.
7The newsletter in which the survey results are publishedalso provides the interest rates on the day the question-naires are mailed and the latest close before publication, aperiod of about two weeks.
8One such survey is conducted by the American StatisticalAssociation-National Bureau of Economic Research (ASA-NBER). This quarterly survey also asks participants to
forecast the Treasury bill rate one quarter and twoquarters ahead. Unfortunately, the questionnaire does notask respondents for a forecast of the rate on any certaindate in the future. It is unclear, therefore, whether theresulting forecast is a quarterly average, the peak rate forthe quarter or the rate expected to hold at quarter’s end.
Another interest rate survey already referred to is the se-miannual Wall Street Journal poll of financial marketanalysts. This survey asks participants for their forecast ofthe three-month Treasury bill rate six months hence.Because this survey has been conducted only sinceDecember 1981, the limited number of forecasts restrictsits usefulness for the type of empirical analysis used in thisstudy.
°Thediscussion of the futures contract is based on informa-tion available in the 1983 Yearbook of the 1MM and the1987 Yearbook, volume 2, of the Chicago MercantileExchange.
°Thevolume of futures contracts traded on the 1MM grewsubstantially from their introduction in January 1976, whenthe total volume for all delivery months was 3,576 con-tracts, through August 1982, when the number of con-tracts traded reached 738,394. Since 1982, however, thenumber of contracts traded has decreased: in December1987, the total number of contracts was 131,575. Thedecline in the Treasury bill contracts also coincides withthe introduction of a Eurodollar futures contract. This newcontract may be viewed as a substitute for the Treasurybill contract.
FEDERAL RESERVE BANK OF St LOUIS

35
Figure 1T-BiII, Futures and Survey ForecastsForecast Horizon: Three MonthsPercent Percent15.0 15,0
12.5
10.0
7.5
5.0
2.5
12,5
10.0
7.5
5.0
2.5
forecast was made. It is the approximate date,because the exact date when each survey respon-dent made his or her forecast cannot be deter-mined. For example, the questionnaire asking“At what level do you see the following rates onSeptember 30, 1987, and December 31, 1987?”was mailed to survey participants on June 16,1987. The results of this survey subsequentlywere published on July 2, 1987.
‘ro make the analysis in this study tractable,we have chosen the midpoint of this two-weekinterval between the mailing date and publica-tion date as the representative forecase date.Continuing with the example, two ‘I’reasury billfutures contracts were gathered from the WallStreet Journal for June 24, 1987: those for theSeptember and December 1987 delivery dates.”These futures market predictions are then
directly compared with the three-month and six-month-ahead Treasury bill rate survey forecastspublished on July 2, 1987. For example, the July1987 survey forecase of the September 30,1987, ‘I’reasury bill rate was 5.81 percent. Thefutures market forecast was slightly higher,6.15 percent. The actual rate turned out to be6.64 percent.
A PRELIMINARY LOOK AT THE
FORECASTS
To illustrate the overall relationship betweenthe different series over the full sample period,we plotted the actual three-month Treasury billrate and the different forecasts for the full sam-ple period, from March 1977 through October1987. These are shown in figures 1 and 2.
“It also should be noted that a slight disparity between thedate of the two forecasts is expected to prevail. Thesurvey participants presumably are projecting rates for thelast business day of each quarter. Alternatively, the futures
market is concerned with rates on the delivery day of thefutures contract, usually the third Thursday of the finalmonth in each quarter. The maximum disparity, however,is only six business days.
1977 78 79 80 81 82 83 84 85 86 1987
MAY/JUNE 1989

36
Figure 2T-BiII, Futures and Survey ForecastsForecast Horizon: Six Months
Three-Aionth-..4head Forecasts
Figure 1 presents the two different three-month-ahead forecasts along with the actualthree-month Treasury bill rate. The general pat-tern shown is similar for both forecasts. In fact,both appear to have a closer relationship toeach other than they do to the actual Treasurybill rates. For example, both forecasts over-predicted the actual rate in 1980.12 The forecasterror (actual minus predicted) for June 1980from the futures market was —630 basis points;for the survey it was —642 basis points.Another relatively large forecasting error occur-
red when the actual rate fell sharply in late1982. For September 1982, the futures market
forecast error is —571 basis points comparedwith the survey forecast error of —487 basispoints. Since 1984, although the differenceshave become smaller, the forecast errors fromthe futures market and the survey have tendedto systematically overpredict rates.
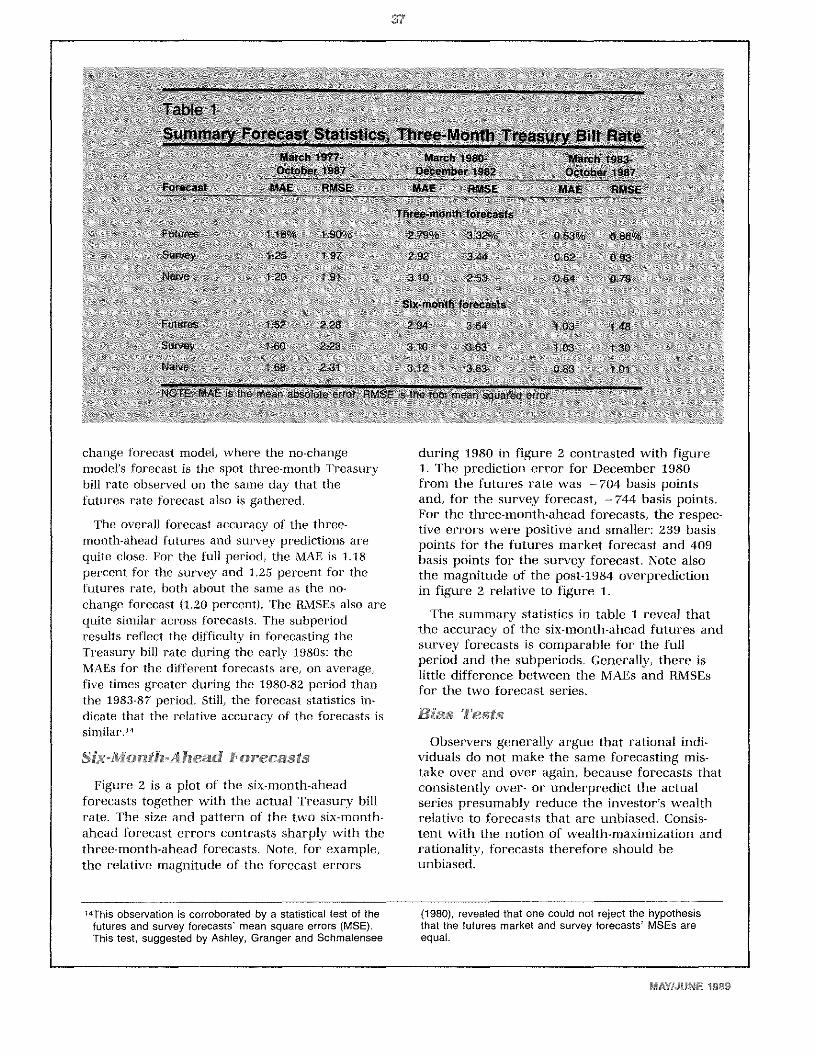
To provide some statistical basis for assessingthe accuracy of these two forecasts, table 1presents summary measures of the relative ac-curacy of the two three-month Treasury billforecasts over the full period and two subper-iods.” Both the mean absolute error (I~AE)andthe root mean squared error (RMSE) arereported for the forecasts. As a benchmark, wealso report the results based on a simple no-
“The Special Credit Control program was administered dur-ing this period. For a description of the program and adiscussion of monetary policy during this period, seeGilbert and Trebing (1981).
“These subperiods represent those during which monetarypolicy was thought to be influenced by the behavior of the
monetary aggregates (1980-82) and the behavior of in-terest rates (1983-87). Gilbert (1985) and Thornton (1988)suggest that the behavior of policy under borrowed reservetargeting was quite similar to that under a federal fundsrate targeting procedure.
Percent15.0
Percent
15.0
12.5
10.0
7.5
5.0
2.51977 78 79 80 81 82 83 84 85 86 1987
FEDERAL RESERVE BANK OF St LOUIS
37
change forecast model, where the no-changemodel’s forecast is the spot three-month Treasurybill rate observed on the same day that thefutures rate forecast also is gathered.
The overall forecast accuracy of the three-month-ahead futures and survey predictions arequite close. For the full period, the MAE is 1.18percent for the survey and 1.25 percent for thefutures rate, both about the same as the no-change forecast (1.20 percent). The RMSEs also arequite similar across forecasts. The subperiodresults reflect the difficulty in forecasting theTreasury bill rate during the early t980s: theMAEs for the different forecasts are, on average,five times greater during the 1980-82 period thanthe 1983-87 period. Still, the forecast statistics in-dicate that the relative accuracy of the forecasts issimilar.”
Six-Month-Ahead Forecasts
Figure 2 is a plot of the six-month-aheadforecasts together with the actual Treasury billrate. The size and pattern of the two six-month-ahead forecast errors contrasts sharply with thethree-month-ahead forecasts. Note, for example,the relative magnitude of the forecast errors
during 1980 in figure 2 contrasted with figure1. The prediction error for December 1980from the futures rate was —704 basis pointsand, for the survey forecast, —744 basis points.For the three-month-ahead forecasts, the respec-tive errors were positive and smaller: 239 basispoints for the futures market forecast and 409basis points for the survey forecast. Note alsothe magnitude of the post-1984 overpredictionin figure 2 relative to figure 1.
The .summary statistics in table I reveal thatthe accuracy of the six-month-ahead futures andsurvey forecasts is comparable for the fullperiod and the subperiods. Generally, there islittle difference between the MAEs and RMSEsfor the two forecast series.
Bias Tests
Observers generally argue that rational indi-viduals do not make the same forecasting mis-take over and over again, because forecasts thatconsistently over- or underpredict the actualseries presumably reduce the investor’s wealthrelative to forecasts that are unbiased. Consis-tent with the notion of wealth-maximization andrationality, forecasts therefore should beunbiased.
“This observation is corroborated by a statistical test of thefutures and survey forecasts’ mean square errors (MSE).This test, suggested by Ashley, Granger and Schmalensee
(1980), revealed that one could not reject the hypothesisthat the futures market and survey forecasts’ MSEs areequal.
MAY/JUNE 1989

38
To test forecasts for bias, researchers usuallyestimate a regression of the form
(I) r, = a + j3,_,r~+ u,
where r, is the actual rate of interest at time t,,.,r~is the expectation of the rate for timeheld at time t-s, and u, is a random errorterm.1’ The null hypothesis, that expectationsare unbiased, implies the testable hypothesisthat the estimated values of the coefficient a iszero and the coefficient /3 is unity. Moreover,the error term (u,) should not displaycharacteristics of autocorrelation.b6
A problem in estimating equation I arises ifthe actual and forecast series are characterizedby unit root processes.’7 In such a case,estimating equation I will produce downward-biased coefficient estimates, an increased pro-bability of rejecting the null hypothesis and,therefore, an incorrect finding of bias when itdoesn’t exist.’8
As an alternative to estimating equation 1directly, one can test for bias by imposing thenull hypothesis conditions and determinewhether the data reject them. Imposing the nullrestrictions yields the relationship
(2) r, — ,_,r~= u, -
If the actual interest rate series and theforecasts are characterized by unit root pro-cesses and the forecasts are unbiased, then thedata also should reject the hypothesis that the
forecast error (u,) has a unit root. Moreover, itshould be the case that E(u,) 0.
To implement this test procedure, we firsttest for unit roots in the actual and forecast in-terest rate series. Again, if it is shown that theactual interest rate series has a unit root, thenso should the forecast series under the assump-tion of rational expectations.’°To test for unitroots, the Dickey-Fuller (1979) test procedure isused wherein the change in each series is re-gressed on a constant and one lagged value ofthe serie’s level. Specifically, a regression of theform
(3) AX, = a, + AX,_, + e,
is estimated, where A is the difference operator(i.e, AX, = x, — X,.J. If the t-ratio associatedwith the lagged variable is less than the relevantcritical value, then we can reject the existenceof a unit root.
The results of this test for the Treasury billrate and its forecasts are reported in the upperhalf of table 2. In every instance, we find thatthe estimated t-ratio on the lagged level of theselected variable is greater than the 5 percentcritical value, about .—3.50.’~’This evidence in-dicates that we cannot reject the notion thateach series has a unit root.
Given this finding, the forecast errors are ex-amined to determine whether they do not con-tain unit roots, as hypothesized under the con-
“Webb (1987) has argued that such tests may lead one toreject the null hypothesis when it is true. He argues thatrejection of unbiasedness may reflect several factors, all ofwhich are known to the econometrician ex post but not tothe forecaster ex ante. He argues that forecasts that failbias tests may in fact have originally been formulated op-timally. This criticism is most forceful for examiningforecasts of series that are revised many times followingthe original forecast date. Such a problem does not exist,however, with the interest rate series used here.
“This restriction, as Friedman (1980) notes, strictly appliesonly to the one-step-ahead forecasts.
“If the fundamental moving-average representation of someseries X has an autoregressive representation, then it canbe written in the form
[1-a(L)] X, = e,where L is the lag operator (i.e., LX, = X,~,anda(L) = ZaL). The polynomial in the lag operator a(L) canbe written as a(L) = (1-BL)B(L). If there exists a root Bthat is equal to unity, then the series X is characterized bya unit root. It is useful to note that a random walk is a par-ticular type of unit-root process.
“We would like to thank Jerry Dwyer for pointing this out.This issue is discussed at length in Dwyer, et al (1989)from which the following draws.
“In other words, the process generating the expectationsshould be the same as the one generating the actualseries.
‘°Thecritical value is taken from Fuller (1976), table 8.5.2.We should note that Schmidt (1988), extending the work ofNankervis and Savin (1985), argues that these criticalvalues are incorrect in the presence of significant drift inthe variable. Given the estimated constant terms found inthe upper panel of table 2, the critical value to test for unitroots according to Schmidt is about -1.86 at the 5 percentlevel and about -2.60 at the 1 percent level. Using thesecritical values, our estimates suggest that, while unit rootsare rejected at the 5 percent level, they are not at the 1percent level.
If we take the results using the 5 percent level, then it ispossible to estimate equation I directly. Doing so givesthe following results: the calculated F-statistic and relatedmarginal significance level testing the joint hypothesis thata = 0 and (3 = 1 in equation 1 is 2.51 (0.09) for the three-month futures forecast; 3.26 (0.05) for the six-monthfutures forecast; 1.66 (0.20) for the three-month surveyforecast; and 1.80 (0.18) for the six-month survey forecast.Except for the six-month futures forecast, these results in-dicate that unbiasedness cannot be rejected.
FEDERAL RESERVE BANK OF St LOUIS

39
f2S~1< ~
~ ~:c ~ e,( x~‘ =~ ~ ~ ~ ‘)1~~ , :-~~
always less than the critical value. These resultsindicate that the imposed restrictions associatedwith unbiased forecasts are not rejected.
The different forecast error series also are cx-amined to decide whether their mean valuesdiffer from zero. In every instance, thehypothesis that the mean forecast error is notstatistically different from zero could not be re-jected. In fact, the largest t-statistic calculated isfar below unity. Thus, the evidence is largelyconsistent with the notion that the futuresmarket and survey forecast errors are unbias-ed.”
MARKET EFFICIENCY TESTS
S /
/ /
/ /
dition of unbiasedness.” Regressing the changein the respective forecast error on a constantand a lagged level o the forecast error pro-duces the results reported in the lower half oftable 2. For both the three-month and six-monthforeca ts, the futures market and survey fore-ca ts of the Treasury bill rate satisfy the condition of unbiasedness the calculated t-ratio s
The evidence to this point tells us little aboutthe efficiency of the Treasury bill futures mar-ket. The hypothesis of market efficiency assertsthat financial markets use all available informa-tion in pricing securities. If this is true, thereshould be no more accurate forecast of futuresecurity prices than that in today’s price.
To investigate the efficiency of the futuresmarket forecasts, a test proposed by Throop(1981) is used to determine whether knowledgeof the survey forecast of Treasury bill ratescould reduce the forecast error made by thefutures market. The answer to this question canbe found by estimating the regression
(4) r, — ,,r~ = d(,,r~—,_,r~)+ e,,,
where r is the three-month Treasury bill rateat date t, ,_ r~is the futures market rate at t-sfor delivery at t, ~_ ,r~is the survey forecasttaken at t-s for rates prevailing at t and e,,, is arandom error term.” The hypothesis of marketefficiency requires that the estimated value ofthe coefficient d is zero, indicating that the in-formation in the survey forecast already is in-corporated in the futures market’s projection.To see this, rewrite equation 4 as r, = d,~,r~+
(I —d),,r~Under the market efficiency require-ment that d = 0, the survey forecast drops
21A5 Dwyer, et at (1989) state, “A unit root in the forecasterrors would indicate that the distribution of the forecasterrors has a random walk component which has nocounterpart in the innovations in the events beingforecast. “ (p. IS)
2SThe bias of the no-change forecasts also was tested. Likethe results based on the futures market and surveyforecasts, the reported t-ratios allow us to reject thehypothesis of a unit root in the forecast errors of the no-change models. Moreover, the mean forecast error is notstatistically different from zero.
“Throop (1981) used this approach to test the efficiency ofTreasury bill forward rate projections and found evidenceof inefficiencies in the forward market. Kamara andLawrence (1986) and MacDonald and Hem (1989) use thisapproach and find that Treasury bill futures rates are moreaccurate forecasts when compared with the forward rates.Other examples employing a similar type of analysis areFama (1984a,b) and French (1986).
MAY/JUNE 1989

40
from the equation and one is left withr, = , ,r~+ e,,,.
If the estimated value of ci is different fromzero, however, knowledge of the differentialbetween the survey forecast and the futuresrate would significantly reduce the forecast er-ror in the futures rate.’4 This would be incon-sistent with the notion that market participantsefficiently utilize all available information. In theterminology of Fama (1970), our test is a ‘semi-strong” form test of market efficiency, since allthe information in the survey projections wouldnot have been publicly available when thefutures market was sampled.
Estimates of equation 4 to test the efficiency ofboth the three-month-ahead and the six-
month-ahead Treasury bill futures marketforecasts are reported as equation A in table325 The evidence indicates that the hypothesisof a semi-strong form of market efficiency can-not be rejected at the 5 percent level ofsignificance. Using the information differentialbetween the survey forecast and the futuresrate, the estimated value of ci is only 0.08 (t =
0.16) for the three-month forecast horizon. Forthe six-month horizon, the estimated value of ciis 0.71 (t = 1.54). In both instances, we cannotreject the hypothesis of efficiency as applied tothe futures market forecast. A weak-formmarket efficiency test also was considered byreplacing the survey forecast with the currentspot market rate. The result is reported asequation B in table 3. when compared with theno-change forecast, efficiency again cannot berejected for the futures rate: the results indicatethat, for the three-month and six-monthforecasts, the estimated value of ci is neversignificantly different from zero.
Rewriting equation 4 as above also indicatesthat it imposes the restriction that the sum ofthe weights on the two forecasts sum to unity.We have re-estimated the equation without thisrestraint and found that we still could not rejectefficiency of the futures rate forecasts whencompared with either the survey or no-changeforecasts.
The Role of the Revision in theSurvey Forecast
Since the survey participants are asked fortheir three- and six-month-ahead forecasts everythree months, they essentially are providing twoforecasts of the same event, taken at two dif-ferent points in time. For example, survey par-ticipants are asked in December of the previousyear and then again in March to forecast theJune Treasury bill rate. One piece of new infor-mation that survey respondents have in makingtheir March forecasts is the revision of theDecember forecast itself. Nordhaus (1987) hassuggested that, for forecasts to be efficient, theinformation in the revision also should be incor-
24This same procedure can be used to test if there is infor-mation in the futures rate that is not present in the surveyforecast. In this case, the left-hand side of equation 4 isthe forecast error from the survey prediction. The resultsfrom this test (not reported) indicate that the surveyforecasts are efficient with respect to the futures marketforecasts.
‘5The results reported are those excluding a constant termin the regression. Including a constant term does not alterthe conclusions reached. Also, White’s (1980) test failed toreject the null hypothesis of homoskedasticity in theresiduals.
FEDERAL RESERVE BANK OF St LOUiS

41
porated in the current forecast. Knowledge ofthe revision should not allow a reduction in theforecast error under the hypothesis ofefficiency.
A similar argument can be applied to thefutures rate forecasts. In particular, knowledgeof the revision in the survey forecast of futureTreasury bill rates should not help reduce thefutures market’s forecast error if the latter isformed efficiently. The survey’s revision is partof today’s information set and should already beincorporated into the market’s projection.2’ Totest whether knowledge of the survey’s revisioncould help reduce the forecast error in thefutures market, equation 4 is modified to in-clude the survey revision itself:
(5) r,—,r~ = a, + y,( ..r~—
+ y,( ,_,r~— ,_,r~)+ e,
The term ( ,_r~— ,_2r~)reflects the revision inthe survey’s forecast of next quarter’s Treasurybill rate. Efficiency requires not only that thefutures rate contains all the information in thesurvey forecast, but also that it reflects thesurvey forecast revision. lf the futures rateforecast is efficient, estimated values of both y,and y, in equation 5 should not be differentfrom zero.
The results from estimating equation 5 (withabsolute value of t-statistics in parentheses)
(6) r, — ,r~= —0.066 + 0.104(,r~—,r~)
W = 0.034
(0.20) (0.18)
— 0.31Zç_,r~—,,r~)(1.86)
DW = 1.92
The intercept of the equation is not statistical-ly different from zero, indicating no bias inthese projections. We also find that the esti-mated slope coefficients (y and y,) are not
significantly different from zero using a conven-tional 5 percent level of significance. This out-come is consistent with the efficient marketshypothesis that there is little information in thesurvey forecast or its revision that is notalready incorporated into the futures rateforecast.28
CONCLUSION
In this study, we compared futures marketand survey forecasts of the three-month Trea-sury bill rate both three and six months ahead.Our test results generally support the percep-tion that the forecasts are unbiased predictorsof future rates. Moreover, futures market fore-casts of near-term interest rates usually are asaccurate as those produced by professional fore-casters, Compared with a popular survey ofprofessionals used in this study, we find littledifference in the relative forecasting accuracyof the two. Our results also indicate that no in-formation in the survey forecast or its revisioncould reliably improve upon the futures rateprediction.
This conclusion about market efficiency con-trasts sharply with that found for’ the forwardmarket. Previous evidence has shown that theTreasury bill forward rate does not incorporateall of the information contained in the samesurvey considered here. Such a conclusion,along with the evidence presented in this paper,is consistent with the belief that there is a time-varying premium in the forward rate that ap-parently is absent in the ‘I’reasury bill futuresrate.
The results presented here should not be in-terpreted as proof that the Treasury bill futuresmarket rate is always the most accurate interestrate forecast. The evidence does suggest, how-ever, that for investment decisions and mone-tary policy discussions, the futures rate providesa useful measure of the market’s expectation offuture interest rates. Consequently, it is avaluable benchmark to which other forecastscan be compared.
“The reader again is reminded that this is a semi-strongform efficiency since the information in the survey revisionwould not have been released to the public at the timethat we sampled the futures rates.
‘1White’s (1980) test indicated that we could not reject thenull of homoskedastic residuals.
“We should note, however, that the 72 slope coefficient issignificant at about the 7 percent level. Based on this levelof significance, the result of estimating equation 5 is con-sistent with the notion that the futures rate forecasts may
not be the optimal projection of the Treasury bill rate.Given the results in equation 6, the optimal forecast
(,,r~)would take the form
= ,~r~-0.312(,r~-,~,r)
This result implies an overreaction on the part of thefutures market to a revision. That is, if the survey revisesits interest rate forecast upward, the optimal forecastwould scale down the forecast from the futures market.
MAY/JUNE 1989

42
REFERENCES
Ashley, Richard, Clive W. J. Granger, and RichardSchmalensee. “Advertising and Aggregate Consumption:An Analysis of Causality[ Econometrica (July 1980),pp. 1149-67.
Belongia, Michael T. “Predicting Interest Rates: A Compari-son of Professional and Market-Based Forecasts,” thisReview (March 1987), pp. 9-15.
Belongia, Michael T., and Gary J. Santoni. “Interest RateRisk, Market Value, and Hedging Financial Portfolios;’Journal of Financial Research (Spring 1987), pp. 47-55.
Chicago Mercantile Exchange. 1987 Yearbook (1988).
Dickey, David A., and Wayne A. Fuller. “Distribution of theEstimators for Autoregressive Time Series with a UnitRoot,” Journal of the American Statistical Association (June1979), pp. 427~31.
Dua, Pami. “Multiperiod Forecasts of Interest Rates’ Jour-nal of Business and Economic Statistics (July 1988), pp.381 -84.
Dwyer, Gerald P., Jr., Arlington W. Williams, Raymond C.Battalio, and Timothy I. Mason. “Tests of Rational Expecta-tions in a Stark Setting[ Federal Reserve Bank of St.Louis Research Paper 89-001 (April 1989).
Fama, Eugene F. “Forward and Spot Exchange Rates,”Journal of Monetary Economics (November 1984a),pp. 319-38.
_______ - “The Information in the Term Structure,” Journalof Financial Economics (December 1984b), pp. 509-2&
_______ - “Efficient Capital Markets: A Review of Theoryand Empirical Work[ Journal of Finance (May 1970),pp. 383-417.
French, Kenneth R. “Detecting Spot Price Forecasts inFutures Prices,” Journal of Business (April 1986),pp. 539-54.
Friedman, Benjamin M. “Survey Evidence on the ‘Ratio-nality’ of Interest Rate Expectations,” Journal of MonetaryEconomics (October 1980), pp. 453-65.
_______ “Interest Rate Expectations Versus ForwardRates: Evidence from an Expectations Survey[ Journal ofFinance (September 1979), pp. 965-73.
Fuller, Wayne A. Introduction to Statistical Time Series (JohnWiley & Sons, Inc., 1976).
Gilbert, R. Alton. “Operating Procedures for ConductingMonetary Policy,” this Review (February 1985), pp. 13-21.
Gilbert, R. Alton, and Michael E. Trebing. “The FOMC in1980: A Year of Reserve Targeting,” this Review(AugustlSeptember 1981), pp. 2-22.
Hegde, S., and B. Branch. “An Empirical Analysis of Ar-bitrage Opportunities in the Treasury Bills FuturesMarket,” Journal of Futures Markets (Fall 1985), pp. 407-24.
International Monetary Market. 1983 Yearbook (Chicago Mer-cantile Exchange: 1984).
Kamara, A., and C. Lawrence. “The Information Content ofthe Treasury Bill Futures Market Under ChangingMonetary Regimes,” Working Paper No. 51 (Center for theStudy of Banking and Financial Markets, University ofWashington, 1986).
MacDonald, S. Scott, and Scott E. Hem. “Futures Rates andForward Rates as Predictors of Near-Term Treasury BillRates,” Journal of Futures Markets (June, 1989) pp. 249-62.
MacDonald, S. Scott, Richard L. Peterson, and TimothyW. Koch. “Using Futures to Improve Treasury Bill PortfolioPerformance,” Journal of Futures Markets (April 1988),pp. 167-84.
Nankervis, J. C., and N. E. Savin. “Testing the Autoregres-sive Parameter with the t Statistic,” Journal of Economet-rics (February 1985), pp. 143-61.
Nordhaus, William 0. “Forecasting Efficiency: Concepts andApplications,” Review of Economics and Statistics(November 1987), pp. 667-74.
Poole, William. “Using T-bill Futures to Gauge Interest-RateExpectations,” Federal Reserve Bank of San FranciscoEconomic Review (Spring 1978), pp. 7-19.
Prell, Michael J. “How Well do the Experts Forecast InterestRates?” Federal Reserve Bank of Kansas City MonthlyReview (September-October 1973), pp. 3-13.
Schmidt, Peter. “Dickey-Fuller Tests with Drift,” unpublishedmanuscript, Michigan State University (June 1988).
Thornton, Daniel L. “The Borrowed-Reserves Operating Pro-cedure: Theory and Evidence,” this Review (JanuarylFebruary 1988), pp. 30-54.
Throop, Adrian W. “Interest Rate Forecasts and Market Effic-iency,” Federal Reserve Bank of San Francisco EconomicReview (Spring 1981), pp. 29-43.
Webb, Roy H. “The Irrelevance of Tests for Bias in Series ofMacroeconomic Forecasts,” Federal Reserve Bank ofRichmond Economic Review (November/December 1987),pp. 3-9.
White, Halbert. “A Heteroskedasticity-Consistent CovarianceMatrix Estimator and a Direct Test for Heteroskedasticity,”Econometrica (May 1980), pp. 817-38.
FEDERAL RESERVE BANK OF St LOUtS