Embed Size (px)
Citation preview

HAL Id: hal-01412281https://hal.archives-ouvertes.fr/hal-01412281
Submitted on 8 Dec 2016
HAL is a multi-disciplinary open accessarchive for the deposit and dissemination of sci-entific research documents, whether they are pub-lished or not. The documents may come fromteaching and research institutions in France orabroad, or from public or private research centers.
L’archive ouverte pluridisciplinaire HAL, estdestinée au dépôt et à la diffusion de documentsscientifiques de niveau recherche, publiés ou non,émanant des établissements d’enseignement et derecherche français ou étrangers, des laboratoirespublics ou privés.
Distributed under a Creative Commons Attribution| 4.0 International License
Comparing Local e-Government Websites in Canada andthe UK
Laurence Brooks, Alexander Persaud
To cite this version:Laurence Brooks, Alexander Persaud. Comparing Local e-Government Websites in Canada andthe UK. 14th International Conference on Electronic Government (EGOV), Aug 2015, Thessaloniki,Greece. pp.291-304, �10.1007/978-3-319-22479-4_22�. �hal-01412281�

adfa, p. 1, 2011.
© Springer-Verlag Berlin Heidelberg 2011
Comparing Local e-Government Websites in Canada and
the UK
Laurence Brooks1 and Alexander Persaud2
Department of Computer Science, Brunel University London, UK
{[email protected]; [email protected]}
Abstract. This paper provides an evaluation of eight local e-Government web-
sites in Canada and the United Kingdom, utilizing web diagnostic tools. The re-
sults of the diagnostic evaluation are synthesized for a comparative case analysis
between the various local e-Government websites, providing recommendations
for areas of improvement in terms of accessibility. Furthermore, the study will
offer insight into the varied approaches to e-Government website conceptualiza-
tion and design among local officials. While eight local websites are evaluated,
only the city of Calgary and Hillingdon are explored in-depth through interviews
with local officials. The exploration of the use of web diagnostic tools as an eval-
uative method for local e-Government websites will supply local officials and
webmasters with a valuable and feasible option for internal evaluation. The study
is unique in that it evaluates multiple e-Government websites at a local level ra-
ther than a federal level between two countries.
Keywords: local e-government, web diagnostics, UK, Canada
1 Introduction
Over the last decade, increased expectations of online services can be attributed to the
growth of e-Government services [3]. The dramatic growth in academic investigation
of e-Government, as a field, provides significant opportunities to build upon existing
research. Indeed, web developers’ understanding of the conceptualization, delivery,
management, and evaluation of e-Government is in a constant state of change as gov-
ernments and their affiliates adopt new technologies, standards, and practices.
The internet has become an invaluable resource in the daily lives of citizens across
the world, in both private and increasingly public sector services [4]. In acknowledging
this appreciation, it is easily recognizable that e-Government practices are an important
option for public access and engagement. Jati & Dominic [5, p.85] state, ‘The immedi-
acy of the Web creates an immediate expectation of quality and rapid application de-
livery, but the technical complexities of a website and variances in the browser make
testing and quality control more difficult, and in some ways, more subtle.’ Whether it
is at a local or federal level, governments have increasingly acknowledged the need for
providing services through the Internet – commonly known as e-services [6]. With e-
Government services offered through web interfaces, evaluation has become a:
…necessary activity for ensuring returns from investments over time. Financial in-
vestment includes spending on equipment and technology necessary for delivering
Web-based e-government services. Organizational investment, on the other hand tends
to be unobservable, and includes the time and energy that government agencies need to
rethinking, reorganizing and streamlining the service delivery system for the Web-
based e-government initiatives [7, p.2].
While the scale of e-Government investment may not match initiatives at a federal
level, local e-Government investment still must, ‘…be able to justify some form of
return on investment, which typically requires evaluation of the Web-based e-govern-
ment services’ [7, p.2]. Early iterations of local city websites in the 1990s adopted a
bureaucratic paradigm, where the website was administratively oriented. This has
changed more recently as cities that have adopted, ‘…the e-government paradigm, de-
sign their Web sites differently’ [8, p.434]. These new websites tend to use ‘…portal
designs’ [8, p.437].
Wang et al. [7, p.2] state that, ‘…despite the importance of the evaluation of Web-
based e-government services, especially the performance of government Web sites in
facilitating public-government interaction, little research has been generated’, with
most web-based service evaluation focusing on the private sector. Web diagnostic tools
have become a method of evaluation for general websites and e-Government websites.
Evaluative methodologies have been developed for e-Government websites (see [1],
[9] and [7]). Other research studies have all specifically explored e-Government eval-
uations using web diagnostics at a federal level for multiple web portals [5, 6, 10]. Web
diagnostic tools for local e-Government evaluation has significant room for further re-
search and exploration as few studies investigate e-Government evaluation with web
diagnostics, specifically at a local level.
This paper aims to provide a comparative case study analysis of local e-Government
websites in Canada and the United Kingdom in terms of accessibility. In this context
accessibility is defined in general terms as well as at a technical level. A comparative
case study analysis will not only indicate the strengths and weaknesses of each respec-
tive website but will also suggest the varied or similar approaches local officials take
in the conceptualization of e-Government websites in Canada and the United Kingdom.
Eight local e-Government websites in Canada and the United Kingdom were evaluated
using selected web diagnostic tools. The two localities selected for interviews were
Calgary, Canada (http://www.calgary.ca/SitePages/cocis/default.aspx) and Hillingdon,
UK (http://www.hillingdon.gov.uk/residents). The interviews conducted with local of-
ficials from Calgary and Hillingdon were relatively general, as a way to obtain unfore-
seen information.
2 Literature Review
2.1 Conceptualizing e-Government Services
In simple terms, e-Government services can, ‘…deliver information and services
online through the Internet or other digital means’, [11, p.64]. Venkatesh et al. elabo-
rate, stating that: e-Government services can be broadly categorized into informational
and transactional services. Informational services refer to the delivery of government
information via web pages and transactional services involve two-way transactions be-
tween government and citizens (e.g. submission of electronic forms) that may require
horizontal or vertical integration of multiple government agencies [12].
E-services are often centralized within a government portal where citizens can access
a particular service. Kumar et al. state that the challenge of e-Government is not tech-
nical. It is ‘…to use technologies to improve the capacities of government institutions,
while improving the quality of life of citizens by redefining the relationship between
citizens and their government’ [11, p.64]. While e-Government has grown from being
another option or choice for communication with citizens, global trends have made e-
Government a necessity for any country wishing to enter the 21st century as a compet-
itive nation. Beyond the functional benefits of citizen interaction, increased adoption of
e-Government services have the potential for enormous savings and cost reduction (Ku-
mar et al., 2007). Important considerations of web navigation, accessibility, aesthetics,
and content fit within website design. An exemplary website design increases perceived
usefulness and perceived ease of use among citizens, directly impacting e-Government
adoption.
Certain user characteristics such as perceived risk and control may depend on per-
ceptions of financial risk, psychological risk, social risk, convenience risk, and overall
risk. The use of services may be discouraged due to perceptions of risk related to online
security. In the case of the Canadian Government, trust via user identity is verified
through an authentication code via the ePass government system, as well as the imple-
mentation of the Privacy Impact Assessment (PIA) Policy which outlines assessments
for any new or redesigned service that may raise privacy issues [11]. Kumar et al. pre-
sent a conceptualization framework for e-Government adoption in a Canadian context,
though it can apply to other nations as well. Furthermore, while the conceptual frame-
work may focus at a federal level, it can be applied at a local level due to the identifi-
cation of important considerations in high-quality service delivery, engagement, and
growth for e-Government in general.
The provided information and services via e-Government carry a vital purpose
within the public sector, enabling citizens and businesses the completion of important
and necessary tasks. It is therefore important that the conceptual design of e-Govern-
ment services carry thoughtful consideration so that user satisfaction is maintained at a
high standard. As more services are brought online, governments’ ability to maintain
accessible and usable services is important for user acceptance, satisfaction, and trust.
The preference towards self-service can be partly attributed to the significant saving in
time and effort, ease of use, and increased personal control [13]. With self-service in
mind, e-Government websites require thoughtful design considerations to positively
communicate usefulness, as they often act as an entry point towards available e-ser-
vices. Wang et al. [7, p.2] acknowledge the financial benefits of e-Government service
implementation in stating that in order to make investments worthwhile, ‘…govern-
ment agencies must be able to justify some form of return on investment, which typi-
cally requires evaluation of the Web-based e-government services.’ It is further noted
that the performance of government websites in facilitating exchanges between the pub-
lic and government agencies are directly related to the return on government’s invest-
ment in its development of websites and delivered online services [7]. Wang et al. [7,
p.2], state that, ‘At a minimum, assuming the unit cost for a delivered service is less on
a website than through alternative traditional means, each web interaction represents a
cost savings.’
In recognizing the benefits of e-Government, its inevitable growth and ubiquity, and
its importance in developing a meaningful relationship between government and citi-
zens, government must ensure that its e-service websites are accessible and usable for
adoption as well as overall customer satisfaction among citizens. However, even if the
website provides the information necessary to complete the intended task and a con-
sumer struggles when searching or retrieving desired information, the website will be
abandoned [14]. The website must compensate for lack of physical contact experienced
by online shoppers and at the same time make the shopping experience easy and enjoy-
able. In this context, online shoppers are citizens exploring e-services options. Great
importance is placed on the perceived usefulness of a service.
2.2 Methods of Evaluation for e-Government Service Websites
Public authority web evaluation has seen few attempts to propose and use specific
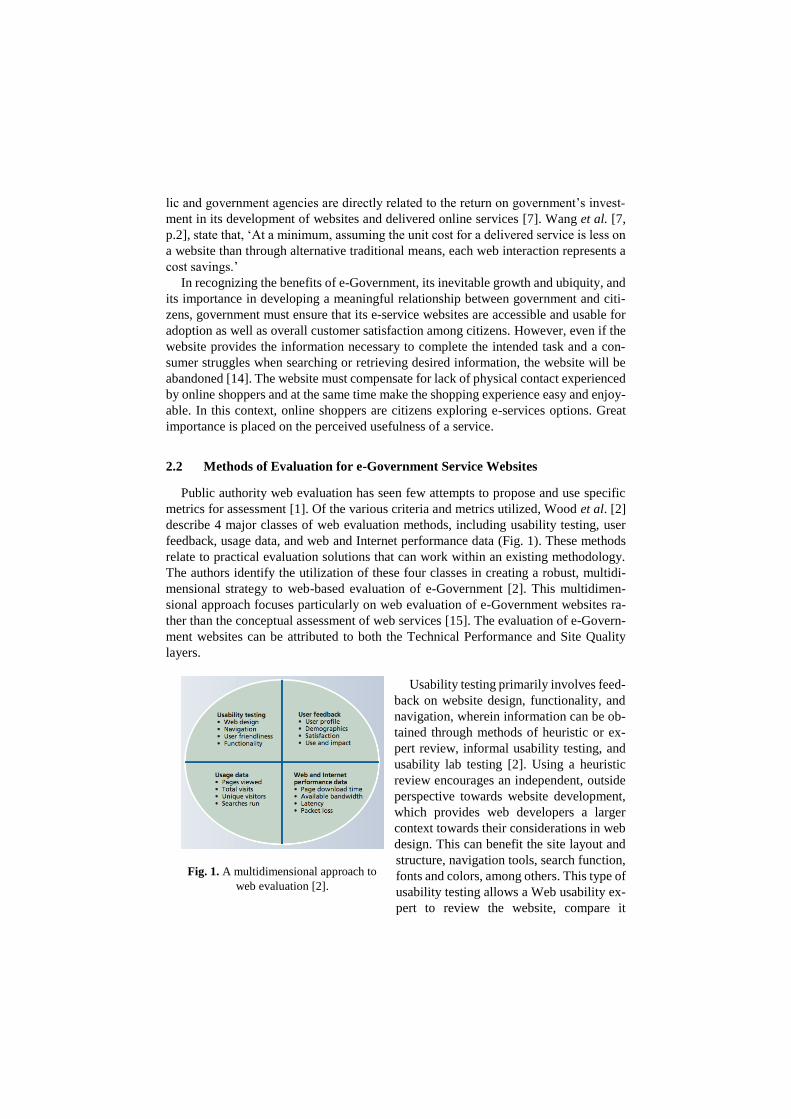
metrics for assessment [1]. Of the various criteria and metrics utilized, Wood et al. [2]
describe 4 major classes of web evaluation methods, including usability testing, user
feedback, usage data, and web and Internet performance data (Fig. 1). These methods
relate to practical evaluation solutions that can work within an existing methodology.
The authors identify the utilization of these four classes in creating a robust, multidi-
mensional strategy to web-based evaluation of e-Government [2]. This multidimen-
sional approach focuses particularly on web evaluation of e-Government websites ra-
ther than the conceptual assessment of web services [15]. The evaluation of e-Govern-
ment websites can be attributed to both the Technical Performance and Site Quality
layers.
Usability testing primarily involves feed-
back on website design, functionality, and
navigation, wherein information can be ob-
tained through methods of heuristic or ex-
pert review, informal usability testing, and
usability lab testing [2]. Using a heuristic
review encourages an independent, outside
perspective towards website development,
which provides web developers a larger
context towards their considerations in web
design. This can benefit the site layout and
structure, navigation tools, search function,
fonts and colors, among others. This type of
usability testing allows a Web usability ex-
pert to review the website, compare it
Fig. 1. A multidimensional approach to
web evaluation [2].
against generally accepted web design and functionality principles, and suggest design
improvements.
Usage data is included among the variety of web evaluation classes with multiple
methods including web log data analysis (in which web log software is installed on the
website server to collect usage data such as page views, total visits, and unique visitors),
and internet audience measurement (in which private companies collect usage data
from large panels of web users who agree to have their web surfing monitored). Usage
data can provide a range of quantitative data at relatively low cost and provide useful
evidence of web trends in relation to the offered e-services.
Pearson et al. [16] identify 6 key criteria in evaluating web usability: Ease of use;
Navigation; Accessibility; Download Speed; Gender; Customization and personaliza-
tion. They state that navigation, download speed, personalization, ease of use, gender,
and accessibility are integral to web usability evaluation. Navigation is an important
consideration relative to consumer preference. Websites aim to achieve customization
and personalization as a way of establishing an ongoing relationship with the customer.
The findings recognize ease of use as the most important in assessing web usability
while personalization and customization as less important. A clear emphasis is placed
on the various criteria’s impact on user satisfaction, with the most notable being down-
load speed/technical performance. These criteria have commonalities with similar eval-
uative methodologies [1].
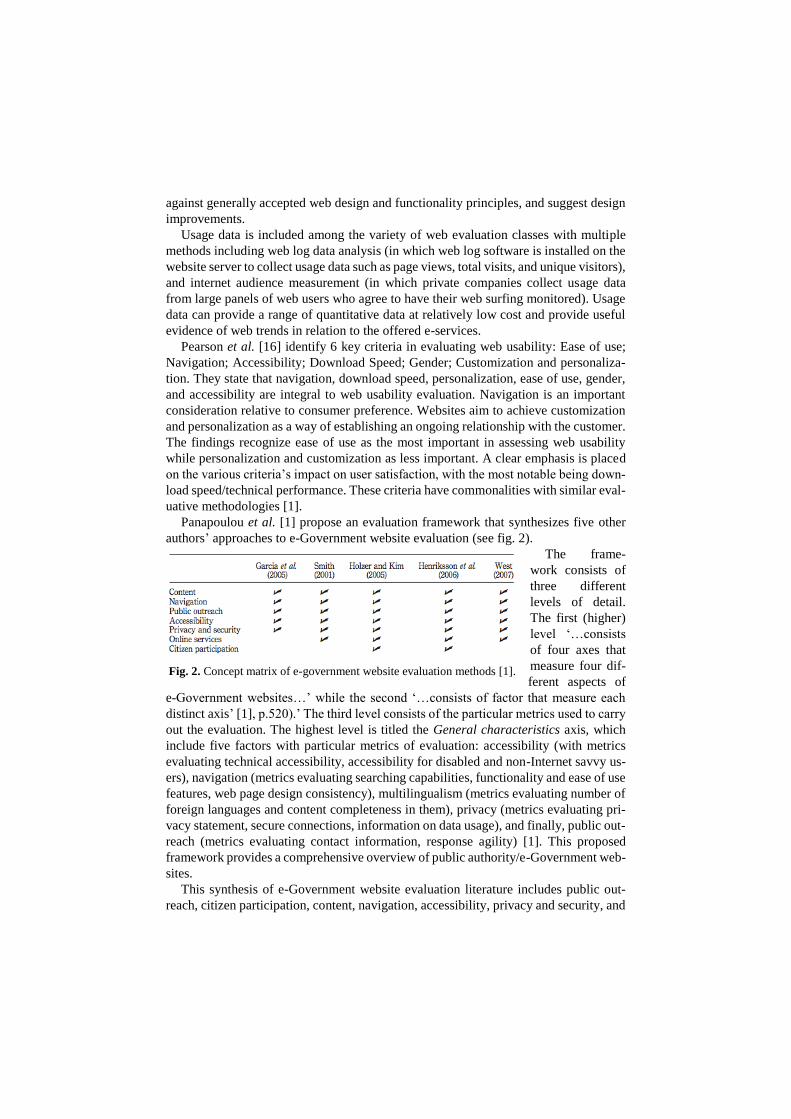
Panapoulou et al. [1] propose an evaluation framework that synthesizes five other
authors’ approaches to e-Government website evaluation (see fig. 2).
The frame-
work consists of
three different
levels of detail.
The first (higher)
level ‘…consists
of four axes that
measure four dif-
ferent aspects of
e-Government websites…’ while the second ‘…consists of factor that measure each
distinct axis’ [1], p.520).’ The third level consists of the particular metrics used to carry
out the evaluation. The highest level is titled the General characteristics axis, which
include five factors with particular metrics of evaluation: accessibility (with metrics
evaluating technical accessibility, accessibility for disabled and non-Internet savvy us-
ers), navigation (metrics evaluating searching capabilities, functionality and ease of use
features, web page design consistency), multilingualism (metrics evaluating number of
foreign languages and content completeness in them), privacy (metrics evaluating pri-
vacy statement, secure connections, information on data usage), and finally, public out-
reach (metrics evaluating contact information, response agility) [1]. This proposed
framework provides a comprehensive overview of public authority/e-Government web-
sites.
This synthesis of e-Government website evaluation literature includes public out-
reach, citizen participation, content, navigation, accessibility, privacy and security, and
Fig. 2. Concept matrix of e-government website evaluation methods [1].
online services. Though these evaluative criteria provide a strong basis for e-Govern-
ment website evaluation, the framework lacks an emphasis on technical performance
aspects that heavily influence user satisfaction. The evaluation framework can add this
seventh metric to provide a holistic overview and better gauge of e-Government web-
site evaluation. In the context of local government websites, an updated Panapoulou et
al. framework incorporating the technical performance criteria described by Pearson et
al. [16] constructs a suitable and well-rounded framework for evaluation. Perhaps the
most important area of consideration for web developers is accessibility and usability,
ensuring that navigation and content is clear and disability access, as well as technical
aspects, are in compliance with popular web standards.
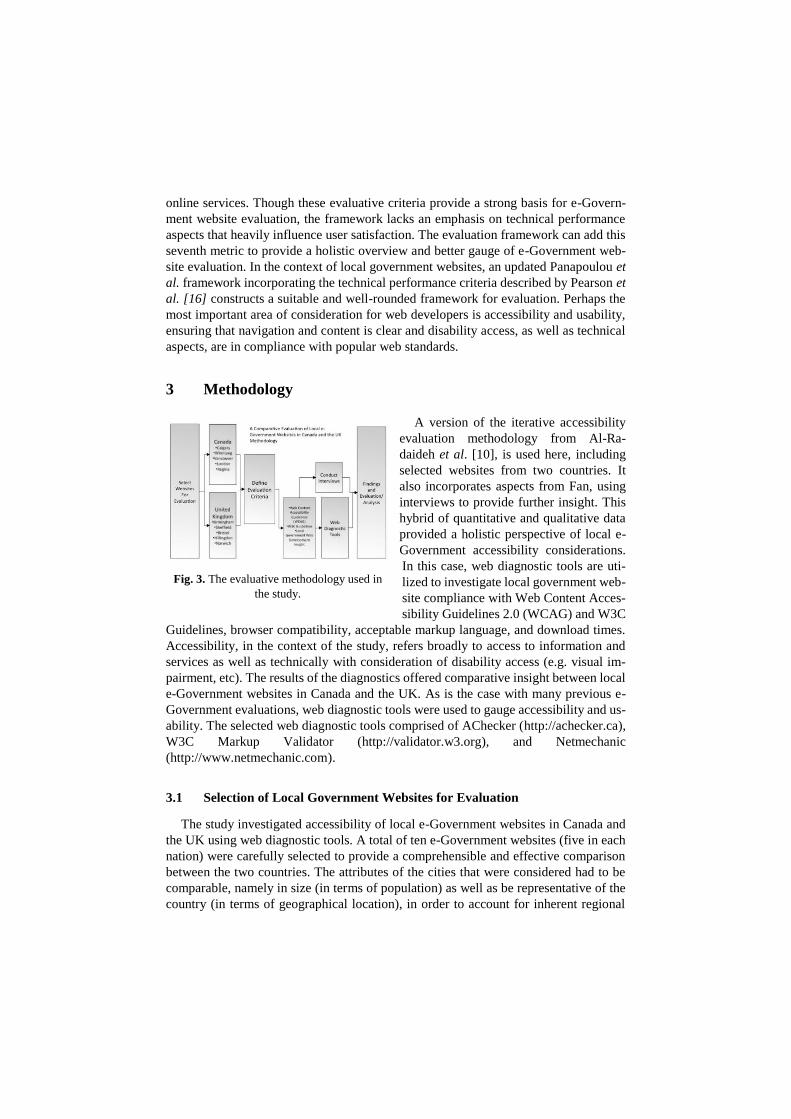
3 Methodology
A version of the iterative accessibility
evaluation methodology from Al-Ra-
daideh et al. [10], is used here, including
selected websites from two countries. It
also incorporates aspects from Fan, using
interviews to provide further insight. This
hybrid of quantitative and qualitative data
provided a holistic perspective of local e-
Government accessibility considerations.
In this case, web diagnostic tools are uti-
lized to investigate local government web-
site compliance with Web Content Acces-
sibility Guidelines 2.0 (WCAG) and W3C
Guidelines, browser compatibility, acceptable markup language, and download times.
Accessibility, in the context of the study, refers broadly to access to information and
services as well as technically with consideration of disability access (e.g. visual im-
pairment, etc). The results of the diagnostics offered comparative insight between local
e-Government websites in Canada and the UK. As is the case with many previous e-
Government evaluations, web diagnostic tools were used to gauge accessibility and us-
ability. The selected web diagnostic tools comprised of AChecker (http://achecker.ca),
W3C Markup Validator (http://validator.w3.org), and Netmechanic
(http://www.netmechanic.com).
3.1 Selection of Local Government Websites for Evaluation
The study investigated accessibility of local e-Government websites in Canada and
the UK using web diagnostic tools. A total of ten e-Government websites (five in each
nation) were carefully selected to provide a comprehensible and effective comparison
between the two countries. The attributes of the cities that were considered had to be
comparable, namely in size (in terms of population) as well as be representative of the
country (in terms of geographical location), in order to account for inherent regional
Fig. 3. The evaluative methodology used in
the study.

disparities. Furthermore, all local government websites had to offer e-services in order
to be considered. With the decreasing significance of homepages (due to search engine
queries and redirection), web diagnostic tools are utilized on e-service specified pages
where less than two clicks are required to access an online service. The presence of e-
services in the context of accessibility is important as it provides the study with insight
into whether local government websites give all citizens the best chance of engaging
with online services. An assumption was made that local government websites that have
similar populations within their jurisdiction will have baseline similarities in budget,
technical infrastructure, and resources in order to serve citizens effectively. In using
population similarity, the scale of e-Government in terms of potential citizens served
was balanced and fair. This process aided in the selection of websites for evaluation.
Therefore, the results of the study better served comparisons between Canada and the
UK. The local websites selected in Canada were, Calgary (http://www.calgary.ca),
Vancouver (http://www.vancouver.ca), London (http://www.london.ca), Winnipeg
(http://www.winnipeg.ca), and Regina (http://www.regina.ca). These Canadian cities
were chosen to provide a broad geographic overview of the country and, for the most
part, have comparable municipalities by measurement of population
(ww12.statcan.gc.ca, 2015).
# City (CAN) Province Population
1 Vancouver British Columbia 2,470,300
2 Calgary Alberta 1,406,700
3 Winnipeg Manitoba 782,600
4 London Ontario 502,400
5 Regina Saskatchewan 237,800
Table 1. Canadian cities ranked by population (statcan.gc.ca, 2015).
The population mean of the selected Canadian cities is about 1,079,960 citizens. 50%
of Canadian provinces are represented. The local websites selected in the United King-
dom were the London borough of Hillingdon (http://www.hillingdon.gov.uk), Birming-
ham (http://www.birmingham.gov.uk), Bristol (http://www.bristol.gov.uk), Sheffield
(https://www.sheffield.gov.uk), and Norwich (http://www.norwich.gov.uk). The UK
cities were similarly selected to provide a broad geographical overview of the country
and provide a comparable average population size in relation to each other as well as
the Canadian cities.
# City (UK) Region Population
1 Birmingham West Midlands 2,453,700
2 Sheffield Yorkshire & the Humber 818,800
3 Bristol Southwest England 706,600
4 Hillingdon London 292,000
5 Norwich East of England 261,400
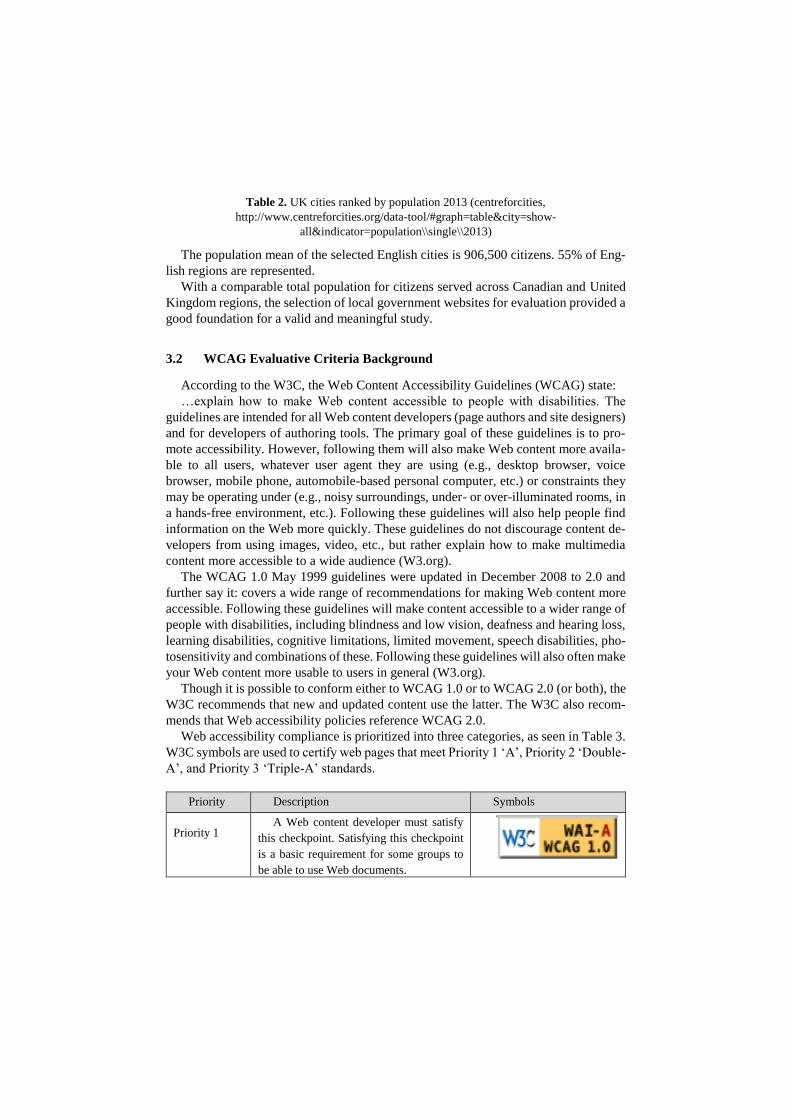
Table 2. UK cities ranked by population 2013 (centreforcities,
http://www.centreforcities.org/data-tool/#graph=table&city=show-
all&indicator=population\\single\\2013)
The population mean of the selected English cities is 906,500 citizens. 55% of Eng-
lish regions are represented.
With a comparable total population for citizens served across Canadian and United
Kingdom regions, the selection of local government websites for evaluation provided a
good foundation for a valid and meaningful study.
3.2 WCAG Evaluative Criteria Background
According to the W3C, the Web Content Accessibility Guidelines (WCAG) state:
…explain how to make Web content accessible to people with disabilities. The
guidelines are intended for all Web content developers (page authors and site designers)
and for developers of authoring tools. The primary goal of these guidelines is to pro-
mote accessibility. However, following them will also make Web content more availa-
ble to all users, whatever user agent they are using (e.g., desktop browser, voice
browser, mobile phone, automobile-based personal computer, etc.) or constraints they
may be operating under (e.g., noisy surroundings, under- or over-illuminated rooms, in
a hands-free environment, etc.). Following these guidelines will also help people find
information on the Web more quickly. These guidelines do not discourage content de-
velopers from using images, video, etc., but rather explain how to make multimedia
content more accessible to a wide audience (W3.org).
The WCAG 1.0 May 1999 guidelines were updated in December 2008 to 2.0 and
further say it: covers a wide range of recommendations for making Web content more
accessible. Following these guidelines will make content accessible to a wider range of
people with disabilities, including blindness and low vision, deafness and hearing loss,
learning disabilities, cognitive limitations, limited movement, speech disabilities, pho-
tosensitivity and combinations of these. Following these guidelines will also often make
your Web content more usable to users in general (W3.org).
Though it is possible to conform either to WCAG 1.0 or to WCAG 2.0 (or both), the
W3C recommends that new and updated content use the latter. The W3C also recom-
mends that Web accessibility policies reference WCAG 2.0.
Web accessibility compliance is prioritized into three categories, as seen in Table 3.
W3C symbols are used to certify web pages that meet Priority 1 ‘A’, Priority 2 ‘Double-
A’, and Priority 3 ‘Triple-A’ standards.
Priority Description Symbols
Priority 1 A Web content developer must satisfy
this checkpoint. Satisfying this checkpoint
is a basic requirement for some groups to
be able to use Web documents.
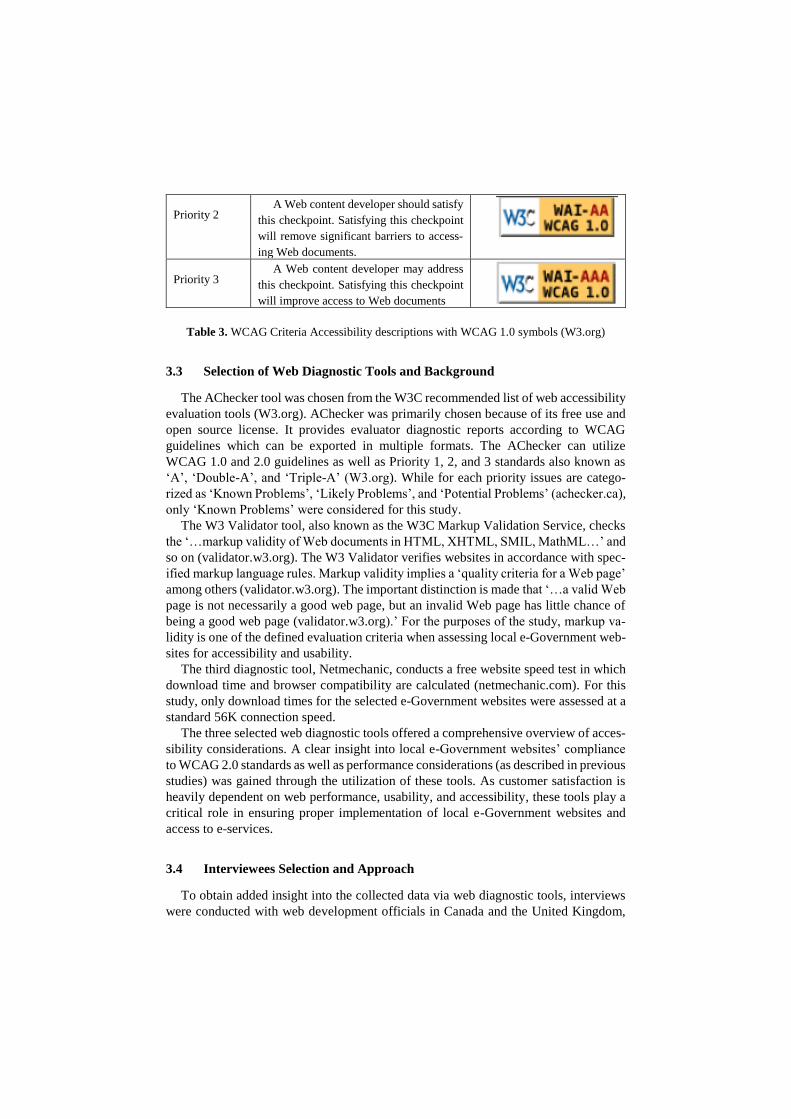
Priority 2 A Web content developer should satisfy
this checkpoint. Satisfying this checkpoint
will remove significant barriers to access-
ing Web documents.
Priority 3 A Web content developer may address
this checkpoint. Satisfying this checkpoint
will improve access to Web documents
Table 3. WCAG Criteria Accessibility descriptions with WCAG 1.0 symbols (W3.org)
3.3 Selection of Web Diagnostic Tools and Background
The AChecker tool was chosen from the W3C recommended list of web accessibility
evaluation tools (W3.org). AChecker was primarily chosen because of its free use and
open source license. It provides evaluator diagnostic reports according to WCAG
guidelines which can be exported in multiple formats. The AChecker can utilize
WCAG 1.0 and 2.0 guidelines as well as Priority 1, 2, and 3 standards also known as
‘A’, ‘Double-A’, and ‘Triple-A’ (W3.org). While for each priority issues are catego-
rized as ‘Known Problems’, ‘Likely Problems’, and ‘Potential Problems’ (achecker.ca),
only ‘Known Problems’ were considered for this study.
The W3 Validator tool, also known as the W3C Markup Validation Service, checks
the ‘…markup validity of Web documents in HTML, XHTML, SMIL, MathML…’ and
so on (validator.w3.org). The W3 Validator verifies websites in accordance with spec-
ified markup language rules. Markup validity implies a ‘quality criteria for a Web page’
among others (validator.w3.org). The important distinction is made that ‘…a valid Web
page is not necessarily a good web page, but an invalid Web page has little chance of
being a good web page (validator.w3.org).’ For the purposes of the study, markup va-
lidity is one of the defined evaluation criteria when assessing local e-Government web-
sites for accessibility and usability.
The third diagnostic tool, Netmechanic, conducts a free website speed test in which
download time and browser compatibility are calculated (netmechanic.com). For this
study, only download times for the selected e-Government websites were assessed at a
standard 56K connection speed.
The three selected web diagnostic tools offered a comprehensive overview of acces-
sibility considerations. A clear insight into local e-Government websites’ compliance
to WCAG 2.0 standards as well as performance considerations (as described in previous
studies) was gained through the utilization of these tools. As customer satisfaction is
heavily dependent on web performance, usability, and accessibility, these tools play a
critical role in ensuring proper implementation of local e-Government websites and
access to e-services.
3.4 Interviewees Selection and Approach
To obtain added insight into the collected data via web diagnostic tools, interviews
were conducted with web development officials in Canada and the United Kingdom,
specifically in the localities of Calgary and Hillingdon. An interview was conducted
with the team lead for web and digital services in Calgary. A joint interview between
the project manager on the access channel migration team and team lead for web de-
velopment in Hillingdon was also carried out. Interviews were recorded and performed
in a semi-structured approach with prepared general, open-ended questions. The pur-
pose of the interviews was to gain insight into the strategies regarding local e-Govern-
ment website conceptualization, as well as, to learn of the special considerations that
are made with regards to usability and accessibility towards services. For the inter-
views, qualitative data analysis took place through thematic analysis and data coding.
The thematic analysis process begins with a collection of data, an identification of data
that relate to classified patterns, sub-themes combination and cataloguing, and the con-
struction of a valid argument for chosen themes based on related literature [17]. The
identified themes in the study build upon those discussed in the literature review. The
transcribed interviews categorized information into common themes of preset catego-
ries, although room was left to identify emergent categories. By codifying persistent
themes, an identification of connections between categories and their relative im-
portance was conducted with some visible overlap.
3.5 Interview Analysis: Thematic Analysis
Utilizing a thematic analysis method, interview transcripts were studied for common
themes. Initially, preset data categories were used via Fan’s local government study
[18]. Fan’s themes include ‘top leadership support and management capacity’, ‘organ-
izational and technical challenges’, ‘user-centred e-government approach’, and ‘bridg-
ing the digital divide’ [18]. While these preconceived themes aided in categorization,
new themes became apparent through further analysis. Through data coding and iden-
tification of subcategories, five major themes were identified from interview tran-
scripts. These themes were, (1) a user-oriented approach, (2) organizational challenges,
(3) integration expectations and challenges, (4) adaptation and growth of access chan-
nels, and (5) evaluative methods/tools. The fifth theme can be considered a subcategory
of organizational challenges. The interviewees identified evaluative tools utilized for
e-Government website improvement with statistic and analytic tools playing a major
role in identifying web trends. Based on interview data, the Hillingdon web develop-
ment team takes more into consideration with regards to accessibility at a technical
level than the Calgary team. This is consistent with acquired web diagnostic data, indi-
cating greater accessibility compliance in the UK.
4 Findings
4.1 Diagnostic Results
The following graphs show the results of the diagnostics on the Canadian and UK
local e-Government websites, using AChecker, Netmechanic and W3 Validator. Both
the UK and Canadian websites were both compared internally within country, as well
as between countries. The results will also be discussed in light of their interpretation.
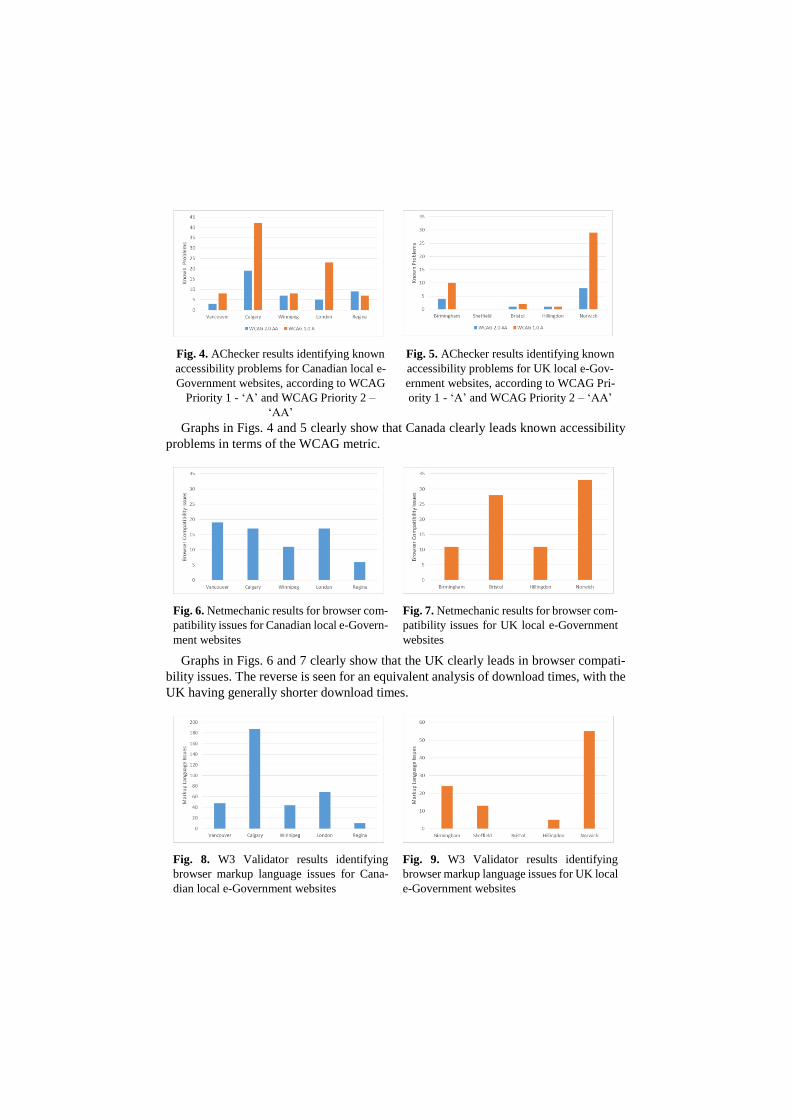
Fig. 4. AChecker results identifying known
accessibility problems for Canadian local e-
Government websites, according to WCAG
Priority 1 - ‘A’ and WCAG Priority 2 –
‘AA’
Fig. 5. AChecker results identifying known
accessibility problems for UK local e-Gov-
ernment websites, according to WCAG Pri-
ority 1 - ‘A’ and WCAG Priority 2 – ‘AA’
Graphs in Figs. 4 and 5 clearly show that Canada clearly leads known accessibility
problems in terms of the WCAG metric.
Fig. 6. Netmechanic results for browser com-
patibility issues for Canadian local e-Govern-
ment websites
Fig. 7. Netmechanic results for browser com-
patibility issues for UK local e-Government
websites
Graphs in Figs. 6 and 7 clearly show that the UK clearly leads in browser compati-
bility issues. The reverse is seen for an equivalent analysis of download times, with the
UK having generally shorter download times.
Fig. 8. W3 Validator results identifying
browser markup language issues for Cana-
dian local e-Government websites
Fig. 9. W3 Validator results identifying
browser markup language issues for UK local
e-Government websites

Graphs in Figs. 8 and 9 clearly show that overall Canada clearly leads in markup
language issues.
4.2 Results Overview
The graphs illustrate the stark differences between Canada and the UK in the context
of WCAG accessibility compliance metrics, with an overall advantage to the UK. The
thematic analysis of interview transcripts produced five key areas of insight. Interviews
were conducted with the purpose of providing insight into conceptualization of e-ser-
vice delivery and accessibility. Interestingly, three out of four metrics of evaluation
identified greater accessibility compliance in the UK. While diagnostic data identified
an advantage in technical compliance, interview data suggested that the Canadian city
of Calgary web and digital services team have a better integrated organizational struc-
ture, allowing for quick and responsive changes to e-service delivery. In short, while
Calgary’s technical presentation of e-services is relatively poor in terms of accessibil-
ity, its organizational structure allows for greater flexibility. Conversely, in the London
borough of Hillingdon, there are more organizational challenges in managing third par-
ties and integrating services. Third party services are presented and organized on Hil-
lingdon’s homepage, acting much more as a web portal in relation to Tat-Kei Ho’s
description of the user-oriented approach than Calgary’s post-homepage user-oriented
approach.
5 Discussion and Conclusion
The research builds upon evaluative e-Government studies using previous web di-
agnostic tools by [5, 6, 9, 10]. Further, the study provided insight into local web devel-
opment teams perspectives on user-oriented approaches, organizational and integration
challenges, adaptation and growth of access channels, and evaluative methods and tools
used. This interview approach emulated a previous investigation into local official in-
sight regarding e-services conceptualization [18].
Future research opportunities include conducting interviews with other local offi-
cials to compare e-service conceptualization sentiment across regions. As interview
data suggests, the homepage is no longer a major area of consideration in the delivery
of e-services. Therefore, one can examine the implication of this shift in website presen-
tation and what it means for accessibility at a technical and conceptual level.
This paper offered an exploration of the use of web diagnostic tools as an evaluative
method for local e-Government websites, which provides local officials and webmas-
ters a valuable and feasible option for internal evaluation. The results revealed greater
accessibility compliance for local e-Government websites in the UK. For individual
cities, interview data suggests the organizational structuring in Calgary better served
effective, efficient, and responsive online service delivery as opposed to Hillingdon,
which faces added organizational and integration challenges. For both parties, explora-
tion of new access channel strategies and platforms provide encouraging prospects for
the future of local e-Government development.

References
1. Panopoulou, E., Tambouris, E., Tarabanis, K.: A framework for evaluating web sites of public
authorities. In: Aslib Proceedings, pp. 517-546. Emerald Group Publishing Limited, (2008)
2. Wood, F., Siegel, E., LaCroix, E., Lyon, B., Benson, D., Cid, V., Fariss, S.: A practical
approach to e-government Web evaluation. IT Professional 5, 22-28 (2003)
3. Heeks, R., Bailur, S.: Analyzing e-government research: Perspectives, philosophies, theories,
methods, and practice. Government Information Quarterly 24, 243-265 (2007)
4. Henriksson, A., Yi, Y., Frost, B., Middleton, M.: Evaluation instrument for e-government
websites. Electronic Government, an International Journal 4, 204-226 (2007)
5. Jati, H., Dominic, D.D.: Quality evaluation of e-government website using web diagnostic
tools: Asian case. In: International Conference on Information Management and Engineering,
(ICIME'09), pp. 85-89. IEEE, (2009)
6. Choudrie, J., Ghinea, G., Weerakkody, V.: Evaluating global e-government sites: A view
using web diagnostics tools. e-Journal of e-Government 2, 105-114 (2004)
7. Wang, L., Bretschneider, S., Gant, J.: Evaluating web-based e-government services with a
citizen-centric approach. In: Proceedings of the 38th Annual Hawaii International Conference
on System Sciences. IEEE, (2005)
8. Tat-Kei Ho, A.: Reinventing local governments and the e‐government initiative. Public
administration review 62, 434-444 (2002)
9. Ma, H.-Y.T., Zaphiris, P.: The usability and content accessibility of the e-government in the
UK. Universal access in HCI 760-764 (2003)
10. Al-Radaideh, M., Nuser, M., Wahbeh, A.: Evaluating Accessibility of Jordanian E-
Government Websites for People with Disabilities. In: Proceedings of International
Conference on Information & Communication Systems (ICICS), pp. 127-131. Citeseer,
(2011)
11. Kumar, V., Mukerji, B., Butt, I., Persaud, A.: Factors for successful e-government adoption:
a conceptual framework. The electronic journal of e-Government 5, 63-76 (2007)
12. Venkatesh, V., Chan, F.K., Thong, J.Y.: Designing e-government services: Key service
attributes and citizens’ preference structures. Journal of Operations Management 30, 116-133
(2012)
13. Meuter, M.L., Ostrom, A.L., Roundtree, R.I., Bitner, M.J.: Self-service technologies:
understanding customer satisfaction with technology-based service encounters. Journal of
marketing 64, 50-64 (2000)
14. McKinney, V., Yoon, K., Zahedi, F.M.: The measurement of web-customer satisfaction: An
expectation and disconfirmation approach. Information systems research 13, 296-315 (2002)
15. Halaris, C., Magoutas, B., Papdomichelaki, X., Mentzas, G.: Classification and Synthesis of
Quality Approaches in E- government Services. Internet Research 17, 378-401 (2007)
16. Pearson, J., Pearson, A., Green, D.: Determining the importance of key criteria in web
usability. Management Research News 30, 816-828 (2007)
17. Taylor-Powell, E., Renner, M.: Analyzing qualitative data. University of Wisconsin--
Extension, Cooperative Extension (2003)
18. Fan, Q.: An evaluation analysis of e-government development by local authorities in
Australia. International Journal of Public Administration 34, 926-934 (2011)