Embed Size (px)
Citation preview
Comparing major cloud-serviceproviders: virtual processorperformanceA Cloud Report by Danny Gee, and Kenny Li
Comparing major cloud-service providers:virtual processor performance09/03/2014
Table of Contents
1. Executive Summary
2. The IaaS industry
3. Methodology and limitations
4. Performance findings
5. Price and performance findings
6. Conclusion
7. Appendix
8. About Cloud Spectator
9. About Gigaom Research
10. Copyright
Comparing major cloud-service providers: virtual processor performanceThis PDF prepared for: Danny Gee ([email protected])
2
1 Executive Summary
Cloud computing continues to play an increasingly important role for IT organizations in 2014. Inpartnership with Cloud Spectator, Gigaom Research conducted research to determine howthree major cloud providers — Amazon EC2, Microsoft Azure and Rackspace Cloud —perform with regards to processor and memory.
The three providers were tested using Geekbench 3 standardized tests over a three-day periodof time. Individual test results proved a variability of as much as 25 percent. The complex ofvariables between cloud providers beyond just processor and memory can contribute heavily tothis variability in results. Tests were conducted over a three-day period to normalize the results.With each provider, different configurations of each solution were tested to demonstrate thevariability and value between configurations. In addition, the provider’s updated hardwareconfigurations were used to ensure currency.
It should be noted that the tests in this research focused on the performance of processor andmemory only. There are a number of other variables (network, architecture, etc) that can varythe results for a specific application or service.
Key findings in this report include:
• Rackspace led in performance, though this was offset by a higher variability.
• Microsoft and Amazon showed stable results, but at a lower-performance rate.
• Rackspace demonstrated a 2x value over Amazon and Microsoft. Value is defined as theratio of cost and performance.
• Amazon’s Reserve Instances provide an alternative that brings the cost/performance ratiocloser to that of Rackspace. Depending on the specific use case, one solution may be moreappropriate than the other.
Comparing major cloud-service providers: virtual processor performanceThis PDF prepared for: Danny Gee ([email protected])
3
2 The IaaS industry
Public-cloud infrastructure, often referred to as infrastructure as a service (IaaS), provides pay-as-you-go, on-demand virtual servers with scalability to grow with an organization’s IT demands.Unlike in a private cloud, in which businesses use dedicated hardware to create virtualenvironments, public IaaS users provision virtual machines on shared hardware resources,where different users reside on the same physical server(s).
Amazon EC2, Rackspace Cloud, and Microsoft Azure are three of the largest global public-cloudservice providers (CSPs). With cloud-enabled regions around the world and a diverse portfolioof supplementary technology offerings, all three of these CSPs deliver a robust suite of ITservices.
Over the past several years, some CSPs and third-party companies have made a collectiveeffort to provide transparency on available features, pricing, and security. But one nebulousissue — performance — is still unaddressed due to its complexity.
Performance variability
In our study we observed two instances of performance variability within a single cloud datacenter:
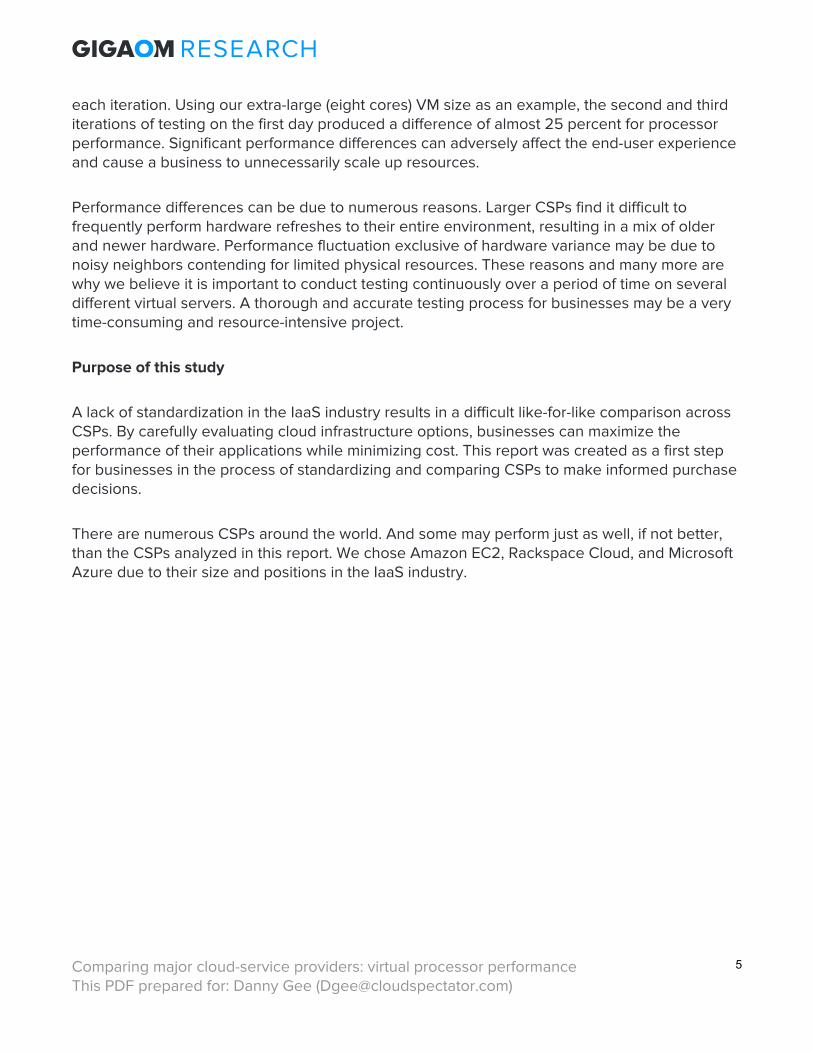
Type 1. Different underlying hardware. In our three days of testing across Amazon EC2, ourvirtual machines provisioned on two different processors: the Intel(R) Xeon(R) CPU E5-2670 v2@ 2.50GHz and Intel(R) Xeon(R) CPU E5-2680 v2 @ 2.80GHz. The former was continuouslyseen with the m3.medium instance, and occasionally on the c3.2xlarge instance. The latterprocessor was reported on every test iteration of the c3.large and c3.xlarge, and occasionallyon the c3.2xlarge instance. When the c3.2xlarge instance was provisioned with the Intel(R)Xeon(R) CPU E5-2670 v2 @ 2.50GHz processor, performance dropped by around 7 to 8percent.
A list of the underlying processor hardware behind the virtual cores tested in this study.
Type 2.Different physical servers. On Rackspace Cloud, only one processor was reported on the BIOSfrom all virtual machine sizes and iterations. Despite this fact, performance ranges varied with
Comparing major cloud-service providers: virtual processor performanceThis PDF prepared for: Danny Gee ([email protected])
4
each iteration. Using our extra-large (eight cores) VM size as an example, the second and thirditerations of testing on the first day produced a difference of almost 25 percent for processorperformance. Significant performance differences can adversely affect the end-user experienceand cause a business to unnecessarily scale up resources.
Performance differences can be due to numerous reasons. Larger CSPs find it difficult tofrequently perform hardware refreshes to their entire environment, resulting in a mix of olderand newer hardware. Performance fluctuation exclusive of hardware variance may be due tonoisy neighbors contending for limited physical resources. These reasons and many more arewhy we believe it is important to conduct testing continuously over a period of time on severaldifferent virtual servers. A thorough and accurate testing process for businesses may be a verytime-consuming and resource-intensive project.
Purpose of this study
A lack of standardization in the IaaS industry results in a difficult like-for-like comparison acrossCSPs. By carefully evaluating cloud infrastructure options, businesses can maximize theperformance of their applications while minimizing cost. This report was created as a first stepfor businesses in the process of standardizing and comparing CSPs to make informed purchasedecisions.
There are numerous CSPs around the world. And some may perform just as well, if not better,than the CSPs analyzed in this report. We chose Amazon EC2, Rackspace Cloud, and MicrosoftAzure due to their size and positions in the IaaS industry.
Comparing major cloud-service providers: virtual processor performanceThis PDF prepared for: Danny Gee ([email protected])
5
3 Methodology and limitations
Methodology
The study was conducted by provisioning virtual machines (VMs) on each of the three providers.On each provider, four different virtual machines were provisioned to measure performance asthe VMs scaled. Due to variable offerings across providers, an exact configuration for all virtualmachines is not possible to achieve, but due to the focus on processor and memory in thisreport, providers were matched with equivalent amounts of vCPUs. (See Appendix for list ofinstance types.)
Because Geekbench 3 was designed to service many different markets, it was not designedwith one particular workload in mind. Rather, it contains modern workloads that are commontasks for servers and desktops (e.g., compression, decompression, encryption, and dynamiccontent generation). While Geekbench 3 minimizes the effect of the operating system on thefinal score there are inevitably variables outside of the control of the program that may affectthe performance such as compilers used by different operating systems. Therefore, this studystandardized the version of each operating system to Ubuntu 14.04.
The Geekbench 3 suite was installed and run on each of the VMs. Three test iterations were runper day on each instance type for a period of three days. For each iteration a new VM wasprovisioned, tested, and deleted, rather than starting and stopping the same VMs over thecourse of the study. Longitudinal data from testing over time helps illustrate the complexity ofpublic cloud resource contention or provider throttling. The graph below shows Rackspace’sinteger score over the nine iterations of tests run on different virtual machines of the same size(8GB Performance). The mean shows a score of 18535, although on Test 2, the score drops to15538, a 3,000-point difference—approximately 80 percent of the mean. (See Appendix fornotes on provisioning.)
Rackspace Cloud’s 8GB Performance VM scores over a three-day period, which includedthree iterations per day. Results show the performance outliers that can occur below andabove average.
Comparing major cloud-service providers: virtual processor performanceThis PDF prepared for: Danny Gee ([email protected])
6
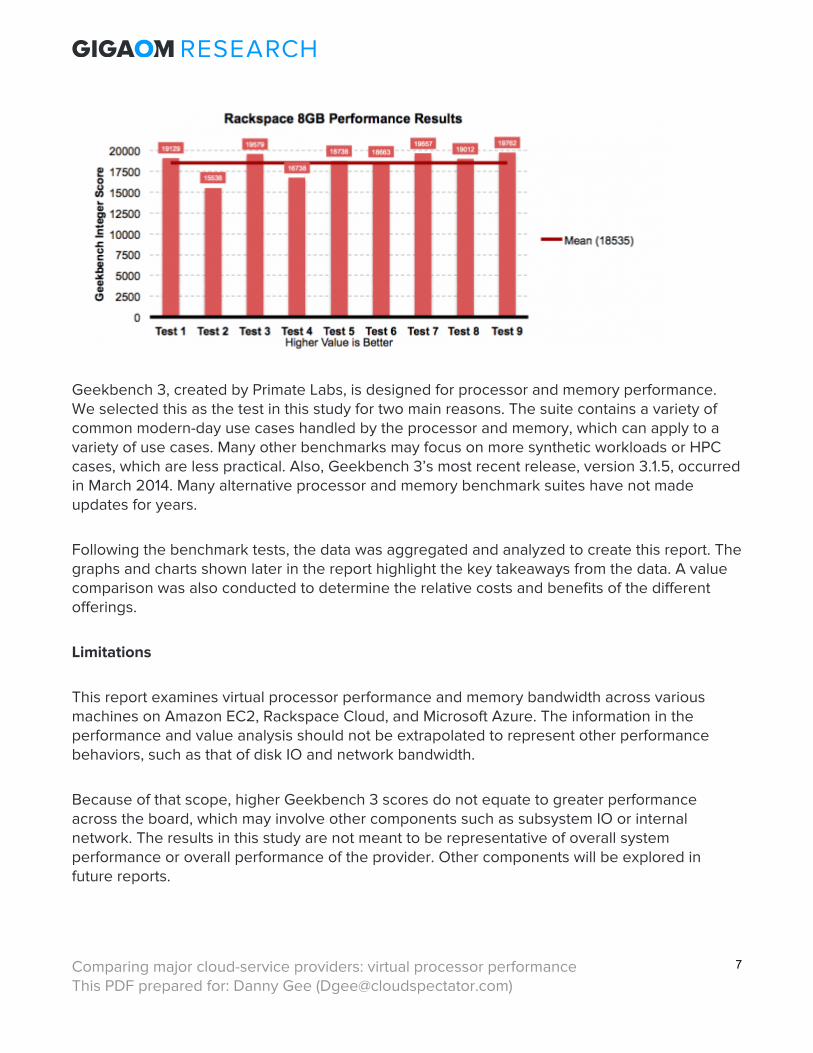
Geekbench 3, created by Primate Labs, is designed for processor and memory performance.We selected this as the test in this study for two main reasons. The suite contains a variety ofcommon modern-day use cases handled by the processor and memory, which can apply to avariety of use cases. Many other benchmarks may focus on more synthetic workloads or HPCcases, which are less practical. Also, Geekbench 3’s most recent release, version 3.1.5, occurredin March 2014. Many alternative processor and memory benchmark suites have not madeupdates for years.
Following the benchmark tests, the data was aggregated and analyzed to create this report. Thegraphs and charts shown later in the report highlight the key takeaways from the data. A valuecomparison was also conducted to determine the relative costs and benefits of the differentofferings.
Limitations
This report examines virtual processor performance and memory bandwidth across variousmachines on Amazon EC2, Rackspace Cloud, and Microsoft Azure. The information in theperformance and value analysis should not be extrapolated to represent other performancebehaviors, such as that of disk IO and network bandwidth.
Because of that scope, higher Geekbench 3 scores do not equate to greater performanceacross the board, which may involve other components such as subsystem IO or internalnetwork. The results in this study are not meant to be representative of overall systemperformance or overall performance of the provider. Other components will be explored infuture reports.
Comparing major cloud-service providers: virtual processor performanceThis PDF prepared for: Danny Gee ([email protected])
7
4 Performance findings
The trade-offs between price, performance, and stability can be seen between the threeproviders. Rackspace’s leadership position on vCPU performance throughout this experiment isoffset by its variability in performance. On the other hand, Microsoft Azure and Amazon EC2’sperformance over the duration of this experiment result in a more stable environment, but alsolower vCPU performance. Amazon EC2’s long-term discounts (referred to as ReservedInstances) give users a great option for price and performance value when committing to theirvirtual machines for a longer period of time.
Top performers by average
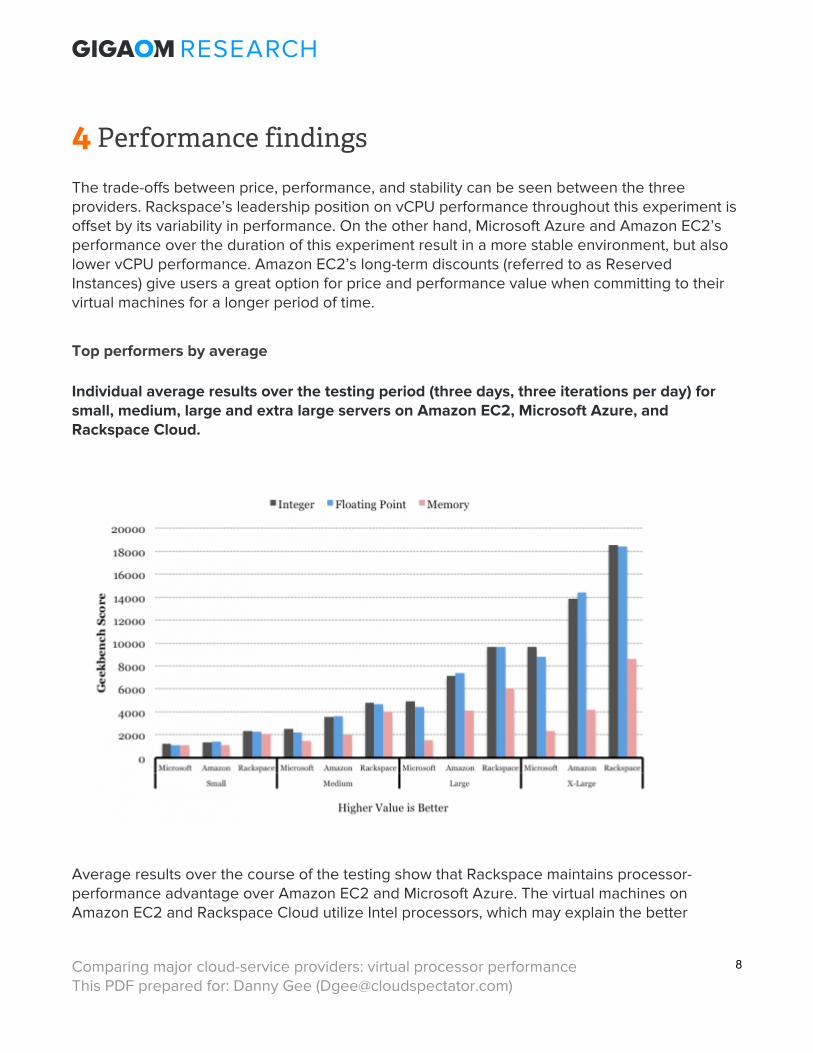
Individual average results over the testing period (three days, three iterations per day) forsmall, medium, large and extra large servers on Amazon EC2, Microsoft Azure, andRackspace Cloud.
Average results over the course of the testing show that Rackspace maintains processor-performance advantage over Amazon EC2 and Microsoft Azure. The virtual machines onAmazon EC2 and Rackspace Cloud utilize Intel processors, which may explain the better
Comparing major cloud-service providers: virtual processor performanceThis PDF prepared for: Danny Gee ([email protected])
8
performance between floating point and integer CPU tests, compared with Microsoft Azure’sAMD Opteron processors.
Top performers by high score
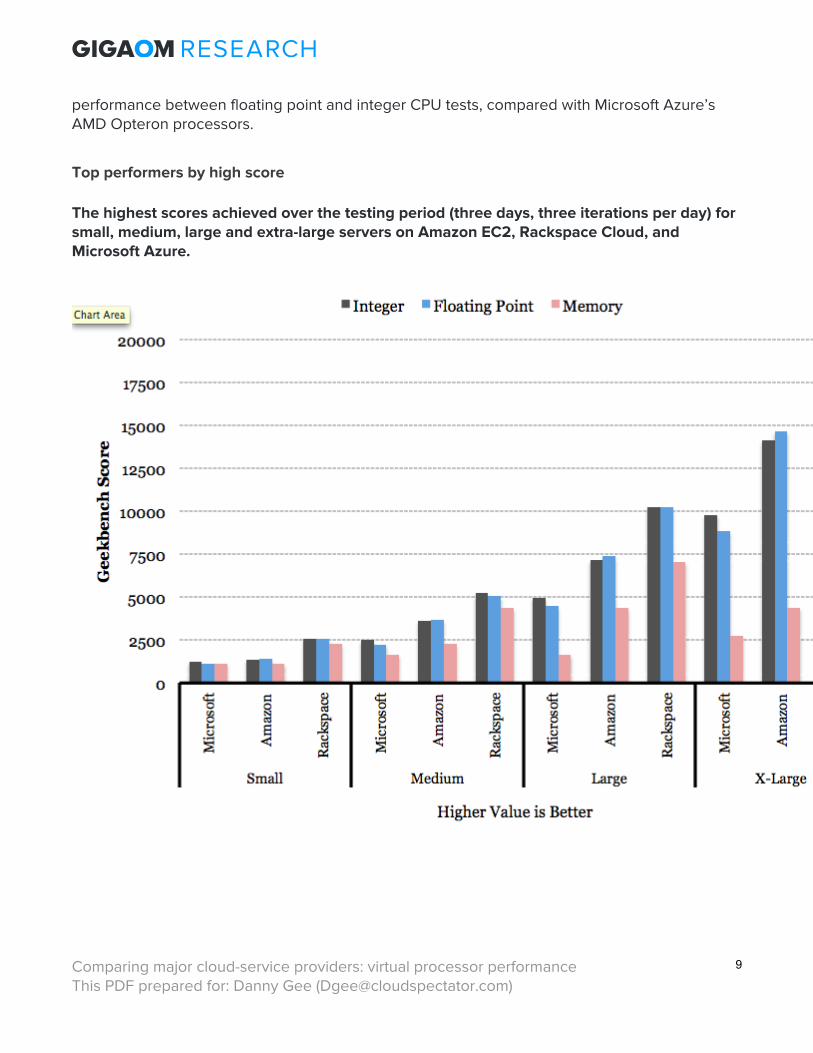
The highest scores achieved over the testing period (three days, three iterations per day) forsmall, medium, large and extra-large servers on Amazon EC2, Rackspace Cloud, andMicrosoft Azure.
Comparing major cloud-service providers: virtual processor performanceThis PDF prepared for: Danny Gee ([email protected])
9
Rackspace achieves the highest performance numbers compared with Amazon EC2 andMicrosoft Azure in the course of this experiment as well. Rackspace’s high scores contribute tothe high averages.
Performance stability
The percentage of variability over the testing period (3 days, 3 iterations per day) for small,medium, large and extra large servers on Amazon EC2, Microsoft Azure, and RackspaceCloud. Variability is calculated by expressing the ratio of standard deviation and mean as apercentage.
Comparing major cloud-service providers: virtual processor performanceThis PDF prepared for: Danny Gee ([email protected])
10
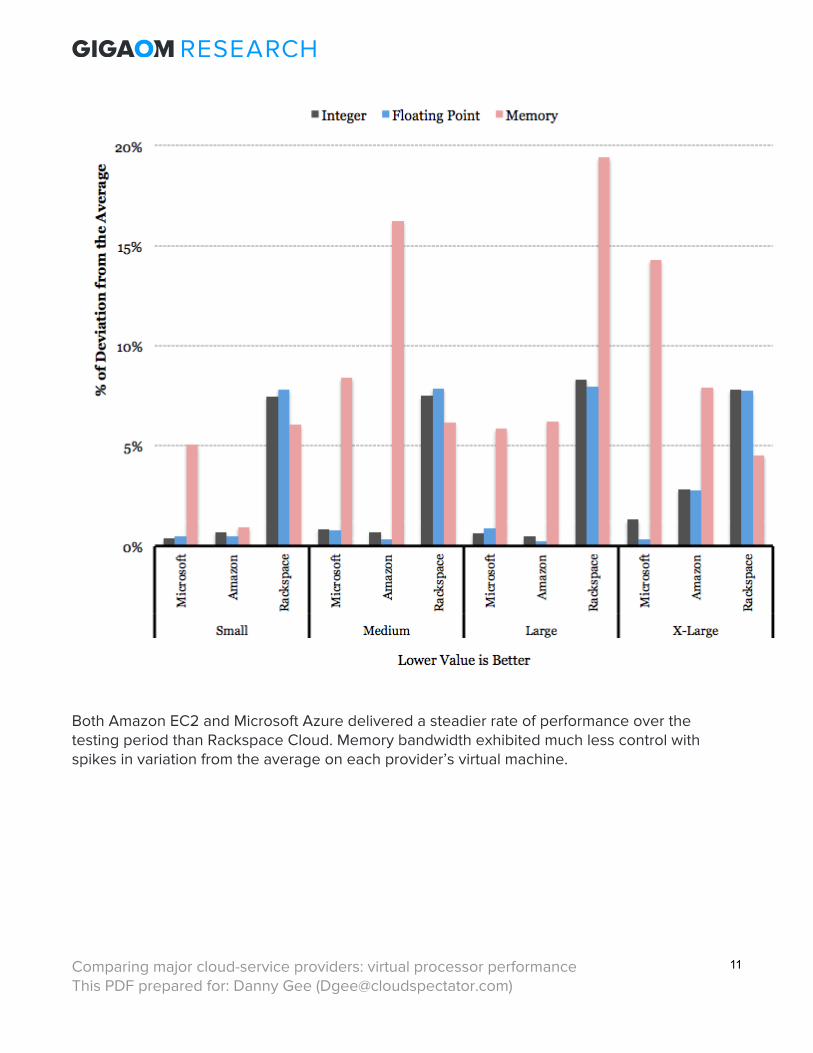
Both Amazon EC2 and Microsoft Azure delivered a steadier rate of performance over thetesting period than Rackspace Cloud. Memory bandwidth exhibited much less control withspikes in variation from the average on each provider’s virtual machine.
Comparing major cloud-service providers: virtual processor performanceThis PDF prepared for: Danny Gee ([email protected])
11
5 Price and performance findings
Value in this study is defined as the ratio between the cost (per hour or per year) and theperformance score achieved from the Geekbench 3 tests run on the four virtual machine typeswith each CSP.
Each provider’s score is indexed such that the highest-value CSP receives a score of 100. Allother providers are pegged relative to the highest score. For example, if Provider A receives ascore of 100 and Provider B receives a score of 50, then Provider A offers 2x more value for, in
this case, processor and/or memory performance. This is called the CloudSpecs ScoreTM.
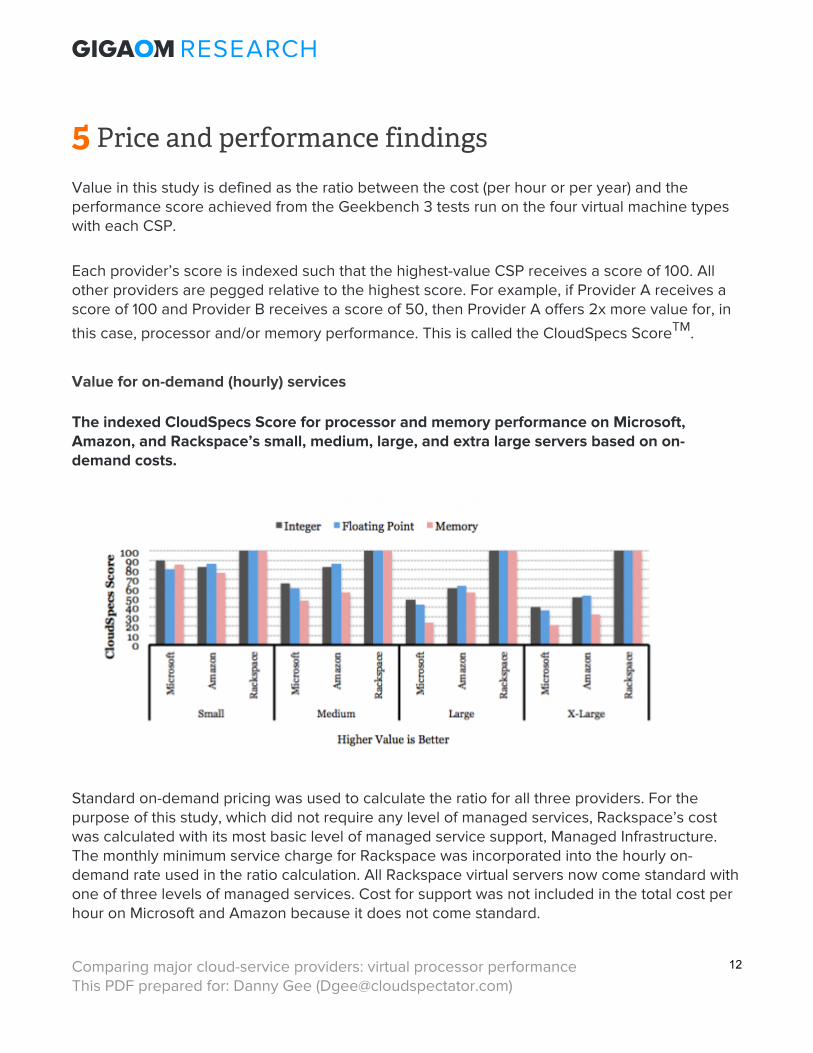
Value for on-demand (hourly) services
The indexed CloudSpecs Score for processor and memory performance on Microsoft,Amazon, and Rackspace’s small, medium, large, and extra large servers based on on-demand costs.
Standard on-demand pricing was used to calculate the ratio for all three providers. For thepurpose of this study, which did not require any level of managed services, Rackspace’s costwas calculated with its most basic level of managed service support, Managed Infrastructure.The monthly minimum service charge for Rackspace was incorporated into the hourly on-demand rate used in the ratio calculation. All Rackspace virtual servers now come standard withone of three levels of managed services. Cost for support was not included in the total cost perhour on Microsoft and Amazon because it does not come standard.
Comparing major cloud-service providers: virtual processor performanceThis PDF prepared for: Danny Gee ([email protected])
12
Due to high-scoring performance and low on-demand costs, Rackspace achieves a much highervalue score than its competitors for processor and memory performance for on-demand pricing.While Microsoft’s servers are matched closely in price with Amazon, the higher performance
results on Amazon gives Amazon an advantage over Microsoft in the CloudSpecs ScoreTM.
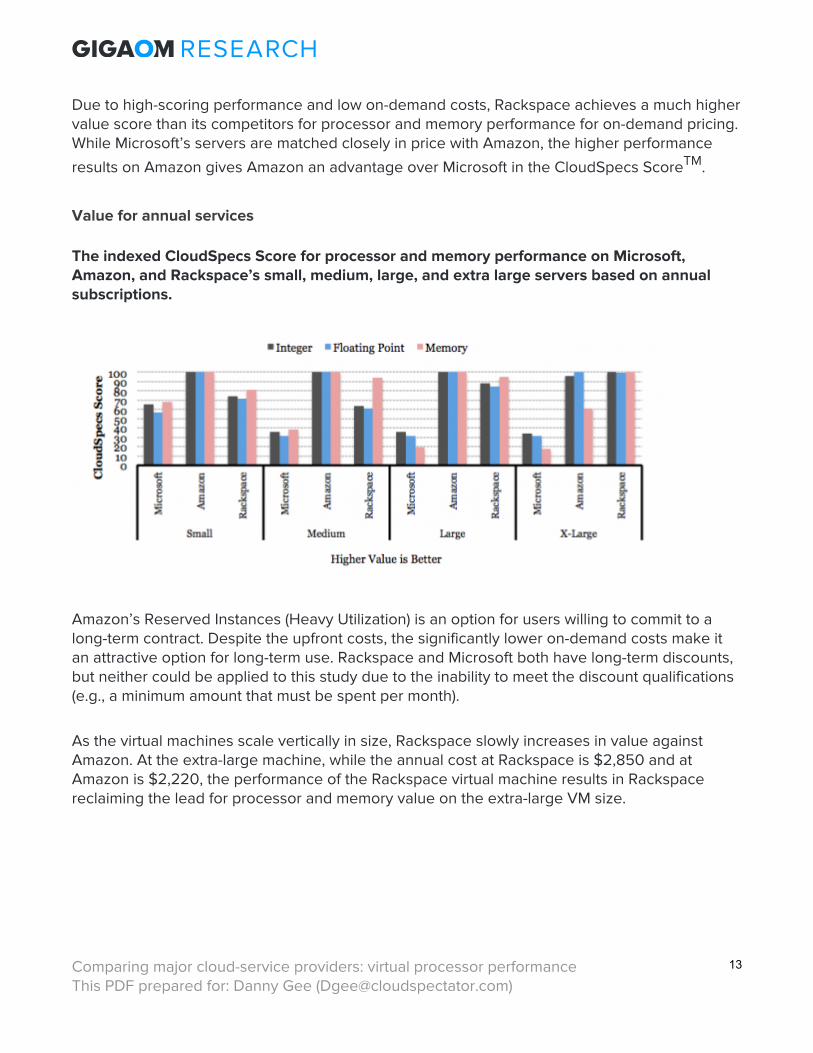
Value for annual services
The indexed CloudSpecs Score for processor and memory performance on Microsoft,Amazon, and Rackspace’s small, medium, large, and extra large servers based on annualsubscriptions.
Amazon’s Reserved Instances (Heavy Utilization) is an option for users willing to commit to along-term contract. Despite the upfront costs, the significantly lower on-demand costs make itan attractive option for long-term use. Rackspace and Microsoft both have long-term discounts,but neither could be applied to this study due to the inability to meet the discount qualifications(e.g., a minimum amount that must be spent per month).
As the virtual machines scale vertically in size, Rackspace slowly increases in value againstAmazon. At the extra-large machine, while the annual cost at Rackspace is $2,850 and atAmazon is $2,220, the performance of the Rackspace virtual machine results in Rackspacereclaiming the lead for processor and memory value on the extra-large VM size.
Comparing major cloud-service providers: virtual processor performanceThis PDF prepared for: Danny Gee ([email protected])
13
6 Conclusion
CSPs offer varying amounts of value for similarly described products. Providers find ways tojustify the price differentials between themselves and their competitors, but on a basic level ofprice and performance, some machines simply offer more value than others.
As shown above, Rackspace’s current generation of servers are offering a higher level ofperformance compared to its peers. While this comes at a cost of lower stability in performance,the overall increase in performance may be worth it to customers.
Examining the value of the services, Rackspace’s performance leadership translates over toprice/performance value for on-demand hourly services. However, Amazon’s discounts for long-term usage raise it above or to the same level as Rackspace for customers that are able tocommit to at least a year of continuous usage.
Amazon continues to dominate the market for IaaS while Microsoft is steadily pushing to catchup. Rackspace meanwhile is focusing on its premium service differentiation and has recentlysegmented its cloud offering into Managed Operations and Managed Infrastructure. With pricesslated to keep dropping and performance expected to rise with newer hardware, it would bewise to keep an eye on the price/performance value CSPs are offering on a frequent basis.
Further studies
Processor and memory performance are only a couple of pieces of the entire puzzle inunderstanding virtual machine performance and value. Follow up reports in the series ofperformance studies initiated by this report will feature additional testing applicable to othercomponents of the infrastructure. Further studies may also include a larger scope of server sizesto be tested as well as potential tests of specific applications.
Comparing major cloud-service providers: virtual processor performanceThis PDF prepared for: Danny Gee ([email protected])
14
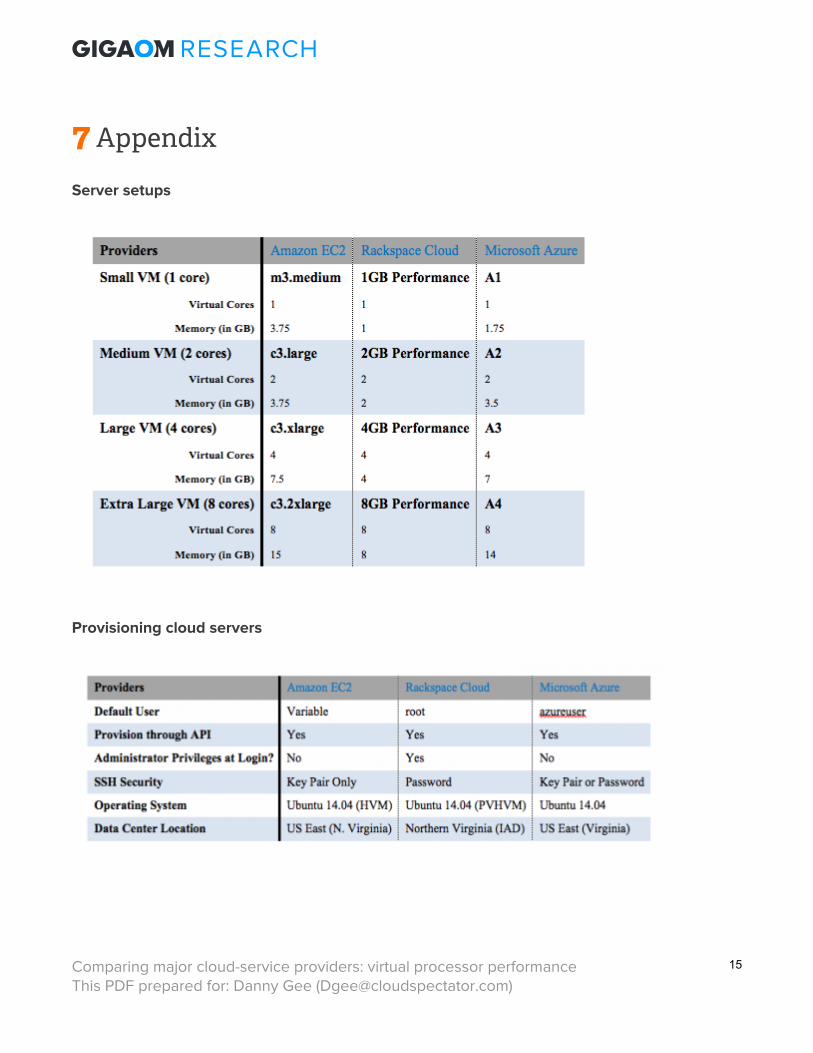
7 Appendix
Server setups
Provisioning cloud servers
Comparing major cloud-service providers: virtual processor performanceThis PDF prepared for: Danny Gee ([email protected])
15
Notes on Provisioning
• All virtual machines were provisioned in availability zones in the Northern Virginia area, as itwas the only geographical presence that included all three CSPs included in this experiment.
• After each test iteration, the virtual machines were deleted; every test iteration started with anewly provisioned machine. This was done to enable the possibility of switching physicalmachines throughout the process of testing, which would increase the likelihood of spottingperformance variation and the effectiveness of the sample size.
• Once a new virtual machine was created for each new iteration of testing, “apt-get update”and “apt-get upgrade –yes” commands were issued, followed by a reboot of the systembefore installing any tests.
• On Amazon EC2 and Microsoft Azure, ICMP ports are closed by default. It was necessary toconfigure Amazon EC2 security groups and Microsoft Azure’s network options to enableICMP for ping response. Ping response was used to ensure that the virtual machine wasback up after a reboot following the system updates and upgrades.
• For Microsoft Azure, a cloud service is provisioned with each new instance, unless a specificcloud service is assigned. By default, a limit of 20 cloud services can be active at once.Cloud services do not get deleted along with the virtual machine, so cloud services had tobe manually deleted as well.
• No additional dependencies or applications were installed apart from anything that may beavailable by default from the CSP.
Comparing major cloud-service providers: virtual processor performanceThis PDF prepared for: Danny Gee ([email protected])
16
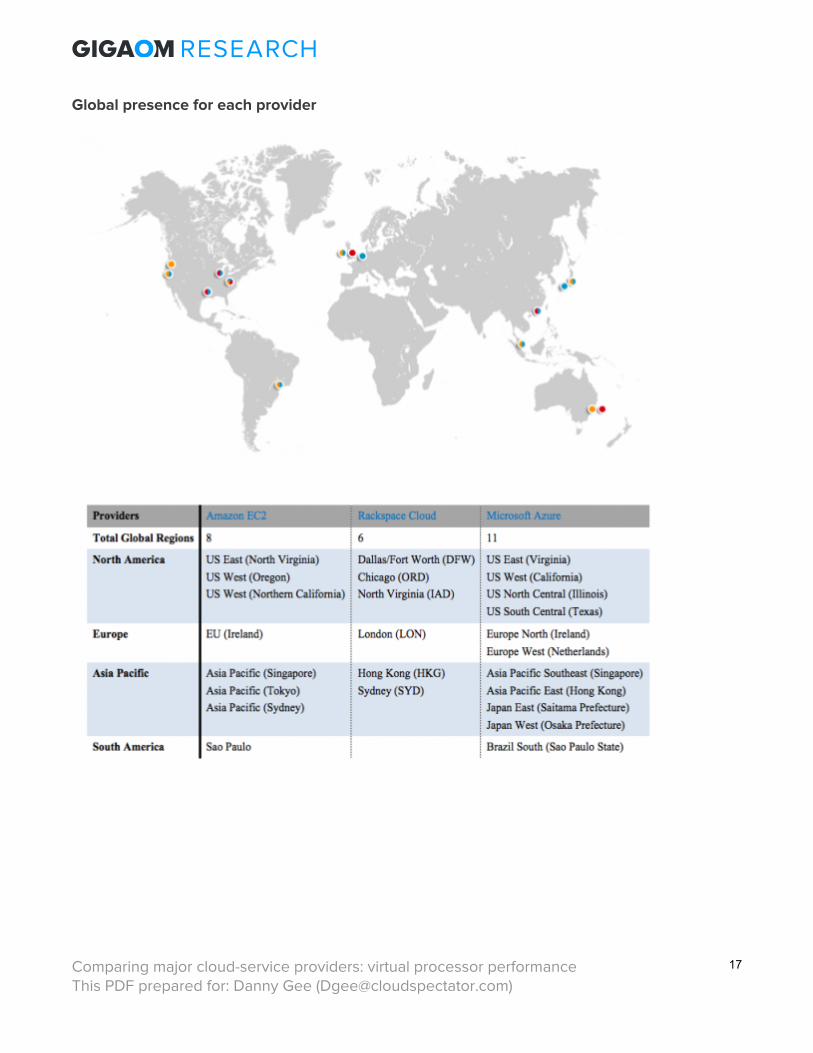
Global presence for each provider
Comparing major cloud-service providers: virtual processor performanceThis PDF prepared for: Danny Gee ([email protected])
17
8 About Cloud Spectator
Cloud Spectator is a cloud analyst agency focused on cloud IaaS performance. The companyactively monitors 20+ of the largest IaaS providers in the world, comparing VM performance (i.e.,CPU, RAM, disk, internal network, and workloads) and pricing to achieve transparency in thecloud market. The company helps cloud providers understand their market position and helpsbusinesses make intelligent decisions in selecting cloud providers and lowering total cost ofownership. The firm was founded in early 2011 and is located in Boston, MA.
Comparing major cloud-service providers: virtual processor performanceThis PDF prepared for: Danny Gee ([email protected])
18

9 About Gigaom Research
Gigaom Research gives you insider access to expert industry insights on emerging markets.Focused on delivering highly relevant and timely research to the people who need it most, ouranalysis, reports, and original research come from the most respected voices in the industry.Whether you’re beginning to learn about a new market or are an industry insider, GigaomResearch addresses the need for relevant, illuminating insights into the industry’s most dynamicmarkets.
Visit us at: research.gigaom.com.
© Giga Omni Media 2014. "Comparing major cloud-service providers: virtual processorperformance" is a trademark of Giga Omni Media. For permission to reproduce this report,please contact [email protected].
Comparing major cloud-service providers: virtual processor performanceThis PDF prepared for: Danny Gee ([email protected])
19