Embed Size (px)
Citation preview
Comparing mitigation efforts between Annex 1 Parties Initial results (excl. LULUCF)
Fabian WagnerInternational Institute for Applied Systems Analysis (IIASA)
Overview:
1. Marginal cost and total costs
2. Sensitivity to• Interest rate• Energy Prices
3. Co-benefits
4. Conclusions
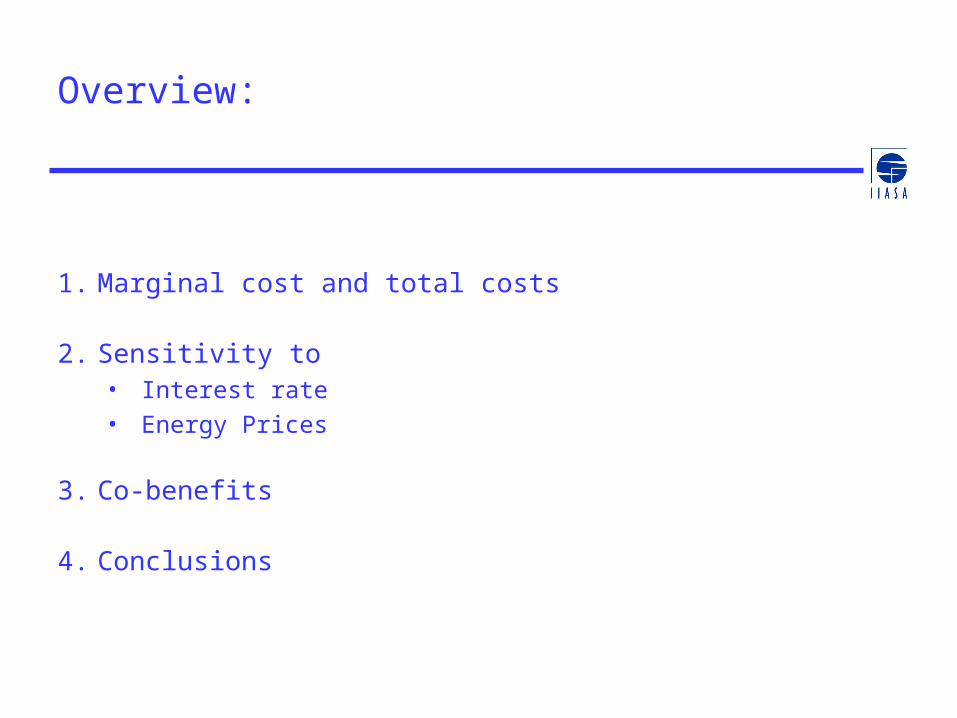
Baseline GHG emissions projections
40%
60%
80%
100%
120%
140%
160%
1990 2005 2020Yea r
Em
issi
on
s re
lati
ve t
o 1
990
A us tralia
New Z ealand
Canada
Norw ay
United S tates of A meric a
S w itz erland
J apan
A nnex-I
EU27
Rus s ian Federation
Ukraine
Analysis not completed yet for: Belarus, Croatia, Turkey, Cyprus, Malta
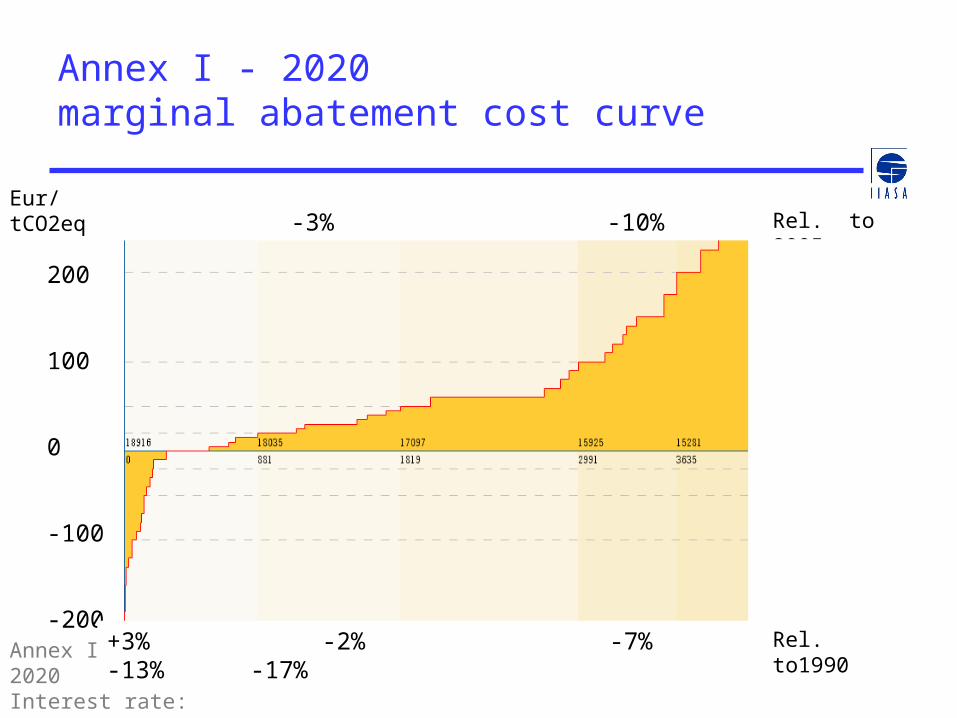
Annex I - 2020marginal abatement cost curve
+7% +2% -3% -10% -13%
200
100
0
-100
-200 +3% -2% -7% -13% -17%
Eur/tCO2eqRel. to 2005
Rel. to1990Annex I 2020Interest rate: 20%
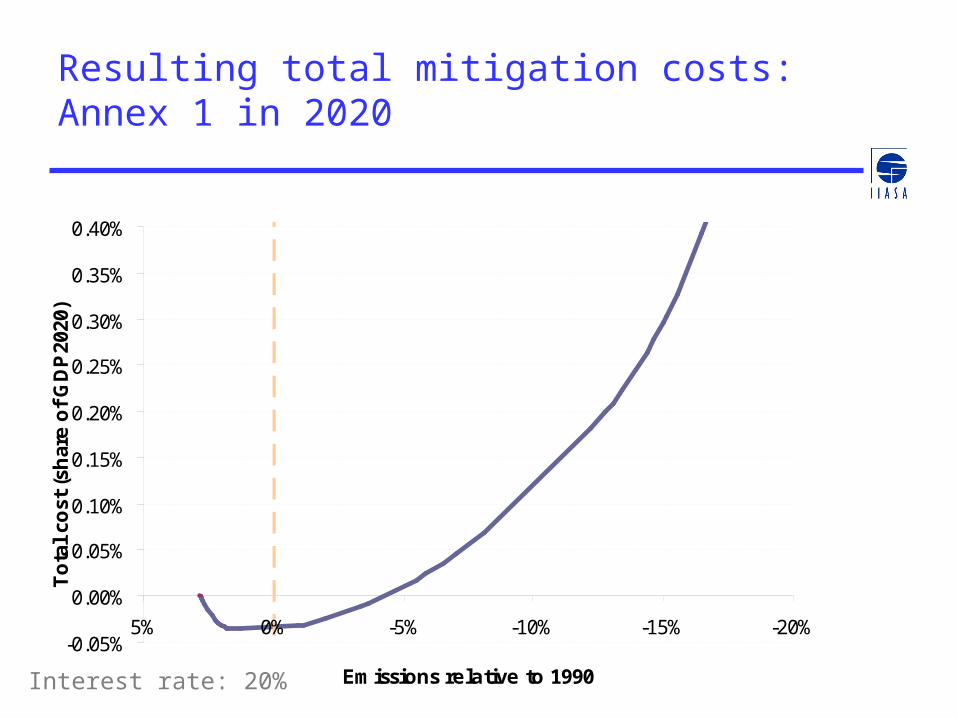
Resulting total mitigation costs: Annex 1 in 2020
-0.05%
0.00%
0.05%
0.10%
0.15%
0.20%
0.25%
0.30%
0.35%
0.40%
-20%-15%-10%-5%0%5%
E missions re la tive to 1990
To
tal
cost
(sh
are
of
GD
P20
20)
Interest rate: 20%
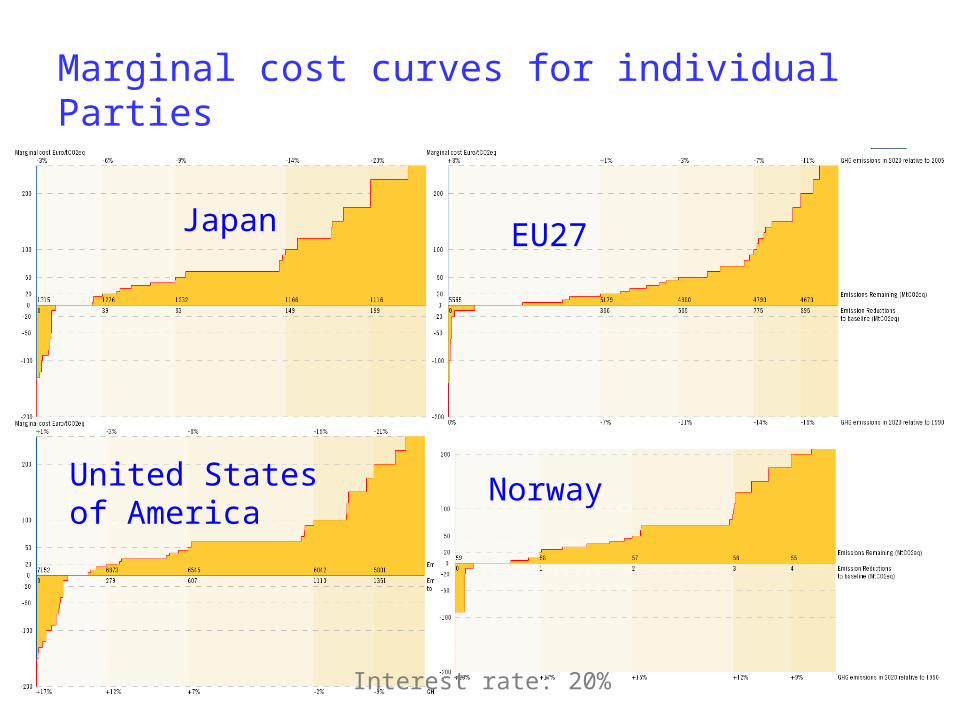
Marginal cost curves for individual Parties
Japan
United States of America
EU27
Norway
Interest rate: 20%
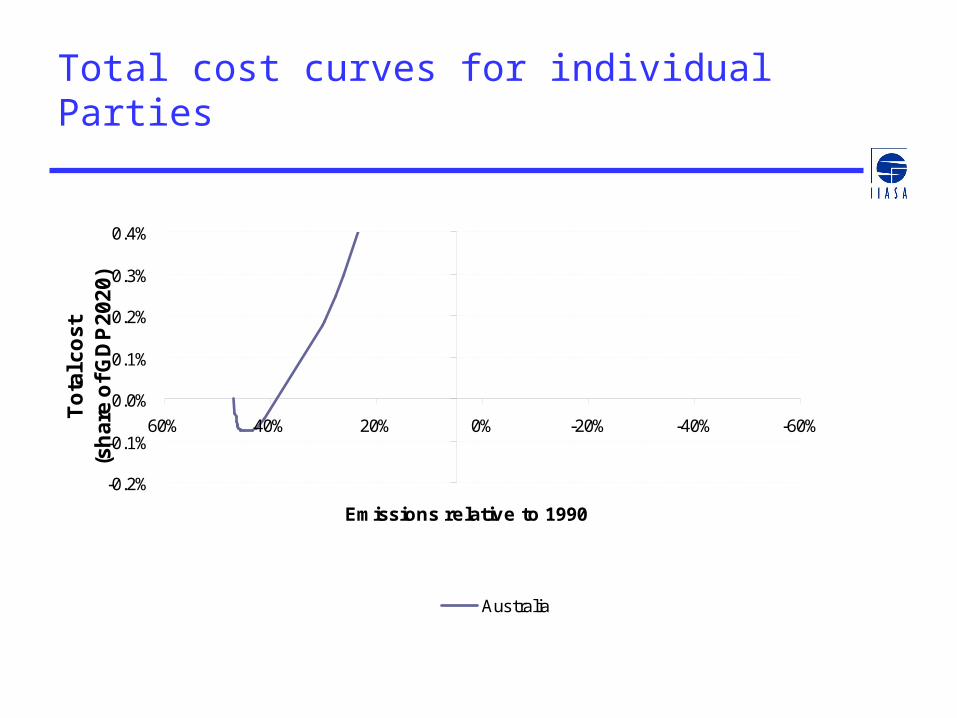
Total cost curves for individual Parties
-0.2%
-0.1%
0.0%
0.1%
0.2%
0.3%
0.4%
-60%-40%-20%0%20%40%60%
E mis s ions re lativ e to 1990
To
tal c
ost
(s
har
e o
f GD
P20
20)
Aus tralia
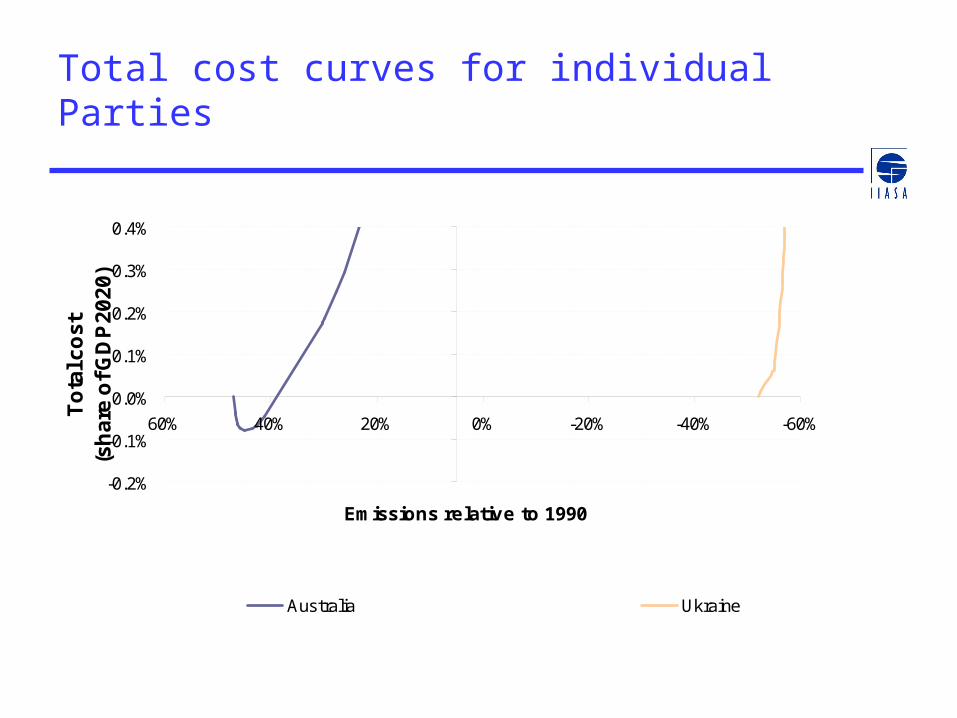
Total cost curves for individual Parties
-0.2%
-0.1%
0.0%
0.1%
0.2%
0.3%
0.4%
-60%-40%-20%0%20%40%60%
E mis s ions re lativ e to 1990
To
tal c
ost
(s
har
e o
f GD
P20
20)
Aus tralia Ukraine
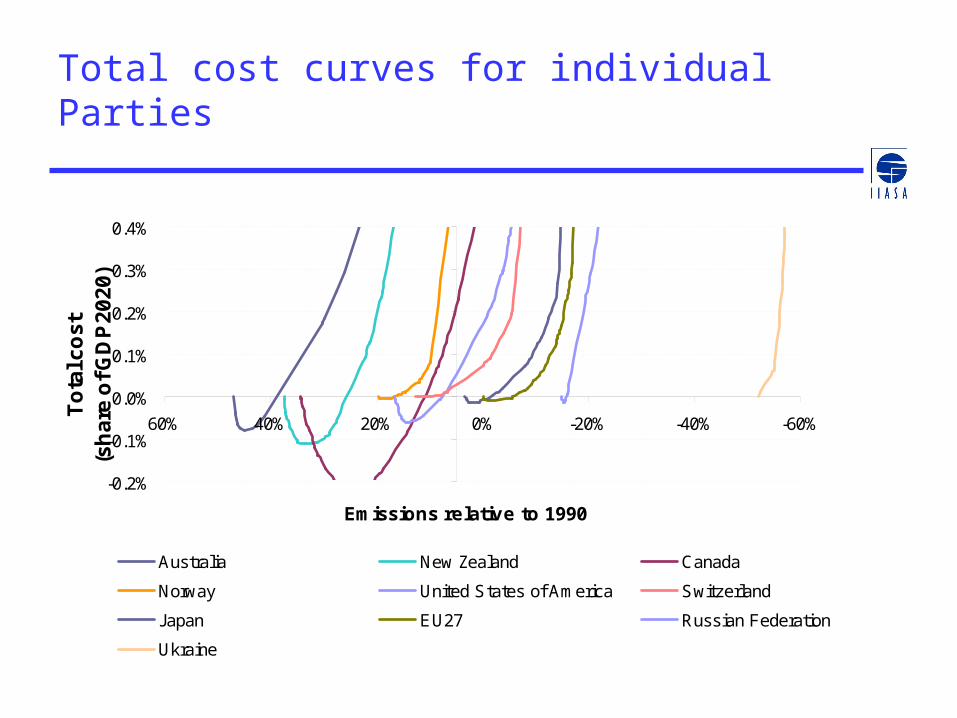
Total cost curves for individual Parties
-0.2%
-0.1%
0.0%
0.1%
0.2%
0.3%
0.4%
-60%-40%-20%0%20%40%60%
E mis s ions re lativ e to 1990
To
tal c
ost
(s
har
e o
f GD
P20
20)
Aus tralia New Zealand C anada
Norway United S tates of Americ a S witz erland
J apan E U27 R us s ian F ederation
Ukraine
Sensitivity analyses
• Alternative interest rates
• Alternative oil prices
• Baseline activity projections
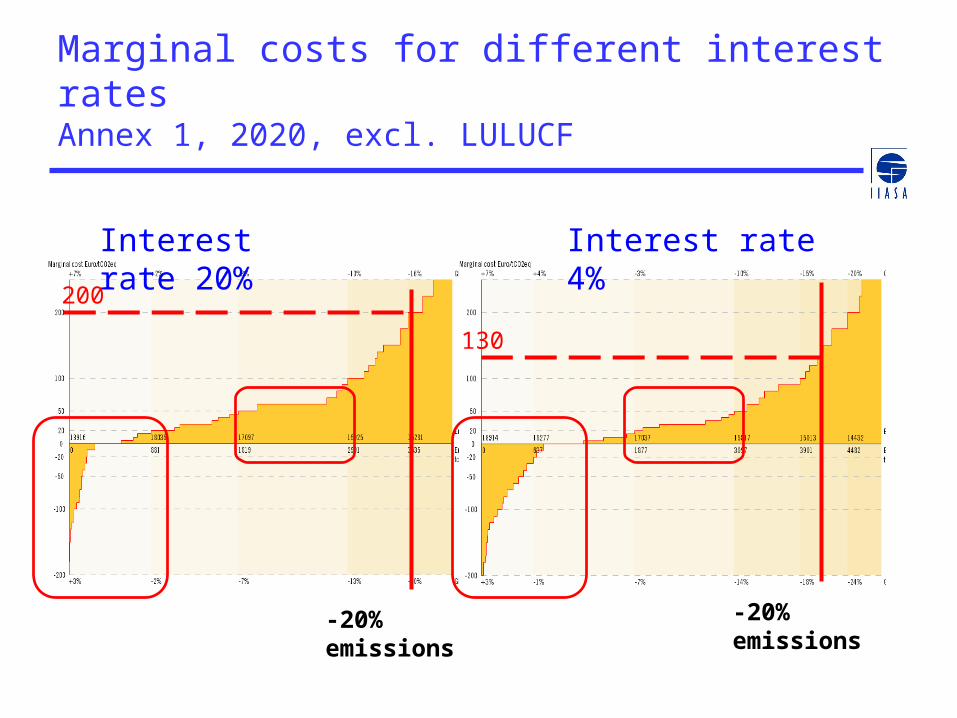
Marginal costs for different interest ratesAnnex 1, 2020, excl. LULUCF
Interest rate 20% Interest rate 4%
200
-20% emissions
130
-20% emissions
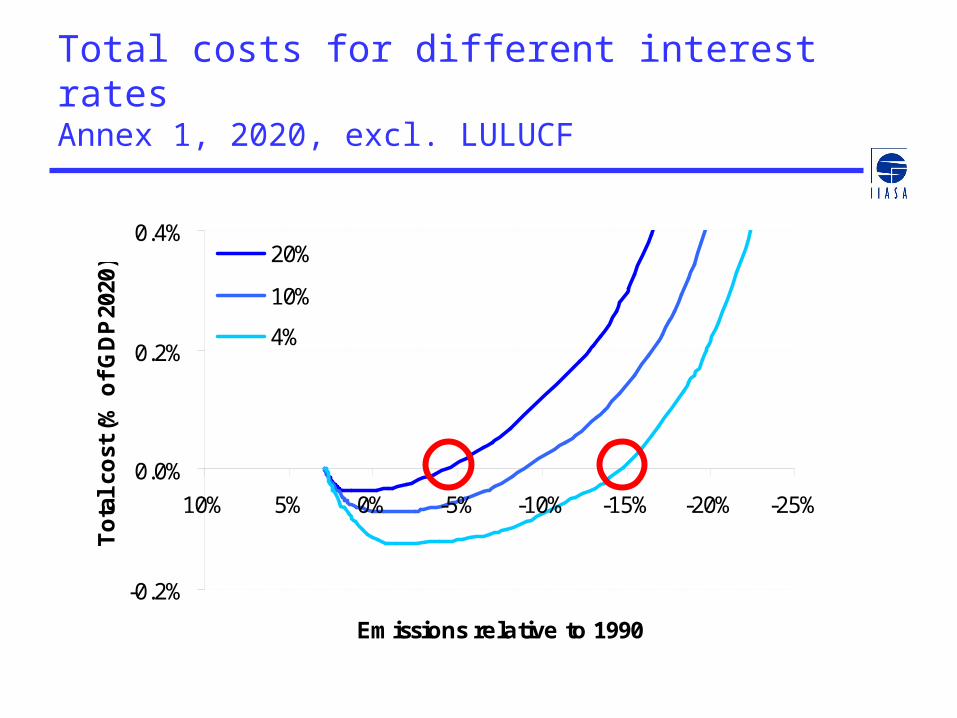
Total costs for different interest ratesAnnex 1, 2020, excl. LULUCF
-0.2%
0.0%
0.2%
0.4%
-25%-20%-15%-10%-5%0%5%10%
E missions re la tive to 1990
To
tal
cost
(%
of
GD
P20
20)
20%
10%
4%
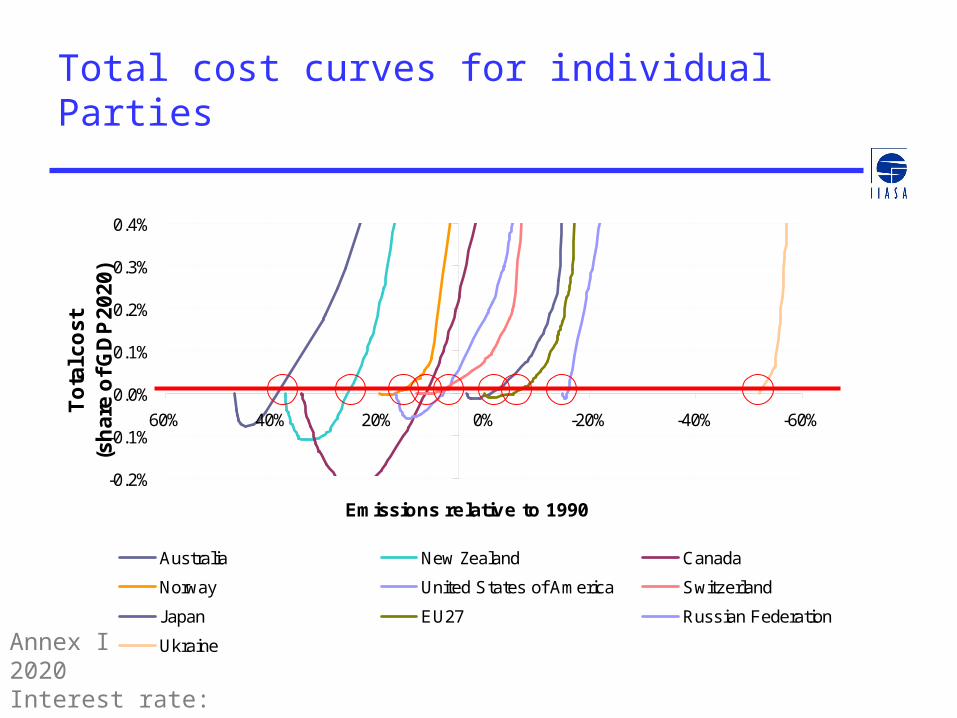
Total cost curves for individual Parties
-0.2%
-0.1%
0.0%
0.1%
0.2%
0.3%
0.4%
-60%-40%-20%0%20%40%60%
E mis s ions re lativ e to 1990
To
tal c
ost
(s
har
e o
f GD
P20
20)
Aus tralia New Zealand C anada
Norway United S tates of Americ a S witz erland
J apan E U27 R us s ian F ederation
Ukraine Annex I 2020Interest rate: 20%
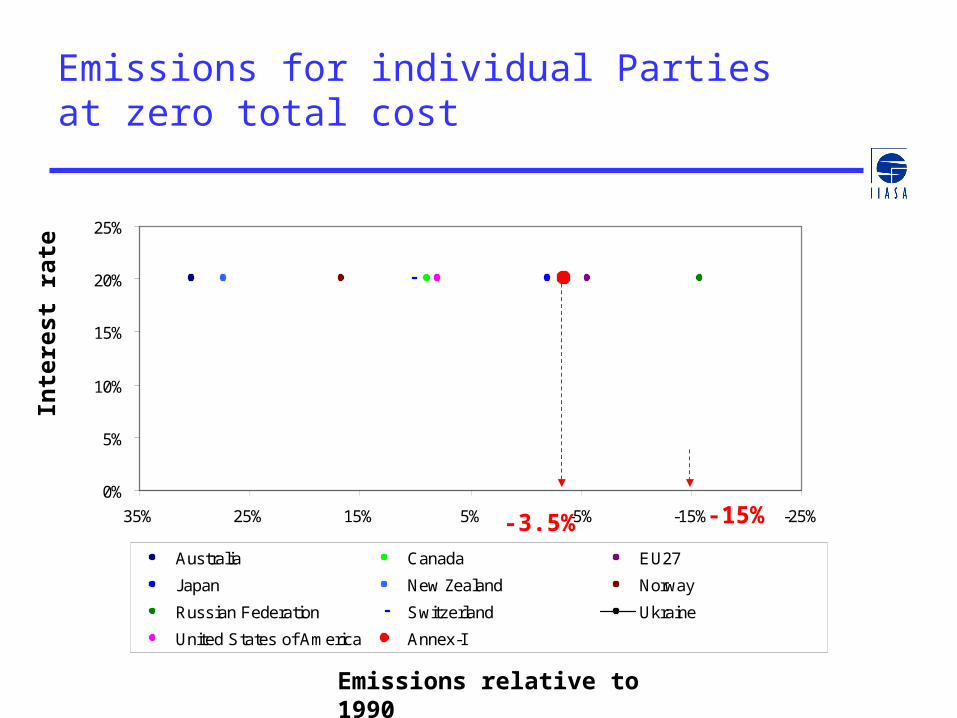
0%
5%
10%
15%
20%
25%
-25%-15%-5%5%15%25%35%
Australia Canada EU27
Japan New Zealand Norway
Russian Federation Switzerland Ukraine
United States of America Annex-I
Emissions for individual Parties at zero total cost
Inte
rest
rat
e
Emissions relative to 1990
-3.5% -15%
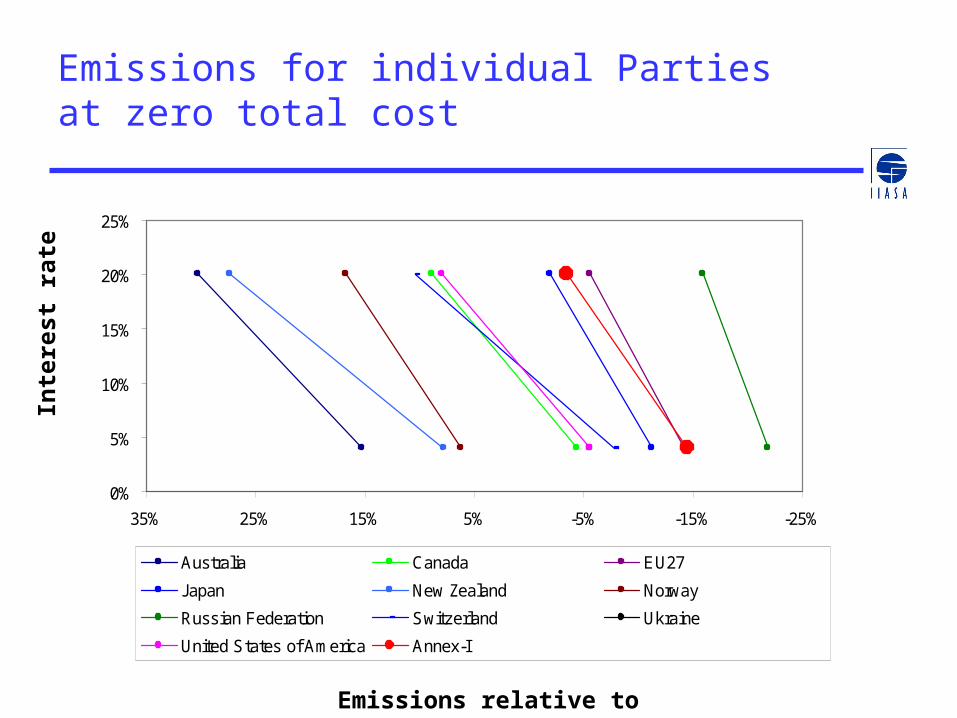
0%
5%
10%
15%
20%
25%
-25%-15%-5%5%15%25%35%
Australia Canada EU27
Japan New Zealand Norway
Russian Federation Switzerland Ukraine
United States of America Annex-I
Emissions for individual Parties at zero total cost
Inte
rest
rat
e
Emissions relative to 1990

Sensitivity to energy prices
-0.2%
0.0%
0.2%
0.4%
-25%-20%-15%-10%-5%0%5%10%
E missions re la tive to 1990
To
tal
cost
(%
of
GD
P20
20)
110$/barrel (WE O2008)
83$/barrel
Annex I 2020Interest rate: 20%
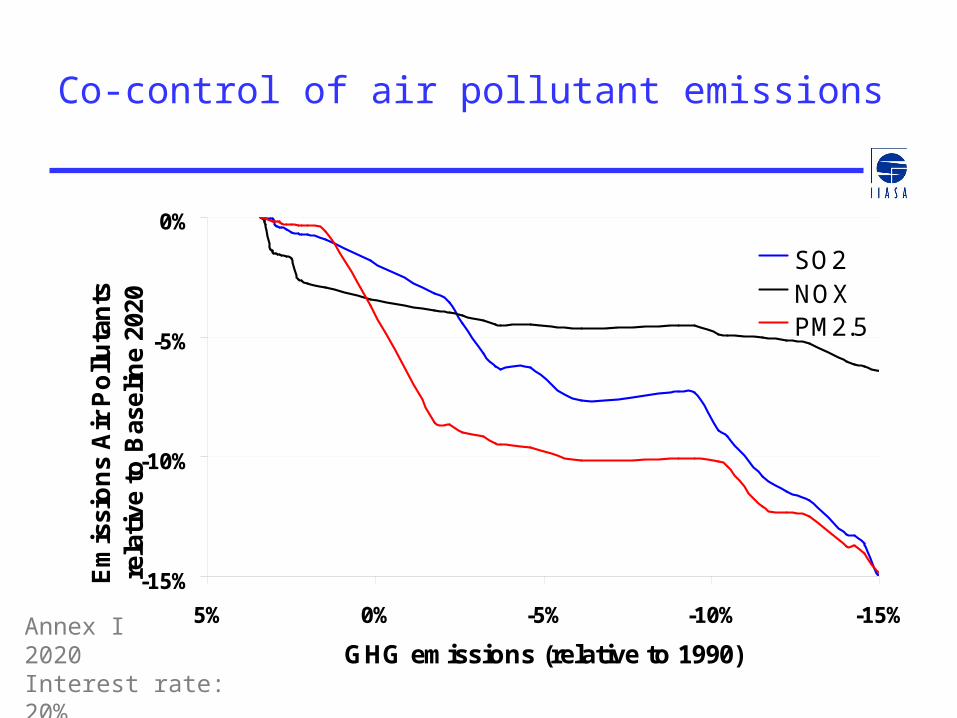
Co-control of air pollutant emissions
-15%
-10%
-5%
0%
-15%-10%-5%0%5%
G HG emis s ions (relative to 1990)
Em
issi
on
s A
ir P
ollu
tan
ts
rela
tive
to
Bas
elin
e 20
20
S O 2NO XP M2.5
Annex I 2020Interest rate: 20%
Conclusions
• Significant differences in mitigation potentials between countries
• Interest rate is important for costing, but does not change rank orderbetween Parties
• Considerable mitigation potential (-15%) fromnegative cost measures for a 4% interest rate.
• In 2020, a 20% GHG reduction relative to 1990 for Annex 1 can be achieved at a marginal cost of
• 130 €/t CO2eq (at 4% interest rate)
• 200 €/t CO2eq (at 20% interest rate)