Embed Size (px)
Citation preview

Clemson UniversityTigerPrints
All Theses Theses
12-2016
Comparing Multiple Methods of Eye Tracking forPackagingDavid Bradford CottrellClemson University
Follow this and additional works at: https://tigerprints.clemson.edu/all_theses
This Thesis is brought to you for free and open access by the Theses at TigerPrints. It has been accepted for inclusion in All Theses by an authorizedadministrator of TigerPrints. For more information, please contact [email protected].
Recommended CitationCottrell, David Bradford, "Comparing Multiple Methods of Eye Tracking for Packaging" (2016). All Theses. 2563.https://tigerprints.clemson.edu/all_theses/2563

COMPARING MULTIPLE METHODS OF EYE TRACKING FOR PACKAGING
A Thesis Presented to
the Graduate School of Clemson University
In Partial Fulfillment of the Requirements for the Degree
Master of Science Packaging Science
by David Bradford Cottrell
December 2016
Accepted by: Dr. R. Andrew Hurley, Committee Chair
Dr. Charles Tonkin Dr. E. Jeffery Rhodehamel

ii
ABSTRACT
The technology to understand consumer behavior through eye tracking is becoming more
affordable and accessible. When eye tracking is applied within a retail environment,
packaging can be evaluated based on the amount of attention obtained. For companies
developing products or designing packages, the results of eye tracking could help
estimate the likelihood a package will be selected over competitors, what design
attributes attract the most attention or how shelf placement impacts sales. Using a
physical retail environment with tangible stimuli allows participants to be fully immersed
and follow normal shopping behaviors. However, many eye tracking studies are
conducted in a digital environment using photos of packages in a simulated retail
environment displayed on a monitor. While these studies lack physical immersion, they
are typically less expensive. This experiment involves varying they eye tracking
technology (mobile eye tracking, on-screen eye tracking, and 3M’s Visual Attention
Software) while collecting data on consumer behavior relating to retail packaging. The
results from each technology is then compared to determine if varying the eye tracking
technology will change the results of how the stimuli performed in the consumer
behavior study. Of the 104 on-screen and mobile technology results comparisons, 32% of
the results were significantly different. Therefore eye tracking studies could potentially
yield different results when analyzing a package depending on which type of technology
was utilized.
iii
DEDICATION
I dedicate this thesis to my grandfather, Carl Ackerman (1931-2013) who always
led by example giving unconditional love and support to all. Your dedication and love for
Clemson University as an alumni (undergraduate: 1953, masters: 1960), professor, and
football fan was what made me want to be a Clemson Tiger myself. I am honored to
follow in your footsteps to pursue higher education at Clemson, and hope to achieve the
same level of greatness in life that you did.
iv
ACKNOWLEDGMENTS
First and foremost I must thank my family and friends for their unwavering
support through my education in its entirety. The many delicate words of motivation, and
the several kicks in the rear were all needed to help me reach where I am today.
Undoubtedly, I would have never ventured back to college to further my
education if it was not for the opportunities presented to me by Dr. Andrew Hurley. The
doors you opened for me, and sometimes threw me in head first, allowed me to discover
who I am, what I want to do in life, and sometimes how I function under pressure. Thank
you for your seemingly never-ending patience, internship opportunities, and sincere
concern for my education/future.
Also I would like to thank my other committee members: Dr. Chip Tonkin and
Dr. Jeff Rhodehamel. The guidance and support from each of you kept my research my
research thorough and accurate throughout the entire process. Thank you both for your
patience with my over ambitious timelines and occasional last minute paperwork, I could
not of asked for a better committee.
A special thanks to the Sonoco Institute of Packaging Design and Graphics for
supplying the tools and equipment needed for this research and providing me with a
home away from home. I will never forget the nights I spent sleeping on a stack of
corrugate sheets or the many hours spent cutting out tiger paw pieces on the Kongsberg.
Lastly I would like to thank all my fellow graduate students, past and present. I
will always cherish the many sushi lunches, late night Taco Bell runs, and adventures at
PackExpo. I wish you the best of luck in your future endeavors. Go Tigers.

v
TABLE OF CONTENTS
Page
TITLE PAGE .................................................................................................................... i ABSTRACT ..................................................................................................................... ii DEDICATION ................................................................................................................ iii ACKNOWLEDGMENTS .............................................................................................. iv LIST OF TABLES ......................................................................................................... vii LIST OF FIGURES ...................................................................................................... viii CHAPTER I. INTRODUCTION ......................................................................................... 1 II. REVIEW OF LITERATURE ........................................................................ 3 Importance of Packaging ......................................................................... 3 Consumer Attention ................................................................................. 4 Consumer Perceptions ............................................................................. 6 Decision Making Process ......................................................................... 7 Marketing Through Packaging .............................................................. 11 Eye Tracking Methods ........................................................................... 13 III. METHODOLOGY ...................................................................................... 16 Objectives .............................................................................................. 16 Hypotheses ............................................................................................. 16 Participants ............................................................................................. 17 Stimulus ................................................................................................. 17 Eye Tracking Apparatus ....................................................................... 20 Experimental Design ............................................................................. 24 Procedure ............................................................................................... 27 Statistical Analysis ................................................................................. 32

vi
Table of Contents (Continued)
Page IV. RESULTS AND DISCUSSION .................................................................. 33 Survey Results ...................................................................................... 33 Eye Tracking Metrics ............................................................................. 36 Qualitative Visualizations ...................................................................... 60 V. CONCLUSIONS .......................................................................................... 65
Limitations ............................................................................................. 66 VI. RECOMMENDATIONS ............................................................................. 68 APPENDICES ............................................................................................................... 69 A: Demographic Survey Questions ................................................................. 70 B: Demographic Survey Results ...................................................................... 73 C: Gaze Plot Visualizations ............................................................................. 74 D: 3M VAS Results ......................................................................................... 76 REFERENCES ............................................................................................................ 102
vii
LIST OF TABLES
Table Page
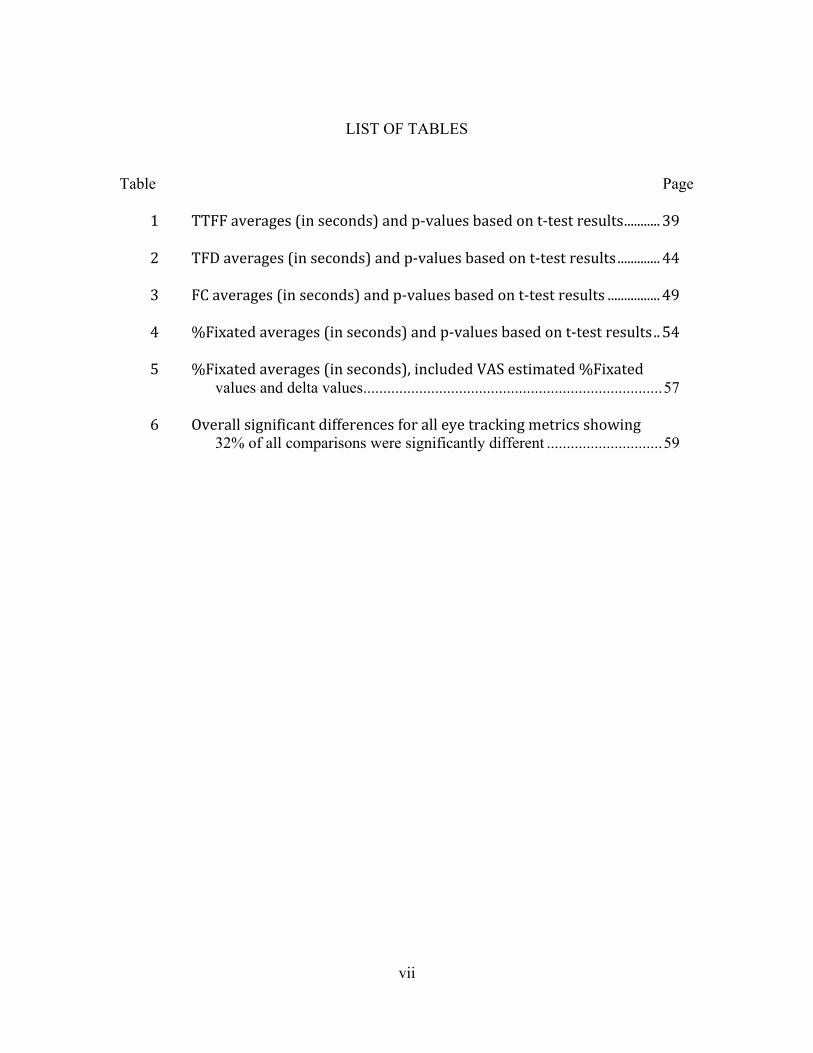
1 TTFFaverages(inseconds)andp-valuesbasedont-testresults...........39
2 TFDaverages(inseconds)andp-valuesbasedont-testresults.............44
3 FCaverages(inseconds)andp-valuesbasedont-testresults................49
4 %Fixatedaverages(inseconds)andp-valuesbasedont-testresults..54
5 %Fixatedaverages(inseconds),includedVASestimated%Fixated values and delta values ........................................................................... 57
6 Overallsignificantdifferencesforalleyetrackingmetricsshowing
32% of all comparisons were significantly different ............................. 59
viii
LIST OF FIGURES
Figure Page
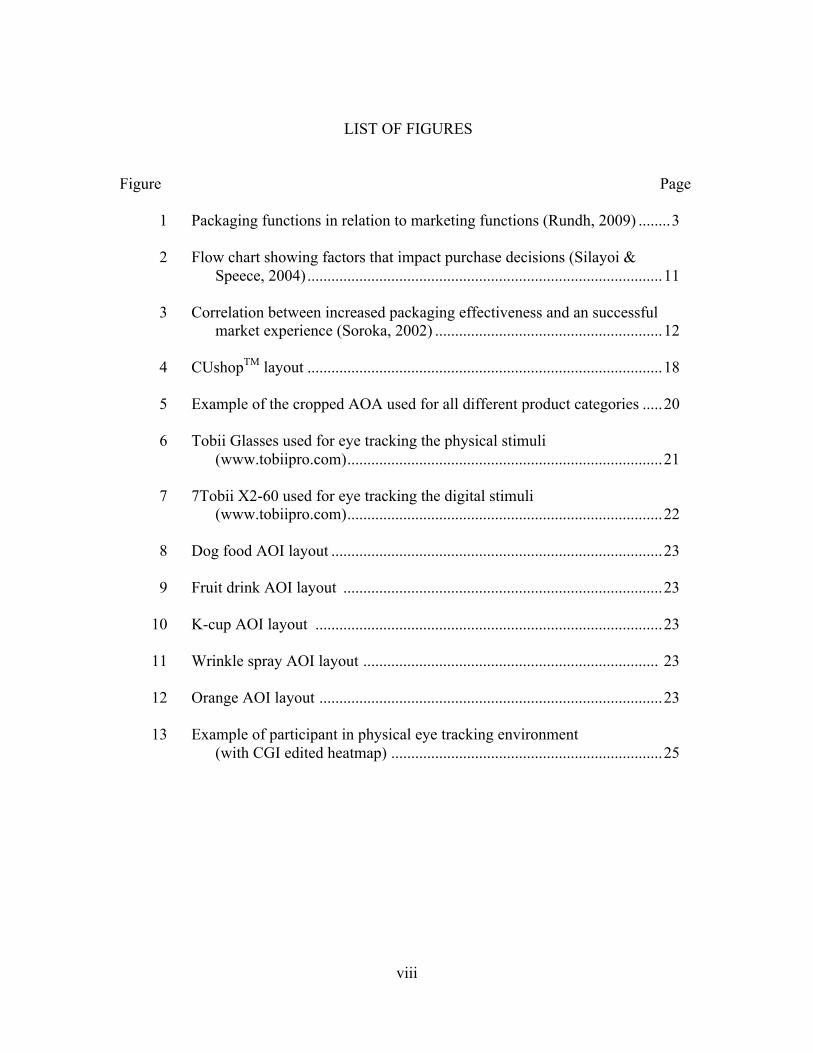
1 Packaging functions in relation to marketing functions (Rundh, 2009) ........ 3
2 Flow chart showing factors that impact purchase decisions (Silayoi & Speece, 2004) ......................................................................................... 11
3 Correlation between increased packaging effectiveness and an successful market experience (Soroka, 2002) ......................................................... 12
4 CUshopTM layout ......................................................................................... 18
5 Example of the cropped AOA used for all different product categories ..... 20
6 Tobii Glasses used for eye tracking the physical stimuli (www.tobiipro.com) ............................................................................... 21
7 7Tobii X2-60 used for eye tracking the digital stimuli (www.tobiipro.com) ............................................................................... 22
8 Dog food AOI layout ................................................................................... 23
9 Fruit drink AOI layout ................................................................................ 23
10 K-cup AOI layout ....................................................................................... 23
11 Wrinkle spray AOI layout .......................................................................... 23
12 Orange AOI layout ...................................................................................... 23
13 Example of participant in physical eye tracking environment (with CGI edited heatmap) .................................................................... 25
ix
List of Figures (Continued) Figure Page 14 Shopping lists for both environments used as prompts to direct participants to the stimuli ............................................................ 27 15 Participant beginning an on-screen eye tracking study. ............................... 30 16 Participant being calibrated for an on-screen eye tracking study ................ 31 17 Graphical representation of the biological sex demographic showing similar ratios between the different eye tracking studies ...................... 33 18 Age distribution between mobile and on-screen eye tracking studies ................................................................................................... 34 19 Education distribution between mobile and on-screen eye tracking studies ................................................................................................... 35 20 Example of TTFF metric calculations ........................................................ 37 21 TTFF for all product categories mobile (blue) vs. on-screen (red) ............. 38 22 TTFF top five product rankings mobile (blue) vs on-screen (red) .............. 40 23 Example of TFD metric calculations ........................................................... 42 24 TFD for all product categories mobile (blue) vs on-screen (red) ................ 43 25 TFD top five product rankings mobile (blue) vs on-screen (red) ............... 45 26 Example of FC metric calculations .............................................................. 47 27 FC for all product categories mobile (blue) vs. on-screen (red) ................. 48 28 FC top five product rankings mobile (blue) vs on-screen (red) ................... 50
x
List of Figures (Continued) Figure Page 29 Example of %Fixated metric calculations ................................................... 52 30 %Fixated for all product categories mobile (blue) vs on-screen (red) ......... 54 31 %Fixated top five product rankings mobile (blue) vs on-screen (red) ....... 55 32 Dog food heatmaps from the mobile, on-screen, and 3M – VAS technology ............................................................................................ 61 33 Fruit drink heatmaps from the mobile, on-screen, and 3M – VAS technology ............................................................................................. 61 34 K-cup heatmaps from the mobile, on-screen, and 3M – VAS technology ............................................................................................. 62 35 Oranges heatmaps from the mobile, on-screen, and 3M – VAS technology ............................................................................................. 62 36 Wrinkle spray heatmaps from the mobile, on-screen, and 3M – VAS technology ............................................................................................ 63
1
CHAPTER ONE
INTRODUCTION
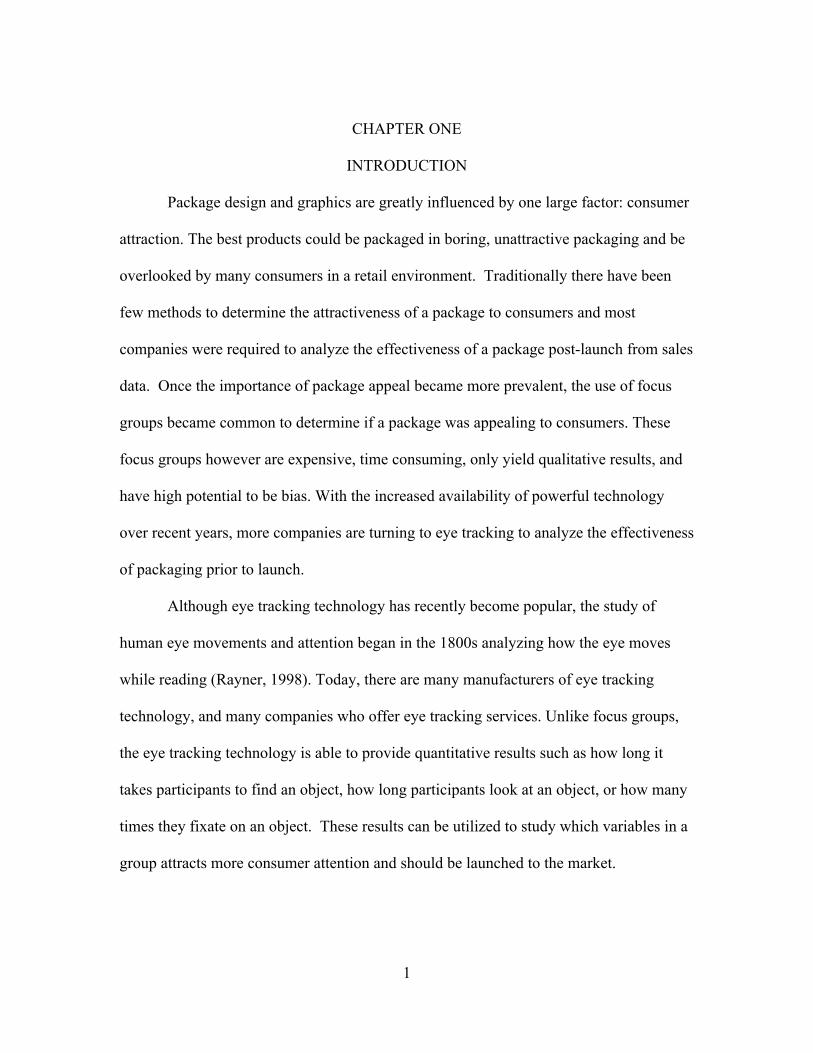
Package design and graphics are greatly influenced by one large factor: consumer
attraction. The best products could be packaged in boring, unattractive packaging and be
overlooked by many consumers in a retail environment. Traditionally there have been
few methods to determine the attractiveness of a package to consumers and most
companies were required to analyze the effectiveness of a package post-launch from sales
data. Once the importance of package appeal became more prevalent, the use of focus
groups became common to determine if a package was appealing to consumers. These
focus groups however are expensive, time consuming, only yield qualitative results, and
have high potential to be bias. With the increased availability of powerful technology
over recent years, more companies are turning to eye tracking to analyze the effectiveness
of packaging prior to launch.
Although eye tracking technology has recently become popular, the study of
human eye movements and attention began in the 1800s analyzing how the eye moves
while reading (Rayner, 1998). Today, there are many manufacturers of eye tracking
technology, and many companies who offer eye tracking services. Unlike focus groups,
the eye tracking technology is able to provide quantitative results such as how long it
takes participants to find an object, how long participants look at an object, or how many
times they fixate on an object. These results can be utilized to study which variables in a
group attracts more consumer attention and should be launched to the market.
2
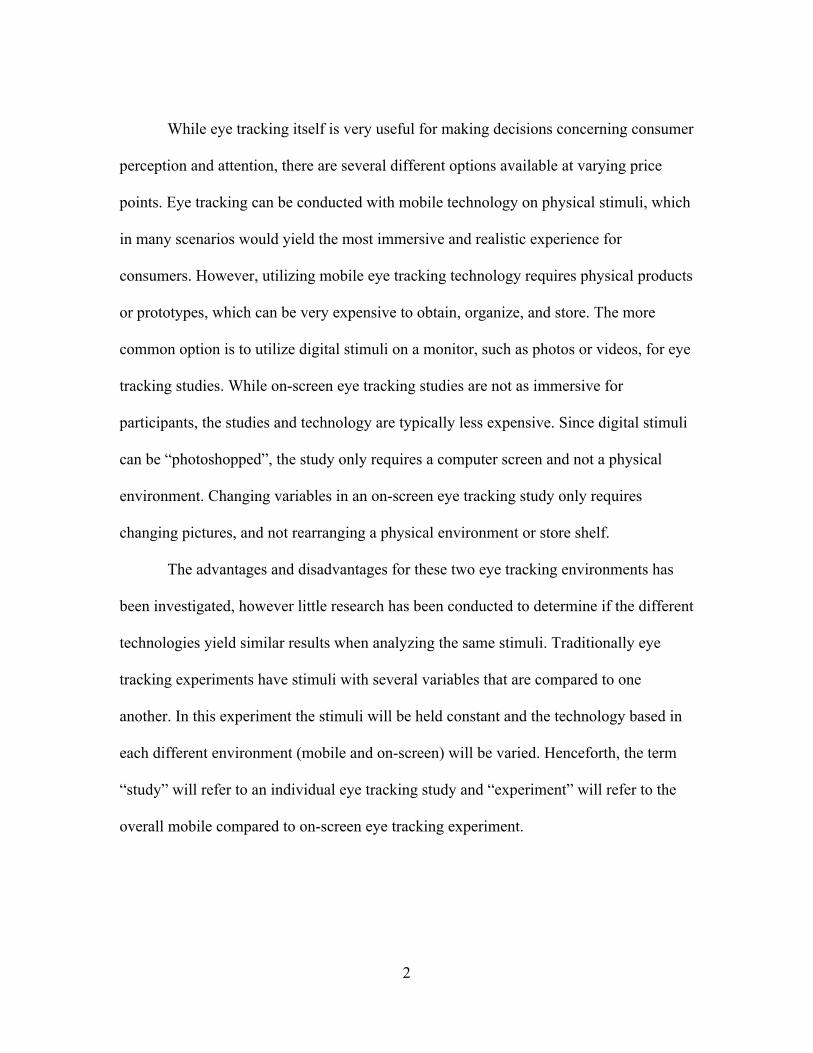
While eye tracking itself is very useful for making decisions concerning consumer
perception and attention, there are several different options available at varying price
points. Eye tracking can be conducted with mobile technology on physical stimuli, which
in many scenarios would yield the most immersive and realistic experience for
consumers. However, utilizing mobile eye tracking technology requires physical products
or prototypes, which can be very expensive to obtain, organize, and store. The more
common option is to utilize digital stimuli on a monitor, such as photos or videos, for eye
tracking studies. While on-screen eye tracking studies are not as immersive for
participants, the studies and technology are typically less expensive. Since digital stimuli
can be “photoshopped”, the study only requires a computer screen and not a physical
environment. Changing variables in an on-screen eye tracking study only requires
changing pictures, and not rearranging a physical environment or store shelf.
The advantages and disadvantages for these two eye tracking environments has
been investigated, however little research has been conducted to determine if the different
technologies yield similar results when analyzing the same stimuli. Traditionally eye
tracking experiments have stimuli with several variables that are compared to one
another. In this experiment the stimuli will be held constant and the technology based in
each different environment (mobile and on-screen) will be varied. Henceforth, the term
“study” will refer to an individual eye tracking study and “experiment” will refer to the
overall mobile compared to on-screen eye tracking experiment.
3
CHAPTER TWO
REVIEW OF LITERATURE
Importance of Packaging
Packaging is unique in that it is present all over the world, in every household,
business, and industry, and invisible to most people who use it (Bix & Lockhart, 1991).
Due to packaging’s diverse nature it can be difficult to condense and study however
packaging fundamentally serves four purposes: contain, protect/preserve, transport, and
inform/sell. In the very beginning, primitive packaging was solely needed for product
containment and likely made from animal skin, leaves or wood (Soroka, 2002). In today’s
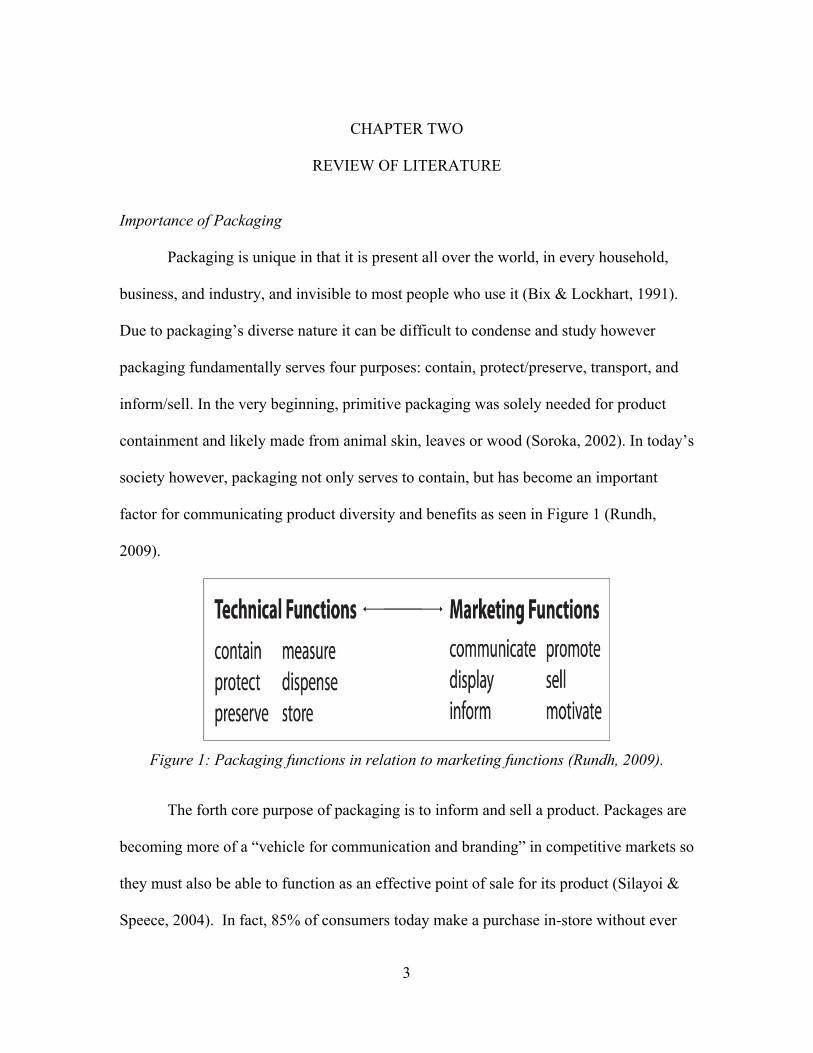
society however, packaging not only serves to contain, but has become an important
factor for communicating product diversity and benefits as seen in Figure 1 (Rundh,
2009).
Figure 1: Packaging functions in relation to marketing functions (Rundh, 2009).
The forth core purpose of packaging is to inform and sell a product. Packages are
becoming more of a “vehicle for communication and branding” in competitive markets so
they must also be able to function as an effective point of sale for its product (Silayoi &
Speece, 2004). In fact, 85% of consumers today make a purchase in-store without ever
4
picking up an alternative item and 90% make a purchase after looking at only the
package front (Clement, 2007). Therefore it is crucial for packages to be able to not only
draw in consumer attention but to also persuade them to purchase that package.
Consumer Attention
Due to rising levels of competition in the packaging industry, it is increasingly
difficult to attract and hold consumers’ attention in retail environments (Pieters, Warlop,
& Wedel, 2002). In order for consumers to purchase a product they must first notice the
package amongst the clutter of other packages on a retail shelf. Distinct basic visual
features such as: shape, color, orientation, contrast and size help attract the customers’
attention over other packages (Clement, 2007).
An effective method of attracting consumer attention is utilizing an affective
design for packaging. Affective design is the ability of packaging to stimulate an
emotional response in consumers. For example, packaging that effectively uses affective
design may elicit a nostalgic response in the consumer, reminding them of a product their
mother or father used. Studies involving affective design, such as ones by Cathy Barnes,
Christian Southee and Brian Henson (2003), strive to create a package/product that offers
expected levels of usability but also offers the consumers a positive emotional
experience.
Another method to gain consumer attention is to vary the position of graphics,
color and typography on packages because “on-package graphics have the potential to
influence customer’s product-related attitudes and behaviors” (Westerman et al., 2013).
5
Rachel Randall (2013) conducted research on applying color theory to packaging with
visible product and external labels to determine if consumers would be attracted by a
strategically colored package. The results of this study were that age, gender and
corrective vision were independent of a color harmony preference and that designers
would be equally competitive in using other guidelines to create aesthetically appealing
labels and brand color schemes. Similar research has been conducted with typography
point size and package proportion (Fischer, 2012). This research is based on the theory
that “because the text of a package is a very direct way of communicating the product’s
message to the consumer, it is very important for the success of the package to employ
proper typography.
Deviations in well-known stimuli also attract attention (Schoormans & Robben,
1997). Packaging information however, is mainly conveyed visually, so visual attention
is vital for a successful package (Pieters & Warlop, 1999). Therefore, too much deviation
could have a negative effect and actually interfere with a packages ability to convey
visual information. Schoormans and Robben’s (1997) research studied this trade off of
positive deviation and the ability to transfer these positive affects to new stimuli. Their
study concluded that moderate deviations of modified packages resulted in the best
overall trade-off that both attracted consumer attentions and created favorable consumer
evaluations for a well-established brand.
6
Consumer Perceptions
Perception can be defined as “the neurophysiological processes, including
memory, by which an organism becomes aware of and interprets external stimuli”
(“Perception,” 2014). In the packaging industry, the package, or hidden “salesman” on a
shelf is the external stimuli that is used to attract consumers. These stimuli are capable of
changing a consumers perception of potential benefit and attitude of a product/package
(Rettie & Brewer, 2000). Therefore it is crucial to study how consumers perceive
packaging to better understand their feelings towards package designs.
Since packages are used throughout the world by many industries, and contain
many types of product, it can be difficult to analyze consumer perception on every
package. To best study perception, studies often focus on general types of packaging such
as packages that show product. Research conducted by Josh Galvarino (2012) analyzed
consumer perception of packages that show partial product represented graphically versus
the actual product through a window. Consumers in this study preferred packages with
actual product showing through windows over similar packages containing graphical
representation of product. A similar study by Toni Gomes (2012) looked at the consumer
preference and perception of full body and partial body labels on beverage packaging.
The results from this study concluded that both full body and partial labels were equal in
attracting consumer attention, however partial labels were favored in total fixation count
and visit count meters. Overall, study participants “purchased” more packages with
partial labels than full labels.
7
Aesthetic packages, or packages which emotionally appeal to consumers through
beauty and sentiment, have resulted in significant increase in the consumer’s choice
responses and even caused these packages to be chosen over well-known brands, despite
higher prices (Reimann, Zaichkowsky, Neuhaus, Bender, & Weber, 2010). One theory on
this effect is due to the large increase of brands in the market and many options the
consumer experiences at the point of sale. This forces companies to increase their efforts
to differentiate their package among competitors to attract consumers. Packaging
elements in which companies are changing their packaging to appeal to consumer
perspectives include: color, typography, shape, and image (Ampuero & Vila, 2006).
Studies have shown that certain aesthetic packages increase brain activity over
standardized products (Reimann et al., 2010).
Decision Making Process
In the retail environment consumers are constantly analyzing packaging to make
decisions regarding the choice, purchase and use of products (Bettman, Johnson, &
Payne, 1991). Scott Young (2010) best summarizes packaging and consumer decision
making in his quote: “Packaging is unique because it ‘lives’ on cluttered shelves, and it
has to make an impression within the limited time (often only a few seconds) that
shoppers typically spend making their purchase decisions.” These purchase decisions are
often difficult for consumers, presenting them with large numbers of alternatives, which
are also constantly changing due to new technology and competition. Simultaneously,
Consumers are possibly faced with vast amounts of information (advertisements,
8
packaging, salespeople, and friends), possible trade offs such as price and quality and
may not even be completely certain how a product will perform. The complex response
of consumers in these situations is vital for not only marketing but package design as well
(Bettman et al., 1991).
To determine what defines a consumer’s decision, first the elements that compose
a consumer’s choice need to be examined. These elements include alternative options,
attributes of value, and uncertainties in the product. The information available in the
consumer’s environment is also examined, both in terms of what is available and how it’s
organized. The difficulty of a consumer’s choice depends directly upon these elements.
Choice difficulty will typically increase as the number of alternatives and attributes
increase (Bettman et al., 1991). In addition to the elements of the task, a consumer’s
decision can also be influenced by how information is provided in their environment.
This information can always be placed in two categories: information available in the
consumer’s memory and information found in the external environment. With this
information, either in memory or in the external environment, consumers must then
integrate this information to make a decision. In general there are two methods to do this:
utilize an existing strategy (perhaps one used in a similar situation in the past) or
construct a new strategy on the spot using whatever existing information available
(Bettman et al., 1991).
There are several theories in which consumers are believed to cope with the
difficult purchase decisions. Economists argue that consumer’s are “exquisitely rational
beings” and assume that consumer’s obtain complete information on all alternatives,

9
makes trade-offs that allows them to compute the alternative utilities, and selects the
alternatives, which maximize utility. The key in this economic perspective is
understanding the values that different consumers use to make choices. A more realistic
perspective argues that consumer’s have limitations on the ability to process information.
This perspective is based on physiological information gathered over the last 30 years.
Through this information we have learned to represent the human behavior (such as a
consumer purchasing a package) “in terms of a small number of memories and processes
(strategies) involving the acquisition, storage, retrieval, and utilization of memory”
(Bettman et al., 1991). This set of memories and processes can be divided into three parts
which translate sensations from the physical world, translate thoughts into actions, and
the cognitive system which is most relevant to consumer decision making (Bettman et al.,
1991).
The cognitive system, which regulates human memory, can be divided into two
parts: working memory and long-term memory. Working memory is capable of pulling
information from long term while also using information gathered from the environment
through the perceptual system (eyes, ears, touch etc.). This form of memory is
constrained by its limited capacity, and thus is likely to impact a consumer’s decision
making. A common example is how consumers usually cannot remember a list of items
on their shopping list, however if the items are grouped, such as into meals, the list
becomes easier to remember. Similarly remembering product brands, calculating cost,
and remembering cost per brand can impact consumer’s decisions. Unlike working
memory, long-term memory’s capacity is considered to be infinite and never lost.
10
Information in long term memory can be “forgotten” however this is believed to be the
inability for a person to recall certain information from long term memory at a particular
point of time. At a later time the person would possibly be able to retrieve the forgotten
memory though other stimuli (Bettman et al., 1991). Information in a consumer’s long
term memory could therefore be stimulated by a certain package design element to help
recall a past advertisement or product benefit.
Research has been conducted to create a set of “choice heuristics” which model
the decision-making strategies of consumers in a retail environment. These heuristics
include “The Weight Additive” rule in which involves the consideration of all values of
alternative choices and all relative attributes to the decision maker, and “The Satisficing
Heuristic” which considers all alternatives one at a time to see if it meets a predetermined
cutoff level.
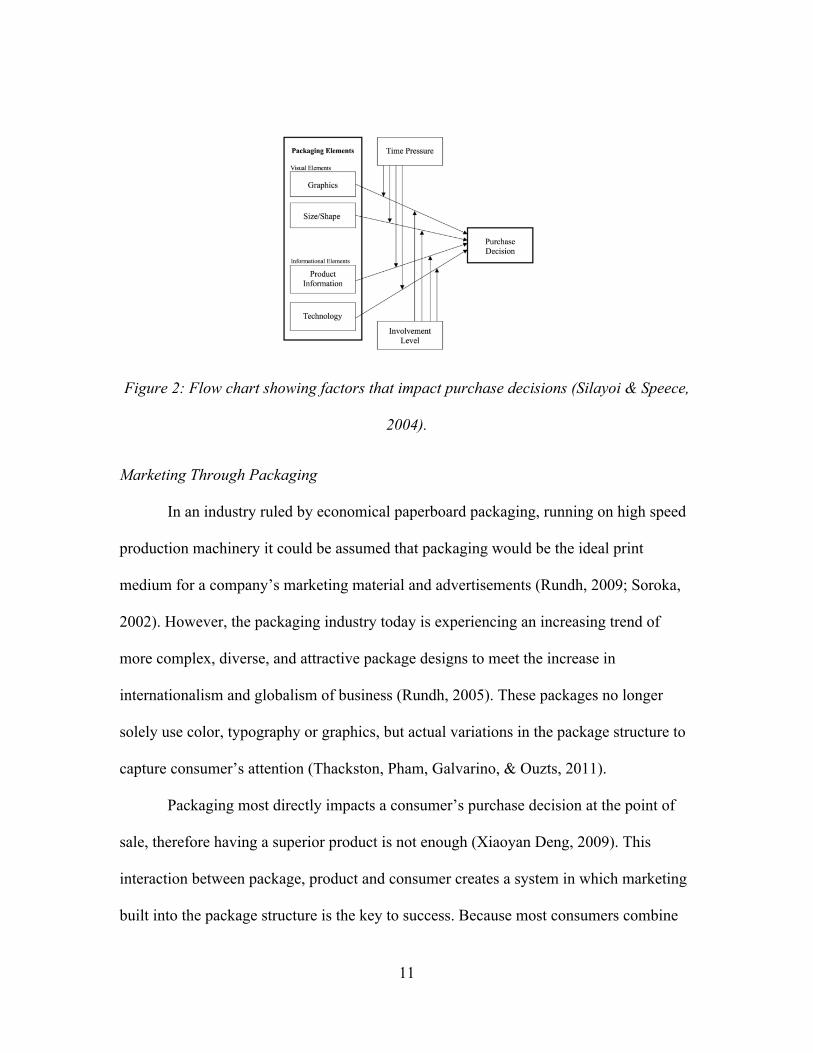
According to Jesper Celments (2007), the 21st century is experiencing a shift in
consumer behavior where objects based on immaterial aspects will be preferred, such as
amusement, emotions and fantasy. This change also is causing a migration from product
properties to product experiences at the point of sale. To maximize in-store consumer
choice, a firm understanding of the fundamentals of consumer behavior (decision
making) and an effective package with an attractive design/graphics displaying wanted
consumer information is needed (Silayoi & Speece, 2004). This concept of product
choice and package elements is represented in Figure 2.
11
Figure 2: Flow chart showing factors that impact purchase decisions (Silayoi & Speece,
2004).
Marketing Through Packaging
In an industry ruled by economical paperboard packaging, running on high speed
production machinery it could be assumed that packaging would be the ideal print
medium for a company’s marketing material and advertisements (Rundh, 2009; Soroka,
2002). However, the packaging industry today is experiencing an increasing trend of
more complex, diverse, and attractive package designs to meet the increase in
internationalism and globalism of business (Rundh, 2005). These packages no longer
solely use color, typography or graphics, but actual variations in the package structure to
capture consumer’s attention (Thackston, Pham, Galvarino, & Ouzts, 2011).
Packaging most directly impacts a consumer’s purchase decision at the point of
sale, therefore having a superior product is not enough (Xiaoyan Deng, 2009). This
interaction between package, product and consumer creates a system in which marketing
built into the package structure is the key to success. Because most consumers combine
12
product and package into a single entity, the message of superiority, convenience or other
benefit of the product must clearly be communicated from the package. Even the best
products could never reach full market potential if they lack an effective package.
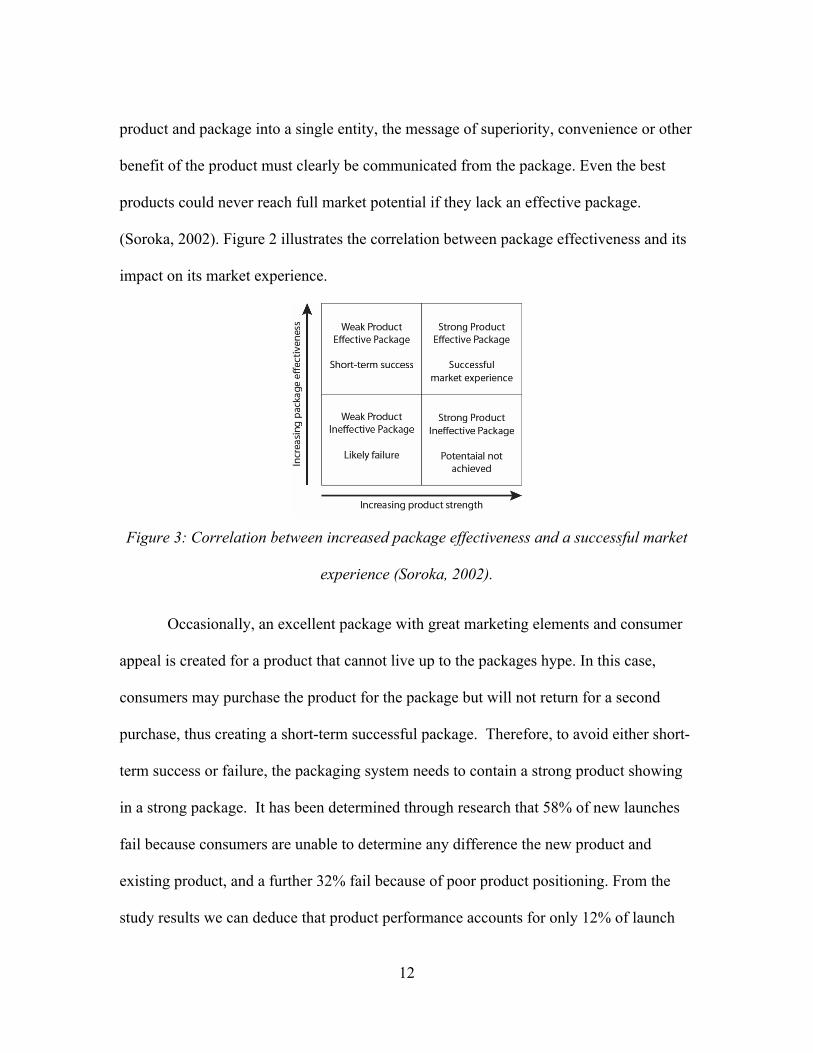
(Soroka, 2002). Figure 2 illustrates the correlation between package effectiveness and its
impact on its market experience.
Figure 3: Correlation between increased package effectiveness and a successful market
experience (Soroka, 2002).
Occasionally, an excellent package with great marketing elements and consumer
appeal is created for a product that cannot live up to the packages hype. In this case,
consumers may purchase the product for the package but will not return for a second
purchase, thus creating a short-term successful package. Therefore, to avoid either short-
term success or failure, the packaging system needs to contain a strong product showing
in a strong package. It has been determined through research that 58% of new launches
fail because consumers are unable to determine any difference the new product and
existing product, and a further 32% fail because of poor product positioning. From the
study results we can deduce that product performance accounts for only 12% of launch
13
failures and therefore the marketing of the product through packaging structure and
graphics is vital to the success of products (Soroka, 2002).
The increase in package manufacturing and packaging material technology has
resulted in an increase in cooperation between package material suppliers and package
designers. Often the suppliers invite designers to special design studios and participation
rooms for packaging development. The intent of these meetings are to produce packages
with, for example, better print quality that fully incorporates technology upgrades to
boost marketing (Rundh, 2005). Companies are now beginning to understand and utilize
the importance of the marketable attributes of packaging. After all, “the package is the
last few inches of the thousand-mile pipeline linking manufacturer to vendor” and those
last few inches include hundreds of other products in the consumer’s peripheral vision in
a retail setting (Selame & Koukos, 2002). Research (Rettie & Brewer, 2000) has
suggested that packaging in fact may be the biggest means of communication because:
• It’s extensive reach to nearly all purchasers;
• It’s presence at the critical moment of purchase decisions; and
• The high level of involvement for consumers who actively scan packaging for
information.
Eye Tracking Methods
As companies and clients recognize the increasing power and potential of package
design they also demand greater accountability and methods for analyzing the effects of
these designs. Scott Young states “it is still critical to conduct and analyze packaging

14
research in a diagnostic manner, which provides the design professionals with the insight
to solve problems and to further fuel creativity rather than destroy it” (2010). In recent
years, the emerging method of analyzing package design and consumer attentive behavior
has been through the use of eye tracking. However, eye tracking research has been
conducted for over 20 years, but with recent technological advances, eye tracking has
become more accurate and available (Duchowski, 2007; Rayner, 1998). Eye tracking is
simply the measurement of the eye’s movements. The eye’s movements can be grouped
into two basic groups called ‘fixations’ and ‘saccades’ (Duchowski, 2007). A fixation
occurs when the eye is relatively still and focused on an object. However the eye is never
truly still when fixated on an object, causing fixations to last approximately 200-300
milliseconds. The rapid movements of the eye while moving from one fixation to the
next are classified as saccades and typically last 50-150 milliseconds (Duchowski, 2007;
Rayner, 1998).
The four most common methods for measuring eye movements are: scleral
contact lens/search coil, Electro-OculoGraphy (EOG), Photo-OculoGraphy (POG) or
Video- OculoGraphy (VOG), and video-based combined pupil and corneal reflection
(Duchowski, 2007). Out of these methods, the most common method for measuring eye
movement is the video based combined pupil and corneal reflection method that is able to
mounted to the participant’s head or to a table. Due to the possible interference of head
movement and eye movement, either the participant’s head must be positioned in a
stationary manner so the eyes coincide with the point of regard or “multiple ocular
features must be measured in order to disambiguate head movement from eye rotation”
15
(Duchowski, 2007). Possible features that distinguish head movement from eye rotation
include corneal reflection and pupil center. For this method of eye movement
measurement, a combination of small cameras and image processing sensors calculate the
point of regard live, and then output X- and Y- coordinates relative to the visual scene.
This video based method is preferred as it allows participants to move around an
environment (such as retail) while taking eye-tracking measurements. Other advantages
include moderate accuracy and relatively unobtrusive to participants (Duchowski, 2007).
16
CHAPTER THREE
MATERIALS AND METHODS
Objectives
The purpose of this research is to determine if data gathered from different eye
tracking apparatuses show similar results for corresponding stimuli. To analyze the
consumer shopping behavior, four quantitative metrics are gathered for each stimuli: time
to first fixation (TTFF), total fixation duration (TFD), fixation count (FC), and percent
fixated (%Fixated). In addition to the above eye tracking metrics, the product participants
purchased in each category, and participant demographical information is also recorded.
By utilizing both qualitative and quantitative analysis of eye tracking data, from four
different product categories, this study provided insight to different eye tracking and
consumer attention monitoring technology available for consumer behavior research.
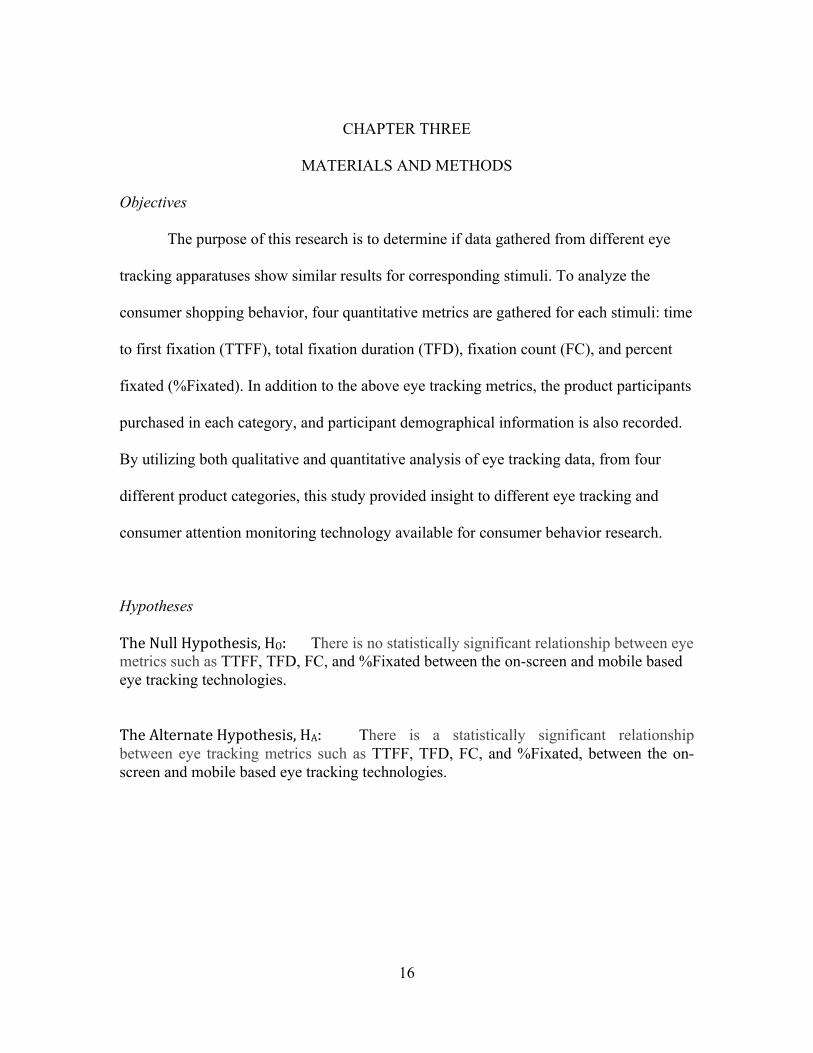
Hypotheses
TheNullHypothesis,HO: There is no statistically significant relationship between eye metrics such as TTFF, TFD, FC, and %Fixated between the on-screen and mobile based eye tracking technologies.
TheAlternateHypothesis,HA: There is a statistically significant relationship between eye tracking metrics such as TTFF, TFD, FC, and %Fixated, between the on-screen and mobile based eye tracking technologies.
17
Location and Participants
The data for this experiment was collected from over six eye tracking studies and
299 participants. Participants were given gift cards as incentives ranging from 10-30
dollars and were recruited from a database consisting of over 1200 residents of the
upstate South Carolina region.
The mobile eye tracking utilized four separate studies, which were conducted
using Tobii Glasses to gather data on five different product categories. These studies
were all executed within CUshopTM. Of the 299 total participants, 185 were utilized for
mobile eye tracking over five product categories: fruit drinks, dog food, coffee, oranges,
and laundry sprays. These four studies resulted in consistent demographics with an
average of 34% male and 66% female. The on-screen eye tracking consisted of two
separate studies. Since these studies were being executed after the mobile data had been
collected, participants were recruited selectively to achieve similar demographics to the
mobile studies. A total of 114 participants were recruited for the on-screen portion of the
study with an average of 32% being male and 68% being female (Appendix B)
Stimulus
All stimuli used in this experiment (both digital and physical) were set, or
photographed, in CUshopTM for consistency. CUshopTM is a modular consumer behavior
research laboratory designed to replicate retail environments. The laboratory can be equip
with up to 3 aisles of 12-foot shelf sections (made from separate 4 foot pieces), which are
18
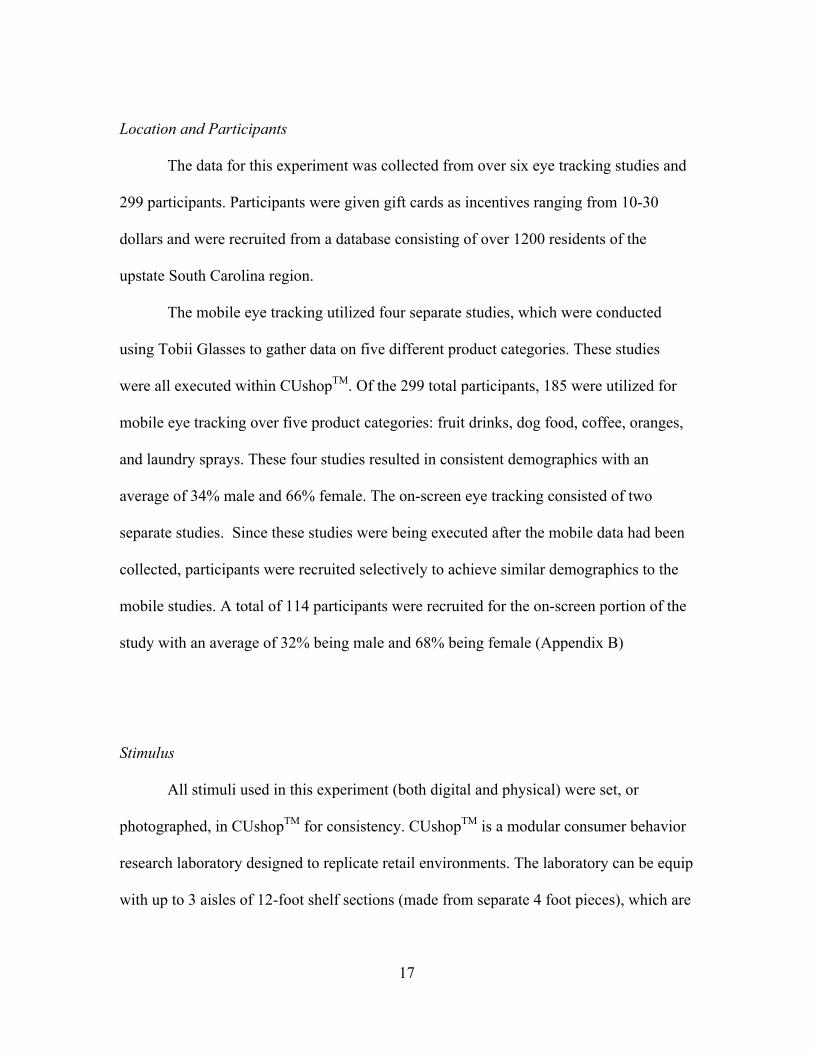
approximately 6 feet tall, and also contains a refrigerated and produce section along the
edges (Figure 4).
Figure 4: CUshopTM layout
The mobile eye tracking studies were all completed over the course of two years
and four separate experiments. The category being tested always included a variety of
competitive brands in which the consumer was required to ‘purchase’ one item. Three of
the product categories, dog food, wrinkle spray, and coffee k-cups, were located on the
standard 4 foot section of shelf. The other two product categories, fruit drink and oranges
were located on an end cap and produce shelf respectively. While piloting the on-screen
studies, it became evident that showing an entire 4 or 8 foot section of shelf on a 24 inch
monitor did not allow participants to see the details or text of packages clearly. Therefore,
for some categories, the area being studied was cropped to allow the stimuli areas to be
19
more visible during the on-screen studies. These cropped images are also used during the
analysis of the mobile eye tracking data to prevent any discrepancies.
The stimuli for the on-screen eye tracking studies are high-resolution photos of
the product categories used in the mobile portion of the study. These photos are typically
taken before each mobile eye tracking study for use in the analytical software, however
since each product category is analyzed in both a physical and digital environment in this
experiment, these photos become the stimuli for the on-screen eye tracking. The images
will be displayed on a 24-inch monitor in a slideshow format that advances by a mouse
click. A blank, black masking image is inserted between each slideshow image that is set
to automatically transition after 3 seconds. This masking image is used to break up the set
of stimuli images and allow participants to relax and better approach each different image
the same way. To better immerse participants into a retail environment similar to the
mobile eye tracking studies, an introductory video is added to the beginning of the on-
screen stimuli slideshow. This introductory video walks the participant through the
automatic opening doors of CUshopTM and represents them entering a retail environment.
As mentioned, several full shelf images were too large to show detail on the smaller
monitor and were cropped. To represent a participant in the physical environment
focusing in on the stimuli area, the cropping was made into a video for each shelf photo
starting with the full shelf set and ending with the cropped, closer up area of analysis
(AOA) photo (Figure 5).

20
Figure 5: Example of the cropped AOA used for all different product categories.
Eye Tracking Apparatus
The equipment used in this study to gather and analyze eye tracking data are all
products of Tobii. The mobile eye tracking Tobii Glasses are video based pupil and
corneal reflection glasses which sample from the right eye (Figure 6). During a study the
glasses track and record the participants eye movements while recording video of what
the participant is facing. This makes them ideal for tracking the eye movement over
physical objects. The information is gathered in a Tobii™ Recording Assistant on a SD
memory card. In addition to storing the data, the Recording Assistant also guides the
researcher through participant calibration on its digital screen. Infrared (IR) markers are
placed around the packages of interest to create an invisible plane in which the eye’s
movement can be tracking using X and Y coordinates. These markers communicate their
21
location to the glasses and each marker contains a unique identification number. A single
IR marker is used in participant calibration prior to each study.
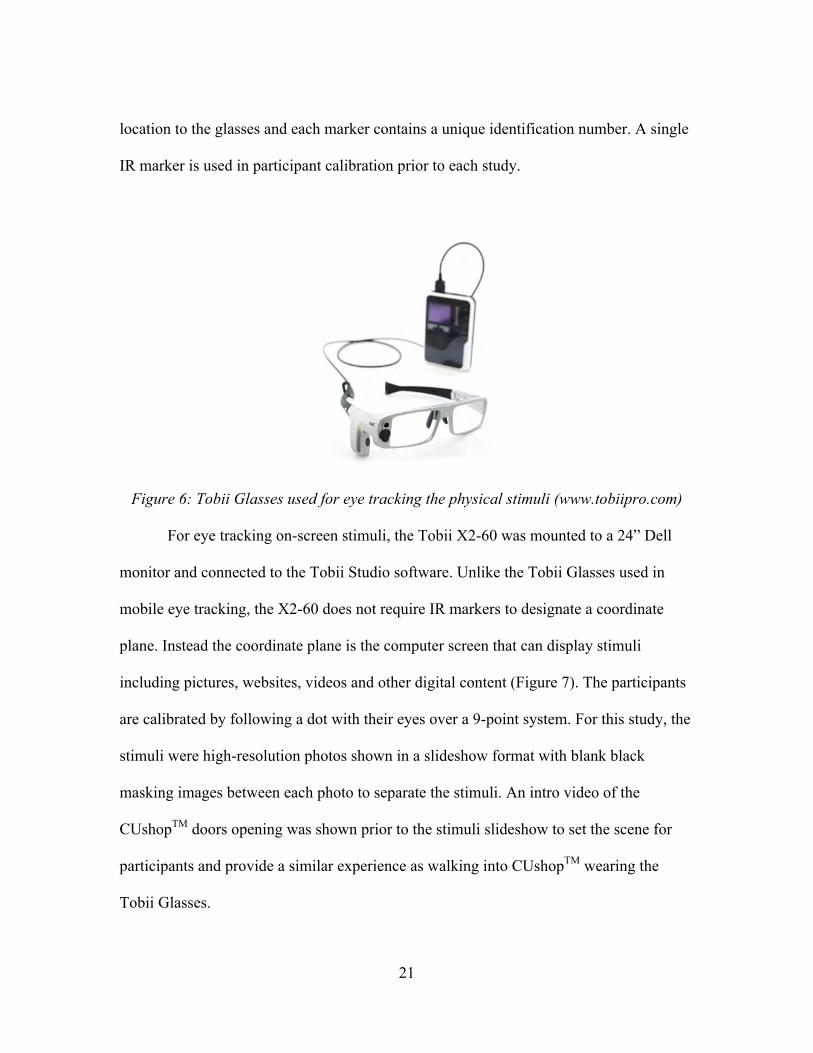
Figure 6: Tobii Glasses used for eye tracking the physical stimuli (www.tobiipro.com)
For eye tracking on-screen stimuli, the Tobii X2-60 was mounted to a 24” Dell
monitor and connected to the Tobii Studio software. Unlike the Tobii Glasses used in
mobile eye tracking, the X2-60 does not require IR markers to designate a coordinate
plane. Instead the coordinate plane is the computer screen that can display stimuli
including pictures, websites, videos and other digital content (Figure 7). The participants
are calibrated by following a dot with their eyes over a 9-point system. For this study, the
stimuli were high-resolution photos shown in a slideshow format with blank black
masking images between each photo to separate the stimuli. An intro video of the
CUshopTM doors opening was shown prior to the stimuli slideshow to set the scene for
participants and provide a similar experience as walking into CUshopTM wearing the
Tobii Glasses.
22
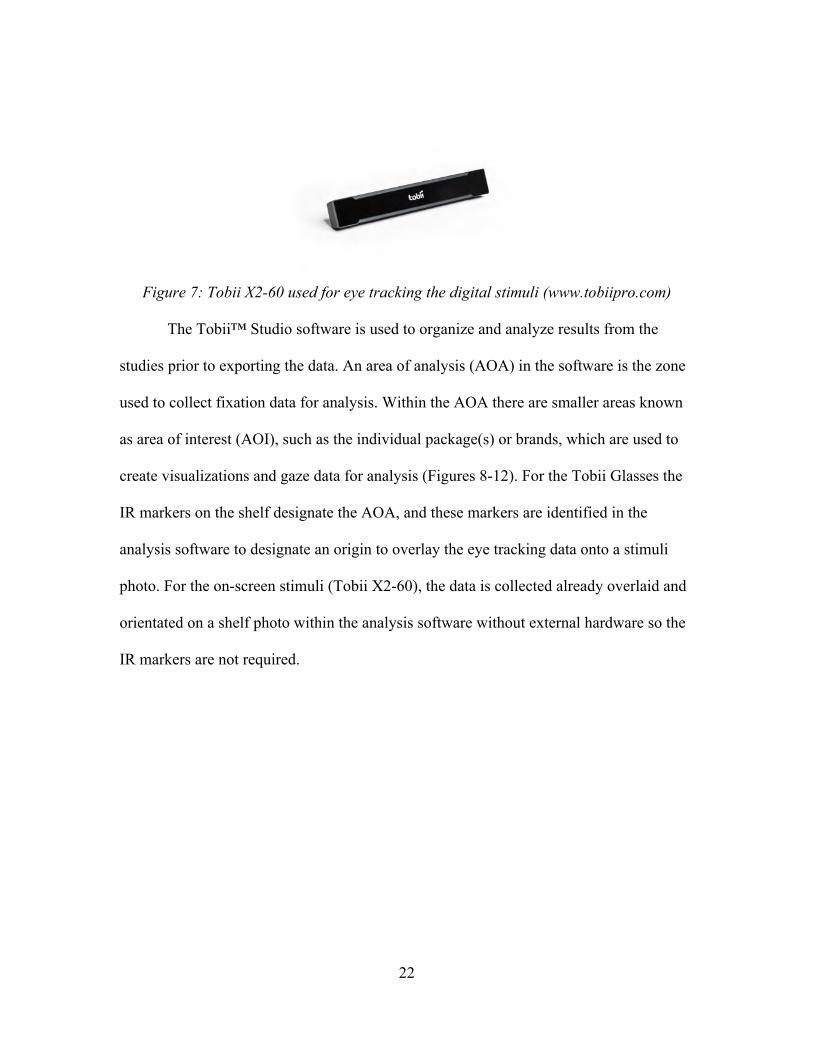
Figure 7: Tobii X2-60 used for eye tracking the digital stimuli (www.tobiipro.com)
The Tobii™ Studio software is used to organize and analyze results from the
studies prior to exporting the data. An area of analysis (AOA) in the software is the zone
used to collect fixation data for analysis. Within the AOA there are smaller areas known
as area of interest (AOI), such as the individual package(s) or brands, which are used to
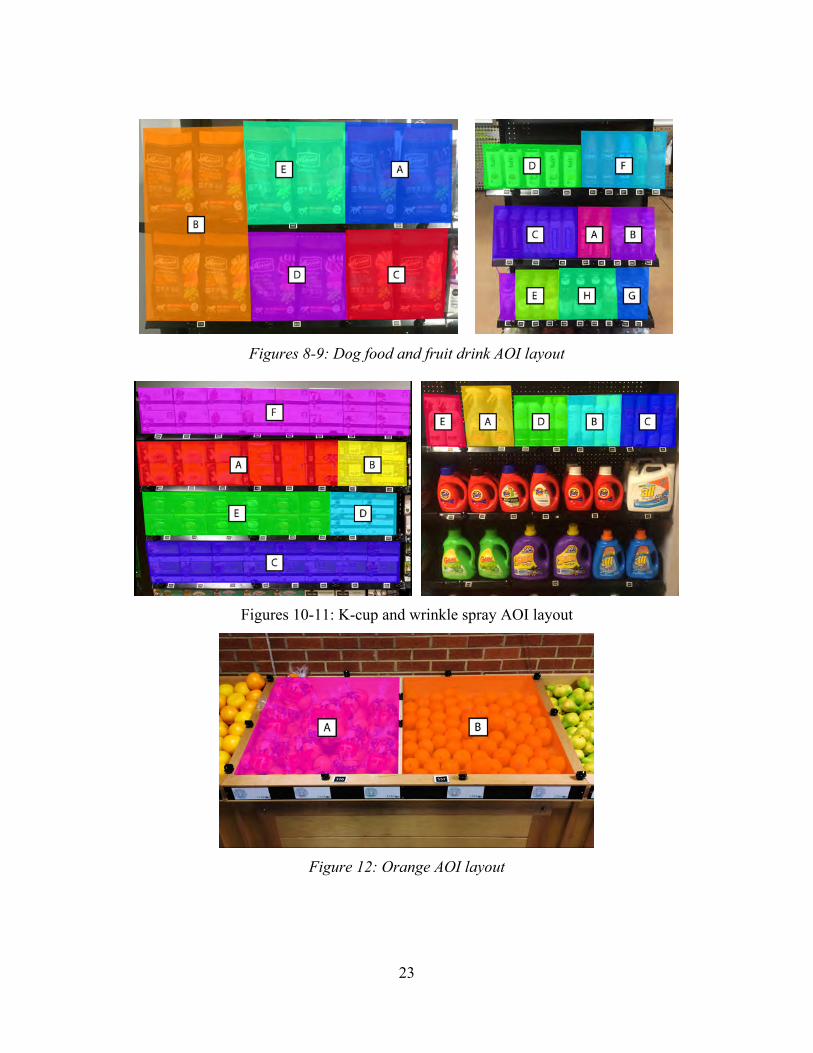
create visualizations and gaze data for analysis (Figures 8-12). For the Tobii Glasses the
IR markers on the shelf designate the AOA, and these markers are identified in the
analysis software to designate an origin to overlay the eye tracking data onto a stimuli
photo. For the on-screen stimuli (Tobii X2-60), the data is collected already overlaid and
orientated on a shelf photo within the analysis software without external hardware so the
IR markers are not required.
23
Figures 8-9: Dog food and fruit drink AOI layout
Figures 10-11: K-cup and wrinkle spray AOI layout
Figure 12: Orange AOI layout
24
In addition to using Tobii eye tracking technology to measure the on-screen
digital stimuli, an innovative ‘Visual Attention Service’ created by 3M is used to further
investigate the stimuli within the digital environment. This technology does not use
actual eye tracking data, but instead utilizes algorithms and data from the on-screen
stimuli such as contrast, color, and brightness to predict where consumers will look. The
process for using this service is as simple as uploading a photo to the website and
designating the AOIs. Since this technology is not based off eye tracking data, there are
very few metrics or data points to analyze statistically. Instead the software outputs
heatmaps, and other visual representations of the estimated attention results (Appendix
D).
Experimental Design
The studies were located either in CUshopTM or an offsite location, however
regardless of location the procedure and experimental design remained constant. The
mobile studies were executed over the span of 2 years utilizing the Clemson University
faculty and staff as participants. The participants for each of these studies were drawn
from the same population and it is possible some participants were present for several
studies over the 2 years. Due to the large number of participants needed for each study, it
was impractical to limit participants to attending just one study. Also, for most studies,
the stimuli and store shelves in CUshopTM were rearranged and replaced to prepare for
each upcoming study. Therefore returning participants would not likely see the same
stimuli set up or shelf layout even if they participated in every study in the series.
25
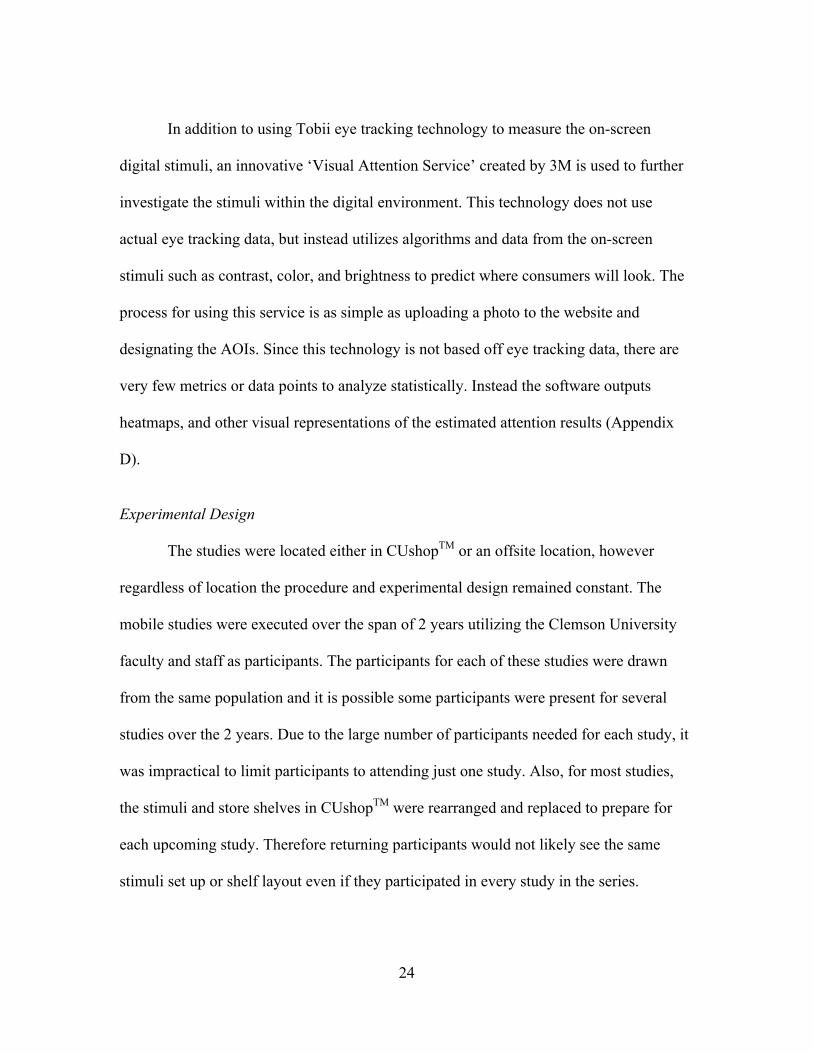
Figure 13: Example of participant in physical eye tracking environment (with CGI edited
heatmap)
The two on-screen studies were conducted over the course of two weeks with one
study in CUshopTM and the other study offsite. The purpose of combining offsite and
onsite experiment data was to recruit fresh participants who had never seen these stimuli
before while still being able to utilize the demographical screening capabilities of our
CUshopTM participant database to maintain a similar average demographic between all
the studies. Recruiting new participants was especially important in the digital studies
because these used high quality images of the physical shelf layout that had already been
used previously. Therefore a participant from the mobile studyt could potentially see the
exact shelf and stimuli layout in the on-screen study causing a bias.
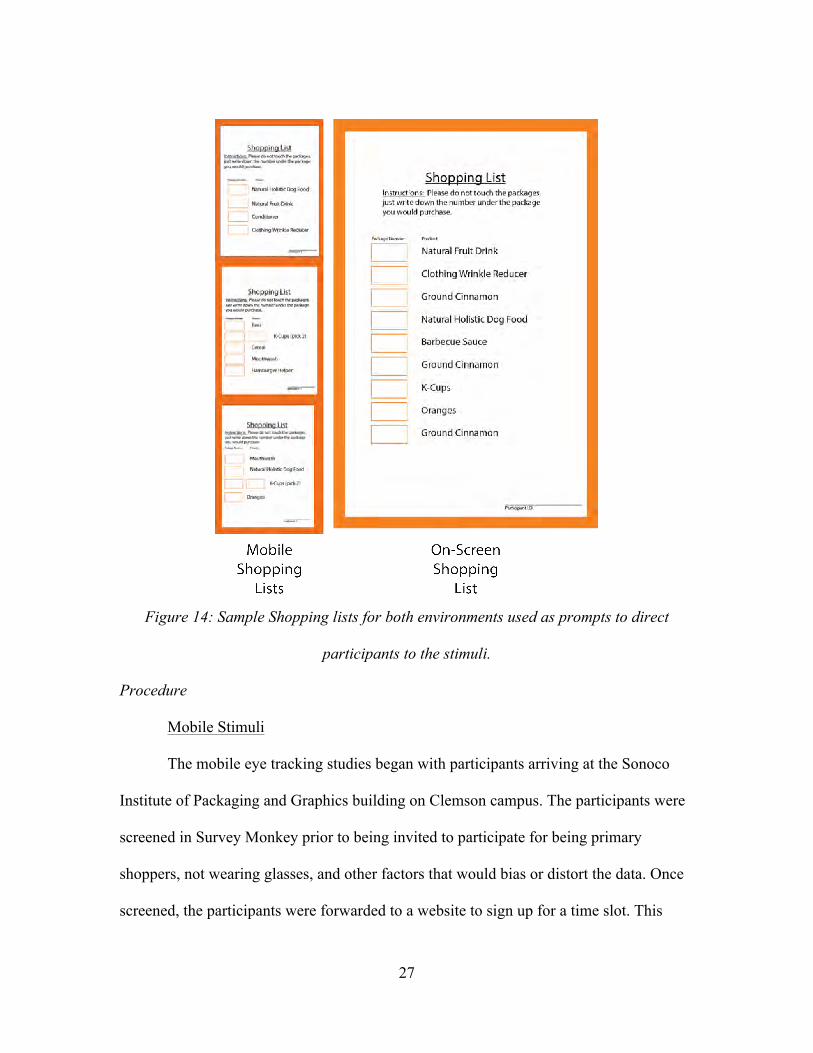
For both mobile and on-screen studies, the participants are calibrated then given a
shopping list that prompts them to shop for the specific stimuli categories. The mobile
shopping list typically contains 3-6 items for the participants to search the shelves for and

26
‘purchase’. Of these items on the list, typically half are filler items that are used to mask
the stimuli being studied and prevent any bias from the participants. The participants
purchase items by writing the 3-digit number that corresponds to that specific package on
their shopping list. This method prevents participants from touching the packages and
therefore keeps the stimuli in the same position for each participant. The shopping list for
the on-screen studies are typically longer because participants do not have to walk
through the store and search for the correct items on the shelf. The on-screen shopping
lists are also designed to be larger sized and have larger font to make reading them easier.
This was more important for the on-screen studies because the eye tracking equipment
was not head mounted, and could potentially have difficulty consistently tracking the
eyes if the participants were frequently moving their head to look down at the shopping
list. Shopping list examples used in this experiment are shown below (Figure 14).
27
Figure 14: Sample Shopping lists for both environments used as prompts to direct
participants to the stimuli.
Procedure
Mobile Stimuli
The mobile eye tracking studies began with participants arriving at the Sonoco
Institute of Packaging and Graphics building on Clemson campus. The participants were
screened in Survey Monkey prior to being invited to participate for being primary
shoppers, not wearing glasses, and other factors that would bias or distort the data. Once
screened, the participants were forwarded to a website to sign up for a time slot. This
28
ensured only a set number of participants would arrive evenly distributed through out the
day to complete the study. Upon arrival, participants completed a demographic survey
and waited for the previous participant to exit CUshopTM. Once fitted with the Tobii
Glasses, the participants are led to a blank wall that is commonly used for our calibration
process. While looking directly at the wall and keeping their head still, the participant
follows an IR marker as the researcher moves it along the wall. The digital screen on the
Tobii recording device displays a 9-point grid which the researcher traces with the IR
marker. Once calibration is completed, participants are given a shopping list that has their
unique participant number marked assigned to it. This participant number is also entered
into the surveys to allow all data to be analyzed and filtered by different demographics,
such as gender or age, while still allowing the participants to remain anonymous.
Each participant is given the same set of verbal instructions: “shop for the items
or product categories on your shopping list as you would in a normal grocery store except
write the number of the item you would ‘purchase’ in the blanks provided.” The
researcher then starts the recording and escorts the participant to the shop entrance but
stays in the hallway while the participant shops. After the participant has finished
shopping the researcher takes the Tobii Glasses and shopping list and escorts the
participant to the post-survey station for the final survey of the study. This survey
typically asks specific questions about the stimuli that if asked prior to the participant’s
shopping experience, could reveal the stimuli or variables being tested thus causing a
bias. For this experiment regarding eye-tracking technology, the post-survey was not
utilized. Once the glasses have been taken from the participant and the recording stopped
29
the SD memory card is removed and inserted into the computer with the Tobii Studio
software installed. The data from that single participant is uploaded directly into the
software for post processing and erased from the memory card. The glasses and memory
card are now ready to use for the next participant.
On-Screen Stimuli
The on-screen eye tracking studies begin the same as the mobile studies with
screened participants arriving at the study location at their assigned time slot. Similarly
the participants complete a demographic survey, and are given a shopping list with a
unique participant number. Instead of being fitted with eye tracking equipment like with
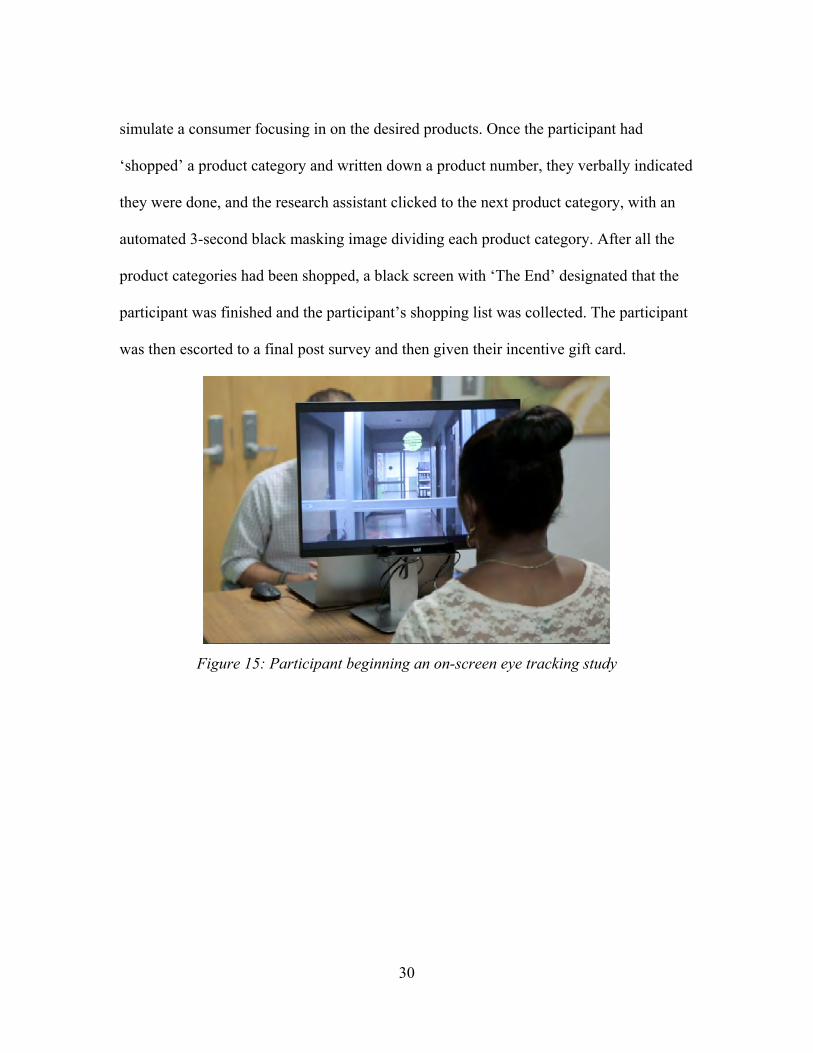
the mobile studies, the participants are simply led into a small room with a laptop
connected to a 24-inch monitor. The research assistant sits in front of the laptop while the
participant sits facing the separate monitor (Figure 15). Similar instructions are verbally
given to the participant saying: “shop the images on the computer screen for the items or
product categories on your shopping list as you would in a normal grocery store except
write the number of the item you would ‘purchase’ in the blanks provided.” Participants
were then calibrated on a similar 9-point grid as with the mobile study, however for the
on-screen study the 9-point calibration system was displayed on the participants monitor
as a single dot that moved systemically to all the 9 locations in the grid (Figure 16). Once
the calibration was complete, the on-screen slideshow was started with the introductory
video of the CUshopTM doors opening and participants walking into a store. Each product
category was then shown to the participant including the cropping transition video to
30
simulate a consumer focusing in on the desired products. Once the participant had
‘shopped’ a product category and written down a product number, they verbally indicated
they were done, and the research assistant clicked to the next product category, with an
automated 3-second black masking image dividing each product category. After all the
product categories had been shopped, a black screen with ‘The End’ designated that the
participant was finished and the participant’s shopping list was collected. The participant
was then escorted to a final post survey and then given their incentive gift card.
Figure 15: Participant beginning an on-screen eye tracking study
31
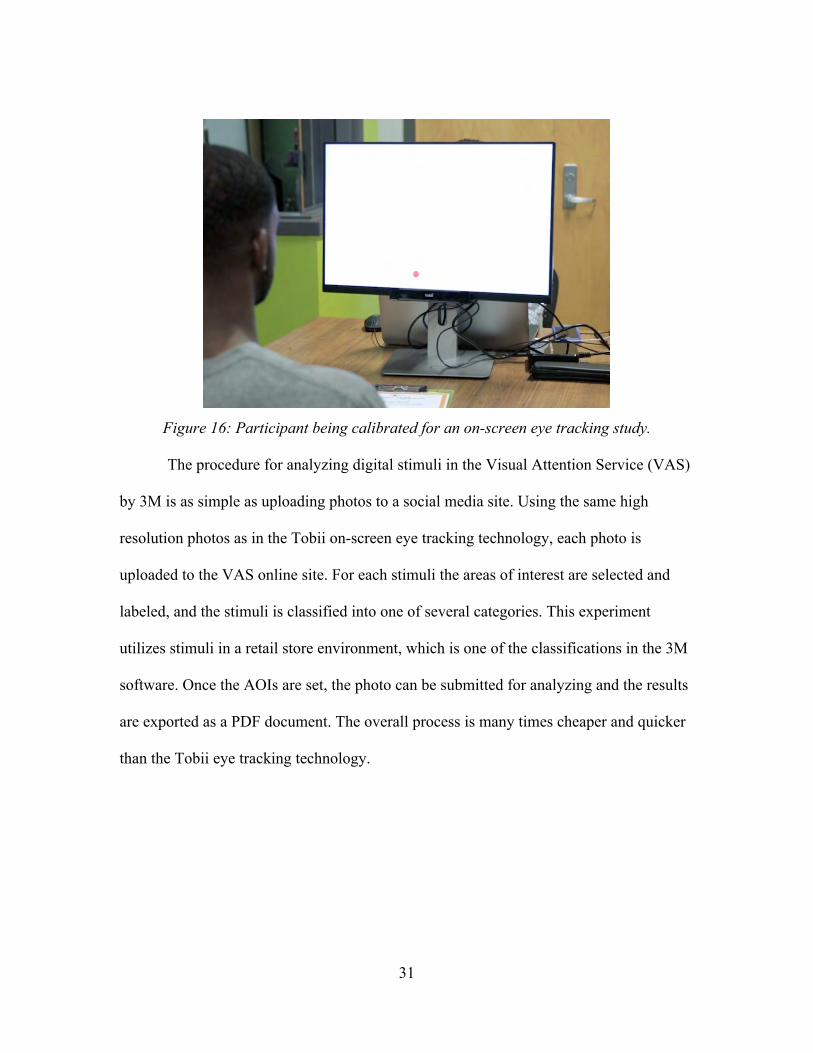
Figure 16: Participant being calibrated for an on-screen eye tracking study.
The procedure for analyzing digital stimuli in the Visual Attention Service (VAS)
by 3M is as simple as uploading photos to a social media site. Using the same high
resolution photos as in the Tobii on-screen eye tracking technology, each photo is
uploaded to the VAS online site. For each stimuli the areas of interest are selected and
labeled, and the stimuli is classified into one of several categories. This experiment
utilizes stimuli in a retail store environment, which is one of the classifications in the 3M
software. Once the AOIs are set, the photo can be submitted for analyzing and the results
are exported as a PDF document. The overall process is many times cheaper and quicker
than the Tobii eye tracking technology.
32
Statistical Analysis
Most data, including demographic information and eye tracking metrics, was
imported into Microsoft Excel for analyzing and graphing. Demographic data was easily
exported from the online survey site: Survey Monkey and then organized into charts and
graphs. The more complex eye tracking metrics were averaged across participants for
each metric, within each product category, and within both the on-screen and mobile
studies. The averages and standard errors were then plotted comparing similar eye
tracking metrics within similar product categories between the mobile and on-screen
studies. For example, the TTFF for all physical dog food stimuli averages were graphed
compared to the TTFF for all digital dog food stimuli averages. These graphs and
standard errors began to reveal specific trends within the data, however a more in depth
statistical analysis was needed to verify the trends.
The statistical analysis program SAS Plus was utilized to run 104 independent
(non-paired) two-sample t-tests. As mentioned above, these tests were organized to run a
mobile (A) product and metric data against its corresponding on-screen (B) product and
metric data. Due to the large number of t-tests needed to analyze this data, the results
were compiled into a chart showing if the variances were equal or unequal, the p-value,
and significance. A p-value less than or equal to 0.05 was considered to be significant at a
95% confidence interval.
33
CHAPTER FOUR
RESULTS AND DISCUSSION
Survey Results
Each participant was given a survey to complete before and after the shopping
portion of the study. Each participant was given a unique participant number to ensure his
or her demographic data remained anonymous. The nature of this experiment did not
require the utilization of a post-survey, however the pre-survey was used for all six
studies conducted over the two-year period. The following information outlines the
demographic results of the pre-survey questions (additional demographic information can
be accessed in Appendix B):
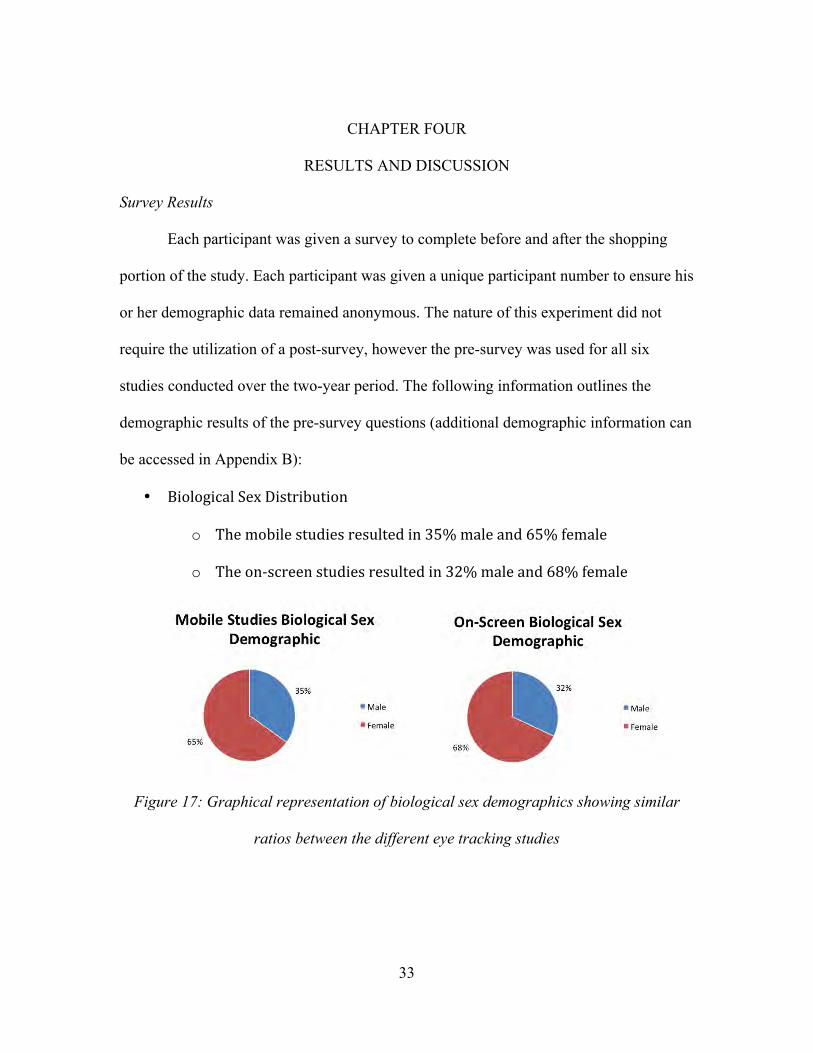
• BiologicalSexDistribution
o Themobilestudiesresultedin35%maleand65%female
o Theon-screenstudiesresultedin32%maleand68%female
Figure 17: Graphical representation of biological sex demographics showing similar
ratios between the different eye tracking studies

34
• AgeDistribution
o Outofthe185participantssurveyedinthemobilestudies,16%were
18-20,32%were21-29,19%were30-39,12%were40-49,13%
were50-59,3%were60-64,and2%were65orolder.
o Outofthe114participantssurveyedintheon-screenstudies,2%
were18-20,23%were21-29,28%were30-39,11%were40-49,
29%were50-59,5%were60-64,and1%were65orolder.
Figure 18: Age distribution between mobile and on-screen eye tracking studies
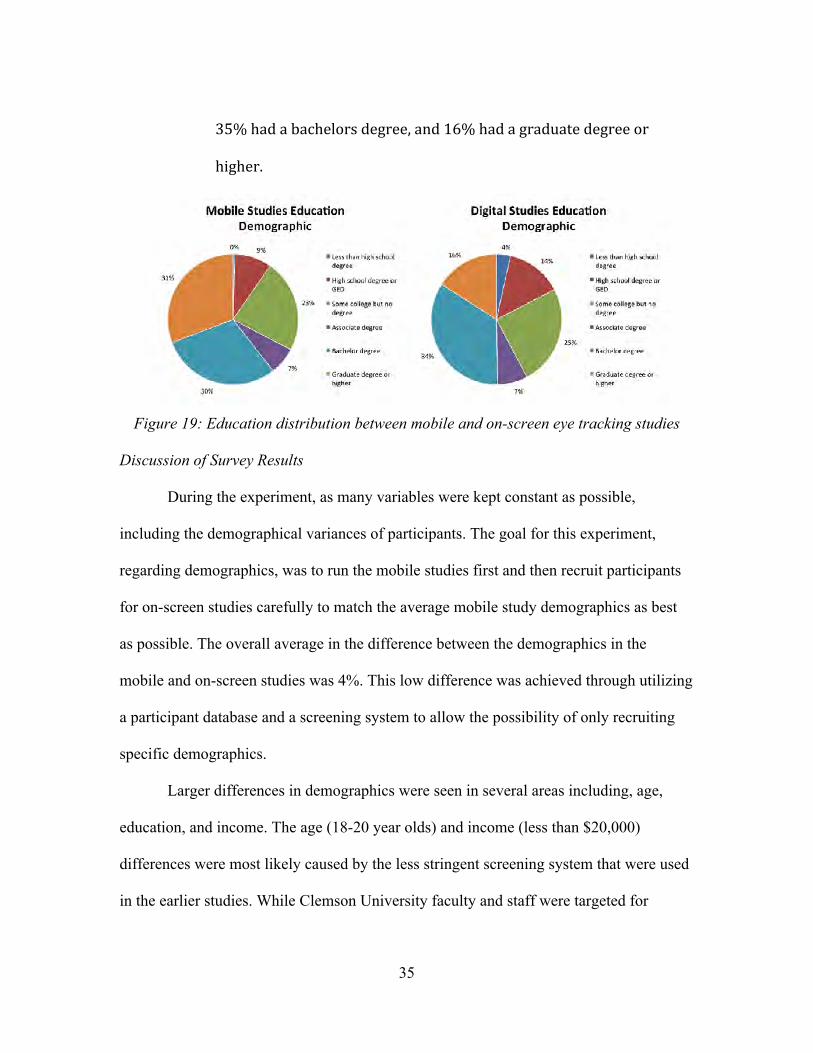
• EducationDistribution
o Outofthe185participantssurveyedinthemobilestudies,1%had
lessthanahighschooldegree,9%hadahighschooldegreeorGED,
23%hadsomecollegebutnodegree,7%hadanassociatesdegree,
29%hadabachelorsdegree,and30%hadagraduatedegreeor
higher.
o Outofthe185participantssurveyedintheon-screenstudies,4%had
lessthanahighschooldegree,14%hadahighschooldegreeorGED,
25%hadsomecollegebutnodegree,8%hadanassociatesdegree,
35
35%hadabachelorsdegree,and16%hadagraduatedegreeor
higher.
Figure 19: Education distribution between mobile and on-screen eye tracking studies
Discussion of Survey Results
During the experiment, as many variables were kept constant as possible,
including the demographical variances of participants. The goal for this experiment,
regarding demographics, was to run the mobile studies first and then recruit participants
for on-screen studies carefully to match the average mobile study demographics as best
as possible. The overall average in the difference between the demographics in the
mobile and on-screen studies was 4%. This low difference was achieved through utilizing
a participant database and a screening system to allow the possibility of only recruiting
specific demographics.
Larger differences in demographics were seen in several areas including, age,
education, and income. The age (18-20 year olds) and income (less than $20,000)
differences were most likely caused by the less stringent screening system that were used
in the earlier studies. While Clemson University faculty and staff were targeted for

36
participants of these studies, it is likely that students were able to also participate in the
early studies. The addition of these few students would decrease the average age and
income distribution to create the above average 14 and 11% differences respectively.
Utilizing Clemson University faculty and staff allows for many benefits, such as high
ethnicity diversity, however also creates an abnormally large highly educated participant
pool (30% graduate degree or higher). The on-screen study that was completed off sight
only consisted of 16% participants with a graduate degree or higher and caused the larger
difference seen in those results. Most of the remaining demographics were not
significantly different, and the overall demographic differences were small enough to not
cause bias within the experiment.
Eye Tracking Metrics
All eye tracking metrics were analyzed in the Tobii Studio using the Tobii
fixation filter. The fixation filters set the threshold for what is considered a fixation or a
saccade and therefore determines what is considered a gaze point for eye tracking data
collected by both the mobile eye tracker (Tobii Glasses) and on-screen eye tracker (Tobii
X2-60). The eye tracking data was exported from Tobii Studio for four eye tracking
metrics: Time to first fixation (TTFF), total fixation duration (TFD), fixation count (FC),
and percent fixated (%Fixated)
Time to First Fixation

37
The eye tracking metric time to first fixation (TTFF) is defined as the time it takes
a stimuli to draw the eyes attention. The timer for this metric starts as soon as the
participant looks into the specific area of analysis (AOA) and is stopped when the
participant fixates on the specific area of interest (AOI) (Figure 20). Therefore, stimuli
with the lower TTFF would be considered better at attracting consumer attention.
Figure 20: Example of TTFF metric calculations – this AOI would have a TTFF value of
5 seconds.
38
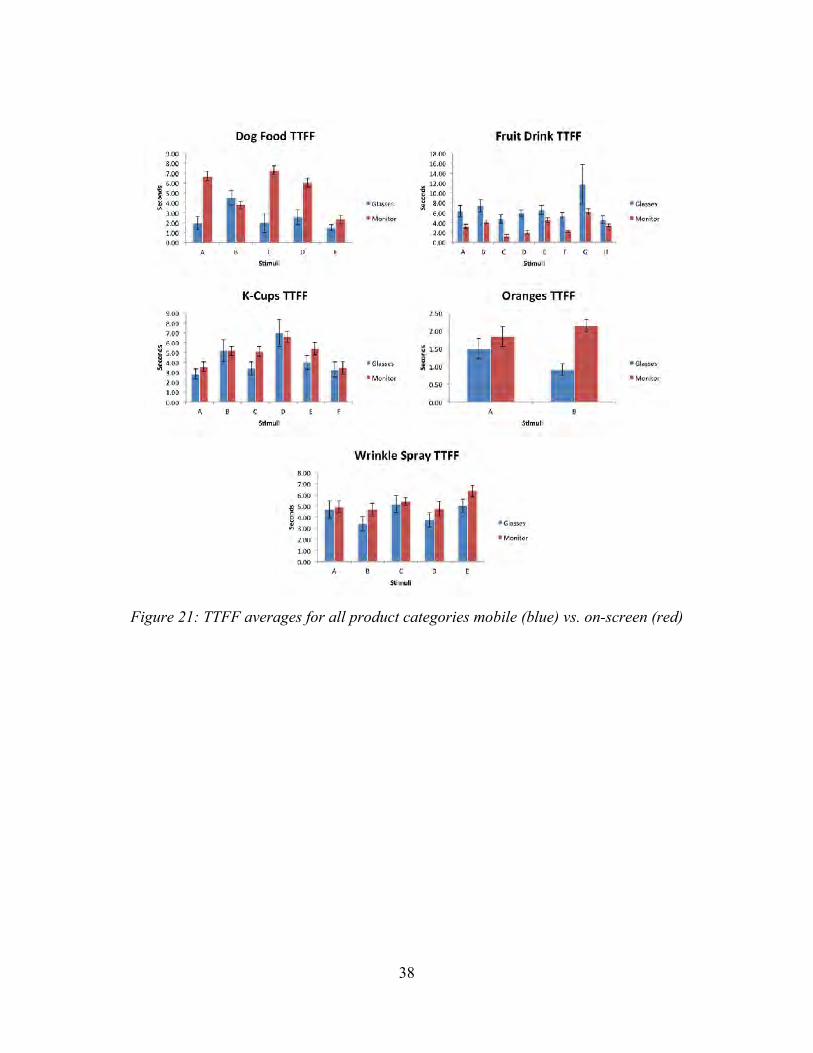
Figure 21: TTFF averages for all product categories mobile (blue) vs. on-screen (red)
39
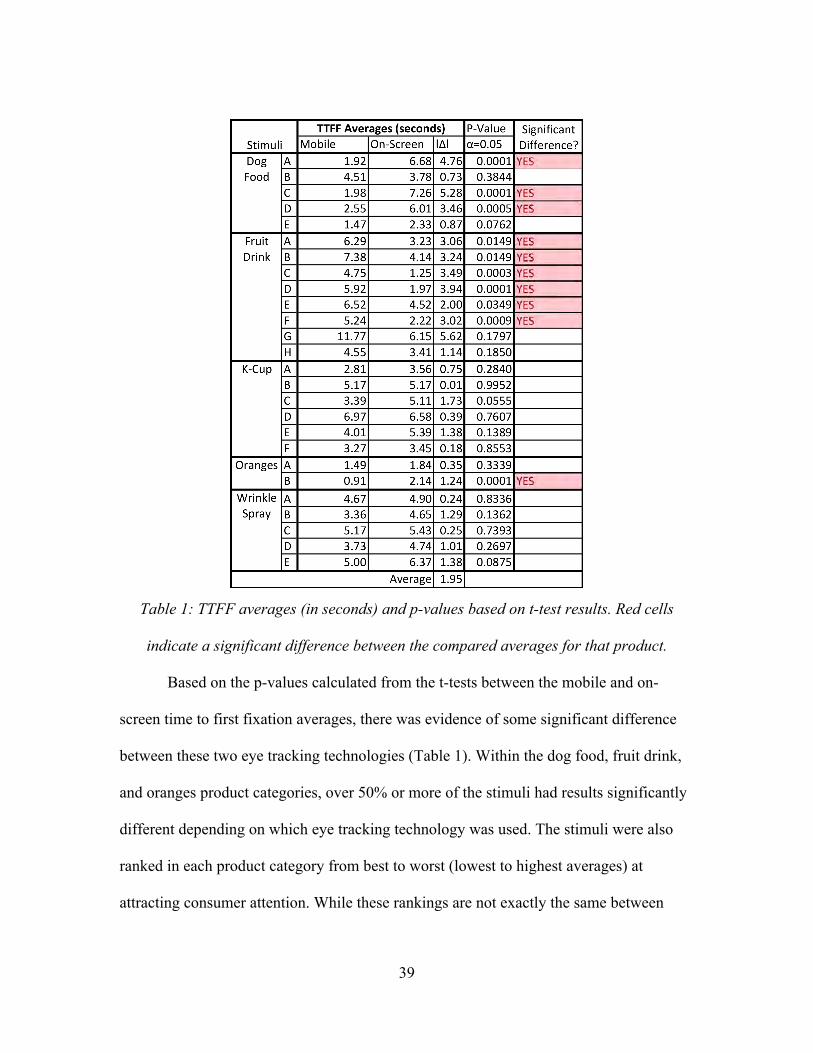
Table 1: TTFF averages (in seconds) and p-values based on t-test results. Red cells
indicate a significant difference between the compared averages for that product.
Based on the p-values calculated from the t-tests between the mobile and on-
screen time to first fixation averages, there was evidence of some significant difference
between these two eye tracking technologies (Table 1). Within the dog food, fruit drink,
and oranges product categories, over 50% or more of the stimuli had results significantly
different depending on which eye tracking technology was used. The stimuli were also
ranked in each product category from best to worst (lowest to highest averages) at
attracting consumer attention. While these rankings are not exactly the same between
40
variables, they are very similar even for the categories that experienced higher significant
differences between environments. The graphs in figure 21 break down the individual
product categories TTFF values compared between physical (blue) and digital (red)
environments. These graphs are typically more valuable for experiments where the
individual stimuli of a category are changed as the experiment variable. However for this
experiment, where the technology is the variable, the graphs provide visual insight to the
t-tests by showing potential trends with standard error
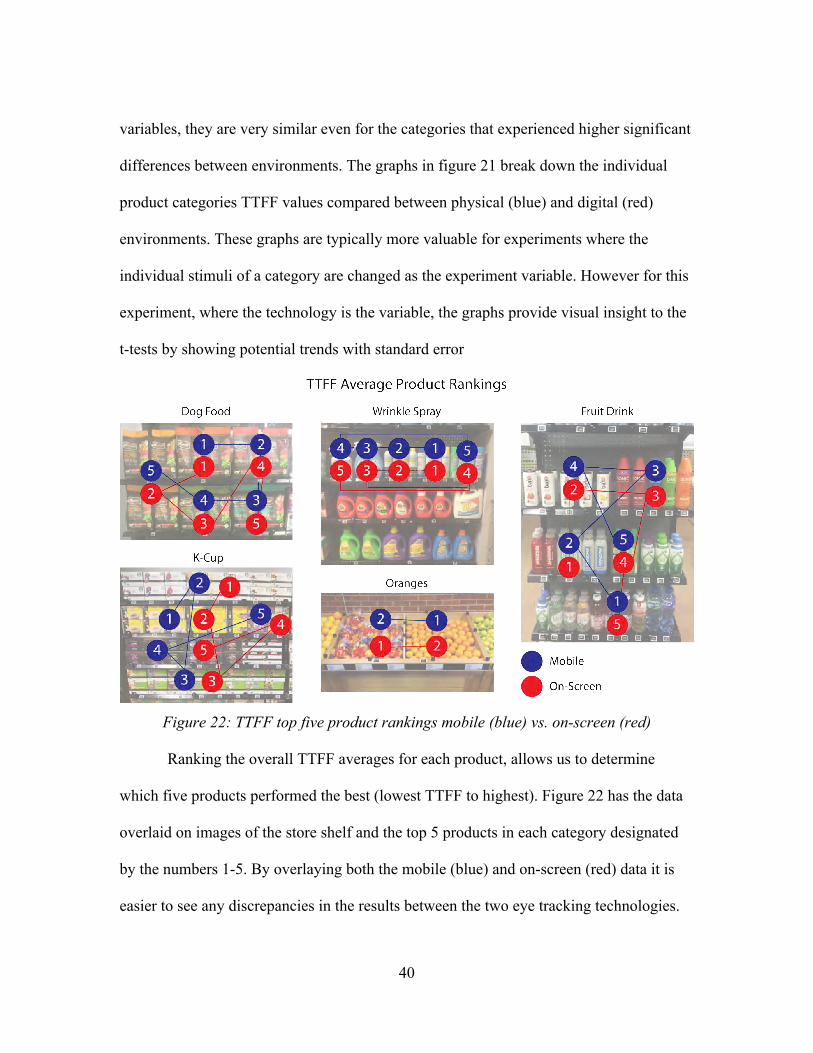
Figure 22: TTFF top five product rankings mobile (blue) vs. on-screen (red)
Ranking the overall TTFF averages for each product, allows us to determine
which five products performed the best (lowest TTFF to highest). Figure 22 has the data
overlaid on images of the store shelf and the top 5 products in each category designated
by the numbers 1-5. By overlaying both the mobile (blue) and on-screen (red) data it is
easier to see any discrepancies in the results between the two eye tracking technologies.
41
The dog food and fruit drink categories have the largest differences in the rankings while
the k-cup and wrinkle spray have only minor differences.
Even though most of the stimuli ranked similarly in both environments, the
statistically significant differences between averages in some product categories prove
that participants are not drawn, with at least the same speed, to the stimuli. In the dog
food category, which included 180 participants (66 mobile and 114 on-screen),
participants took an average of 3 seconds longer to find the digital stimuli. However in
the fruit drink category, the 164 participants (50 mobile and 114 on-screen) took an
average of 3 seconds longer to find the physical stimuli compared to the same digital
ones.
The time to first fixation metric results yielded no trends of either mobile or on-
screen technologies depicting participants taking quicker or longer time to find specific
stimuli across the product categories. Statistically significant differences were still
present in the TTFF results, indicating that there are still inconsistencies between two
different eye tracking environments and technologies when viewing the same stimuli.
Even with these differences, the overall stimuli ranking was only slightly varied and
could potentially be comparative across platforms.
42
Total Fixation Duration
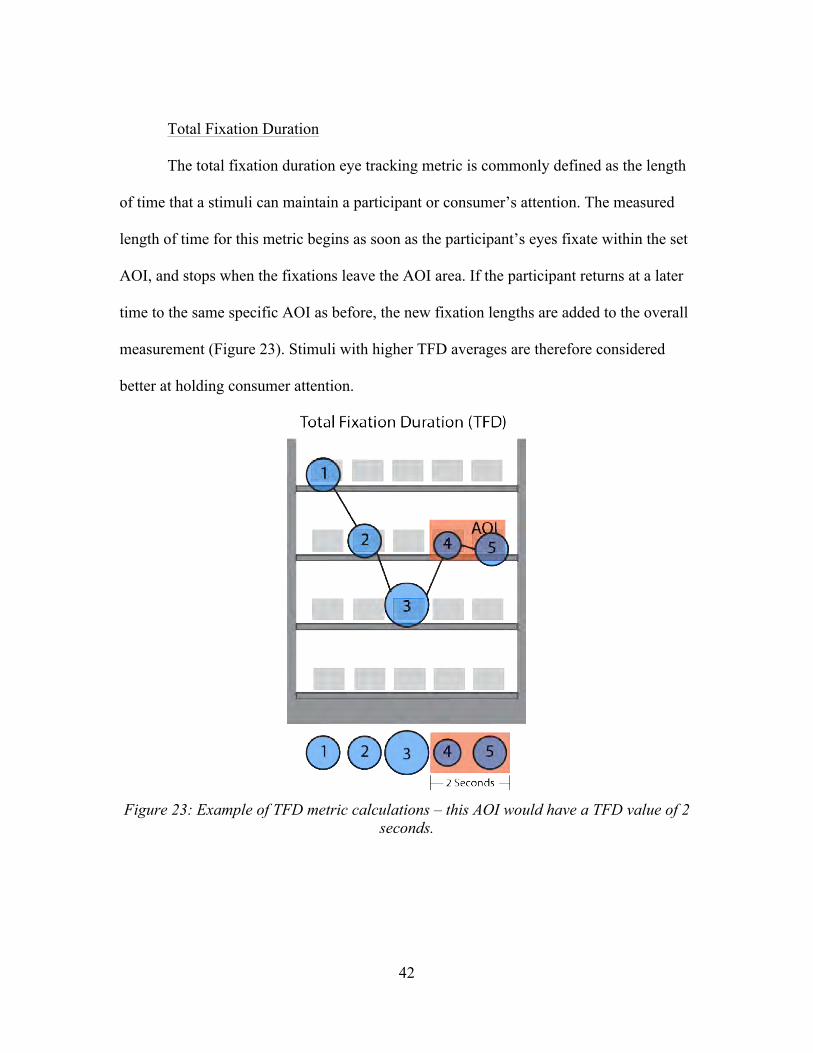
The total fixation duration eye tracking metric is commonly defined as the length
of time that a stimuli can maintain a participant or consumer’s attention. The measured
length of time for this metric begins as soon as the participant’s eyes fixate within the set
AOI, and stops when the fixations leave the AOI area. If the participant returns at a later
time to the same specific AOI as before, the new fixation lengths are added to the overall
measurement (Figure 23). Stimuli with higher TFD averages are therefore considered
better at holding consumer attention.
Figure 23: Example of TFD metric calculations – this AOI would have a TFD value of 2
seconds.
43
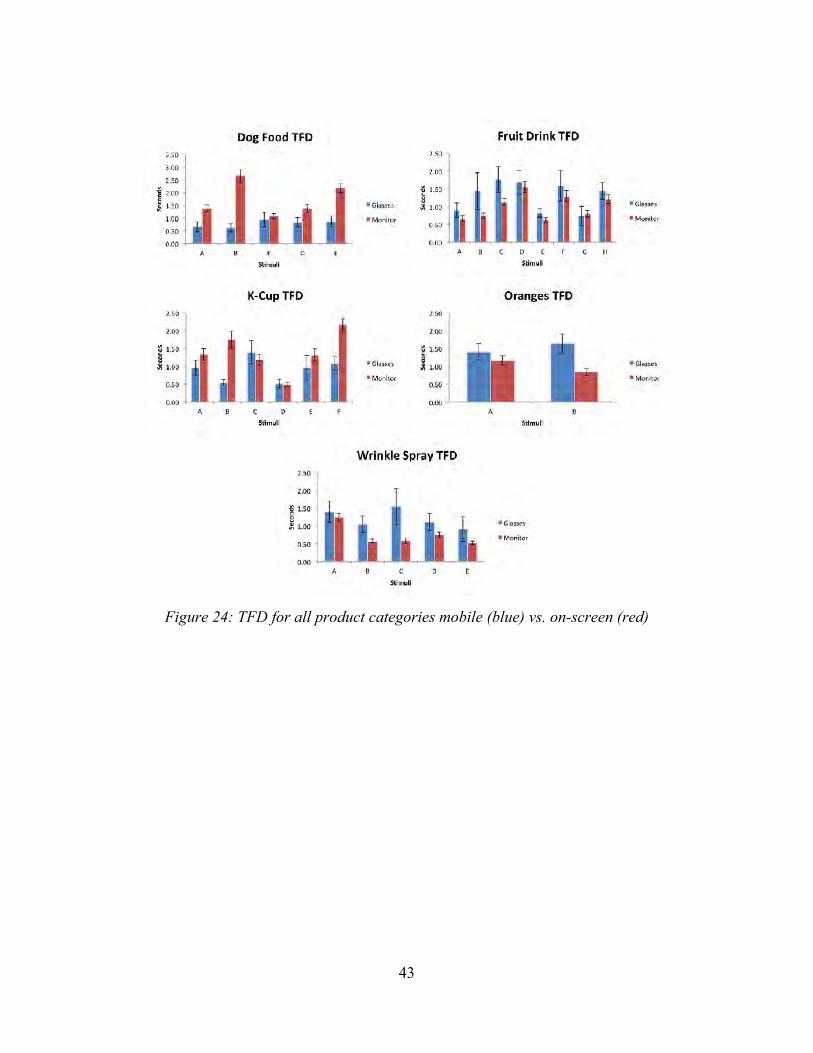
Figure 24: TFD for all product categories mobile (blue) vs. on-screen (red)
44
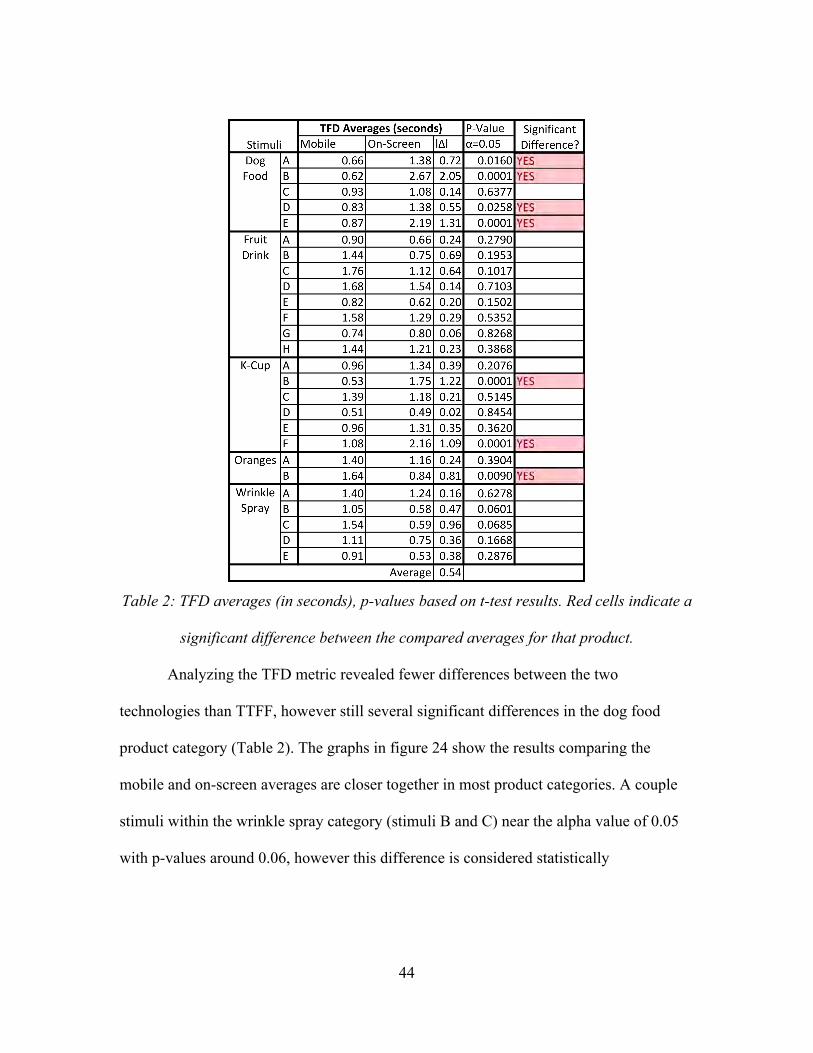
Table 2: TFD averages (in seconds), p-values based on t-test results. Red cells indicate a
significant difference between the compared averages for that product.
Analyzing the TFD metric revealed fewer differences between the two
technologies than TTFF, however still several significant differences in the dog food
product category (Table 2). The graphs in figure 24 show the results comparing the
mobile and on-screen averages are closer together in most product categories. A couple
stimuli within the wrinkle spray category (stimuli B and C) near the alpha value of 0.05
with p-values around 0.06, however this difference is considered statistically
45
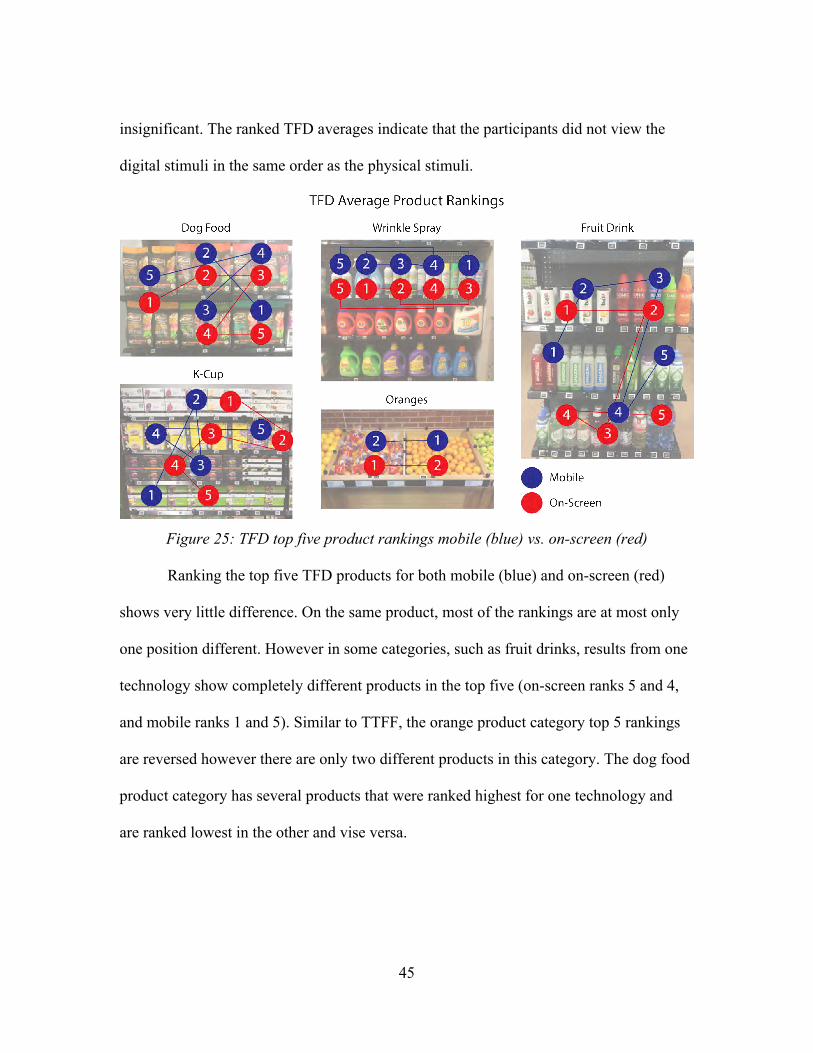
insignificant. The ranked TFD averages indicate that the participants did not view the
digital stimuli in the same order as the physical stimuli.
Figure 25: TFD top five product rankings mobile (blue) vs. on-screen (red)
Ranking the top five TFD products for both mobile (blue) and on-screen (red)
shows very little difference. On the same product, most of the rankings are at most only
one position different. However in some categories, such as fruit drinks, results from one
technology show completely different products in the top five (on-screen ranks 5 and 4,
and mobile ranks 1 and 5). Similar to TTFF, the orange product category top 5 rankings
are reversed however there are only two different products in this category. The dog food
product category has several products that were ranked highest for one technology and
are ranked lowest in the other and vise versa.
46
Even though the product rankings differ, the TFD overall averages are relatively
more similar than TTFF. The TTFF results revealed 3/8ths of the overall stimuli were
significantly different between the two environments with an overall average of 1.9
seconds difference between all the stimuli. However, the TFD results show that only
about 1/4th of the stimuli are significantly different, most of which are in the dog food
product category, and vary by an overall average difference of only 0.5 seconds. The dog
food category yielded the most statistically significant differences and participants fixated
on the on-screen dog food stimuli an overall average of one second longer than the
mobile stimuli. While most product categories did not see significant difference between
the two eye tracking environments, the inconsistencies between the TFD ranking supports
that the results from the two eye tracking technologies cannot be directly compared for all
product categories.
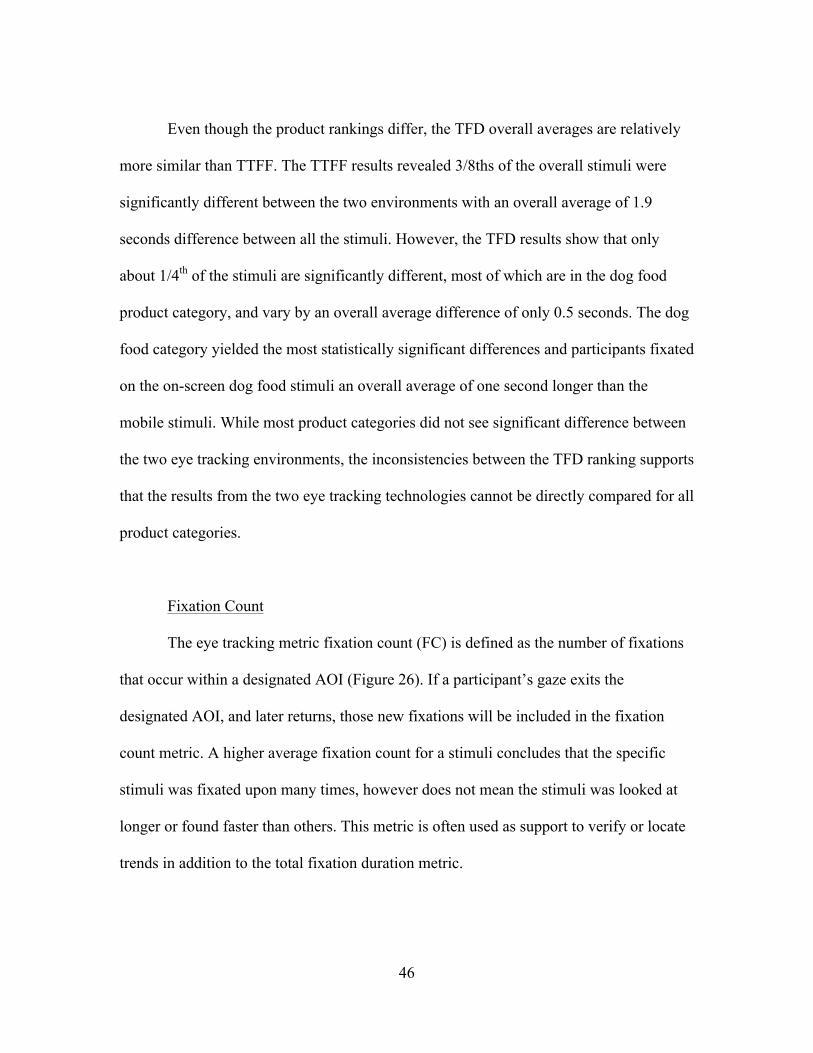
Fixation Count
The eye tracking metric fixation count (FC) is defined as the number of fixations
that occur within a designated AOI (Figure 26). If a participant’s gaze exits the
designated AOI, and later returns, those new fixations will be included in the fixation
count metric. A higher average fixation count for a stimuli concludes that the specific
stimuli was fixated upon many times, however does not mean the stimuli was looked at
longer or found faster than others. This metric is often used as support to verify or locate
trends in addition to the total fixation duration metric.
47
Figure 26: Example of FC metric calculations – this AOI would have a FC value of 3
fixations.
48
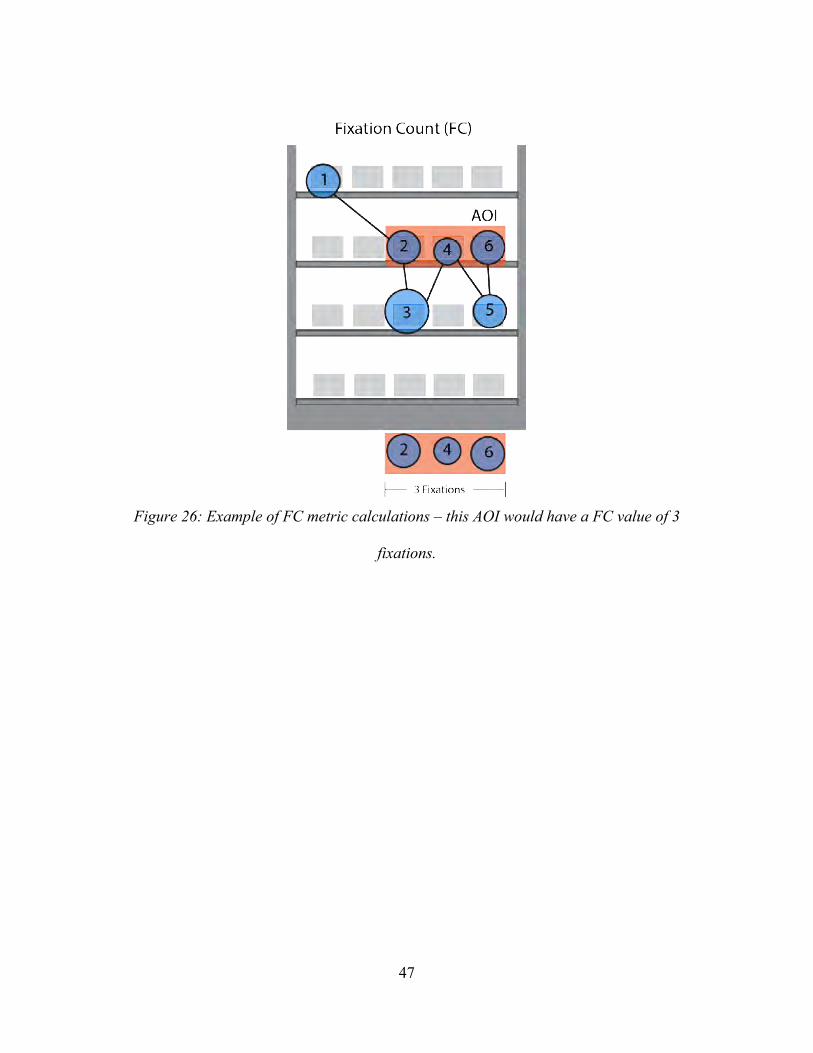
Figure 27: FC for all product categories mobile (blue) vs. on-screen (red)

49
Table 3: FC averages (in seconds), p-values based on t-test results. Red cells indicate a
significant difference between the compared averages for that product.
Statistical analysis of the FC results revealed conclusive results that the dog food
product category was significantly different in the two eye tracking technologies. All five
stimuli within the category have a p-value less than alpha (0.05) thus the results between
the two eye tracking technologies are considered statistically significantly different
(Figure 27).
50
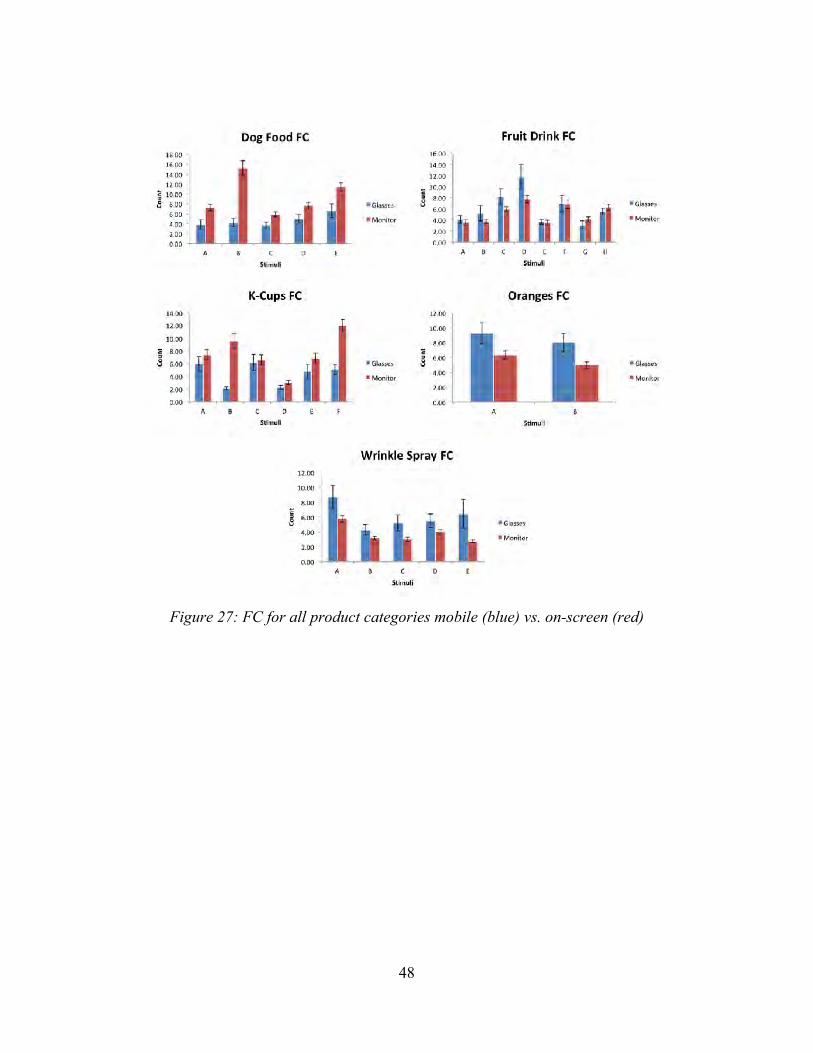
Figure 28: FC top five product rankings mobile (blue) vs. on-screen (red)
The ranking of the FC averages shows slight inconsistencies. In each product
category the same stimuli are always in the top three regardless of the eye tracking
technology. This is interesting because even though the rankings stay similar there are
significant differences in the FC averages between the two technologies. The entire dog
food product category experienced a large delta, however the actual rankings in this
category only slightly vary.
The dog food category, with 100 percent of the stimuli flagged as significantly
different, had the highest average of 4.8 fixations. However in addition to the dog food
category, the wrinkle spray and orange categories had several stimuli close to alpha with
p-values around 0.07. With a relatively similar ranking of the stimuli averages, the
participants therefore fixating on the same stimuli similar amounts of time regardless of
the environment being digital or physical. However, this metric gives little insight to the
51
order in which the products were looked at (TTFF) or how long the fixations lasted
(TFD). For all the categories, except dog food, the participant’s fixation averages were
similar enough to be compared interchangeably across the mobile and on-screen eye
tracking environments.
Percent Fixated
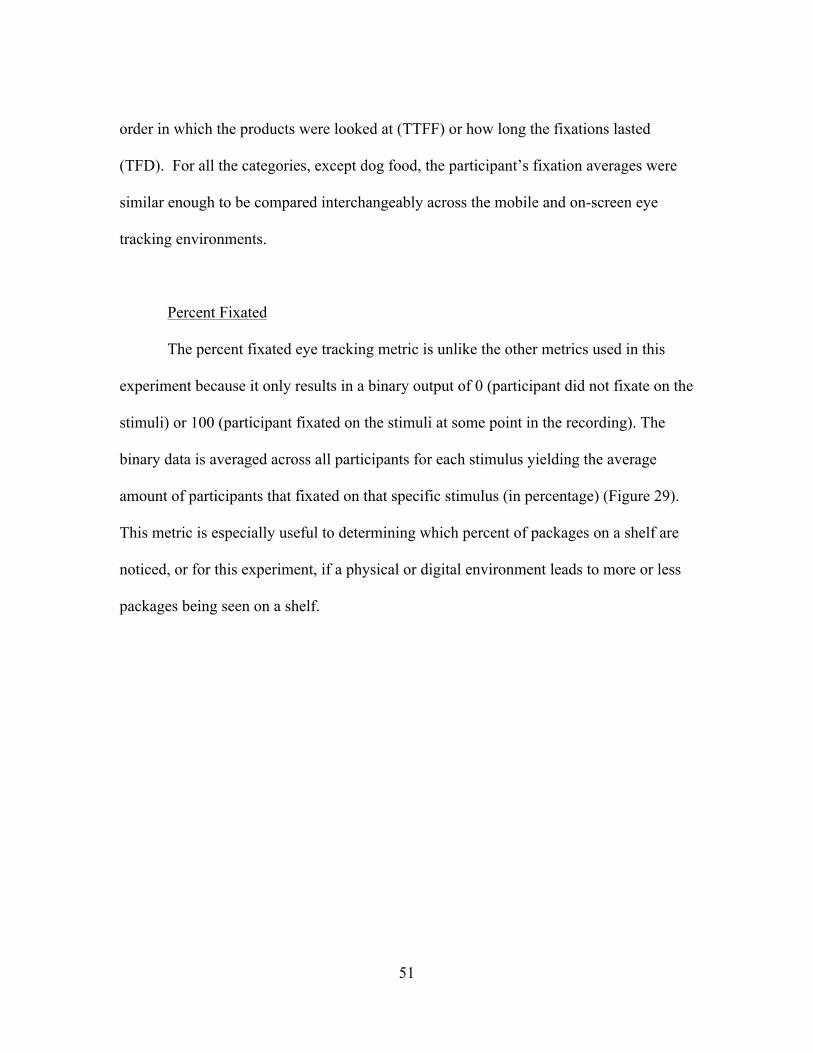
The percent fixated eye tracking metric is unlike the other metrics used in this
experiment because it only results in a binary output of 0 (participant did not fixate on the
stimuli) or 100 (participant fixated on the stimuli at some point in the recording). The
binary data is averaged across all participants for each stimulus yielding the average
amount of participants that fixated on that specific stimulus (in percentage) (Figure 29).
This metric is especially useful to determining which percent of packages on a shelf are
noticed, or for this experiment, if a physical or digital environment leads to more or less
packages being seen on a shelf.
52
Figure 29: Example of %Fixated metric calculations – this AOI would have a %Fixated
average of 50 percent.

53
Figure 30: % Fixated for all product categories mobile (blue) vs. on-screen (red)

54
Table 4: %Fixated averages, p-values based on t-test results. Red cells indicate a
significant difference between the compared averages for that product.
Based on the p-values calculated from the t-tests between the mobile and on-
screen percent fixated values there is evidence to conclude that most stimuli did not
experience a significant difference between the two technologies (Table 4). The dog food
product category, similar to the other metrics, was however mostly significantly different
with some very large delta values between specific stimuli.
55
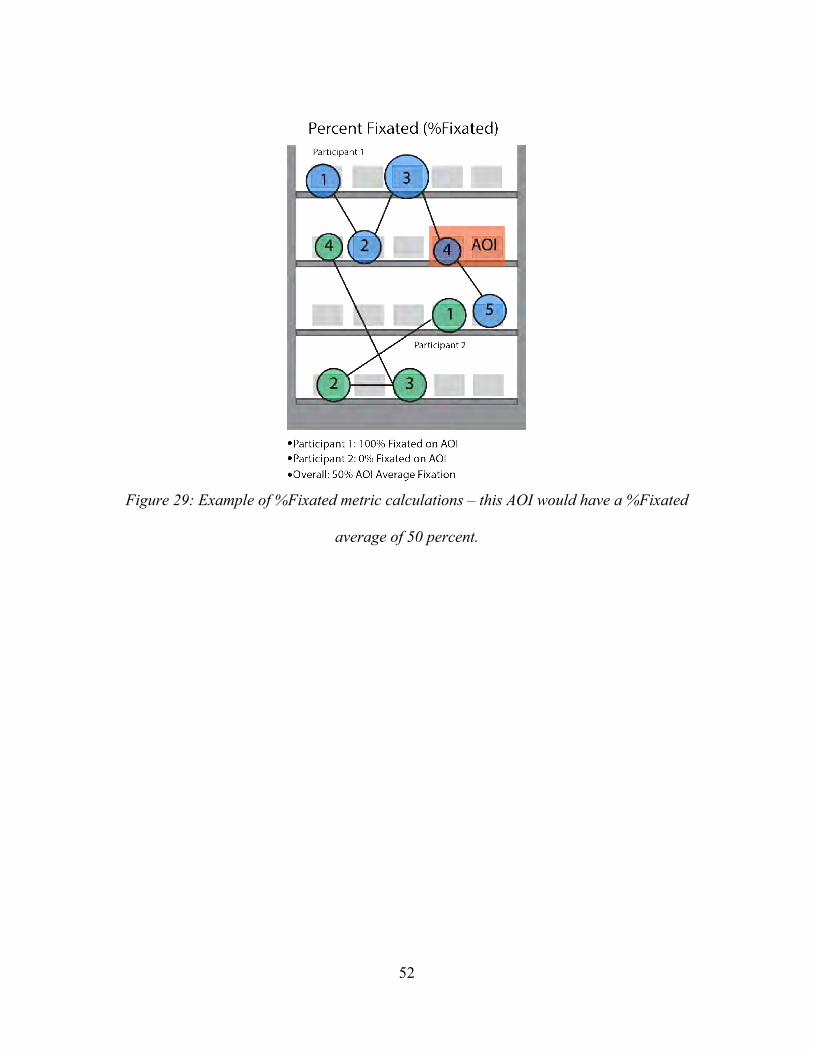
Figure 31: %Fixated top five product rankings mobile (blue) vs. on-screen (red)
Even though most stimuli in the %Fixated metric are not significantly different
between the two environments, most stimuli that are significantly different have
unusually large delta values between their mobile and on-screen averages. Dog food
stimuli D and E experienced a 56 and 50 percent increase in being fixated on at least once
when going from the physical environment to the digital environment. This trend of the
on-screen stimuli being seen more (versus not being seen at all in the mobile
environment) is present for all the dog food stimuli and most of the fruit drink stimuli.
The other stimuli (wrinkle spray and k-cups) have mixed delta results, however the
orange product category exhibits the opposite trend with the physical stimuli being more
noticed than the digital.
A likely factor for this trend is shelf position. The percent fixated metric is
powerful due to the insight it provides on shelf presence and how it changes with
56
different variables. While shelf position is important to mobile stimuli, on-screen stimuli
have other variables such as contrast, brightness, depth perception, or perhaps the image
does not highlight complex package graphics. The dog food packaging used as a stimuli
for this experiment contains very dark packaging with highly contrasting graphics. These
contrasting graphics may be more noticeable in a physical environment instead of a
photo. Similarly the cropped on-screen images remove the shelf position bias, especially
in a product category such as the k-cups where the whole image is filled with packages.
57
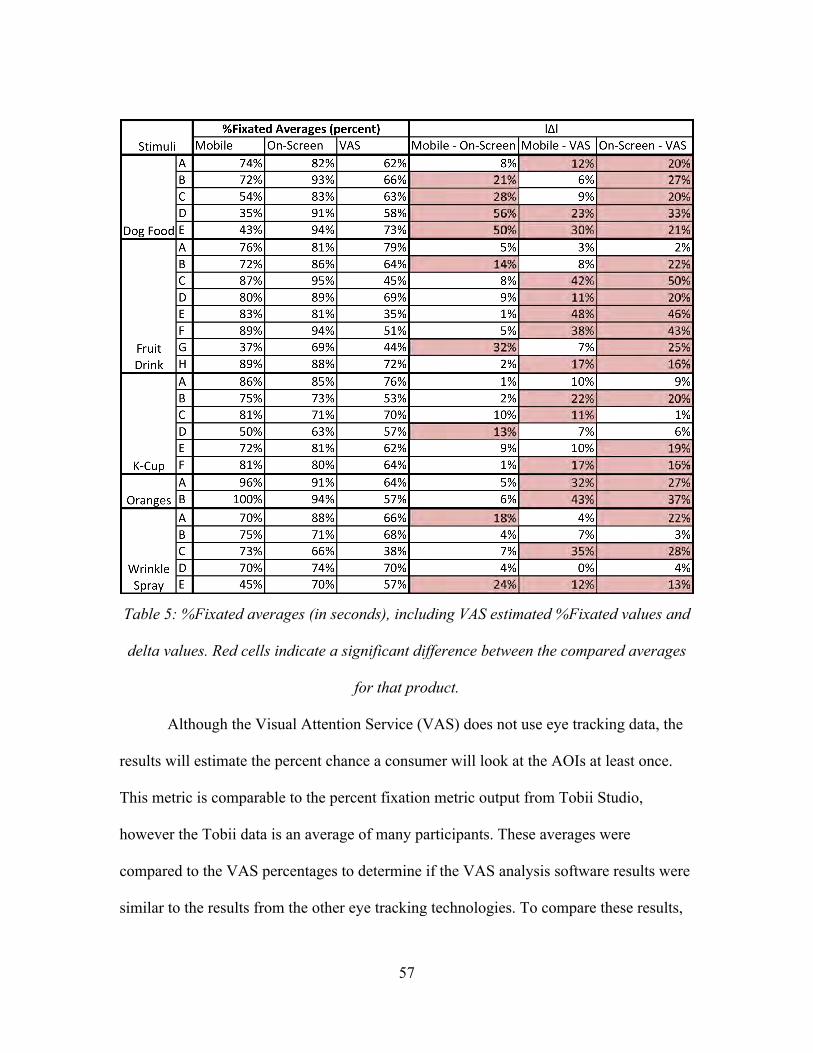
Table 5: %Fixated averages (in seconds), including VAS estimated %Fixated values and
delta values. Red cells indicate a significant difference between the compared averages
for that product.
Although the Visual Attention Service (VAS) does not use eye tracking data, the
results will estimate the percent chance a consumer will look at the AOIs at least once.
This metric is comparable to the percent fixation metric output from Tobii Studio,
however the Tobii data is an average of many participants. These averages were
compared to the VAS percentages to determine if the VAS analysis software results were
similar to the results from the other eye tracking technologies. To compare these results,
58
the difference between the percent fixated averages of each variable (VAS, on-screen or
mobile) were calculated and any resulting difference over 10% was considered a
significant difference. The ten percent significant difference threshold was determined
arbitrarily. As seen in Table 5, there are many percent differences that are higher than
10% between the VAS results and both the Tobii on-screen and mobile percent fixated
results. Eye tracking results are directly dependent to the participants given task and in
this experiment participants are asked to shop the categories for a specific product. The
VAS technology is unable to account for this factor in its algorithms.
Overall Significant Difference Results
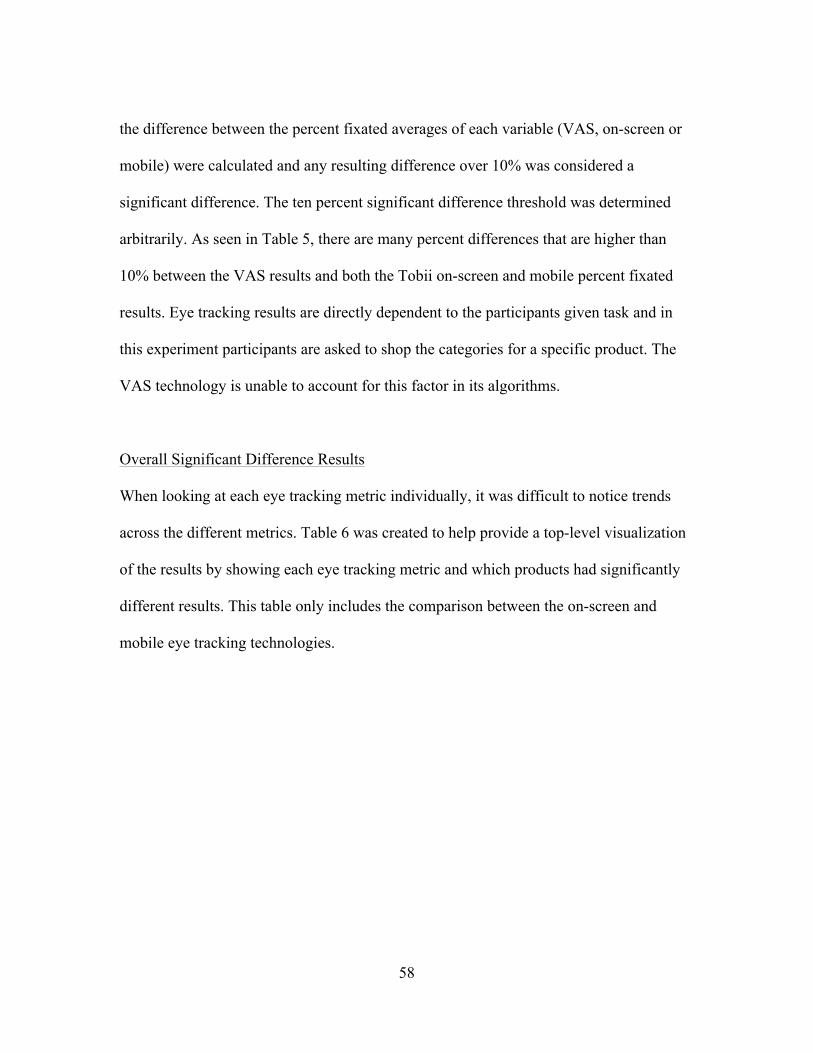
When looking at each eye tracking metric individually, it was difficult to notice trends
across the different metrics. Table 6 was created to help provide a top-level visualization
of the results by showing each eye tracking metric and which products had significantly
different results. This table only includes the comparison between the on-screen and
mobile eye tracking technologies.
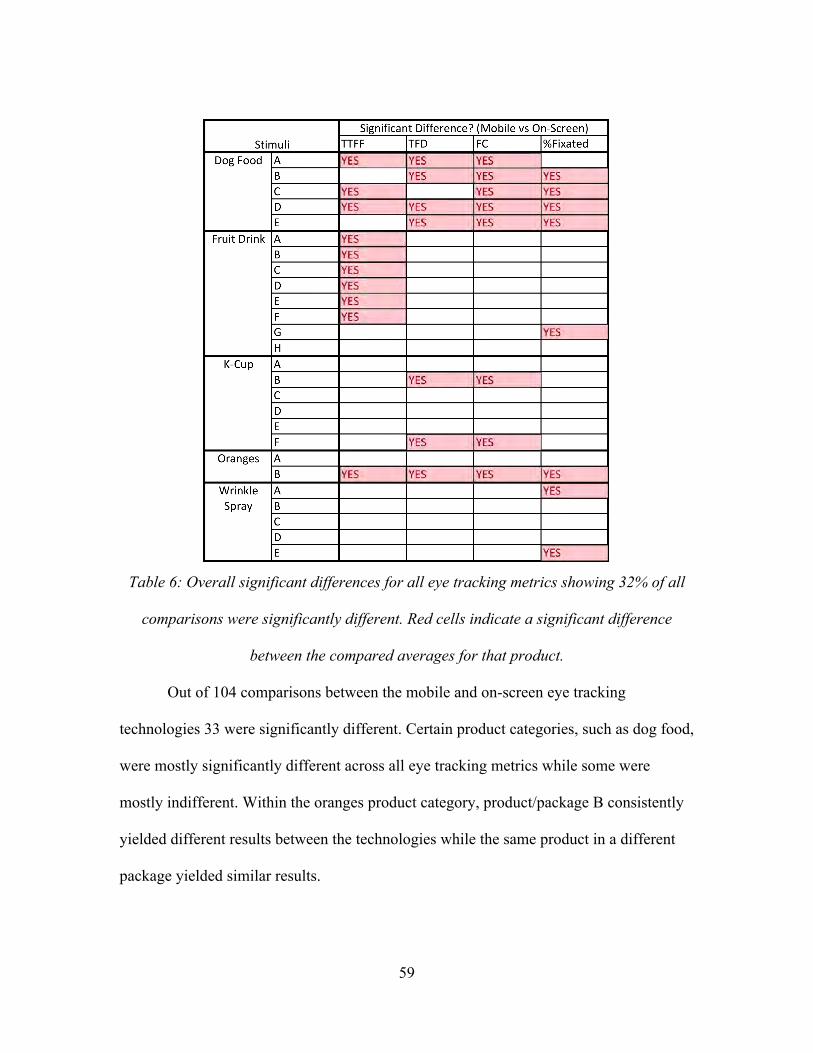
59
Table 6: Overall significant differences for all eye tracking metrics showing 32% of all
comparisons were significantly different. Red cells indicate a significant difference
between the compared averages for that product.
Out of 104 comparisons between the mobile and on-screen eye tracking
technologies 33 were significantly different. Certain product categories, such as dog food,
were mostly significantly different across all eye tracking metrics while some were
mostly indifferent. Within the oranges product category, product/package B consistently
yielded different results between the technologies while the same product in a different
package yielded similar results.

60
Qualitative Visualizations
Both the mobile and on-screen eye tracking technology allows the creation of
visual heatmaps and gaze plots that render the complex quantitative eye tracking data into
a visual qualitative representation for each stimulus. Heatmaps show the accumulated
fixation durations over different locations of the AOA. The color scheme used for this
experiment was green (fewer fixation durations) to red (higher fixation durations). Gaze
plots represent a single participants scan path, showing each fixation as a circle with the
circle size dependent of how long the fixation duration was. Due to the large number of
visualizations in this experiment, the gaze plot visualizations are located in Appendix C.
Even some software, such as 3M’s Visual Attention Service, can render heatmaps
without the use of gathered eye tracking data. This service utilizes different elements of
the digital photo, such as contrast, brightness and colors to predict where consumers will
look. The advantages of this type of digital attention service are much lower price and
speed in which stimuli can be studied. However the main disadvantage is that all stimuli
must be converted to a digital photo format, and this attention service is an estimate not
based of actual eye tracking data. These heatmaps are included in the results as another
method to track consumer attention in a retail environment, however will be not be
analyzed as rigorously as the Tobii Studio produced heatmaps. The full qualitative results
from the 3M software are located in Appendix D.
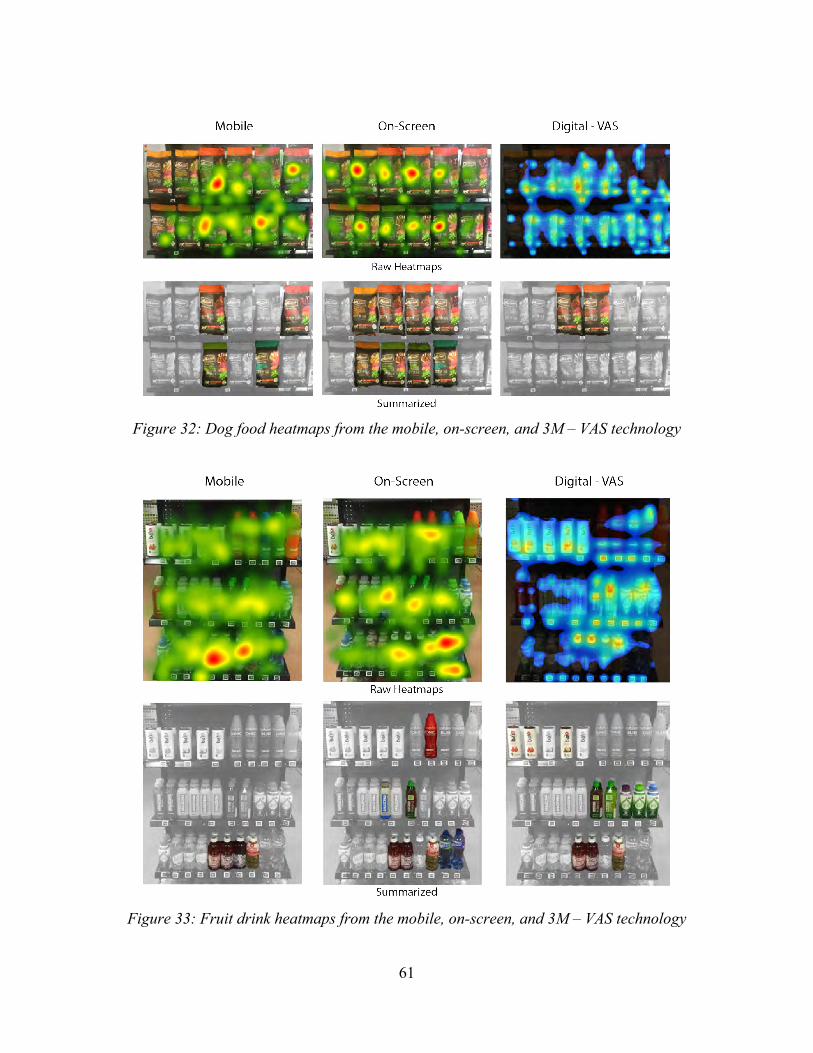
61
Figure 32: Dog food heatmaps from the mobile, on-screen, and 3M – VAS technology
Figure 33: Fruit drink heatmaps from the mobile, on-screen, and 3M – VAS technology
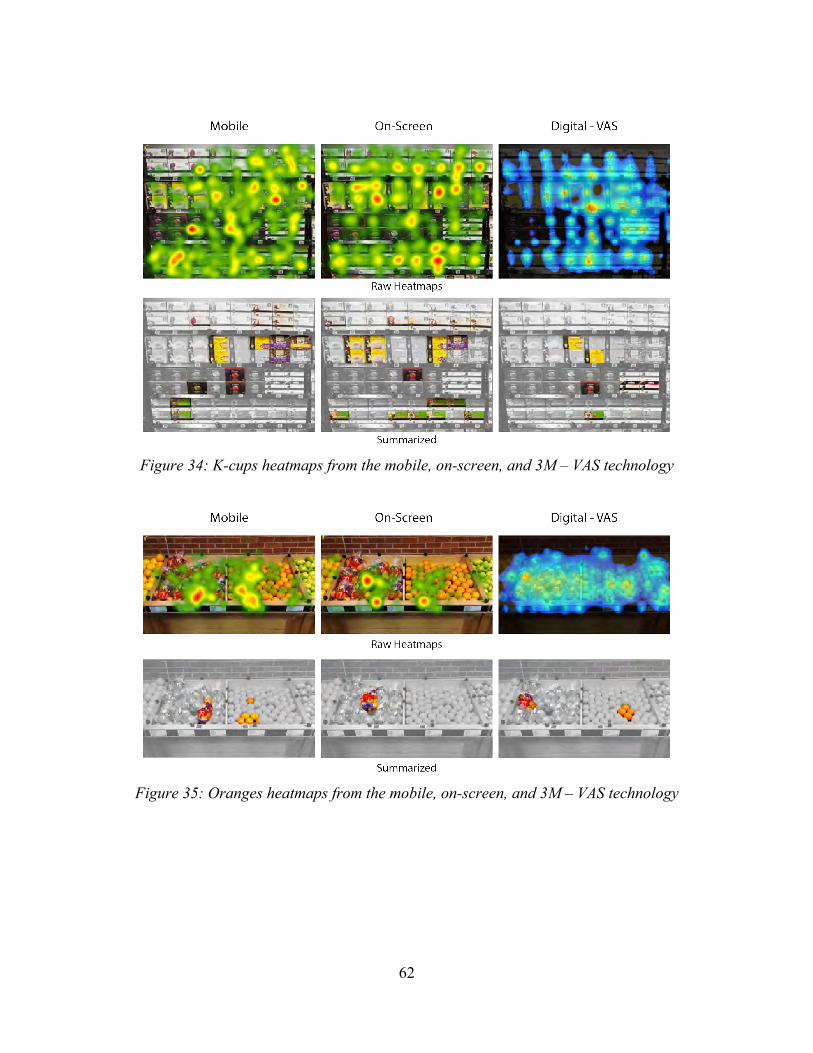
62
Figure 34: K-cups heatmaps from the mobile, on-screen, and 3M – VAS technology
Figure 35: Oranges heatmaps from the mobile, on-screen, and 3M – VAS technology
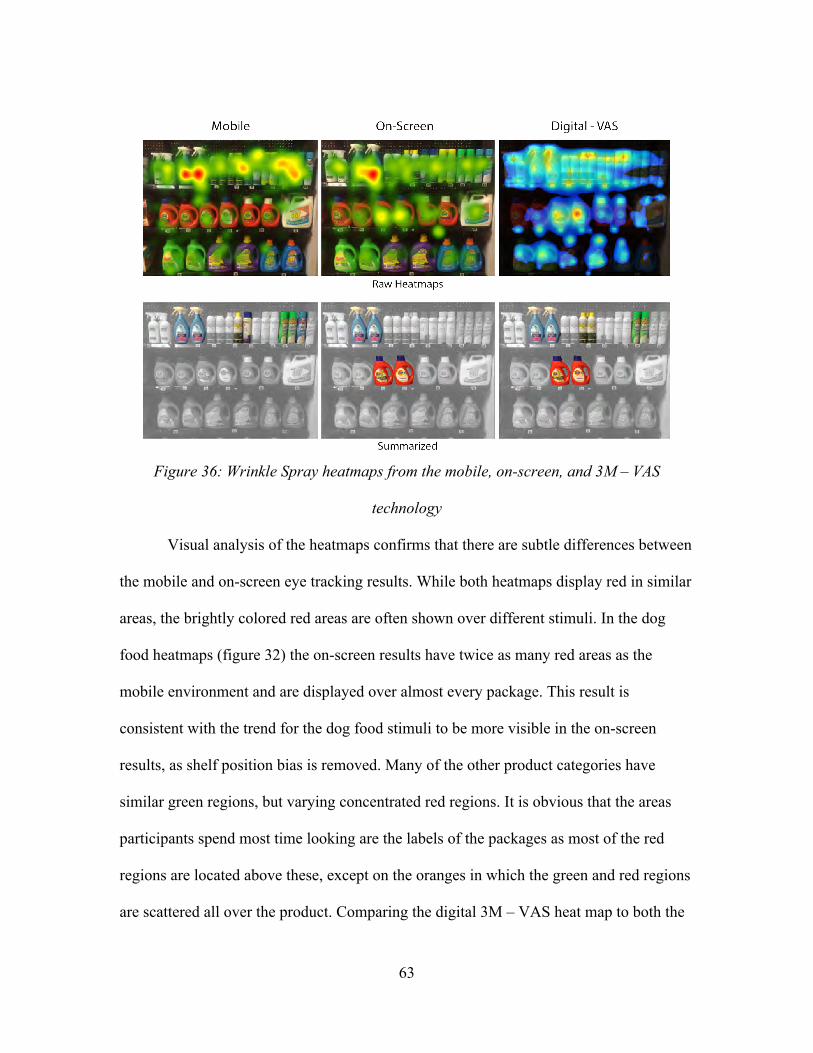
63
Figure 36: Wrinkle Spray heatmaps from the mobile, on-screen, and 3M – VAS
technology
Visual analysis of the heatmaps confirms that there are subtle differences between
the mobile and on-screen eye tracking results. While both heatmaps display red in similar
areas, the brightly colored red areas are often shown over different stimuli. In the dog
food heatmaps (figure 32) the on-screen results have twice as many red areas as the
mobile environment and are displayed over almost every package. This result is
consistent with the trend for the dog food stimuli to be more visible in the on-screen
results, as shelf position bias is removed. Many of the other product categories have
similar green regions, but varying concentrated red regions. It is obvious that the areas
participants spend most time looking are the labels of the packages as most of the red
regions are located above these, except on the oranges in which the green and red regions
are scattered all over the product. Comparing the digital 3M – VAS heat map to both the

64
mobile and on-screen heatmaps from the Tobii Studio software reveals few similar
trends. Where the Tobii heatmaps concentrate over text and labels, the 3M heatmaps have
red regions around high contrasting graphics (dog food and fruit drink), the 3-digit codes
for the purchase data (k-cup), and colorful lids (wrinkle spray).
65
CHAPTER FIVE
CONCLUSIONS
The goal of this experiment was to collect and analyze results from varying eye
tracking technologies within mobile and on-screen environments. These results were
compared to determine if the different technologies yielded consistent trends for the same
stimuli. Other variables were kept as similar as possible including: participant
demographics, participant instructions, stimuli, eye tracking technology brand, and
analytical software.
After104 total comparisons of mobile and on-screen eye tracking results, 33 were
found to be significantly different. While there were limited trends within the specific eye
tracking metrics, there was evidence of differences and trends within the product
categories. The dog food product category consistently experienced significant
differences among the mobile and on-screen averages of all eye tracking metrics. Product
B in the oranges product category displayed similar results with consistently significant
different averages between the mobile and on-screen technologies. These differences in
dog food and orange product categories could be attributed to the specific packages used
for these stimuli. The contrast, color, brightness or other visual elements could have had a
large impact on how these products and packages appeal to consumers, especially when
viewed in person or on a monitor. It is also possible that some product categories require
a more physical interaction to study the quality of the product. Produce shopping in
general typically involves lots of physical interaction, even if the product is already
prepackaged in a bag. The results from this experiment show that eye tracking technology

66
could yield different results about a package depending on which technology was
utilized. This experiment was specifically designed to determine if there were significant
differences in eye tracking results between different technologies when analyzing
packaging; not to determine a right or wrong eye tracking technology to use for
packaging related consumer research.
Limitations
There were several limitations that were encountered over the two years of
collecting data for this experiment. The Tobii X2-60 eye tracking technology used in the
gathering of the on-screen data records participants eye locations at 60 hertz, or 60 times
every second. The mobile eye tracker used, Tobii Glasses, only records the participants
eye location at the rate of 30 hertz, and only for the right eye. While this would not skew
the data, there would potentially be more fixations for the software to draw averages in
the on-screen eye tracking metrics. During the two year period of gathering the mobile
eye tracking data, the newer Tobii 2 Glasses became available which operates at 60 hertz
and samples both eyes. These glasses were experiencing difficulty being operated in the
consumer research laboratory (CUshopTM) and were not used in order to keep the mobile
data consistent over all the studies for this experiment.
Another limitation was the inability to use full shelf images as the on-screen eye
tracking stimuli. The full shelf image would not allow participants to see fine details in
the package on the smaller 24 inch monitor and were therefore cropped to make any
necessary details or text visible. To counter this limitation the transition videos were
67
created to depict the cropping and zooming in of the whole shelf image to the smaller
AOA image as the participant walking closer to the group of products in the specific
category. This smaller screen could have contributed to certain stimuli being noticed
more in the on-screen studies as all the stimuli on the 24 inch monitor are within the
participants peripheral vision. In the mobile studies on a full shelf the participant is
required to turn their head and physically search the shelf to see all the stimuli.
68
CHAPTER SIX
RECOMMENDATIONS
There are many possibilities for continuing and expanding research in eye
tracking consumer behavior research utilizing mobile and on-screen eye tracking
technology. Several adjustments could have been made during this experiment to allow
the on-screen studies to be more immersive and similar to the physical environment.
While the Tobii X2-60 is recommended for use on monitors less than 24 inches,
there is software and equipment that allows the technology to operate on a large
projection screen or TV. If the digital image was more similar to the 4 foot shelf size used
in the mobile eye tracking studies, the on-screen stimuli would potentially be more
immersive and comparable to the physical environment. Utilizing the new Tobii 2
Glasses would provide more accurate data to be compared to the X2-60 data. Lastly, a
wider range of different product categories could be used to further investigate the trends
of certain product categories performing better than others in this experiment.

69
APPENDICES
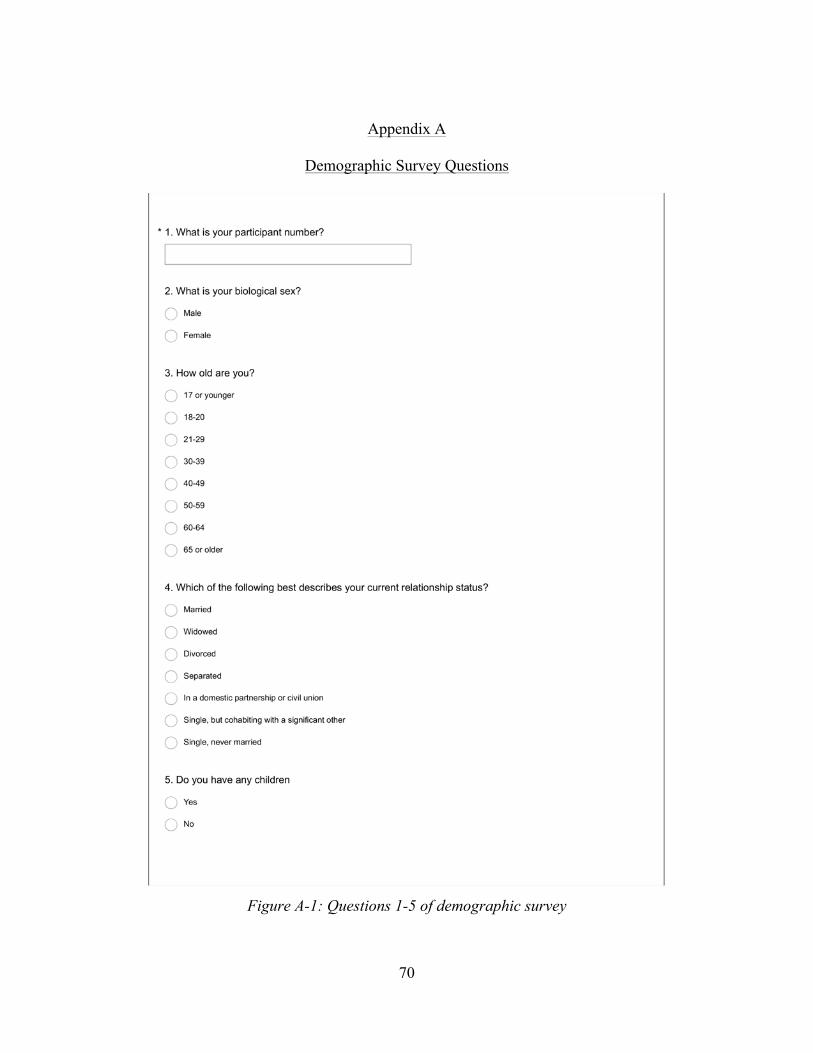
70
Appendix A
Demographic Survey Questions
Figure A-1: Questions 1-5 of demographic survey

71
Figure A-2: Questions 6-9 of demographic survey
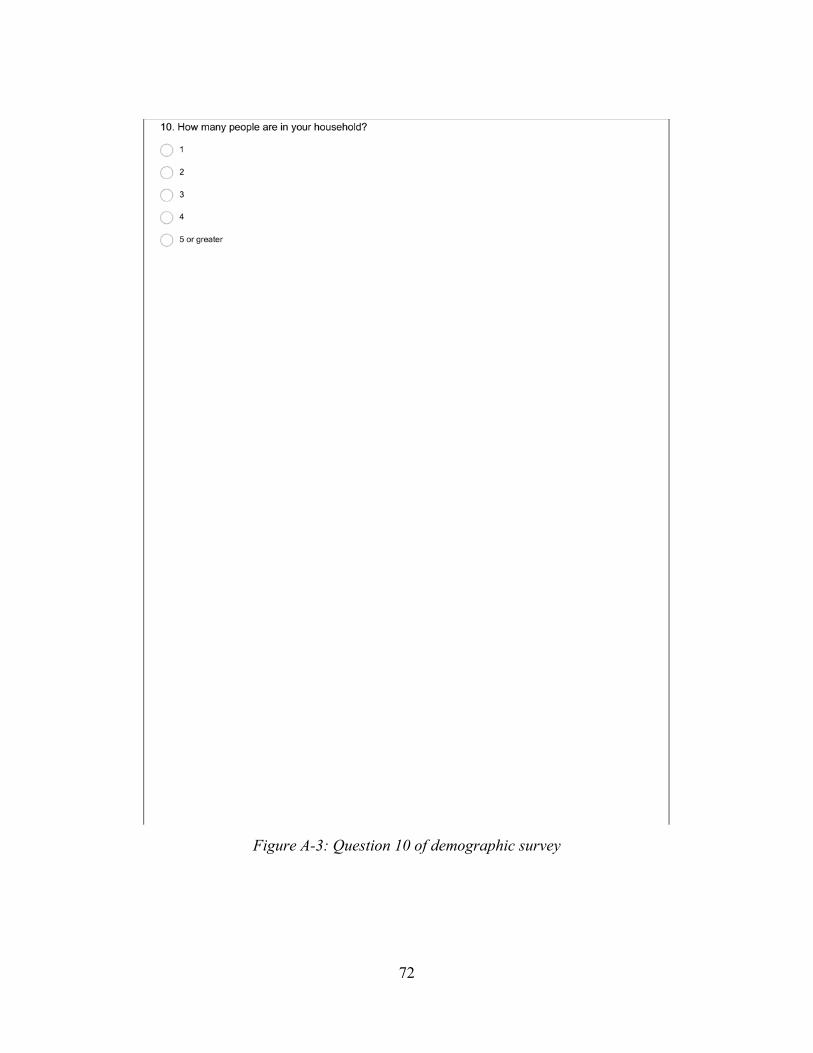
72
Figure A-3: Question 10 of demographic survey
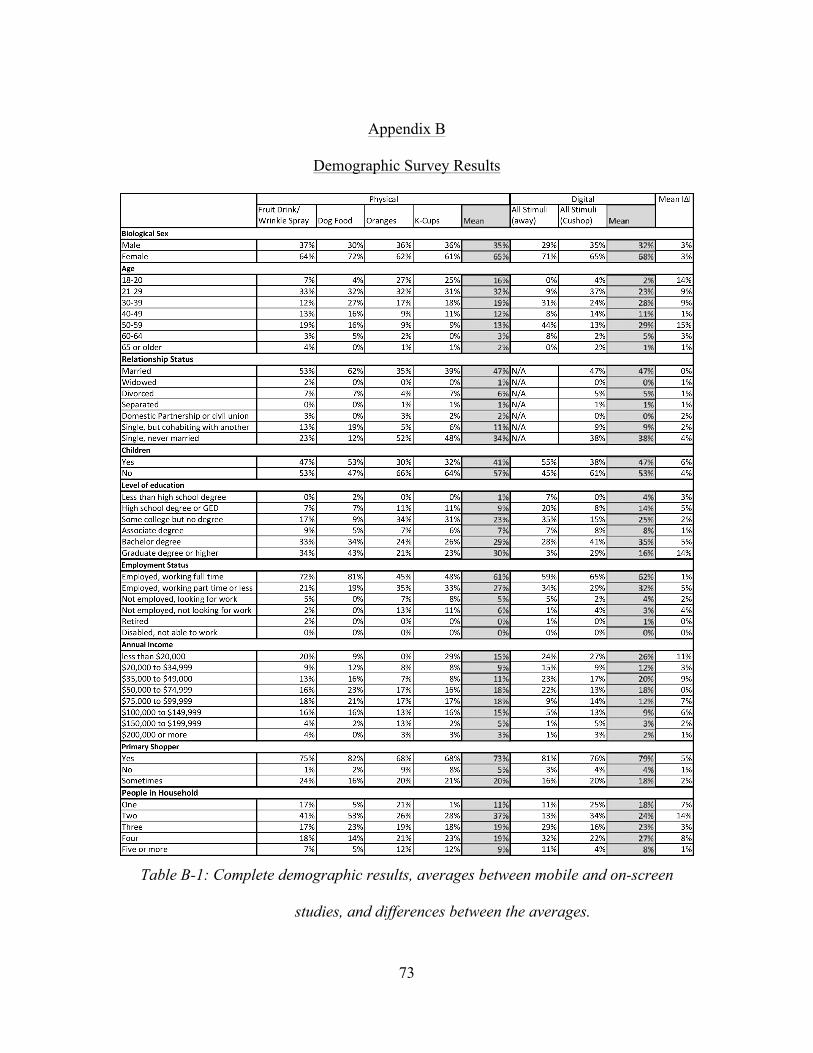
73
Appendix B
Demographic Survey Results
Table B-1: Complete demographic results, averages between mobile and on-screen
studies, and differences between the averages.
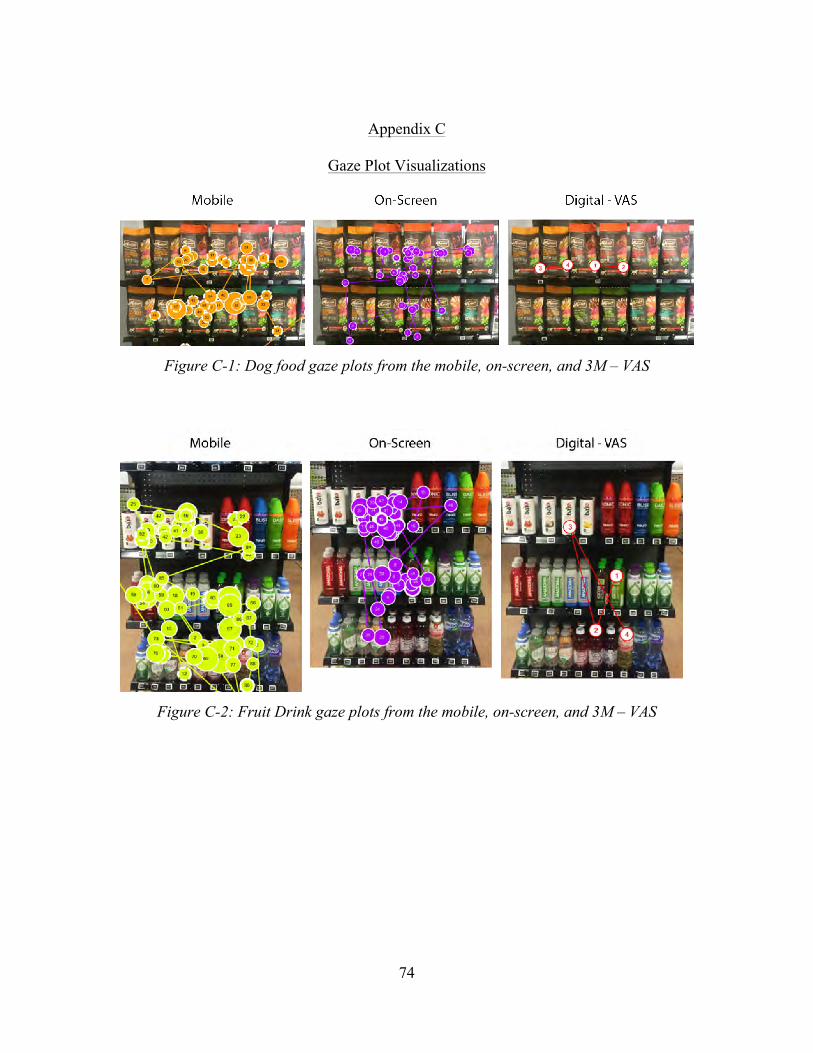
74
Appendix C
Gaze Plot Visualizations
Figure C-1: Dog food gaze plots from the mobile, on-screen, and 3M – VAS
Figure C-2: Fruit Drink gaze plots from the mobile, on-screen, and 3M – VAS
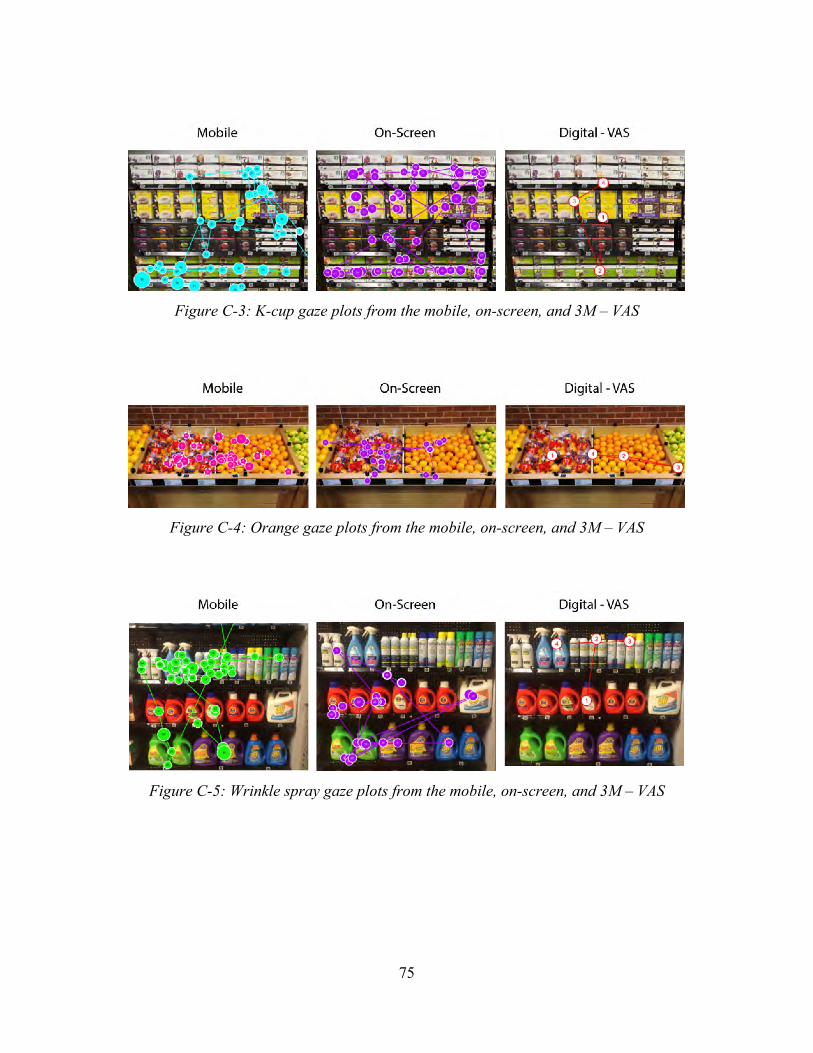
75
Figure C-3: K-cup gaze plots from the mobile, on-screen, and 3M – VAS
Figure C-4: Orange gaze plots from the mobile, on-screen, and 3M – VAS
Figure C-5: Wrinkle spray gaze plots from the mobile, on-screen, and 3M – VAS
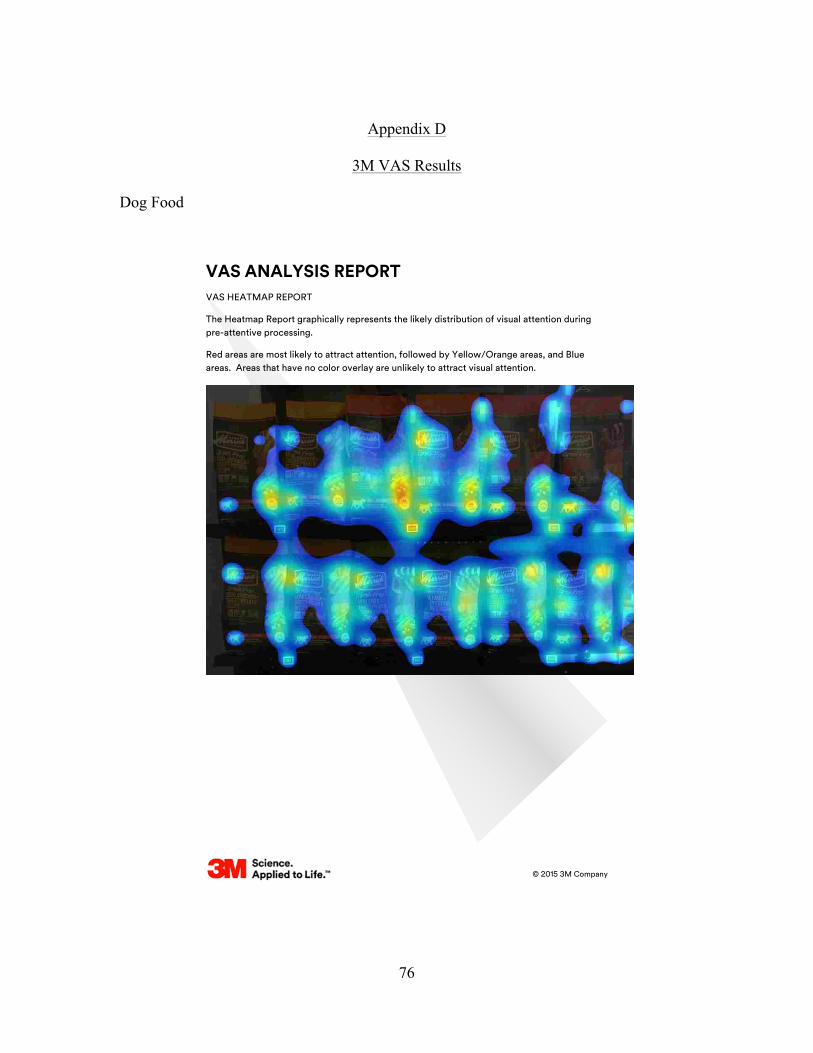
76
Appendix D
3M VAS Results
Dog Food
VAS ANALYSIS REPORT
© 2015 3M Company
VAS HEATMAP REPORT
The Heatmap Report graphically represents the likely distribution of visual attention during pre-attentive processing.
Red areas are most likely to attract attention, followed by Yellow/Orange areas, and Blue areas. Areas that have no color overlay are unlikely to attract visual attention.

77
VAS ANALYSIS REPORT
© 2015 3M Company
VAS REGIONS REPORT
The Regions Report graphically represents the likely distribution of visual attention during pre-attentive processing.
Scores Each region has a numeric score, predicting the probability a person will look somewhere within the region when they first glance at the image. The reported number is the highest score for any area/object within the region.
Outlines Each region and score box have a colored outline. Red outlines indicate the highest probability of attracting attention, followed by Yellow outlines, and finally Blue outlines.
Icons Icons for Intensity, Red/Green Contrast and Blue/Yellow Contrast may appear if those Visual Elements are strong contributors to the score. The model does not generate icons for Edges or Faces.

78
VAS ANALYSIS REPORT
© 2015 3M Company
VAS SEQUENCE REPORT
The Sequence Report indicates the first 4 most likely eye fixation points, in order.
Any area or object that is identified as one of the first 4 predicted fixations is highly likely to be noticed at first glance, regardless of its 1, 2, 3, or 4 order.
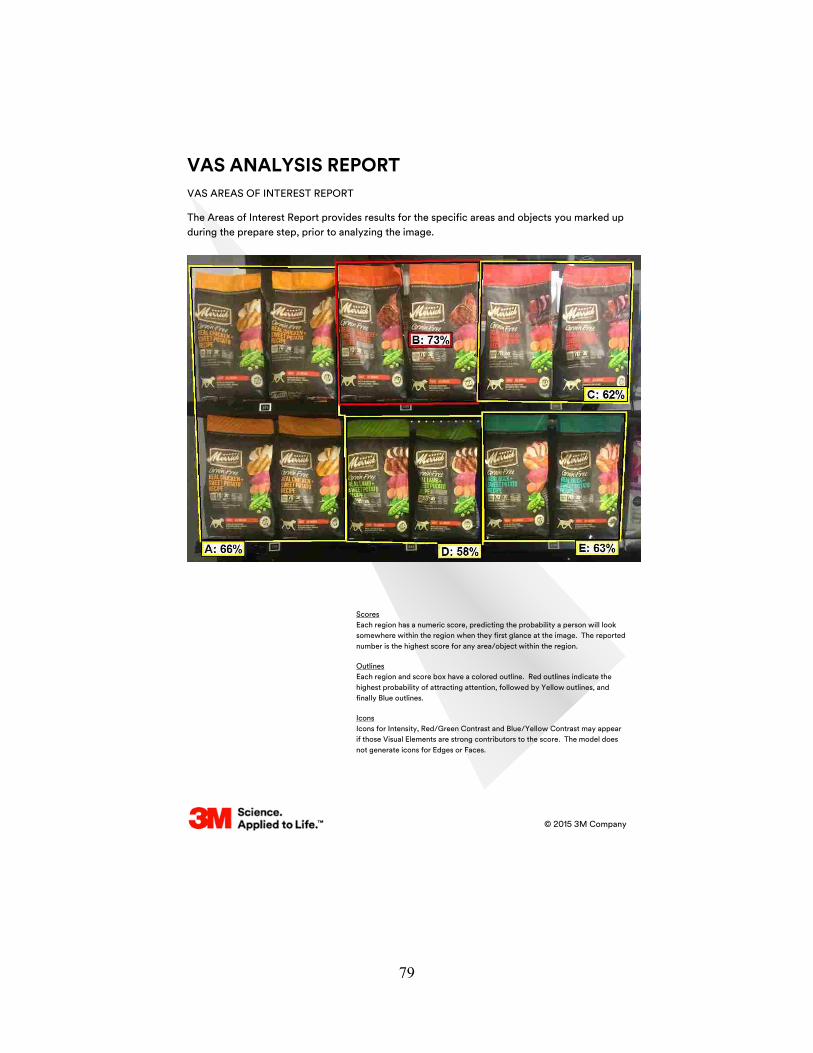
79
VAS ANALYSIS REPORT
© 2015 3M Company
VAS AREAS OF INTEREST REPORT
The Areas of Interest Report provides results for the specific areas and objects you marked up during the prepare step, prior to analyzing the image.
Scores Each region has a numeric score, predicting the probability a person will look somewhere within the region when they first glance at the image. The reported number is the highest score for any area/object within the region.
Outlines Each region and score box have a colored outline. Red outlines indicate the highest probability of attracting attention, followed by Yellow outlines, and finally Blue outlines.
Icons Icons for Intensity, Red/Green Contrast and Blue/Yellow Contrast may appear if those Visual Elements are strong contributors to the score. The model does not generate icons for Edges or Faces.

80
VAS ANALYSIS REPORT
© 2015 3M Company
VAS VISUAL ELEMENTS REPORT
VAS analysis identifies 5 visual elements science has proven attract human visual attention when we first glance at an image or scene, but before we’re aware of what we’re looking at.
x Edges x Intensity x Red-Green Color Contrast x Blue-Yellow Color Contrast x Faces
These elements act as markers, telling our vision system that important information might exist there, increasing the probability that our vision system will switch from pre-attentive processing to post-attentive, or conscious processing.
Overlays and Data Table
x Overlays correspond to your marked up Areas of Interest, labeled A, B, etc. in order of mark up. x Data Table shows visual element scores in columns A, B, etc. for each of your Areas of Interest.
Note: If your Visual Elements report does not contain Overlays or a Data Table, you did not mark up any Areas of Interest.
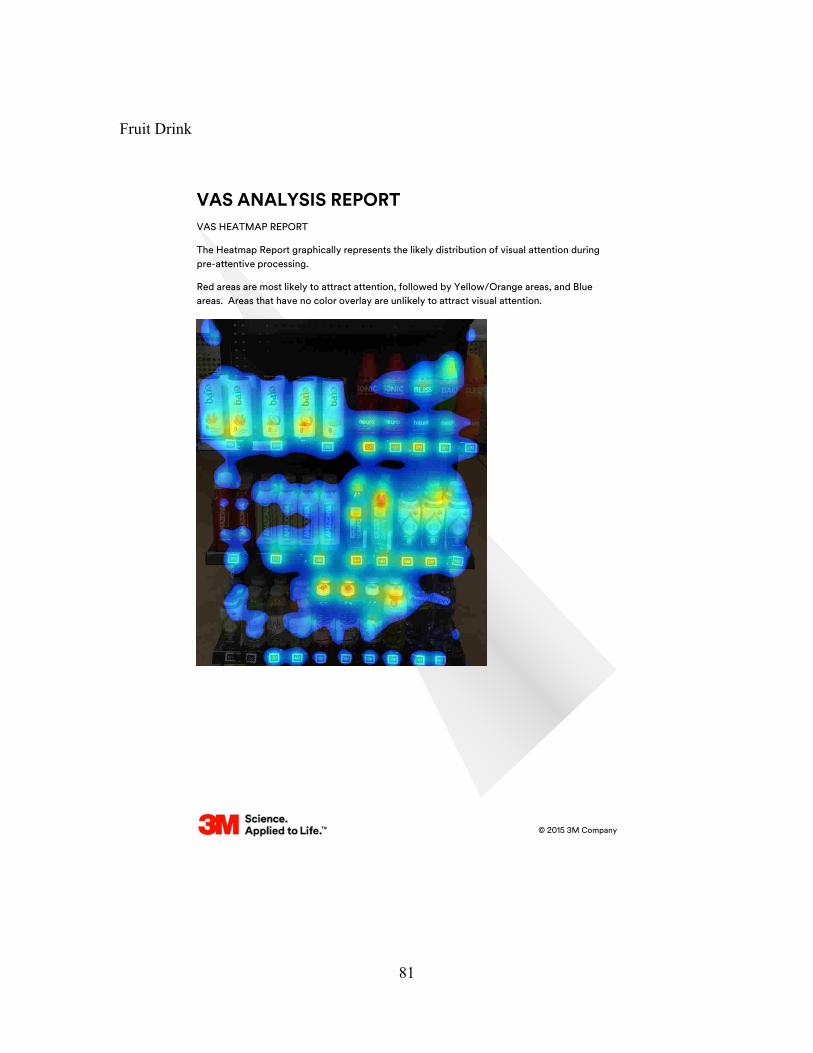
81
Fruit Drink
VAS ANALYSIS REPORT
© 2015 3M Company
VAS HEATMAP REPORT
The Heatmap Report graphically represents the likely distribution of visual attention during pre-attentive processing.
Red areas are most likely to attract attention, followed by Yellow/Orange areas, and Blue areas. Areas that have no color overlay are unlikely to attract visual attention.
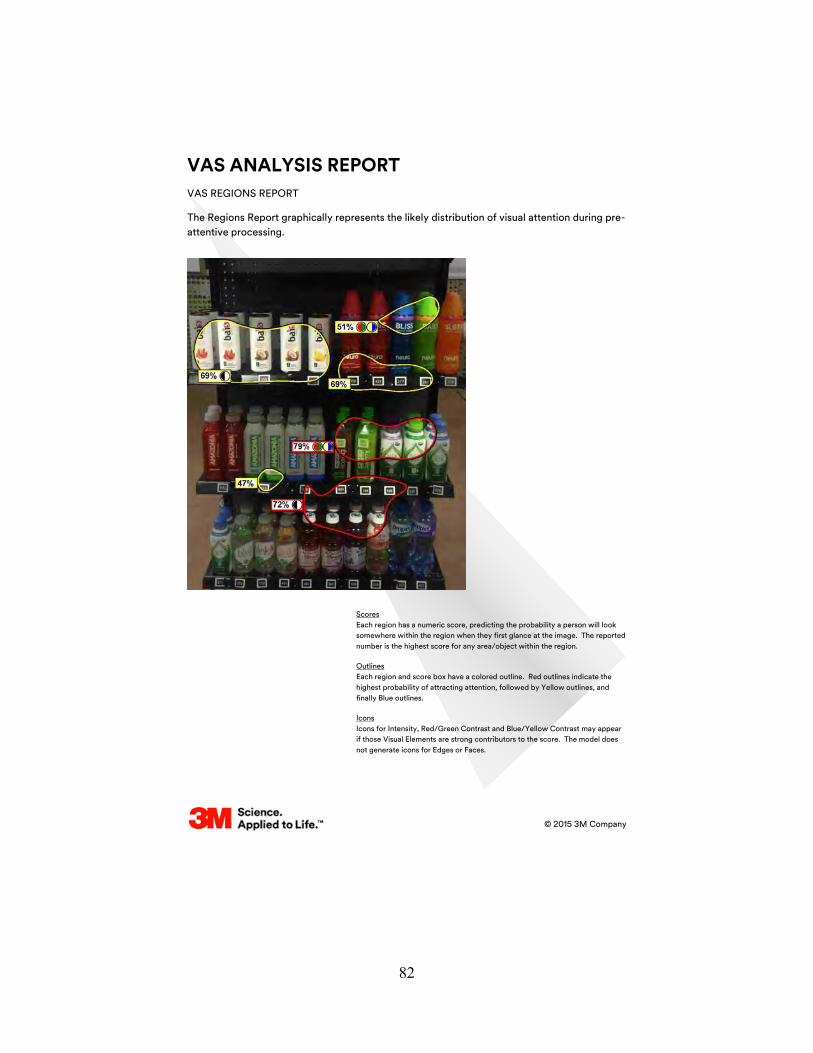
82
VAS ANALYSIS REPORT
© 2015 3M Company
VAS REGIONS REPORT
The Regions Report graphically represents the likely distribution of visual attention during pre-attentive processing.
Scores Each region has a numeric score, predicting the probability a person will look somewhere within the region when they first glance at the image. The reported number is the highest score for any area/object within the region.
Outlines Each region and score box have a colored outline. Red outlines indicate the highest probability of attracting attention, followed by Yellow outlines, and finally Blue outlines.
Icons Icons for Intensity, Red/Green Contrast and Blue/Yellow Contrast may appear if those Visual Elements are strong contributors to the score. The model does not generate icons for Edges or Faces.

83
VAS ANALYSIS REPORT
© 2015 3M Company
VAS SEQUENCE REPORT
The Sequence Report indicates the first 4 most likely eye fixation points, in order.
Any area or object that is identified as one of the first 4 predicted fixations is highly likely to be noticed at first glance, regardless of its 1, 2, 3, or 4 order.
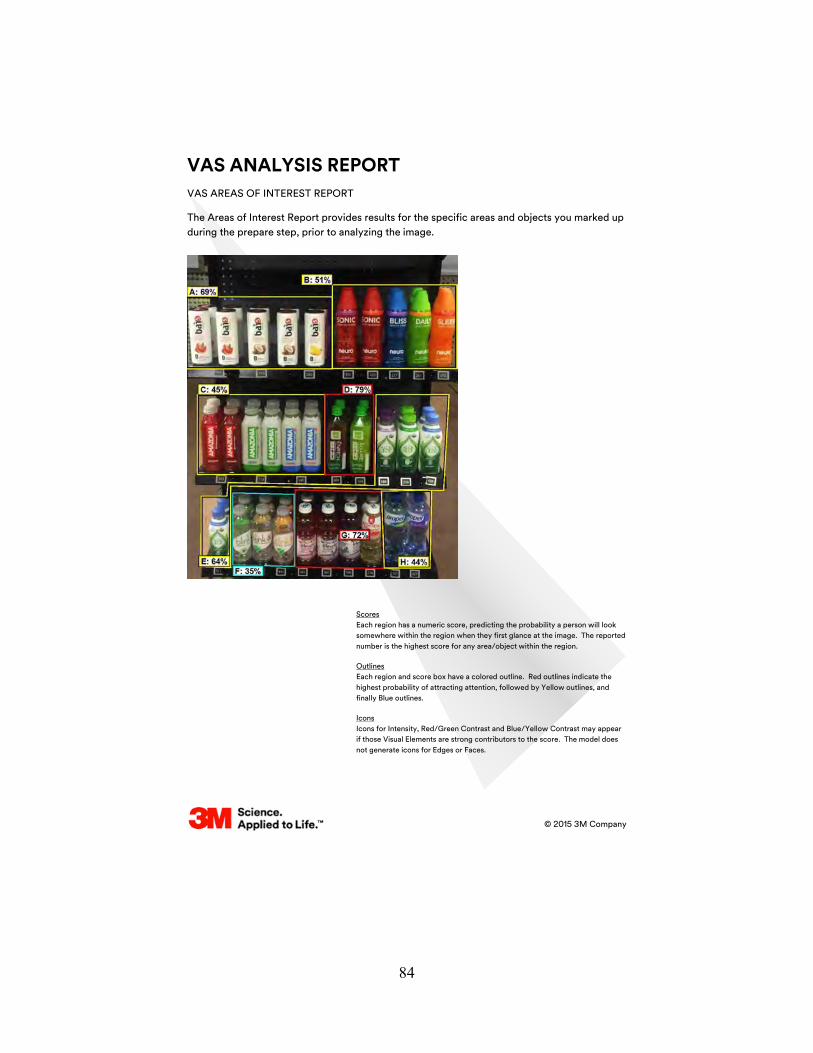
84
VAS ANALYSIS REPORT
© 2015 3M Company
VAS AREAS OF INTEREST REPORT
The Areas of Interest Report provides results for the specific areas and objects you marked up during the prepare step, prior to analyzing the image.
Scores Each region has a numeric score, predicting the probability a person will look somewhere within the region when they first glance at the image. The reported number is the highest score for any area/object within the region.
Outlines Each region and score box have a colored outline. Red outlines indicate the highest probability of attracting attention, followed by Yellow outlines, and finally Blue outlines.
Icons Icons for Intensity, Red/Green Contrast and Blue/Yellow Contrast may appear if those Visual Elements are strong contributors to the score. The model does not generate icons for Edges or Faces.

85
VAS ANALYSIS REPORT
© 2015 3M Company
VAS VISUAL ELEMENTS REPORT
VAS analysis identifies 5 visual elements science has proven attract human visual attention when we first glance at an image or scene, but before we’re aware of what we’re looking at.
x Edges x Intensity x Red-Green Color Contrast x Blue-Yellow Color Contrast x Faces
These elements act as markers, telling our vision system that important information might exist there, increasing the probability that our vision system will switch from pre-attentive processing to post-attentive, or conscious processing.
Overlays and Data Table
x Overlays correspond to your marked up Areas of Interest, labeled A, B, etc. in order of mark up. x Data Table shows visual element scores in columns A, B, etc. for each of your Areas of Interest.
Note: If your Visual Elements report does not contain Overlays or a Data Table, you did not mark up any Areas of Interest.
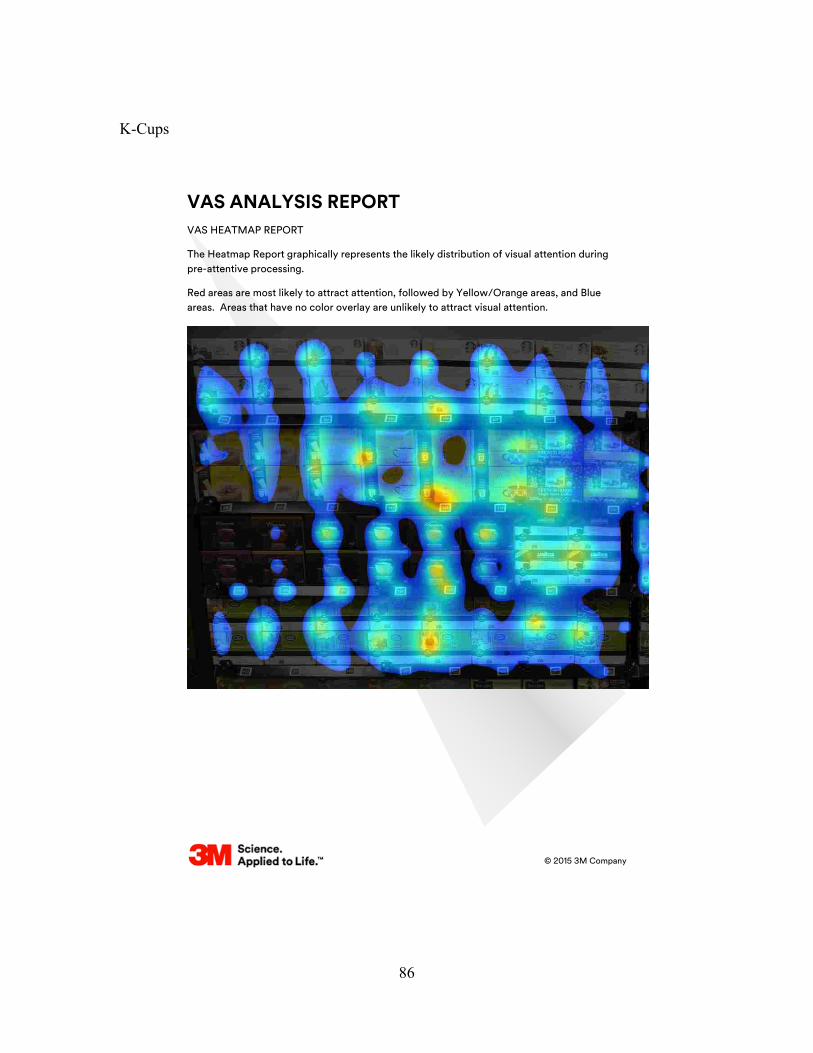
86
K-Cups
VAS ANALYSIS REPORT
© 2015 3M Company
VAS HEATMAP REPORT
The Heatmap Report graphically represents the likely distribution of visual attention during pre-attentive processing.
Red areas are most likely to attract attention, followed by Yellow/Orange areas, and Blue areas. Areas that have no color overlay are unlikely to attract visual attention.
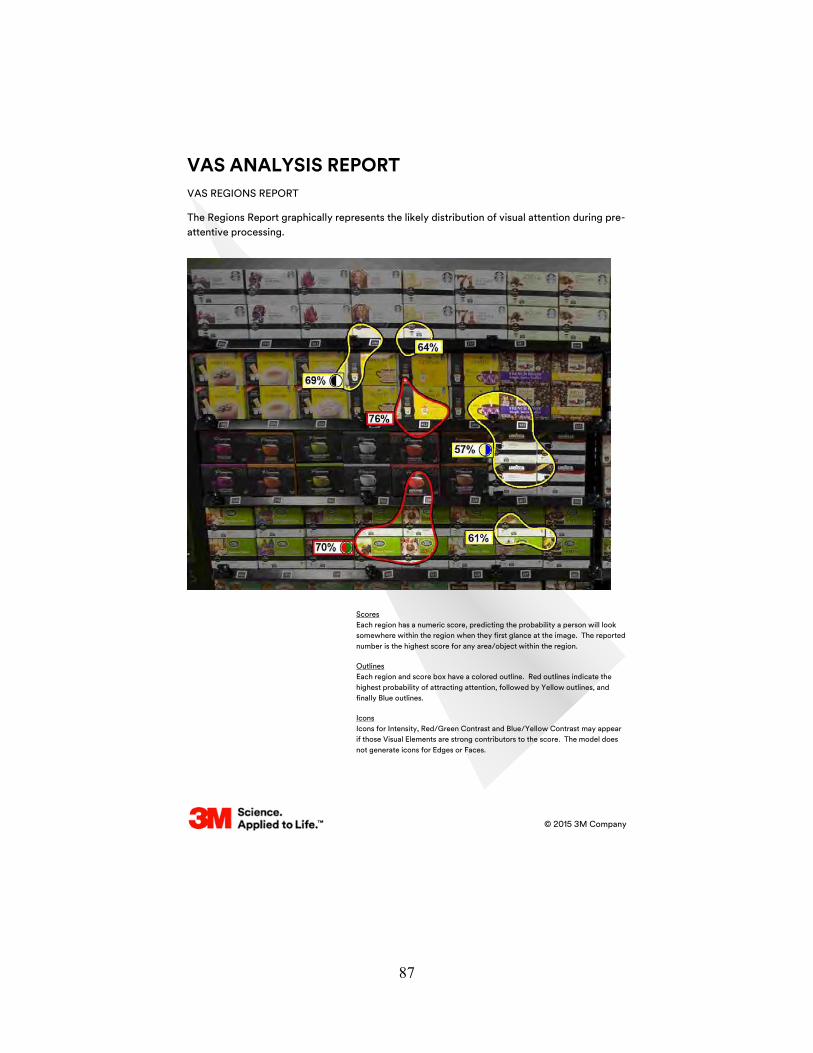
87
VAS ANALYSIS REPORT
© 2015 3M Company
VAS REGIONS REPORT
The Regions Report graphically represents the likely distribution of visual attention during pre-attentive processing.
Scores Each region has a numeric score, predicting the probability a person will look somewhere within the region when they first glance at the image. The reported number is the highest score for any area/object within the region.
Outlines Each region and score box have a colored outline. Red outlines indicate the highest probability of attracting attention, followed by Yellow outlines, and finally Blue outlines.
Icons Icons for Intensity, Red/Green Contrast and Blue/Yellow Contrast may appear if those Visual Elements are strong contributors to the score. The model does not generate icons for Edges or Faces.

88
VAS ANALYSIS REPORT
© 2015 3M Company
VAS SEQUENCE REPORT
The Sequence Report indicates the first 4 most likely eye fixation points, in order.
Any area or object that is identified as one of the first 4 predicted fixations is highly likely to be noticed at first glance, regardless of its 1, 2, 3, or 4 order.
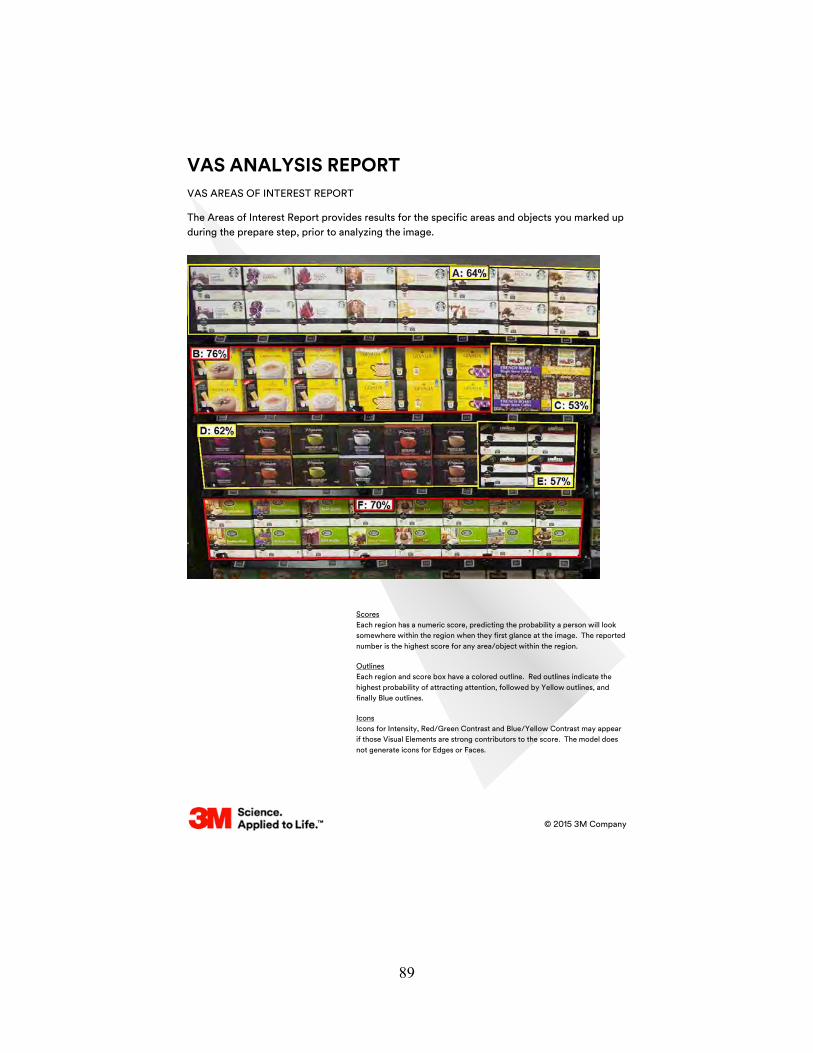
89
VAS ANALYSIS REPORT
© 2015 3M Company
VAS AREAS OF INTEREST REPORT
The Areas of Interest Report provides results for the specific areas and objects you marked up during the prepare step, prior to analyzing the image.
Scores Each region has a numeric score, predicting the probability a person will look somewhere within the region when they first glance at the image. The reported number is the highest score for any area/object within the region.
Outlines Each region and score box have a colored outline. Red outlines indicate the highest probability of attracting attention, followed by Yellow outlines, and finally Blue outlines.
Icons Icons for Intensity, Red/Green Contrast and Blue/Yellow Contrast may appear if those Visual Elements are strong contributors to the score. The model does not generate icons for Edges or Faces.
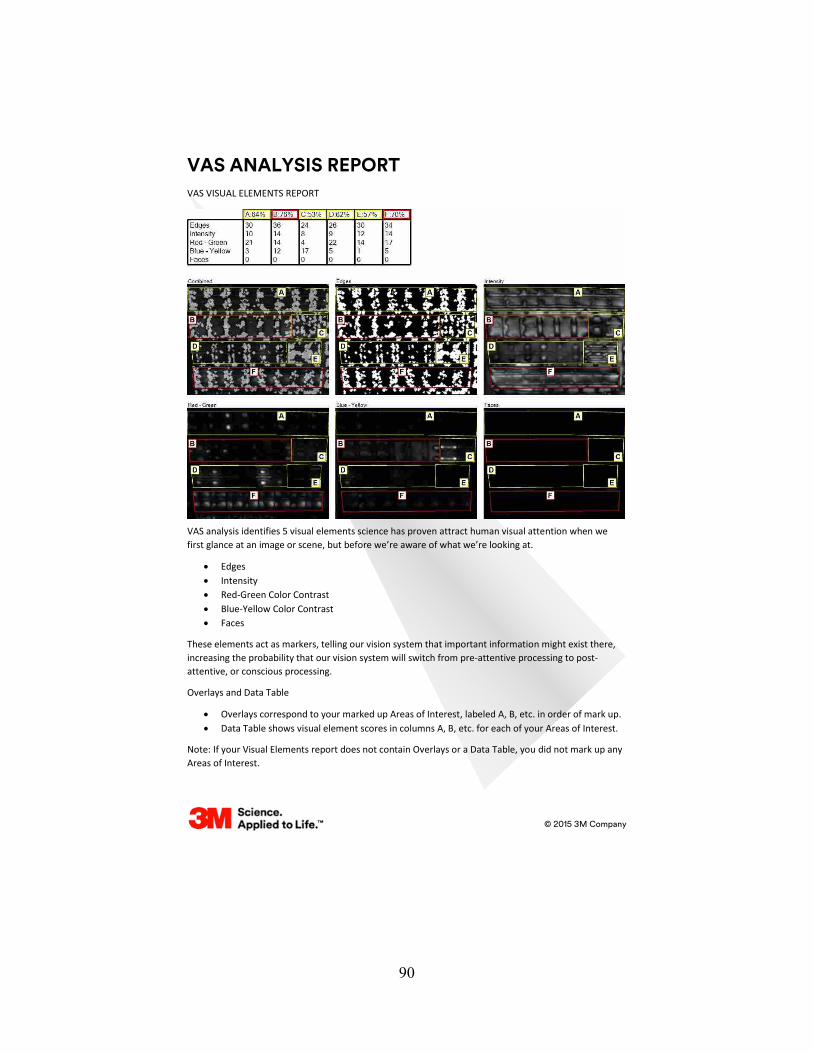
90
VAS ANALYSIS REPORT
© 2015 3M Company
VAS VISUAL ELEMENTS REPORT
VAS analysis identifies 5 visual elements science has proven attract human visual attention when we first glance at an image or scene, but before we’re aware of what we’re looking at.
x Edges x Intensity x Red-Green Color Contrast x Blue-Yellow Color Contrast x Faces
These elements act as markers, telling our vision system that important information might exist there, increasing the probability that our vision system will switch from pre-attentive processing to post-attentive, or conscious processing.
Overlays and Data Table
x Overlays correspond to your marked up Areas of Interest, labeled A, B, etc. in order of mark up. x Data Table shows visual element scores in columns A, B, etc. for each of your Areas of Interest.
Note: If your Visual Elements report does not contain Overlays or a Data Table, you did not mark up any Areas of Interest.
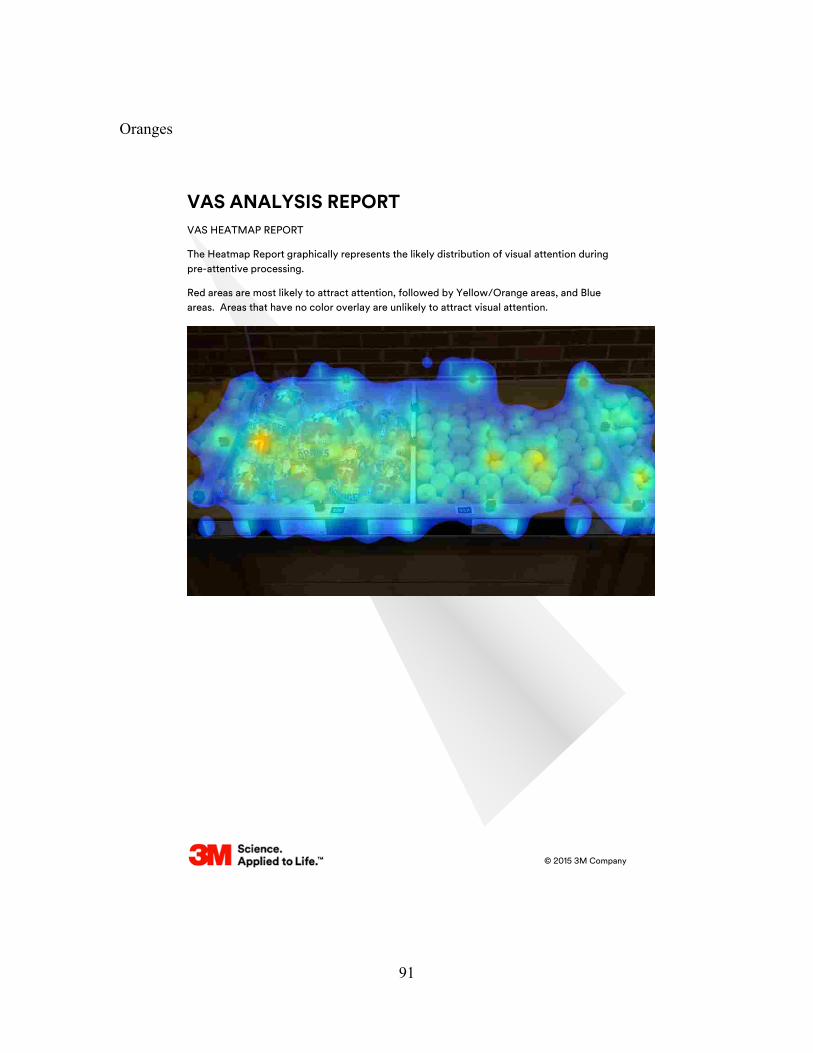
91
Oranges
VAS ANALYSIS REPORT
© 2015 3M Company
VAS HEATMAP REPORT
The Heatmap Report graphically represents the likely distribution of visual attention during pre-attentive processing.
Red areas are most likely to attract attention, followed by Yellow/Orange areas, and Blue areas. Areas that have no color overlay are unlikely to attract visual attention.
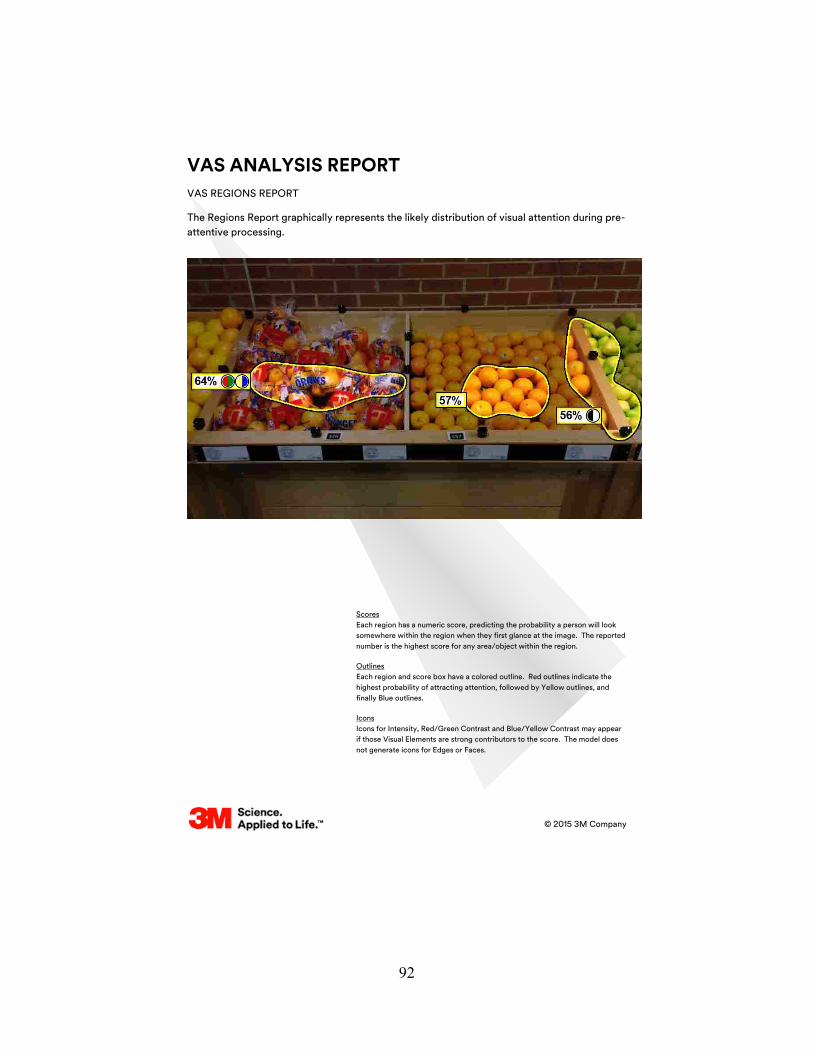
92
VAS ANALYSIS REPORT
© 2015 3M Company
VAS REGIONS REPORT
The Regions Report graphically represents the likely distribution of visual attention during pre-attentive processing.
Scores Each region has a numeric score, predicting the probability a person will look somewhere within the region when they first glance at the image. The reported number is the highest score for any area/object within the region.
Outlines Each region and score box have a colored outline. Red outlines indicate the highest probability of attracting attention, followed by Yellow outlines, and finally Blue outlines.
Icons Icons for Intensity, Red/Green Contrast and Blue/Yellow Contrast may appear if those Visual Elements are strong contributors to the score. The model does not generate icons for Edges or Faces.
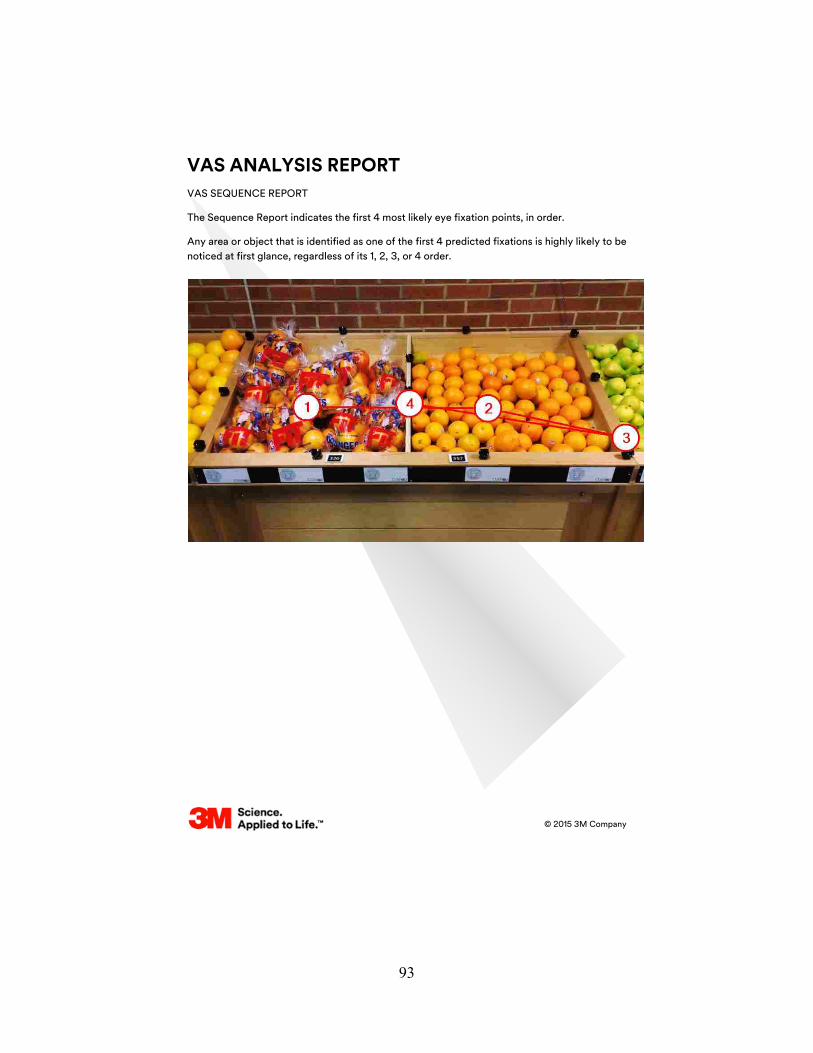
93
VAS ANALYSIS REPORT
© 2015 3M Company
VAS SEQUENCE REPORT
The Sequence Report indicates the first 4 most likely eye fixation points, in order.
Any area or object that is identified as one of the first 4 predicted fixations is highly likely to be noticed at first glance, regardless of its 1, 2, 3, or 4 order.
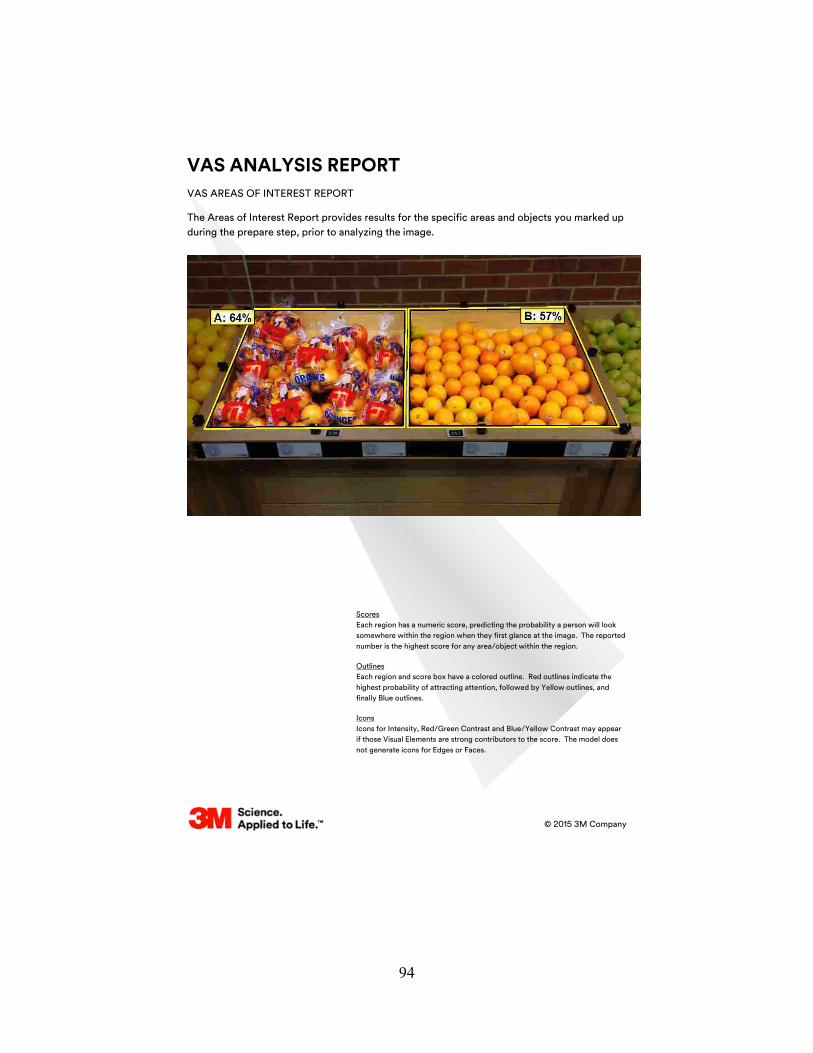
94
VAS ANALYSIS REPORT
© 2015 3M Company
VAS AREAS OF INTEREST REPORT
The Areas of Interest Report provides results for the specific areas and objects you marked up during the prepare step, prior to analyzing the image.
Scores Each region has a numeric score, predicting the probability a person will look somewhere within the region when they first glance at the image. The reported number is the highest score for any area/object within the region.
Outlines Each region and score box have a colored outline. Red outlines indicate the highest probability of attracting attention, followed by Yellow outlines, and finally Blue outlines.
Icons Icons for Intensity, Red/Green Contrast and Blue/Yellow Contrast may appear if those Visual Elements are strong contributors to the score. The model does not generate icons for Edges or Faces.
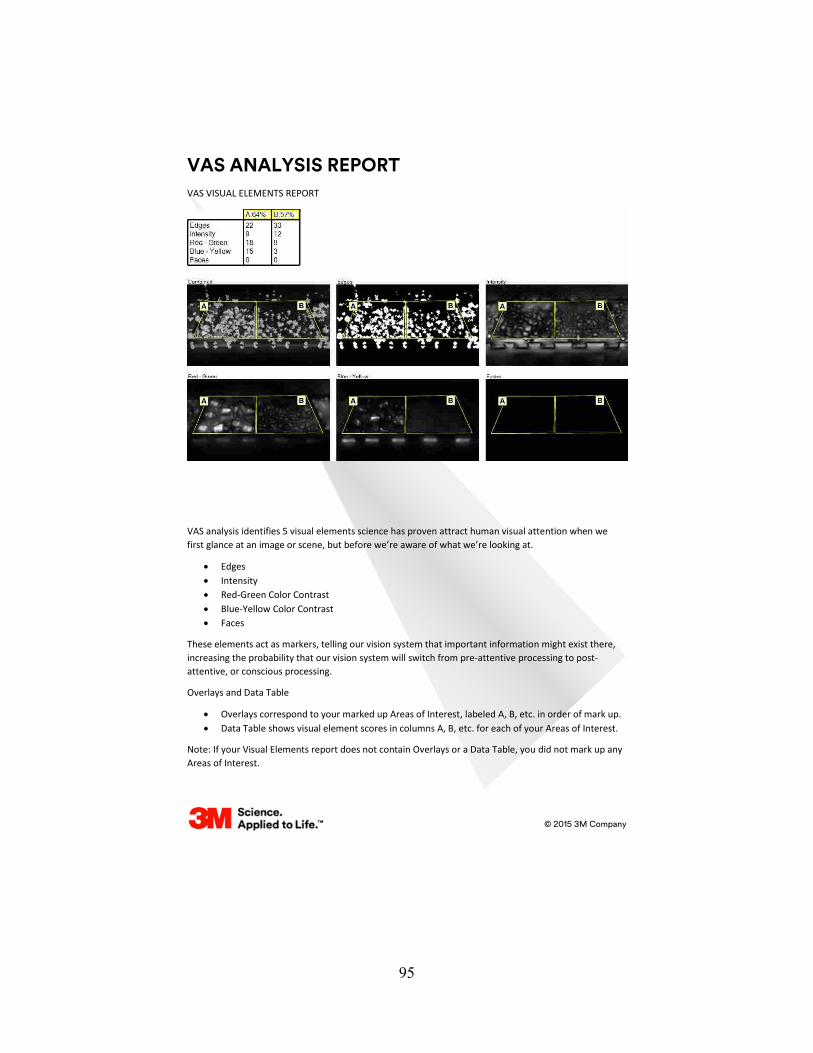
95
VAS ANALYSIS REPORT
© 2015 3M Company
VAS VISUAL ELEMENTS REPORT
VAS analysis identifies 5 visual elements science has proven attract human visual attention when we first glance at an image or scene, but before we’re aware of what we’re looking at.
x Edges x Intensity x Red-Green Color Contrast x Blue-Yellow Color Contrast x Faces
These elements act as markers, telling our vision system that important information might exist there, increasing the probability that our vision system will switch from pre-attentive processing to post-attentive, or conscious processing.
Overlays and Data Table
x Overlays correspond to your marked up Areas of Interest, labeled A, B, etc. in order of mark up. x Data Table shows visual element scores in columns A, B, etc. for each of your Areas of Interest.
Note: If your Visual Elements report does not contain Overlays or a Data Table, you did not mark up any Areas of Interest.
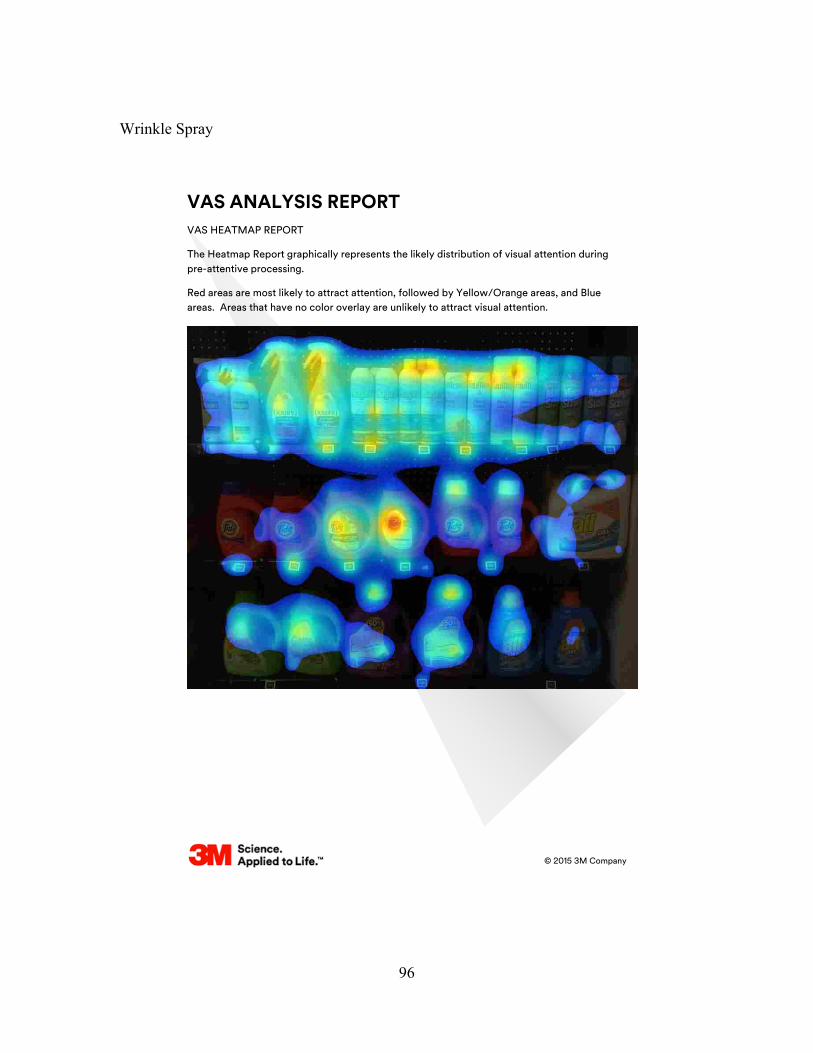
96
Wrinkle Spray
VAS ANALYSIS REPORT
© 2015 3M Company
VAS HEATMAP REPORT
The Heatmap Report graphically represents the likely distribution of visual attention during pre-attentive processing.
Red areas are most likely to attract attention, followed by Yellow/Orange areas, and Blue areas. Areas that have no color overlay are unlikely to attract visual attention.
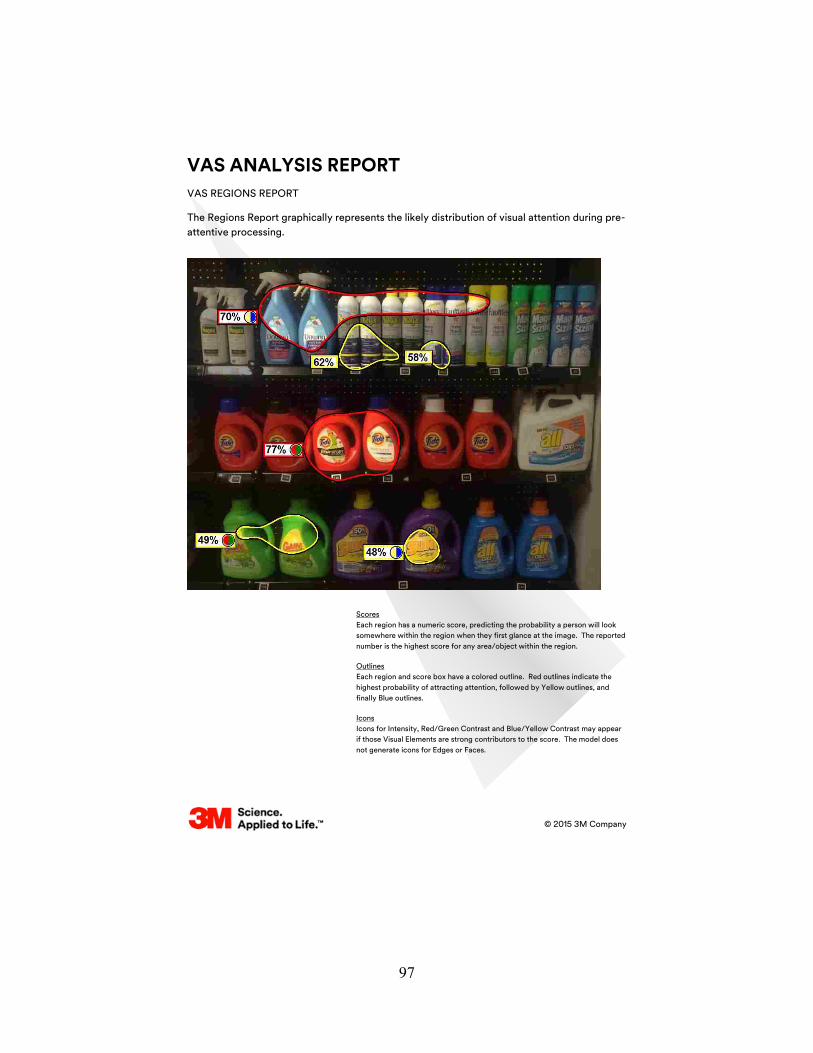
97
VAS ANALYSIS REPORT
© 2015 3M Company
VAS REGIONS REPORT
The Regions Report graphically represents the likely distribution of visual attention during pre-attentive processing.
Scores Each region has a numeric score, predicting the probability a person will look somewhere within the region when they first glance at the image. The reported number is the highest score for any area/object within the region.
Outlines Each region and score box have a colored outline. Red outlines indicate the highest probability of attracting attention, followed by Yellow outlines, and finally Blue outlines.
Icons Icons for Intensity, Red/Green Contrast and Blue/Yellow Contrast may appear if those Visual Elements are strong contributors to the score. The model does not generate icons for Edges or Faces.
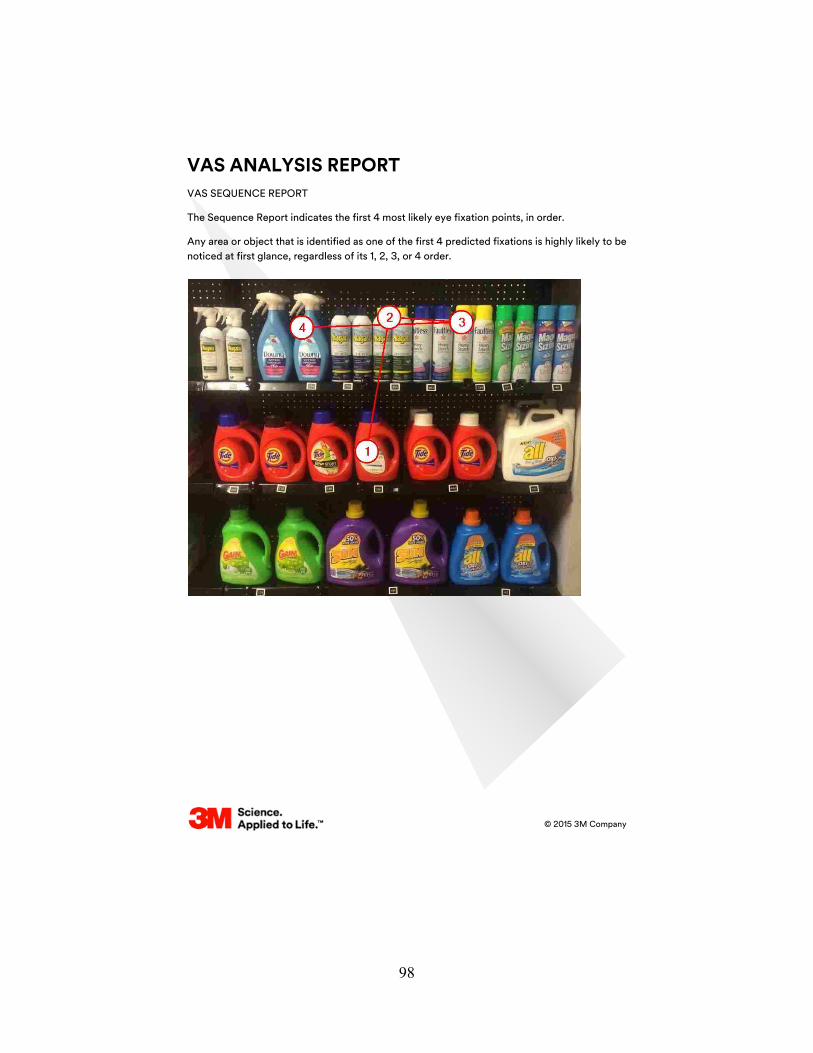
98
VAS ANALYSIS REPORT
© 2015 3M Company
VAS SEQUENCE REPORT
The Sequence Report indicates the first 4 most likely eye fixation points, in order.
Any area or object that is identified as one of the first 4 predicted fixations is highly likely to be noticed at first glance, regardless of its 1, 2, 3, or 4 order.

99
VAS ANALYSIS REPORT
© 2015 3M Company
VAS AREAS OF INTEREST REPORT
The Areas of Interest Report provides results for the specific areas and objects you marked up during the prepare step, prior to analyzing the image.
Scores Each region has a numeric score, predicting the probability a person will look somewhere within the region when they first glance at the image. The reported number is the highest score for any area/object within the region.
Outlines Each region and score box have a colored outline. Red outlines indicate the highest probability of attracting attention, followed by Yellow outlines, and finally Blue outlines.
Icons Icons for Intensity, Red/Green Contrast and Blue/Yellow Contrast may appear if those Visual Elements are strong contributors to the score. The model does not generate icons for Edges or Faces.

100
VAS ANALYSIS REPORT
© 2015 3M Company
VAS VISUAL ELEMENTS REPORT
VAS analysis identifies 5 visual elements science has proven attract human visual attention when we first glance at an image or scene, but before we’re aware of what we’re looking at.
x Edges x Intensity x Red-Green Color Contrast x Blue-Yellow Color Contrast x Faces
These elements act as markers, telling our vision system that important information might exist there, increasing the probability that our vision system will switch from pre-attentive processing to post-attentive, or conscious processing.
Overlays and Data Table
x Overlays correspond to your marked up Areas of Interest, labeled A, B, etc. in order of mark up. x Data Table shows visual element scores in columns A, B, etc. for each of your Areas of Interest.
Note: If your Visual Elements report does not contain Overlays or a Data Table, you did not mark up any Areas of Interest.

101
102
REFERENCES
Ampuero, O., & Vila, N. (2006). Consumer perceptions of product packaging. Journal of Consumer Marketing, 23(2), 100–112. doi:10.1108/07363760610655032
Bettman, J., Johnson, E., & Payne, J. (1991). Consumer Decision Making. Handbook of Consumer Behavior, 50–79. Retrieved from http://www.haas.berkeley.edu/Courses/Spring2000/BA269D/BettmanJohnsonPayne91.pdf
Bix, L., & Lockhart, H. E. (1991). Packaging design and development, 859–866.
Bix, L., Seo, W., & Sundar, R. P. (2013). PAPER PRESENTED AT IAPRI WORLD CONFERENCE 2012 The Effect of Colour Contrast on Consumers ’ Attentive Behaviours and Perception of Fresh Produce †. Packaging Technology and Science, 26(June 2012), 96–104. doi:10.1002/pts
Clement, J. (2007). Visual influence on in-store buying decisions: an eye-track experiment on the visual influence of packaging design. Journal of Marketing Management, 23(9-10), 917–928. doi:10.1362/026725707X250395
Duchowski, A. (2007). Eye tracking methodology: Theory and practice. Springer- Verlag New York Inc.
Fischer, J. (2012). Determining the Proper Point Size For Display Type on Packaging.
Galvarino, J. (2012). Product Display Versus Graphical Representation on Packaging, (December). Retrieved from http://search.proquest.com.libproxy.clemson.edu/pqdtft/docview/1285518945/14320F9853837E40C95/1?accountid=6167
George, J. (2005). On paper, a world of oppertunity. Packaging World Magazine, April, 36.
Gomes, T. (2012). The Effect of Full Body Versus Partial Body Graphic Labeling on Beverage Packaging, (May).
Hurley, R. A. (2011). Persuasive Packaging: An Eye-Tracking Approach to Design.
103
Hutcherson, D. (2013). Measuring Arousal Through Physiological Responses to Packaging Designs: Investigating the Validity of Electrodermal Activity as a Measure of Arousal in a Realistic Shopping Environment, (May). Retrieved from http://search.proquest.com.libproxy.clemson.edu/pqdtft/docview/1411308073/1432267871745365BF3/2?accountid=6167
Lockhart, H. E. (1997). A Paradigm for Packaging. Packaging Technology and Science, 10(October 1996), 237–252. Retrieved from http://onlinelibrary.wiley.com.libproxy.clemson.edu/store/10.1002/(SICI)1099-1522(199709/10)10:5%3C237::AID-PTS395%3E3.0.CO;2-%23/asset/395_ftp.pdf?v=1&t=hr1kkhp9&s=d2607bee306e0ec43b4d88212543b05694d19767
Perception. (2014). Oxford Dictionaries, Oxford University Press. Retrieved March 12, 2014, from http://www.oxforddictionaries.com/us/definition/american_english/perception
Pieters, R., & Warlop, L. (1999). Visual attention during brand choice: The impact of time pressure and task motivation. International Journal of Research in Marketing, 16(1), 1–16. doi:10.1016/S0167-8116(98)00022-6
Pieters, R., Warlop, L., & Wedel, M. (2002). Breaking through the clutter- Benefits of advertisment originality and familiarity for brand attention and memory.pdf, 48(June), 765–781.
Randall, R. (2013). The Effect of Applying Established Color Theory to Packaging When Visible Product and External Labels Exist Simultaneously, (May).
Rayner, K. (1998). Eye movements in reading and information processing: 20 years of research. Psychological Bulletin, 124(3), 372–422. Retrieved from http://www.ncbi.nlm.nih.gov/pubmed/9849112
Reimann, M., Zaichkowsky, J., Neuhaus, C., Bender, T., & Weber, B. (2010). Aesthetic package design: A behavioral, neural, and psychological investigation. Journal of Consumer Psychology, 20(4), 431–441. doi:10.1016/j.jcps.2010.06.009
Rettie, R., & Brewer, C. (2000). The verbal and visual components of package design. Journal of Product & Brand Management, 9(1), 56–70. doi:10.1108/10610420010316339
Rundh, B. (2005). The multi-faceted dimension of packaging: Marketing logistic or marketing tool? British Food Journal, 107(9), 670–684. doi:10.1108/00070700510615053
104
Rundh, B. (2009). Packaging design: creating competitive advantage with product packaging. British Food Journal, 111(9), 988–1002. doi:10.1108/00070700910992880
Schoormans, J. P. L., & Robben, H. S. J. (1997). The effect of new package design on product attention, categorization and evaluation. Journal of Economic Psychology, 18(2-3), 271–287. doi:10.1016/S0167-4870(97)00008-1
Selame, T., & Koukos, P. (2002). Is your package shelf-evident? Design Management Journal, Fall, 25–31.
Silayoi, P., & Speece, M. (2004). Packaging and purchase decisions: An exploratory study on the impact of involvement level and time pressure. British Food Journal, 106(8), 607–628. doi:10.1108/00070700410553602
Soroka, W. (2002). Fundamentals of Packaging Technology (3rd ed., p. 455). Naperville, Illinois: Institute of Packaging Professionals.
Thackston, K., Pham, A., Galvarino, J., & Ouzts, A. (2011). Consumer Purchasing Based on Packaging Structural Design/Product Visual Display in a Retail Environment. Andrewd.ces.clemson.edu. Retrieved from http://andrewd.ces.clemson.edu/courses/cpsc412/fall11/teams/reports/group7.pdf
Tonkin, C. (2011). CUshop: A Simulated Shopping Environment Fostering Consumer-Centric Packaging Design & Testing, (August).
Westerman, S. J., Sutherland, E. J., Gardner, P. H., Baig, N., Critchley, C., Hickey, C., … Zervos, Z. (2013). The design of consumer packaging: Effects of manipulations of shape, orientation, and alignment of graphical forms on consumers’ assessments. Food Quality and Preference, 27(1), 8–17. doi:10.1016/j.foodqual.2012.05.007
Xiaoyan Deng. (2009). Consumer Response to Visual Aspects of Packaging and Product Design.

![[Typ hier] Smart Packaging for Intelligent Logistics · Smart Packaging stands for intelligent logistics with the following ingredients added: connectivity, integrated sensors, tracking&tracing,](https://img.pdfslide.net/doc/110x75/5ffc6898cf6d740fdf6dbcf0/typ-hier-smart-packaging-for-intelligent-logistics-smart-packaging-stands-for.jpg)