Embed Size (px)
Citation preview

Comparing the Moisture Performance of Wood Framed Wall Systems in the Pacific Northwest Prepared For: Roof Consultant Institute / Building Envelope Institute 2005 Symposium on Building Envelope Technology Prepared By: Chuck Murray Washington State University Extension Energy Program 925 Plum Street, Olympia, WA 98502 360 956-2157 [email protected] Funded By: U.S. Department of Energy, contract DE-FC26-02NT41498 Publication number: WSUEEP05-020 9/26/2005

Preface: This project is primarily funded by the U.S. Department of Energy, contract DE-FC26-02NT41498. Additional grants and in kind contributions have been provided by CertainTeed, Fortifiber, Weyerhaeuser and APA - the Engineered Wood Association. Local building materials suppliers, trade associations and union apprentice programs have provided additional assistance. This is a summary report written specifically for the Roof Consultant Institute 2005 Symposium on Building Envelope Technology. More detailed reporting will be available in coming months. It will be available on line at: http://www.energy.wsu.edu/projects/building/moisture.cfm Disclaimer: This report was prepared as an account of work sponsored by an agency of the United States Government. Neither the United States Government nor any agency thereof, nor any of their employees, makes any warranty, express or implied, or assumes any legal liability or responsibility for the accuracy, completeness, or usefulness of any information, apparatus, product, or process disclosed, or represent that its use would not infringe privately owned rights. Reference herein to any specific commercial product, process, or service by trade name, trademark, manufacturer, or otherwise does not necessarily constitute or imply its endorsement, recommendation, or favoring by the United States Government or any agency thereof. The views and opinions of authors expressed herein do not necessarily state or reflect those of the United States Government or any agency thereof.

Introduction: In 2003, Washington State University (WSU) and Oak Ridge National Laboratory (ORNL) initiated a collaborative project to evaluate the heat and moisture transport characteristics of wood frame wall systems in the Pacific Northwest marine climate. Three primary activities are included in this project: field-testing of full-scale test walls; laboratory testing of building material hygrothermal properties; and calibration of advanced computer models using the field and laboratory data. This paper highlights the practical findings from the first year field-testing of 12 full-scale test walls. This project was undertaken in response to costly building failures in the Pacific Northwest region. A recent survey conducted by the City of Seattle documented 52 recent moisture-related multi-family building failures, at a cost of $98 million. This same study speculates that as much as 20 percent of the multi-family housing stock built in the city since 1984 could be affected. If true, the cost to Seattle building owners could be as high as $500 million. Similar problems have been reported in Portland, Oregon; Vancouver, British Columbia; and other Pacific Northwest cities. This project was also initiated because of the speculation that Washington’s energy and ventilation codes were partly to blame for the building failures. To meet the code requirements for residential construction, R-21 wall insulation is typical. Some in the construction industry blamed the high level of insulation for the moisture problems. Mandatory rules for mechanical ventilation were also thought to be a cause for, not a solution to moisture-related building failures. WSU’s Extension Energy Program, ORNL and U.S. DOE were particularly interested in these issues. This group of conservation advocates not only wanted to examine current construction practices, but develop methods that move energy efficient design beyond current practice, without unintended consequences. Test Methods: For this project, Washington State University has established a test facility specifically designed to monitor moisture transport in building assemblies. The Natural Exposure Test Facility (NET) will accommodate up to 24 4x9-foot test walls, 12 facing south, and 12 facing north. For this report, all 12 of the test walls are facing south.
Figure 1. WSU Natural Exposure Test Facility NET instrumentation provides hourly data on the wood moisture content (MC), relative humidity (RH), incidence of condensation and temperature (Temp) distributed through the cross section of the test walls. Sensors are located at critical areas of the walls identified during previous field studies, and through computer modeling. Through the examination of this data, the moisture performance of test walls can be evaluated. The test facility is shown in Figure 1.

Exterior environmental loads are monitored with a high quality weather station. The HVAC system provides control of the interior environment. Temperature and RH are controlled to meet the requirements of the experiment. Critical to the operation of the test facility is the establishment of relevant interior temperature and relative humidity (RH). For the test, researchers selected an indoor temperature set point typical for human occupancy. The humidity settings are higher than average but well within the operating parameter of homes monitored in the Pacific Northwest1. The test conditions are also within the parameters established by ASHRAE committee 160P, “Design Criteria for Moisture Control in Buildings.” On average, test facility temperature was maintained at 69 degrees F, RH was maintained at 50-55 percent. Test wall designs were selected to create a number of controlled comparisons. While this paper will emphasize the field test results, the walls were also selected to meet the needs of computer simulation calibration. The construction of the test walls is detailed in Appendix A, Table 1. A discussion of the wall designs follows. Cladding types: 7/8 inch stucco and cement lap siding.
Cement stucco was selected to represent a storage cladding type. This material stores some water during and after a rain event. The water dissipates from the cladding through gravity forces, evaporation and vapor diffusion. This wall also provides the opportunity to examine the effects of mass on wall performance. Cement lap siding has been selected to represent typical lap siding construction found in the Pacific Northwest. This system relies on both the primary and secondary drainage plane. In this case the primary drainage is the lap siding. The secondary is the weather resistive barrier. This system is not designed to store water. Also, water or water vapor is not expected to move through the cladding. To varying degrees, lap siding can provide some ventilation between the cladding and weather resistive barrier. It should be noted that had there been more test space available, wood and vinyl lap siding would have also been included.
Cladding Ventilation: None, vented, ventilated.
To assess the value of providing ventilation between the cladding and the weather resistive barrier, two ventilation strategies are compared to walls without ventilation. To construct a ventilated cladding system, 3/4” furring is attached to the walls 16” on center. The cladding is attached to the furring strips. The ventilated cavity is open at the bottom and at the top of the wall to provide flow-through ventilation. The vented cavity is identical to the ventilated, except the cavity is only open at the bottom. Figure 3 shows a test wall with ventilated cladding under construction.
Weather Resistive Barriers: Two layers of 60 minute building paper. No comparisons.
Because of the limitation on the number of test walls, only one type of weather resistive barrier was used the first year. Much additional study could be conducted on the impact of weather resistive barriers. We hope to take this on in the future.
1 Aoki-Kramer, M., Karagiozis, A., PHd, “A New Look At Interior Environmental Loads” Performance of Exterior Envelopes of Whole Buildings IX, International Conference, 2004.

Figure 2. Strapping that creates ventilated Figure 3. Foam sheathing test wall cladding Exterior Structural Sheathing: OSB and Plywood.
The moisture transport characteristics of plywood and OSB are different. Dry plywood has a lower perm rating than dry OSB. But as plywood’s moisture content increases, so does the perm rating. Dry plywood has a low perm rating; wet plywood has a high perm rating. The perm rating of OSB also increases as it gets wet, but less so than plywood. The experiment includes comparable test walls with plywood and OSB to examine the practical significance of the sheathing performance differences. In coming years the research team would like to include additional types of exterior sheathing.
Insulation: R-21 batt, R-13 batt + R-5 foam, R-11 batt.
Because of stringent energy code requirements in the Pacific Northwest, typical wall construction for residential buildings is 2x6 wood framing insulated with R-21 fiberglass batts. A construction that provides similar thermal performance is a 2x4 wood frame with R-13 batts and R-5 continuous foam sheathing. To represent wall construction typical 25 years ago, a 2x4 stud wall with R-11 Kraft faced batts was included in the study. Figure 4 shows a foam clad test wall under construction.
Vapor retarders: Polyethylene sheeting, smart vapor retarder, Kraft vapor retarder, and interior paint only.
Direct comparisons between several vapor retarder strategies were included in the wall constructions. Polyethylene sheeting has perm rating of approximately .08, regardless of the RH. The smart vapor retarder utilized in the project has a perm rating of less than one at low RH, but as the RH increases, the perm rating also increases, allowing some moisture transport. Kraft paper is noted to have similar characteristics to smart retarders, but they are somewhat less responsive. Using only interior paint will provide some vapor protection. A PVA primer and a coat of latex paint will provide vapor protection in the range of 2 to 12 perms depending on the paint and application.
Effects of air infiltration: Not tested this test cycle. All of the walls were constructed to prevent air infiltration into the insulated cavity.

Effects of exterior water penetration Water penetration from the exterior is very limited. The simple design of the walls made the research team fairly certain water is not penetrating the exterior cladding. The study will be expanded in the second year of testing to include bulk moisture loads.
Test Results: The discussions that follow are based on the results of the first year of testing at the NET, October 1, 2003 through September 13, 2004. Performance comparisons are presented for the test wall constructions discussed above. It should be noted that most of the walls performed within an acceptable range of MC. Only Wall 7 is considered a failure. There are limits to the conclusions that can be drawn from one year of testing. The test walls were subjected to specific interior and exterior environmental loads. The test walls could have responded differently to a different set of loads. Several examples to these limitations have already been noted. Exterior moisture penetration is unlikely, and the transfer of moisture from the interior through air leakage is unlikely. Because a number of the most severe loads have been controlled, this study is primarily focused on moisture transport into the building cavity through vapor diffusion or capillary movement. With these marginal loads, we can compare the drying capabilities of the test walls. To follow this discussion in detail, the reader will want to open Appendix A., which includes graphs illustrating the performance of each test wall. Appendix A also includes the test wall matrix, and illustrations describing each RH and MC sensor location. To best make comparisons, it is useful to print out the graphs and lay them out side by side. Old wall compared to contemporary wall.
Test Wall 5 represents a stucco wall construction typical in the Seattle area prior 1985. Test Wall 1 provides an appropriate modern comparison. Test Wall 1 is representative of stucco walls with levels of insulation that meet the current energy codes. Both test Wall 5 and test Wall 1 performed within an acceptable range of wood moisture content. Both had a few hours during the test cycle when moisture accumulation in the wood was above 19 percent. But these events were very short in duration and do not appear on the running average plots. Test Wall 5 had moisture accumulation in the sheathing board near the exterior, which is probably the result of rain. This probably occurs because of the moisture transport characteristics of the plywood sheathing used on the old wall. For test Wall 1, high moisture content readings are related to redistribution of moisture to the top plate when the first warm spring weather begins to dry the walls, around day 50. The RH in both test walls is somewhat different. During the winter months, the RH in the insulated cavity will be colder near the exterior surface than the interior surface. Test Wall 5, having a lower R-value than test Wall 1, is expected to have higher temperature and lower RH in the winter where the insulation meets the exterior sheathing. When comparing Wall 5 and Wall 1, this difference can be observed. Some observers may reach the conclusion that this is an indicator that test Wall 5 will perform better than test Wall 1 because of lower RH. This is not conclusive. While there are some minor differences in the performance of test Wall 1 and test Wall 5, it is not significant. The wood moisture content of both assemblies is similar.

Foam sheathing insulation compared to cavity insulation
Test Wall 8 is a stucco-clad wall constructed using 2x4 framing, R-13 cavity insulation, and R-5 foam sheathing. The alternative insulation method using R-21 insulation in a 2x6-framed cavity is best represented by test Wall 2. Both test Wall 8 and test Wall 2 also include smart vapor retarders. The moisture performance of test Wall 8 is significantly better than most other walls in our test. The moisture content sensors in Wall 8 averaged 8 to 10.5 percent, and never exceeded 14 percent. The running average MC in Wall 2 shows peaks approaching 20 percent. Foam sheathing effectively reduces the occurrence of condensation on the exterior structural sheathing by keeping the temperature above the condensing point. This reduces the time when moisture accumulation will occur. The RH measured in the insulated cavity at the drywall surface had a much smaller range of measurement. The foam insulation may also be controlling the inward vapor drive from the stucco cladding during warm weather. An important aspect of design of Wall 8 is the use of a smart vapor retarder on the interior. Because vapor diffusion to the exterior is limited by the foam sheathing, it is important to provide drying capability to the interior. More discussion on the effectiveness of vapor retarder strategies follows.
Stucco cladding ventilation
Three walls will be used to provide performance comparisons for stucco cladding ventilation. Wall 1 represents a stucco assembly without cladding ventilation. Wall 3 is constructed with a vented cladding system. Wall 4 is a constructed with a fully ventilated cladding system. Wall 4 test results demonstrate that the fully ventilated cavity provides superior moisture performance. The RH and MC remained extremely low throughout the test cycle, proving this strategy works well. Wall 3, the vented case, did not perform much better than Wall 1. The RH in the cavity of wall 3 is similar to Wall 1. Wall 3 had somewhat lower MC than Wall 1, except for the top plate. The top plates of Wall 1 and Wall 3 show similar MC accumulation over the test cycle. Why doesn’t the vented wall work as well as the ventilated wall? Test Wall 3 provides an additional drainage plane, but does not provide a significant air change rate. Measurements of the pressure in the cladding behind the stucco indicate there is very little air movement on Wall 3. Wall 4 frequently has a pressure difference from bottom to top of approximately 5 Pascals. The opening at the top of the ventilated wall induces significant airflow, increasing the drying capacity of the wall. Providing flow-through ventilation is possibly the most critical component to a cladding ventilation design.
Lap siding ventilation
Test Wall 12 represents standard lap siding application. Wall 10 is a vented lap wall, and Wall 11 is a ventilated lap wall. All three walls remained very dry during the test cycle, making it somewhat difficult to provide performance comparisons. Both the vented and ventilated lap walls have slightly lower MC than the standard lap wall assembly. A distinction between the vented and ventilated case cannot be made. The RH in the cavity of Walls 10 and 11 is lower than Wall 12. This indicates a dryer wall, with less chance for condensation on either the interior or exterior surface. Cladding ventilation strategies demonstrated here do show promise. But more extreme test conditions will be needed to better define the margins of difference.

Stucco cladding and lap siding compared
In most cases, walls with lap siding had less moisture accumulation than stucco clad walls. To directly compare performance, look at the following sets. They are identical except for cladding.
• Wall 1 and Wall 12 • Wall 3 and Wall 10 • Wall 4 and Wall 11 • Wall 6 and Wall 9
Wall 4 performs almost as well as Wall 11. Cavity RH and MC are nearly identical. A fully ventilated stucco wall performs as well as any of the walls with lap siding. For the other sets, the walls with lap siding always have lower cavity RH and MC than walls with stucco cladding. This is likely due to the many hours a year that the stucco cladding has high moisture content. Stucco with high moisture content will not necessarily increase the MC or RH in the cavity directly. But it does make it difficult for the wall to dry. The vapor pressure of the stucco is frequently much higher than the wall cavity. A high vapor pressure on the exterior surface makes it impossible for the wall to dry to the exterior.
Vapor retarder performance
Three vapor control strategies can be directly compared. Wall 7 only has the vapor control provided by the interior layers of paint. Wall 1 includes paint and polyethylene sheeting. Wall 2 includes a smart vapor retarder, CertainTeed MemBrain™. The interior environmental conditions play a significant role in the test results. The interior RH was kept at approximately 55 percent for the test cycle. If it were lower the test results would be less dramatic. Wall 7 performed poorly. RH in the insulated cavity was very high most of the winter. At the exterior sheathing, the RH reached 100 percent and stayed there. This resulted in high levels of moisture accumulation in the winter. MC readings of the exterior sheathing exceeded 30 percent for months. When the wall was opened in the spring, there was significant mold accumulation on the exterior sheathing. Obviously, a vapor retarder is important given the environmental conditions present during the test. Wall 7 also dried very quickly when the outdoor temperature warmed up. The RH at the interior surface of the wall cavity, represented by plot RH4, is similar to the interior environmental conditions. With limited interior vapor control, the wall was able to dry to the interior. Both Wall 1 and Wall 2 had interior vapor control in the winter capable of preventing significant levels of moisture accumulation in the building cavity. Under the test conditions, the vapor transport characteristics of the smart vapor retarder allowed a little more moisture through. This resulted in slightly higher RH and slightly more moisture accumulation in the sheathing in the winter, day 285 through 50. In the spring, Wall 2 dried more quickly than Wall 1. The polyethylene vapor retarder included in Wall 1 prevents the wall cavity from drying to the interior. When the vapor drive is from the exterior to the interior, as occurs on a warm day, the polyethylene sheathing in Wall 1 prevents the moisture from escaping. Mid day, moisture frequently accumulates on the polyethylene

sheathing. The MemBrain™ used on Wall 2 allows the moisture to move through the material when it nears a condensing condition. Figure 5 illustrates this effect. Clearly there is a need for a vapor retarder given the design conditions and wall constructions selected for this study. New materials like the smart vapor retarder that allows drying to the interior will improve performance when compared to polyethylene sheeting. As a side note, Wall 5 also included a vapor retarder with a variable response, Kraft facing. This may account for the good performance of Wall 5.
Figure 4. Daily RH swings in the insulated Figure 5. Mold resulting form inadequate vapor at the interior cavity vapor retarder control on Wall 7 Structural sheathing, OSB and plywood compared
Direct comparisons can be made between Wall 1 and Wall 6 or Wall 9 and Wall 12. Wall 1 and 12 include OSB structural sheathing. Wall 6 and 9 include plywood sheathing. For the stucco-clad walls, differences in the moisture performance can be noted. Wall 1 has lower cavity RH and lower MC readings for much of the year. When the weather warms up in the spring, beginning Day 50, the plywood sheathing has an increase in MC. This is a redistribution of moisture from both the exterior cladding and the interior framing. The spring effect is only noted on the top plate of Wall 1. Wall 9 and 12 provide a comparison between OSB and plywood for a lap sided wall. Little difference in performance can be observed. These walls are dryer than the stucco clad walls. For stucco clad walls, the structural sheathing may be important. The stucco frequently contains moisture that can be driven into the wood members when the sun hits the cladding. The moisture transport characteristics of the exterior sheathing may play a role in moisture
Mean(w1_RHc_4)
Mean(w2_RHc_4)
Mean(w7_RHc_4)
Mean(w1_T_7)
Polyethylene MemBrain™ Paint only Ext sheathing temp.
0102030405060708090
100
RH
(%) o
r Tem
p. (C
)
02:0
0:00
AM
05:0
0:00
AM
08:0
0:00
AM
11:0
0:00
AM
02:0
0:00
PM
05:0
0:00
PM
08:0
0:00
PM
11:0
0:00
PM
April 16, 2004

transport from the exterior to the interior. Plywood is more vapor open when wet than OSB. This may allow the moisture accumulation noted on the Wall 1 and Wall 6 graphs.
Final Recommendations: Based on the first year of testing, several recommendations stand out. They are as follows:
The amount of cavity insulation does not change the moisture performance of walls significantly. Both R-11 and R-21 walls had similar moisture accumulation for the test year examined. Walls constructed with R-13 cavity insulation plus R-5 foam sheathing provides better moisture performance than a wall with R-21 cavity insulation only. Combined with a smart vapor retarder, The R-13+5 construction provides excellent performance. Cladding ventilation is effective at lowering the wood moisture content of insulated wall cavities. A fully ventilated cladding that includes openings to the exterior both high and low on the wall is critical. Simply providing an air space behind the cladding without openings to the exterior is not effective. Vapor retarders with a dry cup perm rating less than 1 are important in the Pacific Northwest climate. The use of a smart vapor retarder provides additional benefits by allowing additional drying to the interior from the wall cavity in the spring and summer. This is likely true for other marine climates.

Appendix A Graphs Wall 1 through Wall 12 First year of testing at the NET, October 1, 2003 through September 13, 2004
Reading the Graphs
Graphs Wall1 through Wall 12 provide summary data on the Relative Humidity (RH) and wood moisture content (MC) of wood materials located in the insulated cavity. Two RH sensors are included in each building cavity. Sensor RH3 is located between the cavity insulation and the exterior structural sheathing. RH4 is located between the insulation in the cavity and the interior vapor retarder, or drywall. For RH, the data is represented in two ways. For RH sensors each hourly data point is noted on the graph as a dot. This allows the reader to examine effects of daily temperature swings on cavity RH. Most often this data is used to track hours the interior or exterior surface reaches high RH, or the condensing point. On the exterior surface, high RH indicates the beginning of moisture accumulation on the sheathing board. On the interior surface, condensing conditions indicate that the vapor retarder is trapping moisture in the cavity when it may otherwise dry out. Each of the RH sensors is also plotted on graphs Wall1-12 using a 168-hour running average. These lines represent the long-term RH conditions in the cavity. MC sensors located in wood members in the wall cavity are noted as 168 hour running average. Measurement of wood moisture content is more relevant when represented as a long-term average. The hourly data will be relevant to calibration of computer models, but is of little value to the practitioner. In most cases, the RH readings will be high on the right scale; from 40 to 100%. MC sensor readings typically are low on the scale; from 8 to 40%. The time scale on the bottom axis of the graphs is the day of the year, October 1, 2003 through September 13, 2004.

Test Wall Matrix WSU Natural Exposure Test Facility, First year testing.
Wall# Ext Finish Siding Ext. Venting WRB Sheathing Ext Insulation Cavity Insulation Frame Vapor Retarder Int Board Int Paint Location 1 Cement Stucco 7/8" Unvented 2x 60 min OSB R-21 2X6 Poly Drywall Latex South 1 2 Cement Stucco 7/8" Unvented 2x 60 min OSB R-21 2X6 MemBrain® Drywall Latex South 2 3 Cement Stucco 7/8" Vented 2x 60 min OSB R-21 2X6 Poly Drywall Latex South 3 4 Cement Stucco 7/8" Ventilated 2x 60 min OSB R-21 2X6 Poly Drywall Latex South 4 5 Cement Stucco 7/8" Unvented 2x 60 min Plywood R-11 2X4 Kraft Drywall Oil South 5 6 Cement Stucco 7/8" Unvented 2x 60 min Plywood R-21 2X6 Poly Drywall Latex South 6 7 Cement Stucco 7/8" Unvented 2x 60 min OSB R-21 2X6 None Drywall Latex South 7 8 Cement Stucco 7/8" Unvented 2x 60 min OSB Foam - 1" R-13 2X4 MemBrain® Drywall Latex South 8 9 Latex lap Unvented 2x 60 min Plywood R-21 2X6 Poly Drywall Latex South 9
10 Latex lap Vented 2x 60 min OSB R-21 2X6 Poly Drywall Latex South 10 11 Latex lap Ventilated 2x 60 min OSB R-21 2X6 Poly Drywall Latex South 11 12 Latex lap Unvented 2x 60 min OSB R-21 2X6 Poly Drywall Latex South 12
15 Cement Stucco 7/8" Unvented 2x 60 min OSB R-21 2X6 Poly Drywall Latex North 6 OSB 7/16 Aspen Plywood 15/32 4 Ply Doug Fir Unvented Siding direct applied over sheathing and weather resistive barrier. Vented 3/4" Cavity behind exterior sheathing open at the bottom of the panel only Ventilated 3/4" Cavity behind exterior sheathing open at the top and bottom of the panel WRB Weather Resistive Barrier 2x 60 min 2 layer 60 minute building paper. MemBrain® CertainTeed smart vapor retarder Drywall 1/2" Standard drywall taped and finished Foam 1" Expanded Poly Styrene R-5
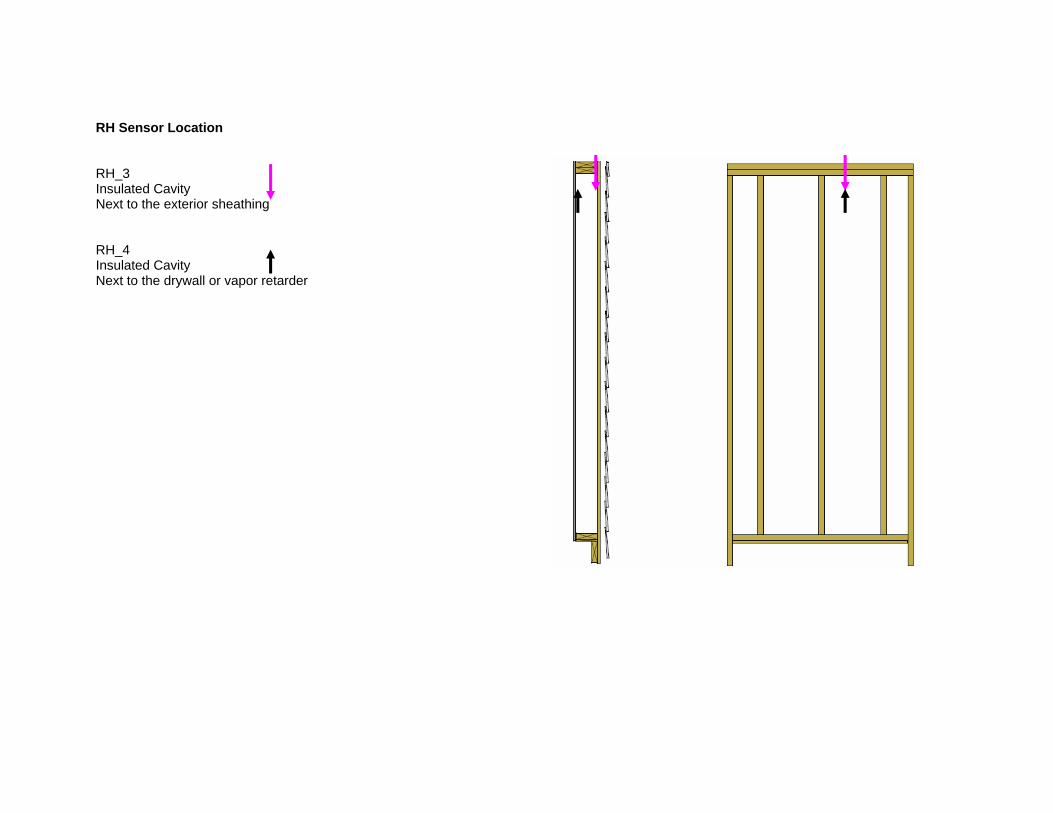
RH Sensor Location RH_3 Insulated Cavity Next to the exterior sheathing RH_4 Insulated Cavity Next to the drywall or vapor retarder

Moisture Content Sensor Location MC_1 Top Plate Near the exterior sheathing MC_2 Sheathing Near the top plate Pin depth near the interior of stud cavity MC_3 Sheathing Middle of the stud cavity Pin depth set near the exterior of stud cavity MC_4 Sheathing Middle of the stud cavity Pin depth set near the interior of the of stud cavity MC_5 Stud Middle of the cavity vertically, Center of the stud horizontally Pin depth set near the interior of the OSB MC_6 Bottom Plate Near the exterior sheathing

Wall 1Latex - Drywall - Poly - 2x6 - R-21 - OSB - 2x 60min – 7/8 cement stucco
Moving Average (168 hours)10/1/2003 to 9/14/2004
05
101520253035404550556065707580859095
100105
Day
_RTM 28
5
297
309
320
332
343
355 2 13 25 37 50 64 77 90 102
114
126
138
149
161
173
185
197
209
220
232
244
255
RH
% O
R M
Cc
%w1_MCc1w1_MCc2w1_MCc3w1_MCc4w1_MCc5w1_MCc6w1_RHc_3w1_RHc_4168 per. Mov. Avg. (w1_MCc1)168 per. Mov. Avg. (w1_MCc2)168 per. Mov. Avg. (w1_MCc3)168 per. Mov. Avg. (w1_MCc4)168 per. Mov. Avg. (w1_MCc5)168 per. Mov. Avg. (w1_MCc6)168 per. Mov. Avg. (w1_RHc_3)168 per. Mov. Avg. (w1_RHc_4)

Wall 2Latex - Drywall - Membrane - 2x6 - R-21 - OSB - 2x 60min – 7/8 cement stucco
Moving Average (168 hours)10/1/2003 to 9/14/2004
05
101520253035404550556065707580859095
100105
Day
_RTM 28
5
297
309
320
332
343
355 2 13 25 37 50 64 77 90 102
114
126
138
149
161
173
185
197
209
220
232
244
255
RH
% O
R M
Cc
%
w2_MCc1w2_MCc2w2_MCc3w2_MCc4w2_MCc5w2_MCc6w2_RHc_3w2_RHc_4168 per. Mov. Avg. (w2_MCc1)168 per. Mov. Avg. (w2_MCc2)168 per. Mov. Avg. (w2_MCc3)168 per. Mov. Avg. (w2_MCc4)168 per. Mov. Avg. (w2_MCc5)168 per. Mov. Avg. (w2_MCc6)168 per. Mov. Avg. (w2_RHc_3)168 per. Mov. Avg. (w2_RHc_4)

Wall 3Latex - Drywall - Poly - 2x6 - R-21 - OSB - 2x 60min – Vented- 7/8 cement stucco
Moving Average (168 hours)10/1/2003 to 9/14/2004
0
5
10
15
20
25
30
35
40
45
50
55
60
65
70
75
80
85
90
95
100
105
Day
_RTM 28
5
297
309
320
332
343
355 2 13 25 37 50 64 77 90 102
114
126
138
149
161
173
185
197
209
220
232
244
255
RH
% O
R M
Cc
%
w3_MCc1w3_MCc2w3_MCc3w3_MCc4w3_MCc5w3_MCc6w3_RHc_3w3_RHc_4168 per. Mov. Avg. (w3_MCc1)168 per. Mov. Avg. (w3_MCc2)168 per. Mov. Avg. (w3_MCc3)168 per. Mov. Avg. (w3_MCc4)168 per. Mov. Avg. (w3_MCc5)168 per. Mov. Avg. (w3_MCc6)168 per. Mov. Avg. (w3_RHc_3)168 per. Mov. Avg. (w3_RHc_4)

Wall 4 Latex - Drywall - Poly - 2x6 - R-21 - OSB - 2x 60min – Ventilated - 7/8 cement stucco
Moving Average (168 hours) 10/1/2003 to 9/14/2004
0
5
10
15
20
25
30
35
40
45
50
55
60
65
70
75
80
85
90
95
100
105
Day
_RTM 28
5
297
309
320
332
343
355 2 13 25 37 50 64 77 90 102
114
126
138
149
161
173
185
197
209
220
232
244
255
RH
% O
R M
Cc
%
w4_MCc1w4_MCc2w4_MCc3w4_MCc4w4_MCc5w4_MCc6w4_RHc_3w4_RHc_4168 per. Mov. Avg. (w4_MCc1)168 per. Mov. Avg. (w4_MCc2)168 per. Mov. Avg. (w4_MCc3)168 per. Mov. Avg. (w4_MCc4)168 per. Mov. Avg. (w4_MCc5)168 per. Mov. Avg. (w4_MCc6)168 per. Mov. Avg. (w4_RHc_3)168 per. Mov. Avg. (w4_RHc_4)

Wall 5 Oil - Drywall - Kraft - 2x4 - R-11 - plywood - 2x 60min – 7/8 cement stucco
Moving Average (168 hours)10/1/2003 to 9/14/2004
0
5
10
15
20
25
30
35
40
45
50
55
60
65
70
75
80
85
90
95
100
105
Day
_RTM 28
5
297
309
320
332
343
355 2 13 25 37 50 64 77 90 102
114
126
138
149
161
173
185
197
209
220
232
244
255
RH
% O
R M
Cc
%
w5_MCc1w5_MCc2w5_MCc3w5_MCc4w5_MCc5w5_MCc6w5_RHc_3w5_RHc_4168 per. Mov. Avg. (w5_MCc1)168 per. Mov. Avg. (w5_MCc2)168 per. Mov. Avg. (w5_MCc3)168 per. Mov. Avg. (w5_MCc4)168 per. Mov. Avg. (w5_MCc5)168 per. Mov. Avg. (w5_MCc6)168 per. Mov. Avg. (w5_RHc_3)168 per. Mov. Avg. (w5_RHc_4)
low because of missing data

Wall 6 Latex - Drywall - Poly - 2x6 - R-21 - Plywood - 2x 60min – 7/8 cement stucco
Moving Average (168 hours)10/1/2003 to 9/14/2004
0
5
10
15
20
25
30
35
40
45
50
55
60
65
70
75
80
85
90
95
100
105
Day
_RTM 28
5
297
309
320
332
343
355 2 13 25 37 50 64 77 90 102
114
126
138
149
161
173
185
197
209
220
232
244
255
RH
% O
R M
Cc
%
w6_MCc1w6_MCc2w6_MCc3w6_MCc4w6_MCc5w6_MCc6w6_RHc_3w6_RHc_4168 per. Mov. Avg. (w6_MCc1)168 per. Mov. Avg. (w6_MCc2)168 per. Mov. Avg. (w6_MCc3)168 per. Mov. Avg. (w6_MCc4)168 per. Mov. Avg. (w6_MCc5)168 per. Mov. Avg. (w6_MCc6)168 per. Mov. Avg. (w6_RHc_3)168 per. Mov. Avg. (w6_RHc_4)

Wall 7 Latex - Drywall – no V - Retarder - 2x6 - R-21 - OSB - 2x 60min – 7/8 cement stucco Moving Average (168
hours)10/1/2003 to 9/14/2004
05
101520253035404550556065707580859095
100105
Day
_RTM 28
5
297
309
320
332
343
355 2 13 25 37 50 64 77 90 102
114
126
138
149
161
173
185
197
209
220
232
244
255
RH
% O
R M
Cc
%
w7_MCc1w7_MCc2w7_MCc3w7_MCc4w7_MCc5w7_MCc6w7_RHc_3w7_RHc_4168 per. Mov. Avg. (w7_MCc1)168 per. Mov. Avg. (w7_MCc2)168 per. Mov. Avg. (w7_MCc3)168 per. Mov. Avg. (w7_MCc4)168 per. Mov. Avg. (w7_MCc5)168 per. Mov. Avg. (w7_MCc6)168 per. Mov. Avg. (w7_RHc_3)168 per. Mov. Avg. (w7_RHc_4)

Wall 8 Latex - Drywall - MemBrain - 2x4 - R-13 - OSB - 2x 60min – R-5 EPS - 7/8 cement stucco
Moving Average (168 hours)10/1/2003 to 3/31/2004
0
5
10
15
20
25
30
35
40
45
50
55
60
65
70
75
80
85
90
95
100
105
Day
_RTM 28
5
297
309
320
332
343
355 2 13 25 37 50 64 77 90 102
114
126
138
149
161
173
185
197
209
220
232
244
255
RH
% O
R M
Cc
%
w8_MCc1w8_MCc2w8_MCc3w8_MCc4w8_MCc5w8_MCc6w8_RHc_3w8_RHc_4168 per. Mov. Avg. (w8_MCc1)168 per. Mov. Avg. (w8_MCc2)168 per. Mov. Avg. (w8_MCc3)168 per. Mov. Avg. (w8_MCc4)168 per. Mov. Avg. (w8_MCc5)168 per. Mov. Avg. (w8_MCc6)168 per. Mov. Avg. (w8_RHc_3)168 per. Mov. Avg. (w8_RHc_4)

Wall 9Latex - Drywall - Poly - 2x6 - R-21 - Plywood - 2x 60min – Cement lap
Moving Average (168 hours)10/1/2003 to 3/31/2004
0
5
10
15
20
25
30
35
40
45
50
55
60
65
70
75
80
85
90
95
100
105
Day
_RTM 28
5
297
309
320
332
343
355 2 13 25 37 50 64 77 90 102
114
126
138
149
161
173
185
197
209
220
232
244
255
RH
% O
R M
Cc
%
w9_MCc1w9_MCc2w9_MCc3w9_MCc4w9_MCc5w9_MCc6w9_RHc_3w9_RHc_4168 per. Mov. Avg. (w9_MCc1)168 per. Mov. Avg. (w9_MCc2)168 per. Mov. Avg. (w9_MCc3)168 per. Mov. Avg. (w9_MCc4)168 per. Mov. Avg. (w9_MCc5)168 per. Mov. Avg. (w9_MCc6)168 per. Mov. Avg. (w9_RHc_3)168 per. Mov. Avg. (w9_RHc_4)

Wall 10Latex - Drywall - Poly - 2x6 - R-21 - OSB - 2x 60min – Vented – cement lap
Moving Average (168 hours)10/1/2003 to 3/31/2004
0
5
10
15
20
25
30
35
40
45
50
55
60
65
70
75
80
85
90
95
100
105
Day
_RTM 28
5
297
309
320
332
343
355 2 13 25 37 50 64 77 90 102
114
126
138
149
161
173
185
197
209
220
232
244
255
RH
% O
R M
Cc
%
w10_MCc1w10_MCc2w10_MCc3w10_MCc4w10_MCc5w10_MCc6w10_RHc_3w10_RHc_4168 per. Mov. Avg. (w10_MCc1)168 per. Mov. Avg. (w10_MCc2)168 per. Mov. Avg. (w10_MCc3)168 per. Mov. Avg. (w10_MCc4)168 per. Mov. Avg. (w10_MCc5)168 per. Mov. Avg. (w10_MCc6)168 per. Mov. Avg. (w10_RHc_3)168 per. Mov. Avg. (w10_RHc_4)

Wall 11Latex - Drywall - Poly - 2x6 - R-21 - OSB - 2x 60min – Ventilated – cement lap
10/1/2003 to 9/14/2004
0
5
10
15
20
25
30
35
40
45
50
55
60
65
70
75
80
85
90
95
100
105D
ay_R
TM 285
297
309
320
332
343
355 2 13 25 37 50 64 77 90 102
114
126
138
149
161
173
185
197
209
220
232
244
255
RH
% O
R M
Cc
%
w11_MCc1w11_MCc2w11_MCc3w11_MCc4w11_MCc5w11_MCc6w11_RHc_3w11_RHc_4168 per. Mov. Avg. (w11_MCc1)168 per. Mov. Avg. (w11_MCc2)168 per. Mov. Avg. (w11_MCc3)168 per. Mov. Avg. (w11_MCc4)168 per. Mov. Avg. (w11_MCc5)168 per. Mov. Avg. (w11_MCc6)168 per. Mov. Avg. (w11_RHc_3)168 per. Mov. Avg. (w11_RHc_4)

Wall 12Latex - Drywall - Poly - 2x6 - R-21 - OSB - 2x 60min – Cement lap
10/1/2003 to 9/14/2004
0
5
10
15
20
25
30
35
40
45
50
55
60
65
70
75
80
85
90
95
100
105
Day
_RTM 28
5
297
309
320
332
343
355 2 13 25 37 50 64 77 90 102
114
126
138
149
161
173
185
197
209
220
232
244
255
RH
% O
R M
Cc
%
w12_MCc1w12_MCc2w12_MCc3w12_MCc4w12_MCc5w12_MCc6w12_RHc_3w12_RHc_4168 per. Mov. Avg. (w12_MCc1)168 per. Mov. Avg. (w12_MCc2)168 per. Mov. Avg. (w12_MCc3)168 per. Mov. Avg. (w12_MCc4)168 per. Mov. Avg. (w12_MCc5)168 per. Mov. Avg. (w12_MCc6)168 per. Mov. Avg. (w12_RHc_3)168 per. Mov. Avg. (w12_RHc_4)