Embed Size (px)
Citation preview
Washington University School of Medicine Washington University School of Medicine
Digital Commons@Becker Digital Commons@Becker
Open Access Publications
2020
Comparing transplant outcomes in ALL patients after Comparing transplant outcomes in ALL patients after
haploidentical with PTCy or matched unrelated donor haploidentical with PTCy or matched unrelated donor
transplantation transplantation
Monzr M. Al Malki
Francesca Ferraro
Armin Ghobadi
et al.
Follow this and additional works at: https://digitalcommons.wustl.edu/open_access_pubs
REGULAR ARTICLE
Comparing transplant outcomes in ALL patients after haploidentical withPTCy or matched unrelated donor transplantation
Monzr M. Al Malki,1 Dongyun Yang,2 Myriam Labopin,3 Boris Afanasyev,4 Emanuele Angelucci,5 Asad Bashey,6 Gerard Socie,7
Amado Karduss-Urueta,8 Grzegorz Helbig,9 Martin Bornhauser,10 Riitta Niittyvuopio,11 Arnold Ganser,12 Fabio Ciceri,13 Arne Brecht,14
Yener Koc,15 Nelli Bejanyan,16 Francesca Ferraro,17 Partow Kebriaei,18 Sally Mokhtari,19 Armin Ghobadi,17 Ryotaro Nakamura,1
Stephen J. Forman,1 Richard Champlin,18 Mohamad Mohty,3,* Stefan O. Ciurea,18,* and Arnon Nagler3,20,21,*1Department of Hematology and Hematopoietic Cell Transplantation and 2Department of Computational Quantitative Medicine–Beckman Research Institute, City of HopeNational Medical Center, Duarte, CA; 3Department of Hematology, European Society for Blood and Marrow Transplantation (EBMT) Paris Study Office/Centros de Referenciaem Saude do Trabalhador, Hopital Saint Antoine, INSERM, Paris, France; 4Raisa Gorbacheva Memorial Institute of Children Oncology, Hematology and Transplantation,St. Petersburg, Russia; 5Ematologia e Centro Trapianti, Istituto di Ricovero e Cura a Carattere Scientifico Ospedale Policlinico San Martino, Genoa, Italy; 6The Blood and MarrowTransplant Program, Northside Hospital, Atlanta, GA; 7Department of Hematology–Bone Marrow Transplantation (BMT), Hospital St. Louis, Paris, France; 8Bone MarrowTransplant Program, Instituto de Cancerologia–Clinica Las Americas, Medellin, Colombia; 9Department of Hematology and Bone Marrow Transplantation, School of Medicine inKatowice, Medical University of Silesia, Katowice, Poland; 10University Hospital Carl Gustav Carus, Technische Universitat Dresden, Dresden, Germany; 11Stem CellTransplantation Unit, Comprehensive Cancer Center, Helsinki University Hospital, Helsinki, Finland; 12Department of Hematology, Hemostasis, Oncology, and Stem CellTransplantation, Hannover Medical School, Hannover, Germany; 13Hematology and BMT Unit, San Raffaele Scientific Institute, Milan, Italy; 14Helios Dr. Horst Schmidt KlinikenWiesbaden, Wiesbaden, Germany; 15Stem Cell Transplant Unit, Medical Park Hospitals, Antalya, Turkey; 16Division of Hematology, Oncology and Transplantation, University ofMinnesota Medical Center, Minneapolis, MN; 17Division of Oncology, Department of Internal Medicine, School of Medicine, Washington University in St. Louis, St. Louis, MO;18Department of Stem Cell Transplantation and Cellular Therapy, MD Anderson Cancer Center, Houston, TX; 19Department of Clinical Translational Project Development, City ofHope National Medical Center, Duarte, CA; 20Hematology Division, BMT Department, Chaim Sheba Medical Center, Tel Hashomer, Israel; and 21Acute Leukaemia WorkingParty, EBMT, Paris, France
Key Points
•HCT outcomes wereretrospectively com-pared between patientswith ALL who under-went haploidentical(n 5 487) or MUD(n 5 974) transplant.
•HaploHCT with PTCypatients and those un-dergoing MUD HCTwith conventionalGVHD prophylaxis(plus or minus ATG)had comparableoutcomes.
We compared outcomes of 1461 adult patients with acute lymphoblastic leukemia (ALL)
receiving hematopoietic cell transplantation (HCT) from a haploidentical (n 5 487) or
matched unrelated donor (MUD; n 5 974) between January 2005 and June 2018. Graft-
versus-host disease (GVHD) prophylaxis was posttransplant cyclophosphamide (PTCy),
calcineurin inhibitor (CNI), and mycophenolate mofetil (MMF) for haploidentical, and CNI
with MMF or methotrexate with/without antithymoglobulin for MUDs. Haploidentical
recipients were matched (1:2 ratio) with MUD controls for sex, conditioning intensity,
disease stage, Philadelphia-chromosome status, and cytogenetic risk. In the myeloablative
setting, day 128 neutrophil recovery was similar between haploidentical (87%) and MUD
(88%) (P 5 .11). Corresponding rates after reduced-intensity conditioning (RIC) were
84% and 88% (P 5 .47). The 3-month incidence of grade II-IV acute GVHD (aGVHD) and
3-year chronic GVHD (cGVHD) was similar after haploidentical compared with MUD:
myeloablative conditioning, 33% vs 34% (P 5 .46) for aGVHD and 29% vs 31% for cGVHD
(P5 .58); RIC, 31% vs 30% (P5 .06) for aGVHD and 24% vs 29% for cGVHD (P 5 .86). Among
patients receivingmyeloablative regimens, 3-year probabilities of overall survival were 44%
and 51% with haploidentical and MUD (P 5 .56). Corresponding rates after RIC were 43%
and 42% (P 5 .6). In this large multicenter case-matched retrospective analysis, despite the
limitations of a registry-based study (ie, unavailability of key elements such as minimal
residual disease testing), our analysis indicated that outcomes of patients with ALL
undergoing HCT from a haploidentical donor were comparable with 8 of 8 MUD
transplantations.
Submitted 14 January 2020; accepted 2 April 2020; published online 12 May 2020.DOI 10.1182/bloodadvances.2020001499.
*M.M., S.O.C., and A.N. contributed equally to this work.
Data-sharing requests may be e-mailed to the corresponding author, Monzr M. Al Malki,at [email protected] full-text version of this article contains a data supplement.© 2020 by The American Society of Hematology
12 MAY 2020 x VOLUME 4, NUMBER 9 2073
Dow
nloaded from https://ashpublications.org/bloodadvances/article-pdf/4/9/2073/1728696/advancesadv2020001499.pdf by W
ASHIN
GTO
N U
NIVER
SITY SCH
OO
L user on 11 September 2020
Introduction
Allogeneic hematopoietic cell transplantation (HCT; alloHCT) is thetreatment of choice for most adult patients with acute lymphoblasticleukemia (ALL).1-5 Unfortunately, donor availability remains as oneof the major challenges for transplant success in this patientpopulation. Although HLA matched sibling donors are the preferreddonors for alloHCT, such donors are available for,30% of patients.For patients with no matched sibling donor, transplant from amatched unrelated donor (MUD) has similar transplant outcomes.6
Although the likelihood of finding an 8 of 8 MUD for the whitepopulation is ;70%, this probability falls to ,20% for AfricanAmericans and other ethnic minorities,7 and becomes even morechallenging for mixed-race individuals.8 Unfortunately, an averageof 3 to 4 months is required to identify a MUD and procurehematopoietic progenitor cells.9
Over the last decade, haploidentical donors have evolved asan alternative source of donor cells. More than 95% of patientshave at least 1 HLA-haploidentical first-degree donor with anaverage number of haploidentical donors available per patient of2.7.10,11 Historically, the success of T-cell–replete haploidenticalHCT (HaploHCT) was limited by high rates of graft rejection,graft-versus-host disease (GVHD), and nonrelapse mortality(NRM).12 In recent years, administration of high-dose posttrans-plant cyclophosphamide (PTCy), a calcineurin inhibitor (CNI; ie,tacrolimus, cyclosporine), in combination with mycophenolatemofetil (MMF) for GVHD prophylaxis after HaploHCT, has shownlower rates of NRM without significantly compromising engraft-ment, and comparable rates of GVHD to transplantation froma matched donor.13,14 Using this strategy, the risk of fatalinfections was also lower, due to the more effective immunereconstitution, presumably related to retaining more memoryT cells in the graft.15
Several single-center and registry-based studies have comparedT-cell–replete HaploHCT with matched donor transplants in acutemyeloid leukemia and lymphomas, and reported similar outcomesbetween these donor sources.16-22 More recently, 2 retrospectivestudies have described favorable outcomes of patients with ALLundergoing HaploHCT with PTCy23,24; a recent retrospectivestudy by the European Society for Blood and Marrow Trans-plantation (EBMT) indicated that outcomes of adult patients withALL who underwent HaploHCT with or without antithymoglobulin(ATG; n 5 136) in their first remission are comparable to MUD(n 5 809) or mismatched unrelated donor (n 5 289) trans-plants.25 The current study is a matched-pair analysis with detailedcomparison of transplant outcomes in ALL patients who un-derwent HaploHCT with PTCy-based GVHD prophylaxis andMUD transplant.
Patients and methods
Data retrieval and inclusion criteria
For patients who underwent MUD HCT (n 5 2871), data wereprovided from the Acute Leukemia Working Party (ALWP) of theEBMT group registry. The EBMT registry is the largest database ofHCT patients in Europe, with .600 transplant centers reporting allconsecutive HCTs and follow-up data once a year. For patients whounderwent HaploHCT, data were obtained from the HaploidenticalTransplant and Cellular Therapy–Research Consortium (TCT-RC)
(n 5 181) and the ALWP of the EBMT (n 5 382). The TCT-RCis a voluntary working group of 6 transplant centers. Partici-pating centers to this analysis include City of Hope NationalMedical Center (Duarte, CA; n 5 25), MD Anderson CancerCenter (Houston, TX; n 5 43), Northside Hospital (Atlanta, GA;n 5 48), Instituto de Cancerologia–Clinica Las Americas(Medellin, Colombia; n 5 23), Moffitt Cancer Center (Tampa,FL; n 5 17), and Washington University in St. Louis (St. Louis,MO; n 5 13).
Adult patients with ALL over 18 years of age who received theirfirst alloHCT between January 2005 and June 2018 wereincluded. Recipients of HaploHCT (mismatched at least 2 ormore HLA loci to donors) received predominantly bone marrow(BM) or unmanipulated peripheral blood (PB) stem cells (PBSCs)or as the graft source. GVHD prophylaxis for HaploHCT patientsconsisted of PTCy (50 mg/kg for 2 days), a CNI, and MMF.Recipients of MUD HCT (8 of 8 matched at the allele level atHLA-A, -B, -C, and -DRB1) received unmanipulated graft (PBSCor BM) and GVHD prophylaxis consisting of a CNI andminimethotrexate or MMF. ATG was added in 64% of MUDHCTs. Patients received either myeloablative conditioning (MAC)or reduced-intensity conditioning (RIC) regimens according topreviously accepted criteria.26 Patients with unknown sex orconditioning intensity (n 5 36), HaploHCT recipients whoreceived ATG as GVHD prophylaxis (n 5 30), or patients whowere alive but were followed for ,100 days (n 5 176) wereexcluded. The institutional review boards of all participatingcenters approved this study.
End points
Overall survival (OS) was defined as time from transplant to deathfrom any cause. Surviving patients were censored at the lastcontact. Relapse-free survival (RFS) was defined as time fromtransplant to disease relapse or death of any cause, whichevercame first. RFS was censored at last contact if patients remainedalive and disease-free. GVHD-free RFS events were defined asthe earliest occurrence of grade III-IV acute GVHD, extensivechronic GVHD, disease relapse, or death from any cause sincetransplant. Neutrophil recovery was defined as achieving anabsolute neutrophil count of$0.53 109/L for 3 consecutive days.Acute and chronic GVHD were graded using standardcriteria.27,28 NRM was defined as time from transplant to deathin continuous complete remission. Relapse was defined as timefrom transplant to morphologic, cytogenetic, or molecularleukemia recurrence. NRM and relapse were competing riskevents to each other.
Statistical analysis
Eligible patients with ALL who underwent HaploHCT at 6 TCT-RCcenters and the ALWP of the EBMT (n 5 512) were matched ata 1:2 ratio with MUD recipients from the EBMT database (n 52680), based on recipient sex, cytogenetic risk, Philadelphia-chromosome status, disease stage, and conditioning intensity.MUD recipients were randomly selected if their ratio of MUD toHaplo was .2:1 in matching strata. HaploHCT patients who had,2 matched MUD controls were excluded from the analyses (n 525). Differences in other baseline patient, donor, and diseasecharacteristics by donor type were compared using x2 tests orWilcoxon tests whenever appropriate. Multivariable Cox regression
2074 AL MALKI et al 12 MAY 2020 x VOLUME 4, NUMBER 9
Dow
nloaded from https://ashpublications.org/bloodadvances/article-pdf/4/9/2073/1728696/advancesadv2020001499.pdf by W
ASHIN
GTO
N U
NIVER
SITY SCH
OO
L user on 11 September 2020
models were constructed to examine the differences in OS or RFSby donor type when adjusting for the covariates, and classified bymatching strata. Multivariable Fine and Gray models were used toassess the differences in NRM, relapse, neutrophil engraftment, andacute or chronic GVHD by donor type when controlling forcovariates, and were classified by matching strata. Backwardstepwise selection at the 0.1 level was used to include covariatesin each final multivariable model. The following covariates wereconsidered: age (,30 years, 30-39 years, 40-54 years, and $55years), Karnofsky Performance Status (KPS), disease type,months from diagnosis to transplant (#6 months, .6-12 months,and.12 months), female donor to male recipient, donor/recipientcytomegalovirus (CMV) serostatus, graft source, and transplantera. Total-body irradiation–based MAC was also considered in themodels among patients who received this conditioning regimen.The robust sandwich estimates29 were used to take intracentercorrelation (center-effect correlations) into account for the Coxand Fine and Gray regression models. Differences in clinicaloutcomes by donor type were examined in all patients overall, andby conditioning intensity, separately. The assumption of propor-tionality was examined using plots of the scaled Schoenfeldresiduals or the cumulative sums of residuals and correspondingtests.30,31
Statistical analyses were conducted using SAS 9.4 (SAS Institute,Cary, NC). Two-sided P values were reported. A significance levelof .05 was used for all tests.
Results
Patient, disease, and transplant characteristics
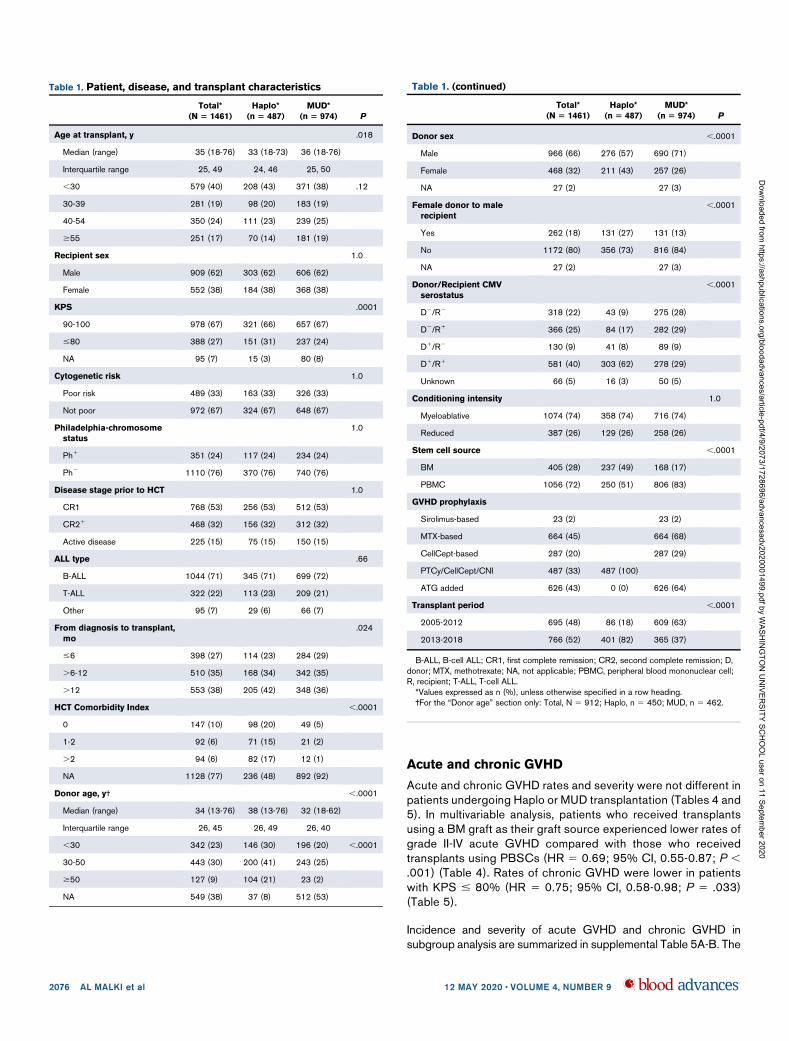
Table 1 shows patient, disease, and transplant characteristics.Matches were sought for the main variables known to impact outcomeof transplant (ie, cytogenetic risk, Philadelphia-chromosome status,disease stage prior to HCT, sex, and conditioning intensity).Compared with MUD, HaploHCT recipients were younger in age(median age at HCT of 33 years vs 36 years; P 5 .02), receivedtransplant at a later time after diagnosis (time from diagnosis totransplant .12 months in 42% vs 36%; P 5 .02), received stemcells from an older donor (median donor age of 38 years vs32 years; P , .0001) or a female donor (female donor to malerecipient in 27% vs 13%; P , .0001), and were more likely toreceive BM as the graft source (49% vs 17%; P , .0001).
GVHD prophylaxis in HaploHCT patients consisted of PTCy, a CNI,and MMF (100%), and MUD patients received a CNI in 98% (orsirolimus 2%) with methotrexate (68%) and/or MMF (29%). Themajority of HaploHCT recipients received transplants after 2013(82%), reflecting the recent trend in use of PTCy as a GVHDprophylaxis for this group of patients.
To investigate the impact of conditioning regimen intensity ontransplant outcomes, we divided patients into 2 subpopulations ofMAC or RIC (supplemental Table 1A). The detailed conditioningregimen is summarized in supplemental Table 1B. Within the MACgroup, total-body irradiation–based conditioning was used in 49%in the haploidentical and 75% in the MUD transplant recipients(P , .0001).
Hematopoietic recovery
Neutrophil recovery rates at day 28 post-HCT were not statisticallydifferent between Haplo (86%) and MUD (88%), (hazard ratio
[HR] 5 1.08; 95% confidence interval [CI], 0.95-1.24; P 5 .24)(supplemental Table 2). In subgroup analysis, using a multivariableregression model, when BM was used as the graft source,a significantly faster neutrophil engraftment was observed inpatients undergoing HaploHCT (HR 5 1.27; 95% CI, 1.01-1.59;P5 .038). Engraftment was not different in patients who underwenta transplant in first complete remission (CR1), or received MAC orRIC, and PBSCs as the graft source in Haplo vs MUD HCT(supplemental Table 3).
Survival outcomes
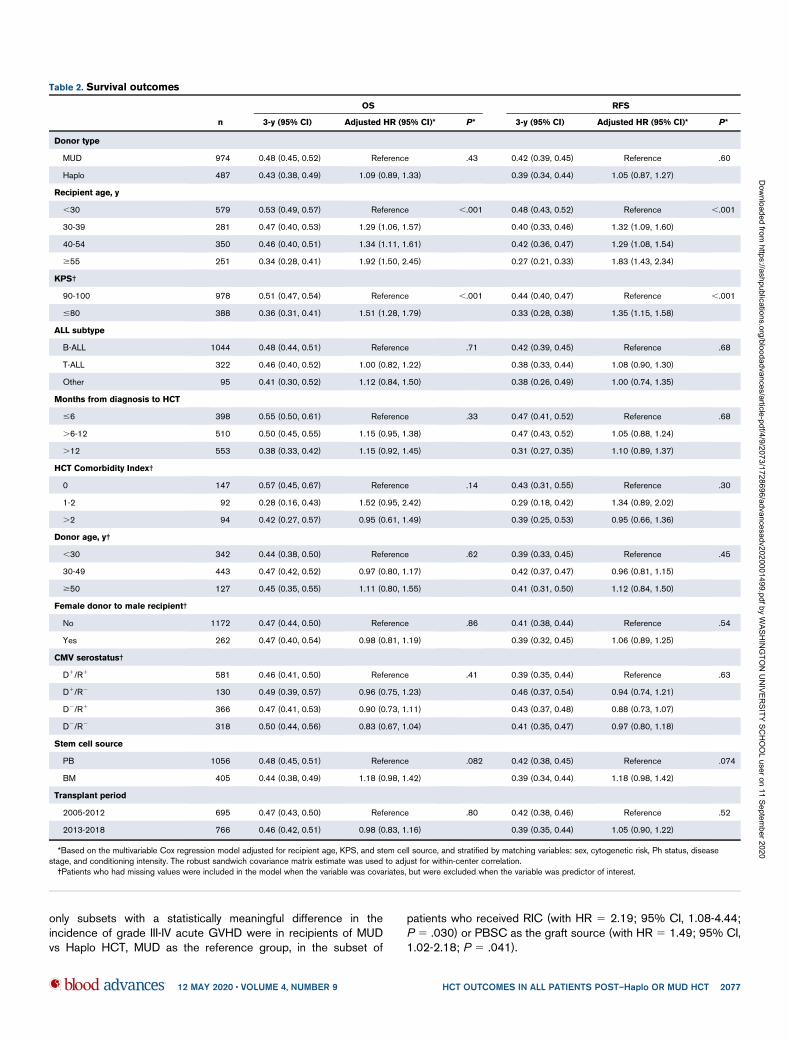
With a median follow-up of 3.0 years (range, 0.3-12.6 years), OSand RFS at 3 years posttransplant were not different betweenrecipients of Haplo and MUD HCT (OS [HR5 1.09; 95% CI, 0.89-1.33; P 5 .43]; RFS [HR 5 1.05; 95% CI, 0.87-1.27; P 5 .60])(Table 2). The 3-year probabilities of GVHD-free RFS for this cohortwas 31% (95% CI, 26% to 37%) in HaploHCT as compared with32% (95% CI, 29% to 36%) in MUD HCT recipients (HR 5 1.06;95% CI, 0.91-1.22; P 5 .47).
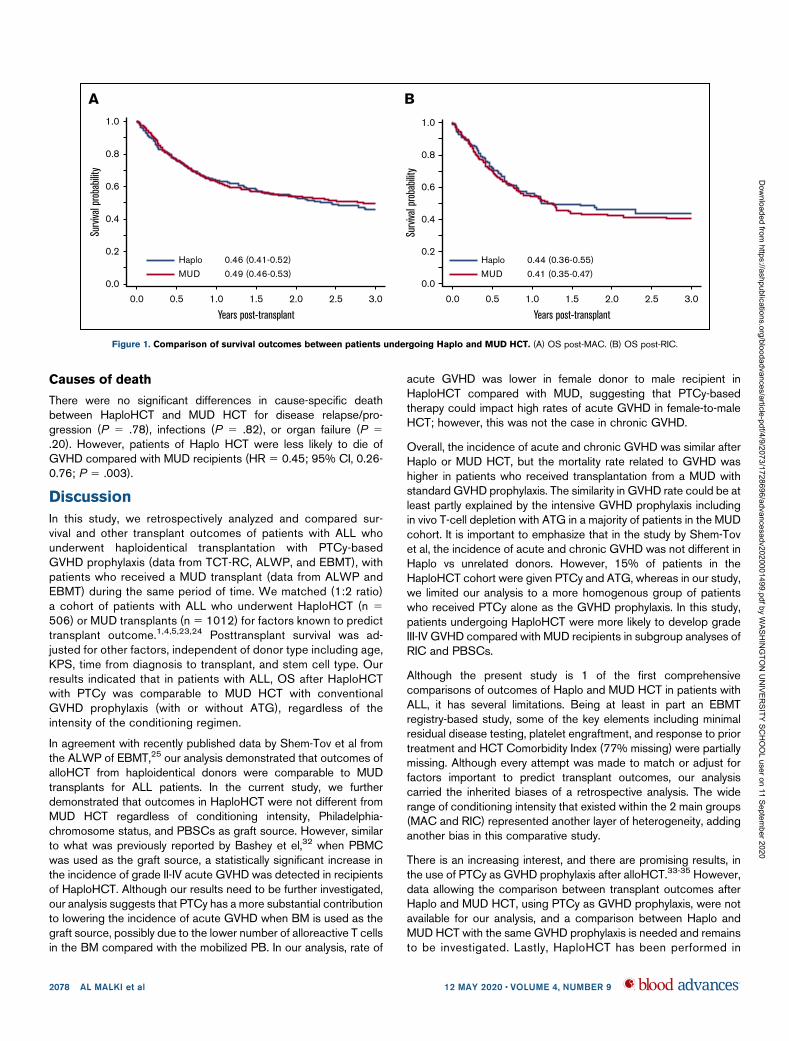
In multivariable analysis, when recipient age above 30 years wasassigned as the reference, HRs of 1.29 (95% CI, 1.06-1.57),1.34 (95% CI, 1.11-1.61), and 1.92 (95% CI, 1.50-2.45) wereachieved for recipient ages at 30 to 39 years, 40 to 54 years, and$55 years, respectively (P , .001); KPS of #80% (HR 5 1.51;95% CI, 1.28-1.79; P, .001) was also found to be a predictor oflower 3-year OS and RFS (Table 2). Other variables testedusing the regression model, including ALL subtype, time fromdiagnosis to transplant, donor age and sex, CMV status, andstem cell source, were not predictors of survival outcomes. Insubgroup analysis, no differences were detected when survivaloutcomes were compared between recipients of Haplo andMUD HCT based on the intensity of conditioning regimen(Figure 1), remission status (CR1), graft source, and differentdisease groups of Ph1 ALL, Ph2 ALL, and T-cell ALL (supplementalTable 3).
Approximately two-thirds of the MUD HCT recipients (64%)received ATG (Table 1). When we investigated the effect of ATGadministration on survival outcomes, no statistical significancewas detected. Compared with haploidentical transplants, mor-tality risks for non-ATG and ATG-containing regimens in MUDHCT recipients were similar (HR 5 0.86; 95% CI, 0.68-1.09;P 5. 22).
Relapse and NRM
In multivariable analysis, after adjusting for potential confounders,age above 40 years predicted for higher rate of NRM at 3 yearspost-HCT (HR 5 1.33 [95% CI, 1.01-1.76] and 1.73 [95% CI,1.26-2.36] for 40-54 years and$55 years, respectively; P, .001).Moreover, KPS #80 also predicted for higher NRM (with HR 51.50 [95% CI, 1.18-1.89]; P , .001). ALL subtype, months fromdiagnosis to HCT, female donor to male recipient, donor age, CMVstatus, and stem cell source did not affect either NRM or relapse(Table 3).
In the subgroup analysis, no differences were noted in eitherdisease relapse or NRM when recipients of Haplo and MUD HCTwere compared based on intensity of the conditioning regimen,CR1 status, Philadelphia-chromosome status, and graft source(supplemental Table 4).
12 MAY 2020 x VOLUME 4, NUMBER 9 HCT OUTCOMES IN ALL PATIENTS POST–Haplo OR MUD HCT 2075
Dow
nloaded from https://ashpublications.org/bloodadvances/article-pdf/4/9/2073/1728696/advancesadv2020001499.pdf by W
ASHIN
GTO
N U
NIVER
SITY SCH
OO
L user on 11 September 2020
Acute and chronic GVHD
Acute and chronic GVHD rates and severity were not different inpatients undergoing Haplo or MUD transplantation (Tables 4 and5). In multivariable analysis, patients who received transplantsusing a BM graft as their graft source experienced lower rates ofgrade II-IV acute GVHD compared with those who receivedtransplants using PBSCs (HR 5 0.69; 95% CI, 0.55-0.87; P ,.001) (Table 4). Rates of chronic GVHD were lower in patientswith KPS # 80% (HR 5 0.75; 95% CI, 0.58-0.98; P 5 .033)(Table 5).
Incidence and severity of acute GVHD and chronic GVHD insubgroup analysis are summarized in supplemental Table 5A-B. The
Table 1. Patient, disease, and transplant characteristics
Total*
(N 5 1461)
Haplo*
(n 5 487)
MUD*
(n 5 974) P
Age at transplant, y .018
Median (range) 35 (18-76) 33 (18-73) 36 (18-76)
Interquartile range 25, 49 24, 46 25, 50
,30 579 (40) 208 (43) 371 (38) .12
30-39 281 (19) 98 (20) 183 (19)
40-54 350 (24) 111 (23) 239 (25)
$55 251 (17) 70 (14) 181 (19)
Recipient sex 1.0
Male 909 (62) 303 (62) 606 (62)
Female 552 (38) 184 (38) 368 (38)
KPS .0001
90-100 978 (67) 321 (66) 657 (67)
#80 388 (27) 151 (31) 237 (24)
NA 95 (7) 15 (3) 80 (8)
Cytogenetic risk 1.0
Poor risk 489 (33) 163 (33) 326 (33)
Not poor 972 (67) 324 (67) 648 (67)
Philadelphia-chromosome
status
1.0
Ph1 351 (24) 117 (24) 234 (24)
Ph2 1110 (76) 370 (76) 740 (76)
Disease stage prior to HCT 1.0
CR1 768 (53) 256 (53) 512 (53)
CR21 468 (32) 156 (32) 312 (32)
Active disease 225 (15) 75 (15) 150 (15)
ALL type .66
B-ALL 1044 (71) 345 (71) 699 (72)
T-ALL 322 (22) 113 (23) 209 (21)
Other 95 (7) 29 (6) 66 (7)
From diagnosis to transplant,
mo
.024
#6 398 (27) 114 (23) 284 (29)
.6-12 510 (35) 168 (34) 342 (35)
.12 553 (38) 205 (42) 348 (36)
HCT Comorbidity Index ,.0001
0 147 (10) 98 (20) 49 (5)
1-2 92 (6) 71 (15) 21 (2)
.2 94 (6) 82 (17) 12 (1)
NA 1128 (77) 236 (48) 892 (92)
Donor age, y† ,.0001
Median (range) 34 (13-76) 38 (13-76) 32 (18-62)
Interquartile range 26, 45 26, 49 26, 40
,30 342 (23) 146 (30) 196 (20) ,.0001
30-50 443 (30) 200 (41) 243 (25)
$50 127 (9) 104 (21) 23 (2)
NA 549 (38) 37 (8) 512 (53)
Table 1. (continued)
Total*
(N 5 1461)
Haplo*
(n 5 487)
MUD*
(n 5 974) P
Donor sex ,.0001
Male 966 (66) 276 (57) 690 (71)
Female 468 (32) 211 (43) 257 (26)
NA 27 (2) 27 (3)
Female donor to male
recipient
,.0001
Yes 262 (18) 131 (27) 131 (13)
No 1172 (80) 356 (73) 816 (84)
NA 27 (2) 27 (3)
Donor/Recipient CMV
serostatus
,.0001
D2/R2 318 (22) 43 (9) 275 (28)
D2/R1 366 (25) 84 (17) 282 (29)
D1/R2 130 (9) 41 (8) 89 (9)
D1/R1 581 (40) 303 (62) 278 (29)
Unknown 66 (5) 16 (3) 50 (5)
Conditioning intensity 1.0
Myeloablative 1074 (74) 358 (74) 716 (74)
Reduced 387 (26) 129 (26) 258 (26)
Stem cell source ,.0001
BM 405 (28) 237 (49) 168 (17)
PBMC 1056 (72) 250 (51) 806 (83)
GVHD prophylaxis
Sirolimus-based 23 (2) 23 (2)
MTX-based 664 (45) 664 (68)
CellCept-based 287 (20) 287 (29)
PTCy/CellCept/CNI 487 (33) 487 (100)
ATG added 626 (43) 0 (0) 626 (64)
Transplant period ,.0001
2005-2012 695 (48) 86 (18) 609 (63)
2013-2018 766 (52) 401 (82) 365 (37)
B-ALL, B-cell ALL; CR1, first complete remission; CR2, second complete remission; D,donor; MTX, methotrexate; NA, not applicable; PBMC, peripheral blood mononuclear cell;R, recipient; T-ALL, T-cell ALL.*Values expressed as n (%), unless otherwise specified in a row heading.†For the “Donor age” section only: Total, N 5 912; Haplo, n 5 450; MUD, n 5 462.
2076 AL MALKI et al 12 MAY 2020 x VOLUME 4, NUMBER 9
Dow
nloaded from https://ashpublications.org/bloodadvances/article-pdf/4/9/2073/1728696/advancesadv2020001499.pdf by W
ASHIN
GTO
N U
NIVER
SITY SCH
OO
L user on 11 September 2020
only subsets with a statistically meaningful difference in theincidence of grade III-IV acute GVHD were in recipients of MUDvs Haplo HCT, MUD as the reference group, in the subset of
patients who received RIC (with HR 5 2.19; 95% CI, 1.08-4.44;P 5 .030) or PBSC as the graft source (with HR 5 1.49; 95% CI,1.02-2.18; P 5 .041).
Table 2. Survival outcomes
n
OS RFS
3-y (95% CI) Adjusted HR (95% CI)* P* 3-y (95% CI) Adjusted HR (95% CI)* P*
Donor type
MUD 974 0.48 (0.45, 0.52) Reference .43 0.42 (0.39, 0.45) Reference .60
Haplo 487 0.43 (0.38, 0.49) 1.09 (0.89, 1.33) 0.39 (0.34, 0.44) 1.05 (0.87, 1.27)
Recipient age, y
,30 579 0.53 (0.49, 0.57) Reference ,.001 0.48 (0.43, 0.52) Reference ,.001
30-39 281 0.47 (0.40, 0.53) 1.29 (1.06, 1.57) 0.40 (0.33, 0.46) 1.32 (1.09, 1.60)
40-54 350 0.46 (0.40, 0.51) 1.34 (1.11, 1.61) 0.42 (0.36, 0.47) 1.29 (1.08, 1.54)
$55 251 0.34 (0.28, 0.41) 1.92 (1.50, 2.45) 0.27 (0.21, 0.33) 1.83 (1.43, 2.34)
KPS†
90-100 978 0.51 (0.47, 0.54) Reference ,.001 0.44 (0.40, 0.47) Reference ,.001
#80 388 0.36 (0.31, 0.41) 1.51 (1.28, 1.79) 0.33 (0.28, 0.38) 1.35 (1.15, 1.58)
ALL subtype
B-ALL 1044 0.48 (0.44, 0.51) Reference .71 0.42 (0.39, 0.45) Reference .68
T-ALL 322 0.46 (0.40, 0.52) 1.00 (0.82, 1.22) 0.38 (0.33, 0.44) 1.08 (0.90, 1.30)
Other 95 0.41 (0.30, 0.52) 1.12 (0.84, 1.50) 0.38 (0.26, 0.49) 1.00 (0.74, 1.35)
Months from diagnosis to HCT
#6 398 0.55 (0.50, 0.61) Reference .33 0.47 (0.41, 0.52) Reference .68
.6-12 510 0.50 (0.45, 0.55) 1.15 (0.95, 1.38) 0.47 (0.43, 0.52) 1.05 (0.88, 1.24)
.12 553 0.38 (0.33, 0.42) 1.15 (0.92, 1.45) 0.31 (0.27, 0.35) 1.10 (0.89, 1.37)
HCT Comorbidity Index†
0 147 0.57 (0.45, 0.67) Reference .14 0.43 (0.31, 0.55) Reference .30
1-2 92 0.28 (0.16, 0.43) 1.52 (0.95, 2.42) 0.29 (0.18, 0.42) 1.34 (0.89, 2.02)
.2 94 0.42 (0.27, 0.57) 0.95 (0.61, 1.49) 0.39 (0.25, 0.53) 0.95 (0.66, 1.36)
Donor age, y†
,30 342 0.44 (0.38, 0.50) Reference .62 0.39 (0.33, 0.45) Reference .45
30-49 443 0.47 (0.42, 0.52) 0.97 (0.80, 1.17) 0.42 (0.37, 0.47) 0.96 (0.81, 1.15)
$50 127 0.45 (0.35, 0.55) 1.11 (0.80, 1.55) 0.41 (0.31, 0.50) 1.12 (0.84, 1.50)
Female donor to male recipient†
No 1172 0.47 (0.44, 0.50) Reference .86 0.41 (0.38, 0.44) Reference .54
Yes 262 0.47 (0.40, 0.54) 0.98 (0.81, 1.19) 0.39 (0.32, 0.45) 1.06 (0.89, 1.25)
CMV serostatus†
D1/R1 581 0.46 (0.41, 0.50) Reference .41 0.39 (0.35, 0.44) Reference .63
D1/R2 130 0.49 (0.39, 0.57) 0.96 (0.75, 1.23) 0.46 (0.37, 0.54) 0.94 (0.74, 1.21)
D2/R1 366 0.47 (0.41, 0.53) 0.90 (0.73, 1.11) 0.43 (0.37, 0.48) 0.88 (0.73, 1.07)
D2/R2 318 0.50 (0.44, 0.56) 0.83 (0.67, 1.04) 0.41 (0.35, 0.47) 0.97 (0.80, 1.18)
Stem cell source
PB 1056 0.48 (0.45, 0.51) Reference .082 0.42 (0.38, 0.45) Reference .074
BM 405 0.44 (0.38, 0.49) 1.18 (0.98, 1.42) 0.39 (0.34, 0.44) 1.18 (0.98, 1.42)
Transplant period
2005-2012 695 0.47 (0.43, 0.50) Reference .80 0.42 (0.38, 0.46) Reference .52
2013-2018 766 0.46 (0.42, 0.51) 0.98 (0.83, 1.16) 0.39 (0.35, 0.44) 1.05 (0.90, 1.22)
*Based on the multivariable Cox regression model adjusted for recipient age, KPS, and stem cell source, and stratified by matching variables: sex, cytogenetic risk, Ph status, diseasestage, and conditioning intensity. The robust sandwich covariance matrix estimate was used to adjust for within-center correlation.†Patients who had missing values were included in the model when the variable was covariates, but were excluded when the variable was predictor of interest.
12 MAY 2020 x VOLUME 4, NUMBER 9 HCT OUTCOMES IN ALL PATIENTS POST–Haplo OR MUD HCT 2077
Dow
nloaded from https://ashpublications.org/bloodadvances/article-pdf/4/9/2073/1728696/advancesadv2020001499.pdf by W
ASHIN
GTO
N U
NIVER
SITY SCH
OO
L user on 11 September 2020
Causes of death
There were no significant differences in cause-specific deathbetween HaploHCT and MUD HCT for disease relapse/pro-gression (P 5 .78), infections (P 5 .82), or organ failure (P 5.20). However, patients of Haplo HCT were less likely to die ofGVHD compared with MUD recipients (HR 5 0.45; 95% CI, 0.26-0.76; P 5 .003).
Discussion
In this study, we retrospectively analyzed and compared sur-vival and other transplant outcomes of patients with ALL whounderwent haploidentical transplantation with PTCy-basedGVHD prophylaxis (data from TCT-RC, ALWP, and EBMT), withpatients who received a MUD transplant (data from ALWP andEBMT) during the same period of time. We matched (1:2 ratio)a cohort of patients with ALL who underwent HaploHCT (n 5506) or MUD transplants (n 5 1012) for factors known to predicttransplant outcome.1,4,5,23,24 Posttransplant survival was ad-justed for other factors, independent of donor type including age,KPS, time from diagnosis to transplant, and stem cell type. Ourresults indicated that in patients with ALL, OS after HaploHCTwith PTCy was comparable to MUD HCT with conventionalGVHD prophylaxis (with or without ATG), regardless of theintensity of the conditioning regimen.
In agreement with recently published data by Shem-Tov et al fromthe ALWP of EBMT,25 our analysis demonstrated that outcomes ofalloHCT from haploidentical donors were comparable to MUDtransplants for ALL patients. In the current study, we furtherdemonstrated that outcomes in HaploHCT were not different fromMUD HCT regardless of conditioning intensity, Philadelphia-chromosome status, and PBSCs as graft source. However, similarto what was previously reported by Bashey et el,32 when PBMCwas used as the graft source, a statistically significant increase inthe incidence of grade II-IV acute GVHD was detected in recipientsof HaploHCT. Although our results need to be further investigated,our analysis suggests that PTCy has a more substantial contributionto lowering the incidence of acute GVHD when BM is used as thegraft source, possibly due to the lower number of alloreactive T cellsin the BM compared with the mobilized PB. In our analysis, rate of
acute GVHD was lower in female donor to male recipient inHaploHCT compared with MUD, suggesting that PTCy-basedtherapy could impact high rates of acute GVHD in female-to-maleHCT; however, this was not the case in chronic GVHD.
Overall, the incidence of acute and chronic GVHD was similar afterHaplo or MUD HCT, but the mortality rate related to GVHD washigher in patients who received transplantation from a MUD withstandard GVHD prophylaxis. The similarity in GVHD rate could be atleast partly explained by the intensive GVHD prophylaxis includingin vivo T-cell depletion with ATG in a majority of patients in the MUDcohort. It is important to emphasize that in the study by Shem-Tovet al, the incidence of acute and chronic GVHD was not different inHaplo vs unrelated donors. However, 15% of patients in theHaploHCT cohort were given PTCy and ATG, whereas in our study,we limited our analysis to a more homogenous group of patientswho received PTCy alone as the GVHD prophylaxis. In this study,patients undergoing HaploHCT were more likely to develop gradeIII-IV GVHD compared with MUD recipients in subgroup analyses ofRIC and PBSCs.
Although the present study is 1 of the first comprehensivecomparisons of outcomes of Haplo and MUD HCT in patients withALL, it has several limitations. Being at least in part an EBMTregistry-based study, some of the key elements including minimalresidual disease testing, platelet engraftment, and response to priortreatment and HCT Comorbidity Index (77% missing) were partiallymissing. Although every attempt was made to match or adjust forfactors important to predict transplant outcomes, our analysiscarried the inherited biases of a retrospective analysis. The widerange of conditioning intensity that existed within the 2 main groups(MAC and RIC) represented another layer of heterogeneity, addinganother bias in this comparative study.
There is an increasing interest, and there are promising results, inthe use of PTCy as GVHD prophylaxis after alloHCT.33-35 However,data allowing the comparison between transplant outcomes afterHaplo and MUD HCT, using PTCy as GVHD prophylaxis, were notavailable for our analysis, and a comparison between Haplo andMUD HCT with the same GVHD prophylaxis is needed and remainsto be investigated. Lastly, HaploHCT has been performed in
1.0
0.8
0.6
0.4
0.2
0.0
0.0 0.5 1.0 1.5
Years post-transplant
Surv
ival p
roba
bility
2.0 2.5 3.0
Haplo 0.46 (0.41-0.52)
0.49 (0.46-0.53)MUD
A
1.0
0.8
0.6
0.4
0.2
0.0
0.0 0.5 1.0 1.5
Years post-transplant
Surv
ival p
roba
bility
2.0 2.5 3.0
Haplo 0.44 (0.36-0.55)
0.41 (0.35-0.47)MUD
B
Figure 1. Comparison of survival outcomes between patients undergoing Haplo and MUD HCT. (A) OS post-MAC. (B) OS post-RIC.
2078 AL MALKI et al 12 MAY 2020 x VOLUME 4, NUMBER 9
Dow
nloaded from https://ashpublications.org/bloodadvances/article-pdf/4/9/2073/1728696/advancesadv2020001499.pdf by W
ASHIN
GTO
N U
NIVER
SITY SCH
OO
L user on 11 September 2020
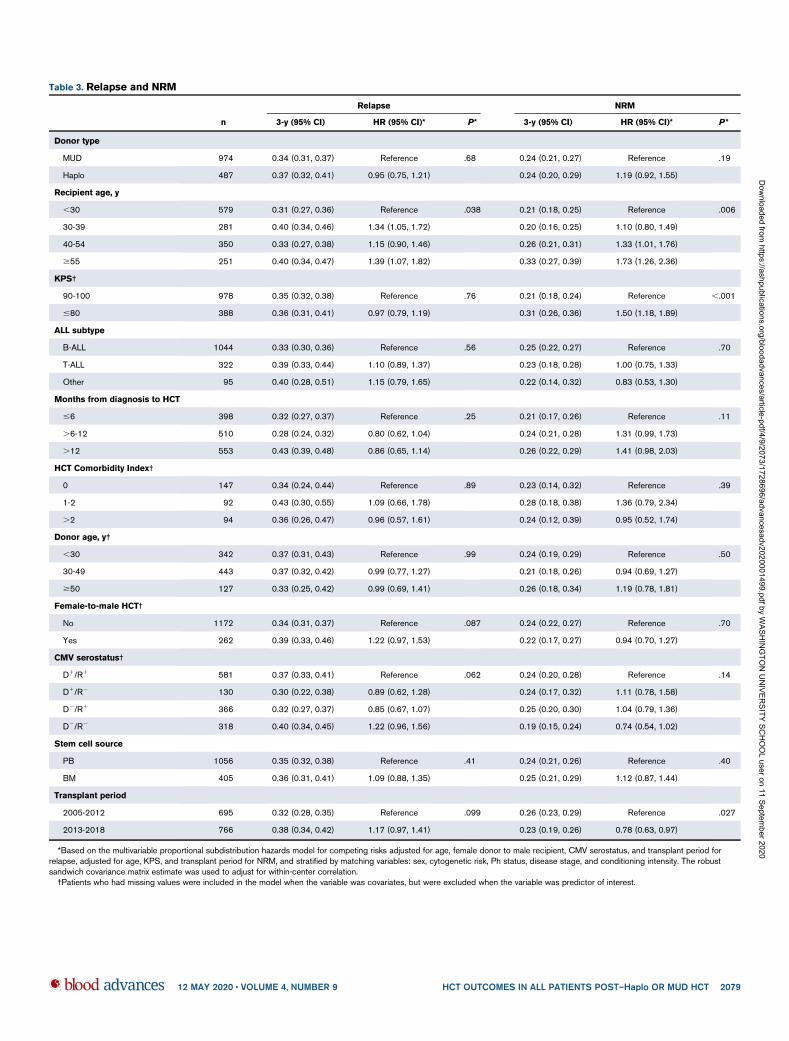
Table 3. Relapse and NRM
n
Relapse NRM
3-y (95% CI) HR (95% CI)* P* 3-y (95% CI) HR (95% CI)* P*
Donor type
MUD 974 0.34 (0.31, 0.37) Reference .68 0.24 (0.21, 0.27) Reference .19
Haplo 487 0.37 (0.32, 0.41) 0.95 (0.75, 1.21) 0.24 (0.20, 0.29) 1.19 (0.92, 1.55)
Recipient age, y
,30 579 0.31 (0.27, 0.36) Reference .038 0.21 (0.18, 0.25) Reference .006
30-39 281 0.40 (0.34, 0.46) 1.34 (1.05, 1.72) 0.20 (0.16, 0.25) 1.10 (0.80, 1.49)
40-54 350 0.33 (0.27, 0.38) 1.15 (0.90, 1.46) 0.26 (0.21, 0.31) 1.33 (1.01, 1.76)
$55 251 0.40 (0.34, 0.47) 1.39 (1.07, 1.82) 0.33 (0.27, 0.39) 1.73 (1.26, 2.36)
KPS†
90-100 978 0.35 (0.32, 0.38) Reference .76 0.21 (0.18, 0.24) Reference ,.001
#80 388 0.36 (0.31, 0.41) 0.97 (0.79, 1.19) 0.31 (0.26, 0.36) 1.50 (1.18, 1.89)
ALL subtype
B-ALL 1044 0.33 (0.30, 0.36) Reference .56 0.25 (0.22, 0.27) Reference .70
T-ALL 322 0.39 (0.33, 0.44) 1.10 (0.89, 1.37) 0.23 (0.18, 0.28) 1.00 (0.75, 1.33)
Other 95 0.40 (0.28, 0.51) 1.15 (0.79, 1.65) 0.22 (0.14, 0.32) 0.83 (0.53, 1.30)
Months from diagnosis to HCT
#6 398 0.32 (0.27, 0.37) Reference .25 0.21 (0.17, 0.26) Reference .11
.6-12 510 0.28 (0.24, 0.32) 0.80 (0.62, 1.04) 0.24 (0.21, 0.28) 1.31 (0.99, 1.73)
.12 553 0.43 (0.39, 0.48) 0.86 (0.65, 1.14) 0.26 (0.22, 0.29) 1.41 (0.98, 2.03)
HCT Comorbidity Index†
0 147 0.34 (0.24, 0.44) Reference .89 0.23 (0.14, 0.32) Reference .39
1-2 92 0.43 (0.30, 0.55) 1.09 (0.66, 1.78) 0.28 (0.18, 0.38) 1.36 (0.79, 2.34)
.2 94 0.36 (0.26, 0.47) 0.96 (0.57, 1.61) 0.24 (0.12, 0.39) 0.95 (0.52, 1.74)
Donor age, y†
,30 342 0.37 (0.31, 0.43) Reference .99 0.24 (0.19, 0.29) Reference .50
30-49 443 0.37 (0.32, 0.42) 0.99 (0.77, 1.27) 0.21 (0.18, 0.26) 0.94 (0.69, 1.27)
$50 127 0.33 (0.25, 0.42) 0.99 (0.69, 1.41) 0.26 (0.18, 0.34) 1.19 (0.78, 1.81)
Female-to-male HCT†
No 1172 0.34 (0.31, 0.37) Reference .087 0.24 (0.22, 0.27) Reference .70
Yes 262 0.39 (0.33, 0.46) 1.22 (0.97, 1.53) 0.22 (0.17, 0.27) 0.94 (0.70, 1.27)
CMV serostatus†
D1/R1 581 0.37 (0.33, 0.41) Reference .062 0.24 (0.20, 0.28) Reference .14
D1/R2 130 0.30 (0.22, 0.38) 0.89 (0.62, 1.28) 0.24 (0.17, 0.32) 1.11 (0.78, 1.58)
D2/R1 366 0.32 (0.27, 0.37) 0.85 (0.67, 1.07) 0.25 (0.20, 0.30) 1.04 (0.79, 1.36)
D2/R2 318 0.40 (0.34, 0.45) 1.22 (0.96, 1.56) 0.19 (0.15, 0.24) 0.74 (0.54, 1.02)
Stem cell source
PB 1056 0.35 (0.32, 0.38) Reference .41 0.24 (0.21, 0.26) Reference .40
BM 405 0.36 (0.31, 0.41) 1.09 (0.88, 1.35) 0.25 (0.21, 0.29) 1.12 (0.87, 1.44)
Transplant period
2005-2012 695 0.32 (0.28, 0.35) Reference .099 0.26 (0.23, 0.29) Reference .027
2013-2018 766 0.38 (0.34, 0.42) 1.17 (0.97, 1.41) 0.23 (0.19, 0.26) 0.78 (0.63, 0.97)
*Based on the multivariable proportional subdistribution hazards model for competing risks adjusted for age, female donor to male recipient, CMV serostatus, and transplant period forrelapse, adjusted for age, KPS, and transplant period for NRM, and stratified by matching variables: sex, cytogenetic risk, Ph status, disease stage, and conditioning intensity. The robustsandwich covariance matrix estimate was used to adjust for within-center correlation.†Patients who had missing values were included in the model when the variable was covariates, but were excluded when the variable was predictor of interest.
12 MAY 2020 x VOLUME 4, NUMBER 9 HCT OUTCOMES IN ALL PATIENTS POST–Haplo OR MUD HCT 2079
Dow
nloaded from https://ashpublications.org/bloodadvances/article-pdf/4/9/2073/1728696/advancesadv2020001499.pdf by W
ASHIN
GTO
N U
NIVER
SITY SCH
OO
L user on 11 September 2020

a smaller number of transplant centers (100 centers), whereasMUD HCT was performed in more centers (201 centers),representing a normal clinical practice across different small-,
mid-, and large-sized transplant centers. The center effect onHCT outcomes among Haplo and MUD recipients is warrantedand will be important.
Table 4. Acute GVHD
n
Grade II-IV acute GVHD Grade III-IV acute GVHD
100-d (95% CI) HR (95% CI)* P* 100-d (95% CI) HR (95% CI)* P*
Donor type
MUD 974 0.33 (0.30, 0.36) Reference .21 0.12 (0.10, 0.14) Reference .11
Haplo 487 0.32 (0.28, 0.37) 1.13 (0.93, 1.38) 0.14 (0.11, 0.17) 1.30 (0.94, 1.80)
Recipient age, y
,30 579 0.36 (0.32, 0.40) Reference .068 0.15 (0.12, 0.18) Reference .07
30-39 281 0.32 (0.26, 0.37) 0.85 (0.66, 1.10) 0.13 (0.09, 0.17) 0.82 (0.56, 1.22)
40-54 350 0.33 (0.28, 0.38) 0.86 (0.68, 1.09) 0.10 (0.07, 0.14) 0.63 (0.42, 0.94)
$55 251 0.27 (0.22, 0.33) 0.69 (0.52, 0.92) 0.10 (0.07, 0.14) 0.61 (0.38, 0.98)
KPS†
90-100 978 0.33 (0.30, 0.36) Reference 1.00 0.14 (0.11, 0.16) Reference .16
#80 388 0.33 (0.28, 0.38) 1.00 (0.81, 1.23) 0.10 (0.07, 0.14) 0.77 (0.53, 1.11)
ALL subtype
B-ALL 1044 0.33 (0.30, 0.36) Reference .94 0.13 (0.11, 0.15) Reference .65
T-ALL 322 0.31 (0.26, 0.36) 1.04 (0.82, 1.33) 0.10 (0.07, 0.14) 0.89 (0.58, 1.36)
Other 95 0.35 (0.25, 0.45) 1.03 (0.73, 1.43) 0.15 (0.09, 0.24) 1.19 (0.70, 2.02)
Months from diagnosis to HCT
#6 398 0.33 (0.28, 0.38) Reference .44 0.11 (0.08, 0.14) Reference .33
.6-12 510 0.35 (0.30, 0.39) 1.16 (0.91, 1.48) 0.13 (0.10, 0.16) 1.34 (0.90, 2.01)
.12 553 0.31 (0.27, 0.35) 1.05 (0.78, 1.43) 0.13 (0.11, 0.16) 1.31 (0.79, 2.16)
HCT Comorbidity Index†
0 147 0.35 (0.28, 0.43) Reference .90 0.14 (0.09, 0.20) Reference .68
1-2 92 0.37 (0.27, 0.47) 1.10 (0.73, 1.66) 0.16 (0.09, 0.24) 1.21 (0.62, 2.36)
.2 94 0.41 (0.31, 0.51) 1.07 (0.64, 1.78) 0.12 (0.06, 0.19) 0.88 (0.39, 2.00)
Donor age, y†
,30 342 0.38 (0.33, 0.43) Reference .42 0.14 (0.11, 0.18) Reference .90
30-49 443 0.34 (0.29, 0.38) 0.86 (0.68, 1.09) 0.13 (0.10, 0.16) 0.92 (0.61, 1.37)
$50 127 0.35 (0.26, 0.43) 0.97 (0.71, 1.34) 0.14 (0.08, 0.20) 0.92 (0.55, 1.54)
Female-to-male HCT†
No 1172 0.33 (0.30, 0.36) Reference .80 0.13 (0.11, 0.15) Reference .37
Yes 262 0.34 (0.28, 0.40) 1.03 (0.80, 1.32) 0.11 (0.08, 0.16) 0.82 (0.54, 1.26)
CMV serostatus†
D1/R2 581 0.31 (0.28, 0.35) Reference .88 0.11 (0.09, 0.14) Reference .43
D2/R2 130 0.34 (0.26, 0.43) 1.08 (0.78, 1.50) 0.14 (0.09, 0.21) 1.23 (0.71, 2.13)
D2/R2 366 0.33 (0.28, 0.38) 0.98 (0.78, 1.22) 0.11 (0.08, 0.14) 0.89 (0.60, 1.34)
D2/R2 318 0.36 (0.31, 0.41) 1.07 (0.84, 1.35) 0.15 (0.11, 0.19) 1.23 (0.84, 1.79)
Stem cell source
PB 1056 0.35 (0.32, 0.38) Reference .001 0.13 (0.11, 0.15) Reference .14
BM 405 0.26 (0.22, 0.31) 0.69 (0.55, 0.87) 0.10 (0.08, 0.14) 0.76 (0.53, 1.09)
Transplant period
2005-2012 695 0.32 (0.29, 0.36) Reference .42 0.12 (0.09, 0.14) Reference .31
2013-2018 766 0.33 (0.30, 0.37) 1.08 (0.90, 1.30) 0.13 (0.11, 0.16) 1.17 (0.87, 1.57)
*Based on the multivariable proportional subdistribution hazards model for competing risks adjusted for age and stem cell source, and stratified by matching variables: sex, cytogenetic risk,Ph status, disease stage, and conditioning intensity. The robust sandwich covariance matrix estimate was used to adjust for within-center correlation.†Patients who had missing values were included in the model when the variable was covariates, but were excluded when the variable was predictor of interest.
2080 AL MALKI et al 12 MAY 2020 x VOLUME 4, NUMBER 9
Dow
nloaded from https://ashpublications.org/bloodadvances/article-pdf/4/9/2073/1728696/advancesadv2020001499.pdf by W
ASHIN
GTO
N U
NIVER
SITY SCH
OO
L user on 11 September 2020
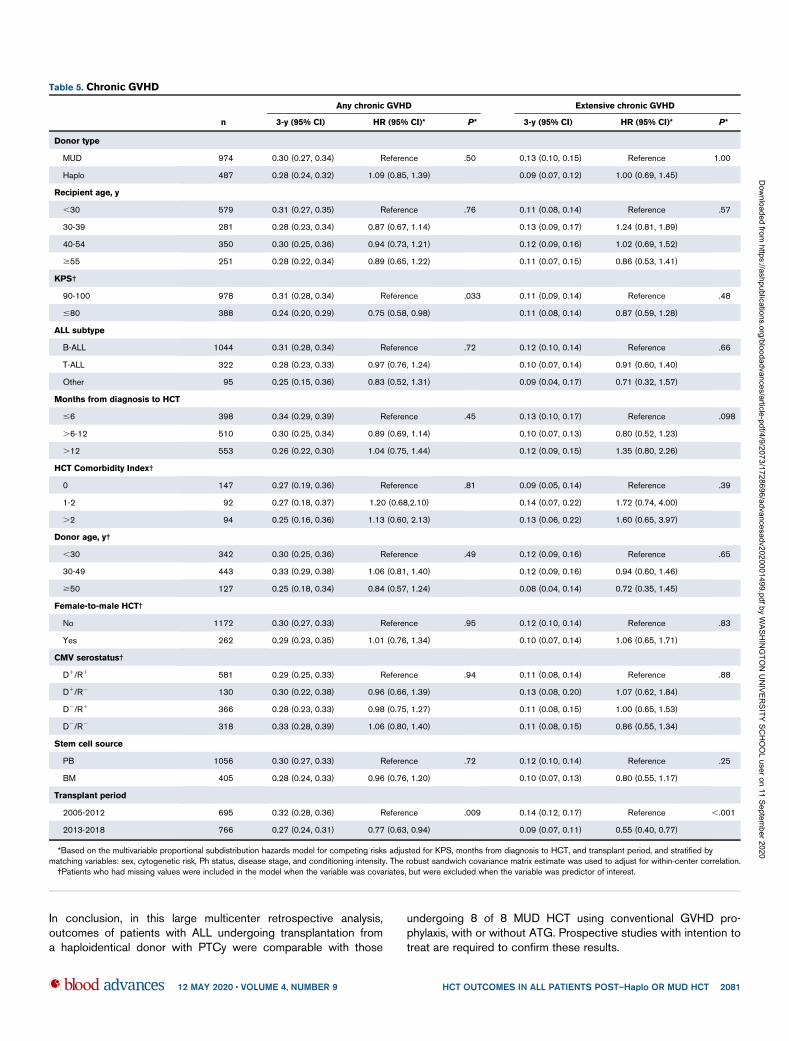
In conclusion, in this large multicenter retrospective analysis,outcomes of patients with ALL undergoing transplantation froma haploidentical donor with PTCy were comparable with those
undergoing 8 of 8 MUD HCT using conventional GVHD pro-phylaxis, with or without ATG. Prospective studies with intention totreat are required to confirm these results.
Table 5. Chronic GVHD
n
Any chronic GVHD Extensive chronic GVHD
3-y (95% CI) HR (95% CI)* P* 3-y (95% CI) HR (95% CI)* P*
Donor type
MUD 974 0.30 (0.27, 0.34) Reference .50 0.13 (0.10, 0.15) Reference 1.00
Haplo 487 0.28 (0.24, 0.32) 1.09 (0.85, 1.39) 0.09 (0.07, 0.12) 1.00 (0.69, 1.45)
Recipient age, y
,30 579 0.31 (0.27, 0.35) Reference .76 0.11 (0.08, 0.14) Reference .57
30-39 281 0.28 (0.23, 0.34) 0.87 (0.67, 1.14) 0.13 (0.09, 0.17) 1.24 (0.81, 1.89)
40-54 350 0.30 (0.25, 0.36) 0.94 (0.73, 1.21) 0.12 (0.09, 0.16) 1.02 (0.69, 1.52)
$55 251 0.28 (0.22, 0.34) 0.89 (0.65, 1.22) 0.11 (0.07, 0.15) 0.86 (0.53, 1.41)
KPS†
90-100 978 0.31 (0.28, 0.34) Reference .033 0.11 (0.09, 0.14) Reference .48
#80 388 0.24 (0.20, 0.29) 0.75 (0.58, 0.98) 0.11 (0.08, 0.14) 0.87 (0.59, 1.28)
ALL subtype
B-ALL 1044 0.31 (0.28, 0.34) Reference .72 0.12 (0.10, 0.14) Reference .66
T-ALL 322 0.28 (0.23, 0.33) 0.97 (0.76, 1.24) 0.10 (0.07, 0.14) 0.91 (0.60, 1.40)
Other 95 0.25 (0.15, 0.36) 0.83 (0.52, 1.31) 0.09 (0.04, 0.17) 0.71 (0.32, 1.57)
Months from diagnosis to HCT
#6 398 0.34 (0.29, 0.39) Reference .45 0.13 (0.10, 0.17) Reference .098
.6-12 510 0.30 (0.25, 0.34) 0.89 (0.69, 1.14) 0.10 (0.07, 0.13) 0.80 (0.52, 1.23)
.12 553 0.26 (0.22, 0.30) 1.04 (0.75, 1.44) 0.12 (0.09, 0.15) 1.35 (0.80, 2.26)
HCT Comorbidity Index†
0 147 0.27 (0.19, 0.36) Reference .81 0.09 (0.05, 0.14) Reference .39
1-2 92 0.27 (0.18, 0.37) 1.20 (0.68,2.10) 0.14 (0.07, 0.22) 1.72 (0.74, 4.00)
.2 94 0.25 (0.16, 0.36) 1.13 (0.60, 2.13) 0.13 (0.06, 0.22) 1.60 (0.65, 3.97)
Donor age, y†
,30 342 0.30 (0.25, 0.36) Reference .49 0.12 (0.09, 0.16) Reference .65
30-49 443 0.33 (0.29, 0.38) 1.06 (0.81, 1.40) 0.12 (0.09, 0.16) 0.94 (0.60, 1.46)
$50 127 0.25 (0.18, 0.34) 0.84 (0.57, 1.24) 0.08 (0.04, 0.14) 0.72 (0.35, 1.45)
Female-to-male HCT†
No 1172 0.30 (0.27, 0.33) Reference .95 0.12 (0.10, 0.14) Reference .83
Yes 262 0.29 (0.23, 0.35) 1.01 (0.76, 1.34) 0.10 (0.07, 0.14) 1.06 (0.65, 1.71)
CMV serostatus†
D1/R1 581 0.29 (0.25, 0.33) Reference .94 0.11 (0.08, 0.14) Reference .88
D1/R2 130 0.30 (0.22, 0.38) 0.96 (0.66, 1.39) 0.13 (0.08, 0.20) 1.07 (0.62, 1.84)
D2/R1 366 0.28 (0.23, 0.33) 0.98 (0.75, 1.27) 0.11 (0.08, 0.15) 1.00 (0.65, 1.53)
D2/R2 318 0.33 (0.28, 0.39) 1.06 (0.80, 1.40) 0.11 (0.08, 0.15) 0.86 (0.55, 1.34)
Stem cell source
PB 1056 0.30 (0.27, 0.33) Reference .72 0.12 (0.10, 0.14) Reference .25
BM 405 0.28 (0.24, 0.33) 0.96 (0.76, 1.20) 0.10 (0.07, 0.13) 0.80 (0.55, 1.17)
Transplant period
2005-2012 695 0.32 (0.28, 0.36) Reference .009 0.14 (0.12, 0.17) Reference ,.001
2013-2018 766 0.27 (0.24, 0.31) 0.77 (0.63, 0.94) 0.09 (0.07, 0.11) 0.55 (0.40, 0.77)
*Based on the multivariable proportional subdistribution hazards model for competing risks adjusted for KPS, months from diagnosis to HCT, and transplant period, and stratified bymatching variables: sex, cytogenetic risk, Ph status, disease stage, and conditioning intensity. The robust sandwich covariance matrix estimate was used to adjust for within-center correlation.†Patients who had missing values were included in the model when the variable was covariates, but were excluded when the variable was predictor of interest.
12 MAY 2020 x VOLUME 4, NUMBER 9 HCT OUTCOMES IN ALL PATIENTS POST–Haplo OR MUD HCT 2081
Dow
nloaded from https://ashpublications.org/bloodadvances/article-pdf/4/9/2073/1728696/advancesadv2020001499.pdf by W
ASHIN
GTO
N U
NIVER
SITY SCH
OO
L user on 11 September 2020
Acknowledgment
This work was partially supported by National Institutes of Health,National Cancer Institute grant P30CA033572 (Biostatistics Core).
Authorship
Contribution:M.M.A.M.,M.M.,S.O.C., andA.N.conceived thepresentedidea and supervised the work; D.Y. and M.L. performed the statisticalanalysis;S.M.wrote themanuscriptwith support fromM.M.A.M., S.O.C.,and A.N.; and all other authors provided critical feedback, helped shapethe research, discussed the results, and commented on themanuscript.
Conflict-of-interest disclosure: The authors declare no compet-ing financial interests.
ORCID profiles: M.M.A.M., 0000-0001-8226-471X; D.Y., 0000-0003-0736-4977; E.A., 0000-0002-6512-6080; G.H., 0000-0003-3703-1268; R. Nakamura, 0000-0002-9082-0680; R.C.,0000-0002-4314-5037.
Correspondence: Monzr M. Al Malki, Department of Hematologyand HCT, City of Hope National Medical Center, 1500 Duarte Rd,Duarte, CA 91010; e-mail: [email protected].
References
1. Cornelissen JJ, van der Holt B, Verhoef GE, et al; Dutch-Belgian HOVON Cooperative Group. Myeloablative allogeneic versus autologous stem celltransplantation in adult patients with acute lymphoblastic leukemia in first remission: a prospective sibling donor versus no-donor comparison. Blood.2009;113(6):1375-1382.
2. Fielding AK, Richards SM, Chopra R, et al; Eastern Cooperative Oncology Group. Outcome of 609 adults after relapse of acute lymphoblastic leukemia(ALL); an MRC UKALL12/ECOG 2993 study. Blood. 2007;109(3):944-950.
3. Goldstone AH, Richards SM, Lazarus HM, et al. In adults with standard-risk acute lymphoblastic leukemia, the greatest benefit is achieved froma matched sibling allogeneic transplantation in first complete remission, and an autologous transplantation is less effective than conventionalconsolidation/maintenance chemotherapy in all patients: final results of the International ALL Trial (MRC UKALL XII/ECOGE2993). Blood. 2008;111(4):1827-1833.
4. Thomas X, Boiron JM, Huguet F, et al. Outcome of treatment in adults with acute lymphoblastic leukemia: analysis of the LALA-94 trial. J Clin Oncol.2004;22(20):4075-4086.
5. Lee S, Cho B-S, Kim S-Y, et al. Allogeneic stem cell transplantation in first complete remission enhances graft-versus-leukemia effect in adults with acutelymphoblastic leukemia: antileukemic activity of chronic graft-versus-host disease. Biol Blood Marrow Transplant. 2007;13(9):1083-1094.
6. Ottinger HD, Ferencik S, Beelen DW, et al. Hematopoietic stem cell transplantation: contrasting the outcome of transplantations from HLA-identicalsiblings, partially HLA-mismatched related donors, and HLA-matched unrelated donors. Blood. 2003;102(3):1131-1137.
7. Gragert L, Eapen M, Williams E, et al. HLA match likelihoods for hematopoietic stem-cell grafts in the U.S. registry. N Engl J Med. 2014;371(4):339-348.
8. Bayraktar UD, Champlin RE, Ciurea SO. Progress in haploidentical stem cell transplantation. Biol Blood Marrow Transplant. 2012;18(3):372-380.
9. Johansen KA, Schneider JF, McCaffree MA, Woods GL; Council on Science and Public Health, American Medical Association. Efforts of the UnitedStates’ National Marrow Donor Program and Registry to improve utilization and representation of minority donors. Transfus Med. 2008;18(4):250-259.
10. Fabricius WA, Ramanathan M. Review on haploidentical hematopoietic cell transplantation in patients with hematologic malignancies. Adv Hematol.2016;2016:5726132.
11. Fuchs EJ. Haploidentical transplantation for hematologic malignancies: where do we stand? Hematology Am Soc Hematol Educ Program. 2012;2012:230-236.
12. Szydlo R, Goldman JM, Klein JP, et al. Results of allogeneic bone marrow transplants for leukemia using donors other than HLA-identical siblings. J ClinOncol. 1997;15(5):1767-1777.
13. Luznik L, O’Donnell PV, Symons HJ, et al. HLA-haploidentical bone marrow transplantation for hematologic malignancies using nonmyeloablativeconditioning and high-dose, posttransplantation cyclophosphamide. Biol Blood Marrow Transplant. 2008;14(6):641-650.
14. O’Donnell PV, Luznik L, Jones RJ, et al. Nonmyeloablative bone marrow transplantation from partially HLA-mismatched related donors usingposttransplantation cyclophosphamide. Biol Blood Marrow Transplant. 2002;8(7):377-386.
15. Ciurea SO, Mulanovich V, Saliba RM, et al. Improved early outcomes using a T cell replete graft compared with T cell depleted haploidenticalhematopoietic stem cell transplantation. Biol Blood Marrow Transplant. 2012;18(12):1835-1844.
16. Ciurea SO, Champlin RE. Donor selection in T cell-replete haploidentical hematopoietic stem cell transplantation: knowns, unknowns, and controversies.Biol Blood Marrow Transplant. 2013;19(2):180-184.
17. Ghosh N, Karmali R, Rocha V, et al. Reduced-intensity transplantation for lymphomas using haploidentical related donors versus HLA-matched siblingdonors: a Center for International Blood and Marrow Transplant Research analysis. J Clin Oncol. 2016;34(26):3141-3149.
18. Kanate AS, Mussetti A, Kharfan-Dabaja MA, et al. Reduced-intensity transplantation for lymphomas using haploidentical related donors vs HLA-matchedunrelated donors. Blood. 2016;127(7):938-947.
19. Salvatore D, Labopin M, Ruggeri A, et al. Outcomes of hematopoietic stem cell transplantation from unmanipulated haploidentical versus matched siblingdonor in patients with acute myeloid leukemia in first complete remission with intermediate or high-risk cytogenetics: a study from the Acute LeukemiaWorking Party of the European Society for Blood and Marrow Transplantation. Haematologica. 2018;103(8):1317-1328.
2082 AL MALKI et al 12 MAY 2020 x VOLUME 4, NUMBER 9
Dow
nloaded from https://ashpublications.org/bloodadvances/article-pdf/4/9/2073/1728696/advancesadv2020001499.pdf by W
ASHIN
GTO
N U
NIVER
SITY SCH
OO
L user on 11 September 2020
20. Battipaglia G, Boumendil A, Labopin M, et al. Unmanipulated haploidentical versus HLA-matched sibling allogeneic hematopoietic stem celltransplantation in relapsed/refractory acute myeloid leukemia: a retrospective study on behalf of the ALWP of the EBMT.BoneMarrow Transplant. 2019;54(9):1499-1510.
21. Gu Z, Wang L, Yuan L, et al. Similar outcomes after haploidentical transplantation with post-transplant cyclophosphamide versus HLA-matchedtransplantation: a meta-analysis of case-control studies. Oncotarget. 2017;8(38):63574-63586.
22. Pinato DJ, Howlett S, Ottaviani D, et al. Association of prior antibiotic treatment with survival and response to immune checkpoint inhibitor therapy inpatients with cancer. JAMA Oncol. 2019;5(12):1774.
23. Srour SA, Milton DR, Bashey A, et al. Haploidentical transplantation with post-transplantation cyclophosphamide for high-risk acute lymphoblasticleukemia. Biol Blood Marrow Transplant. 2017;23(2):318-324.
24. Santoro N, Ruggeri A, Labopin M, et al. Unmanipulated haploidentical stem cell transplantation in adults with acute lymphoblastic leukemia: a study onbehalf of the Acute Leukemia Working Party of the EBMT. J Hematol Oncol. 2017;10(1):113.
25. Shem-Tov N, Peczynski C, Labopin M, et al. Haploidentical vs. unrelated allogeneic stem cell transplantation for acute lymphoblastic leukemia in firstcomplete remission: on behalf of the ALWP of the EBMT. Leukemia. 2020;34(1):283-292.
26. Giralt S, Ballen K, Rizzo D, et al. Reduced-intensity conditioning regimen workshop: defining the dose spectrum. Report of a workshop convened by theCenter for International Blood and Marrow Transplant Research. Biol Blood Marrow Transplant. 2009;15(3):367-369.
27. Przepiorka D, Weisdorf D, Martin P, et al. 1994 Consensus Conference on Acute GVHD Grading. Bone Marrow Transplant. 1995;15(6):825-828.
28. Sullivan KM, Agura E, Anasetti C, et al. Chronic graft-versus-host disease and other late complications of bone marrow transplantation. Semin Hematol.1991;28(3):250-259.
29. Lin DY, Wei LJ. The robust inference for the Cox proportional hazards model. J Am Stat Assoc. 1989;84(408):1074-1078.
30. Grambsch PM, Therneau TM. Proportional hazards tests and diagnostics based on weighted residuals. Biometrika. 1994;81(3):515-526.
31. Li J, Scheike TH, Zhang M-J. Checking Fine and Gray subdistribution hazards model with cumulative sums of residuals. Lifetime Data Anal. 2015;21(2):197-217.
32. Bashey A, Zhang MJ, McCurdy SR, et al. Mobilized peripheral blood stem cells versus unstimulated bone marrow as a graft source for T-cell-repletehaploidentical donor transplantation using post-transplant cyclophosphamide. J Clin Oncol. 2017;35(26):3002-3009.
33. Ruggeri A, Labopin M, Bacigalupo A, et al. Post-transplant cyclophosphamide for graft-versus-host disease prophylaxis in HLA matched sibling ormatched unrelated donor transplant for patients with acute leukemia, on behalf of ALWP-EBMT. J Hematol Oncol. 2018;11(1):40.
34. Shah MV, Saliba RM, Rondon G, et al. Pilot study using post-transplant cyclophosphamide (PTCy), tacrolimus and mycophenolate GVHD prophylaxis forolder patients receiving 10/10 HLA-matched unrelated donor hematopoietic stem cell transplantation. Bone Marrow Transplant. 2019;54(4):601-606.
35. Deotare U, Atenafu EG, Loach D, et al. Reduction of severe acute graft-versus-host disease using a combination of pre transplant anti-thymocyte globulinand post-transplant cyclophosphamide in matched unrelated donor transplantation. Bone Marrow Transplant. 2018;53(3):361-365.
12 MAY 2020 x VOLUME 4, NUMBER 9 HCT OUTCOMES IN ALL PATIENTS POST–Haplo OR MUD HCT 2083
Dow
nloaded from https://ashpublications.org/bloodadvances/article-pdf/4/9/2073/1728696/advancesadv2020001499.pdf by W
ASHIN
GTO
N U
NIVER
SITY SCH
OO
L user on 11 September 2020