Embed Size (px)
Citation preview
TE
CH
NIC
AL
BU
LL
ET
IN
LU
-803
5Comparison Between Natural Weathering and Fluorescent UV Exposures:UVA-340 Lamp Test ResultsGregory R. Fedor and Patrick J. Brennan1
Reference Fedor, G. R., and Brennan, P. J., "Comparison Between Natural Wathering and Fluorescent UV Ex-posures: UVA-340 Lamp Test Results," Durability Testing of Non-Metallic Materials, ASTM STP 1294, Robert J. Herling, Ed., American Society for Testing and Material, Philadelphia, 1996.
Abstract Samples of different polymers were exposed in Florida, Arizona and Ohio for two years. The same samples were exposed in a laboratory weathering chamber using two irradiance levels and two mois-ture cycles. The artificial and naturally weathered samples were then compared. With the exception of mildew growth, the laboratory exposures with moisture degraded the materials in a similar manner as seen outdoors. For 9 of the 15 materials tested, the rate of degradation in the artificial weathering chamber was increased by increasing the light intensity level. In addition, the study confirms that ac-celeration factors are highly material dependent.
Keywords: Weathering, accelerated weathering, artificial weathering, ASTM G53, ASTM G7, durability testing, plastic, paint and coating.
Introduction The correlation between laboratory and natural weathering test results has long been a source of debate and controversy. As a general rule, industry wants faster accelerated weathering test results. However, industry also wants good correlation between laboratory simulations and real-time exposure test results. Unfortunately, these two goals appear to be diametrically opposed. This is because the three main ways of accelerating results (i.e., using higher than normal exposure temperatures, shorter than natural wave- lengths of light, and for higher than normal light intensity levels) can all lead to reduced correlation. Consequently, the debate continues. There is one place where there does seem to be something of a consensus within the scientific com-munity. Accelerated weathering devices using light sources that closely simulate the spectral power distribution of sunlight in the region of the spectrum where the test material is sensitive should usually give closer correlation to actual outdoor exposure results. Filtered xenon arc lamps do a good job of simulating most of the solar spectrum, especially visible light and longer wavelength UV. [1] Fluores-cent UVA-340 lamps do a good job of simulating the short wave UV (<365nm) portion of the spec-trum.
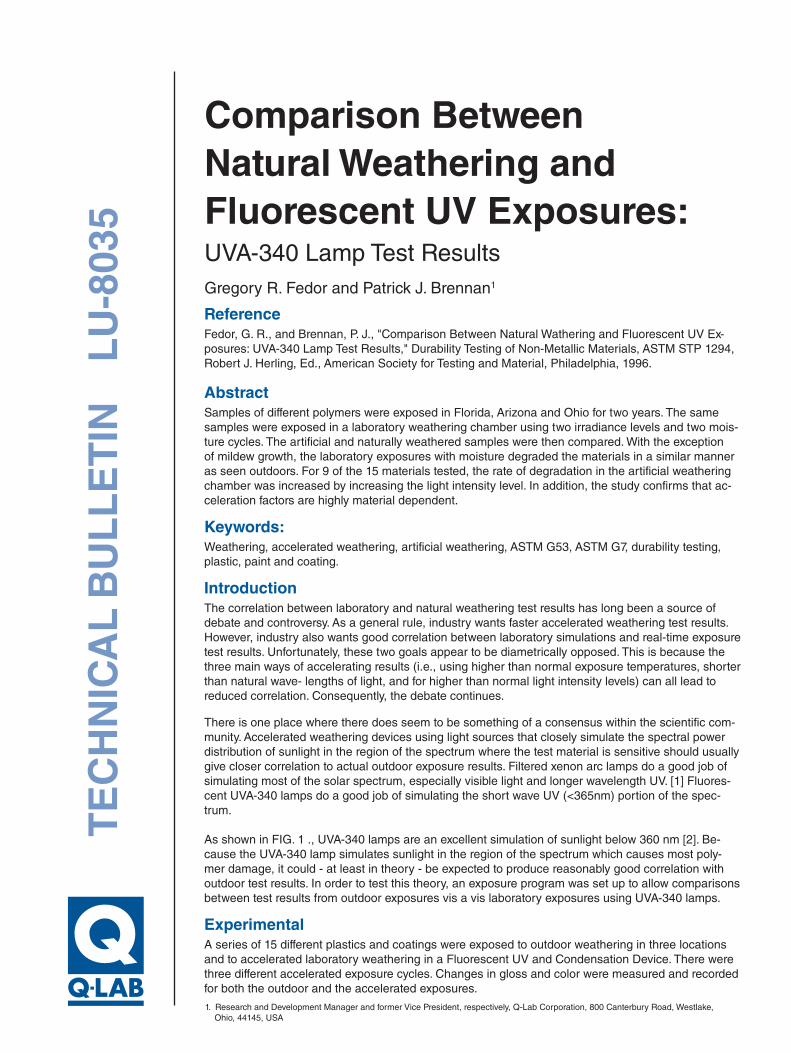
As shown in FIG. 1 ., UVA-340 lamps are an excellent simulation of sunlight below 360 nm [2]. Be-cause the UVA-340 lamp simulates sunlight in the region of the spectrum which causes most poly-mer damage, it could - at least in theory - be expected to produce reasonably good correlation with outdoor test results. In order to test this theory, an exposure program was set up to allow comparisons between test results from outdoor exposures vis a vis laboratory exposures using UVA-340 lamps.
Experimental A series of 15 different plastics and coatings were exposed to outdoor weathering in three locations and to accelerated laboratory weathering in a Fluorescent UV and Condensation Device. There were three different accelerated exposure cycles. Changes in gloss and color were measured and recorded for both the outdoor and the accelerated exposures.
1. Research and Development Manager and former Vice President, respectively, Q-Lab Corporation, 800 Canterbury Road, Westlake, Ohio, 44145, USA
2
Outdoor Exposures. It is axiomatic that the forces that caused he type of product degradation commonly called "weathering" will vary greatly from place to place throughout the world. In order to characterize "outdoor weathering" in this study, three outdoor locations were chosen: a sub-tropical climate, a desert climate, and a northern industrial climate.
Figure 1 - UVA-340 Lamp Compared to Sunlight2
Miami, Florida was chosen for the subtropical ex-posure because it has high intensity sunlight, high annual UV, high year-round temperatures, high annual rainfall and high humidity. Because these Florida weather conditions are often considered something of a "worst case," Florida is often used as a benchmark location for outdoor weatherability testing.
Phoenix, Arizona was chosen for the desert ex-posure because it too is considered a benchmark location due to high annual UV and high year-round temperatures.
Cleveland, Ohio was chosen as the northern industrial exposure site because it is a north- ern US industrial city with a typical mixed industrial manufacturing environment. All of the outdoor ex-posures were conducted in accordance to ASTM G7, Standard Practice for Environmental Exposure Testing of Non-Metallic Materials. Test specimens were mounted over a 1.6 mm (0.25 inch) plywood backing. They were mounted at 45 degrees from the horizontal, facing south. 45 South was chosen because it is commonly regarded as the typical exposure angle and is the angle of choice for many industries. It is the most widely used tilt angle for materials that do not have a specific end-use angle. Materials Tested. The materials used for these exposures were the same as used in a previous study which attempted to quantify the effects of high irradiance on the speed of degradation for
2. Noon, midsummer sunlight (June 21, 1986), Cleveland Ohio, USA. 3. Manufactured by Q-Lab Corporation, Westlake, Ohio, USA
various common plastics and coatings. [3] They were mostly commercially available formulations and may or may not be representative of their generic type.
Accelerated Exposures. All of the laboratory exposures were performed in conformance with ASTM G53, Standard Practice for Operating Light and Water Exposure Apparatus (Fluorescent UV-Condensation Type) for Exposure of Nonme-tallic Materials in a model QUV®/se3 which allows adjustment and feed-back-loop control of the UV light intensity. The lamps were UVA-340 lamps with a peak at 343 nm and a cut-on at 295 nm. A single exposure temperature (50C) was chosen to avoid confusion about any possible temperature effects. The laboratory exposure conditions were as follows:
Cycle 1: 4 hours UV light alternating with 4 hours condensing moisture UVA-340 lamps operated at 0.83 W/m2/nm @ 340 nm, 50 degrees C exposure temperature for both UV and condensation. The UV irradiance level used in this cycle is the same as that of a tester without irradiance control. It is approximately equivalent to noon summer sunlight at 340 nm. Cycle 2: 4 hours UV light alternating with 4 hours condensing moisture UVA-340 lamps operated at 1.35 W/m2/nm @ 340 nm, 50 degrees C exposure temperature for both UV and condensation. This is the same as Cycle 1, except that the irradiance has been increased to determine if it would allow faster testing without affecting correla-tion. Cycle 3: UV-Only (100% UV light, no moisture, no dark time), UVA-340 lamps operated at 1.35 W/m2/m @ 340 nm, 50 degrees C exposure tempera-ture.
Evaluation of Degradation. The color and gloss of test specimens were measured in accordance with ASTM D2244, Standard Test Method for Cal-culation of Color Differences From Instrumentally
3Figure 2 - PVC Film, Outdoors
Measured Color Coordinates and D0523, Stan-dard Test Method for Specular Gloss. Specimens exposed outdoors were measured after exposures of 12 months and 24 months. Specimens exposed in the 653 devices were measured at various intervals, depending on the material and the rate of change.
Exposure Data PVC Film. This material was a clear unstabilized film. It was attached to a white painted aluminum panel using a pressure sensitive adhesive.
Natural Weathering Results (FIG. 2). The mate-rial changed very little after two years in Ohio and Florida. In Arizona, the material turned slightly yel-low after one year, and brown after two years. The rate of yellowing in Arizona was slow during the first year and fast during the second year.
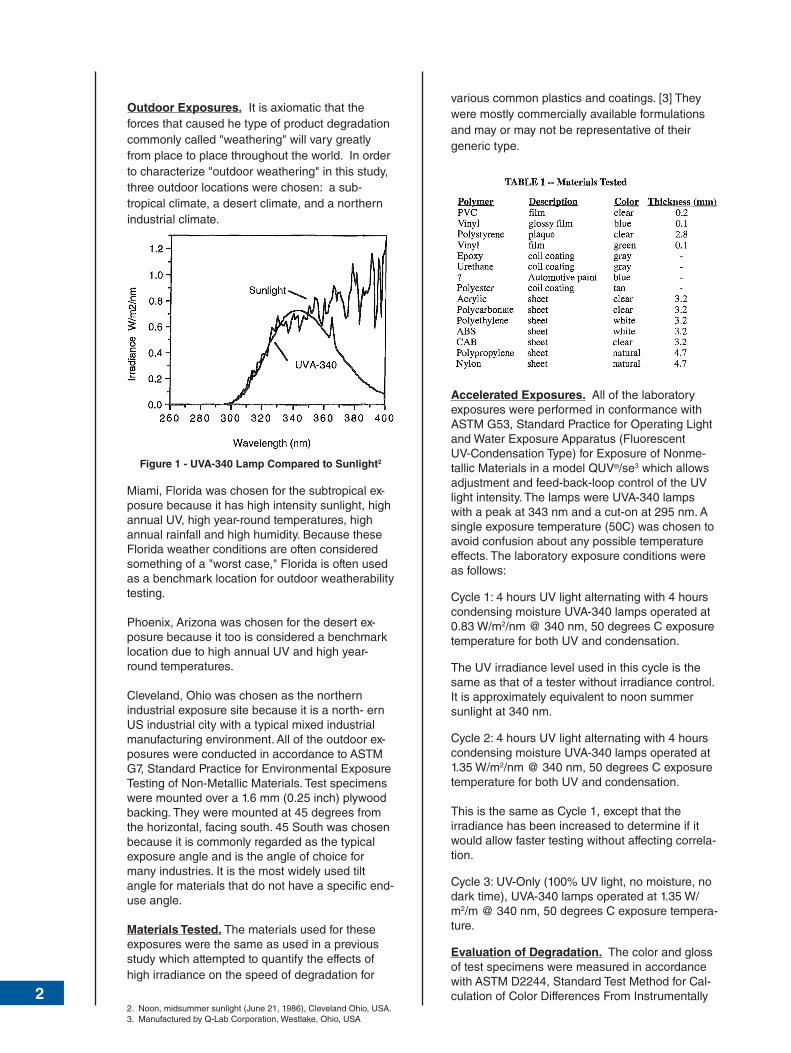
Accelerated Weathering Results (FIG. 3). The material changed very little after 2000 hours in a G53 device with a 4 hour UV / 4 hour moisture cycle, regardless of irradiance level. The material began to turn yellow after 1000 hours, and brown after 2000 hours, in a 653 device with continuous WV at an irradiance level of 1.35 W/m2.
Comparison. The 653 with UV-Only Cycle agreed well with the Arizona exposures. No visible change was seen for quite awhile during both exposures and then, all of a sudden, the material turned yel-low very rapidly. Apparently, the material required a certain amount of UV to initiate the yellowing process. Once this UV dosage was received, the yellowing was rapid. The point at which this hap-pened was about 1200 hours. The point at which this happened in Arizona was about one year. No yellowing occurred in Florida, Ohio, or the expo-sure with the 4 hour UV / 4 hour moisture cycle. This was probably because the material had not yet received enough UV to initiate the yellowing process.
Figure 3 - PVC Film, Lab
Blue Vinyl Film. This was an opaque, blue, glossy film. It was attached to an aluminum panel with a pressure sensitive adhesive.
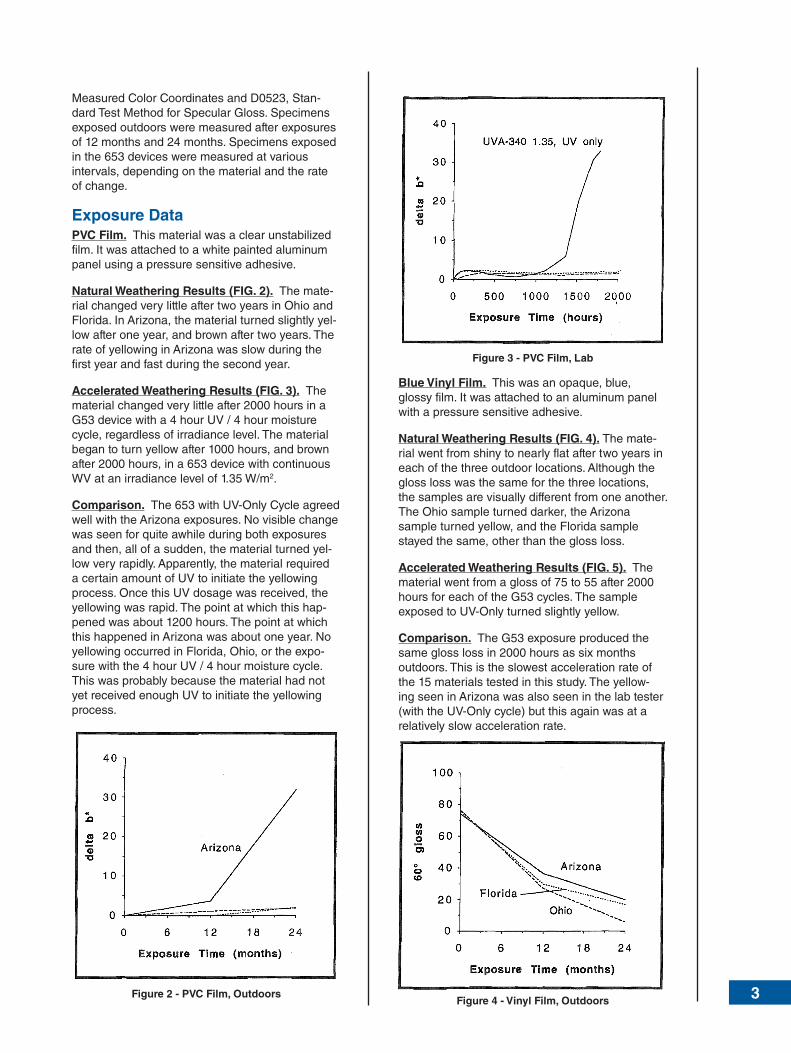
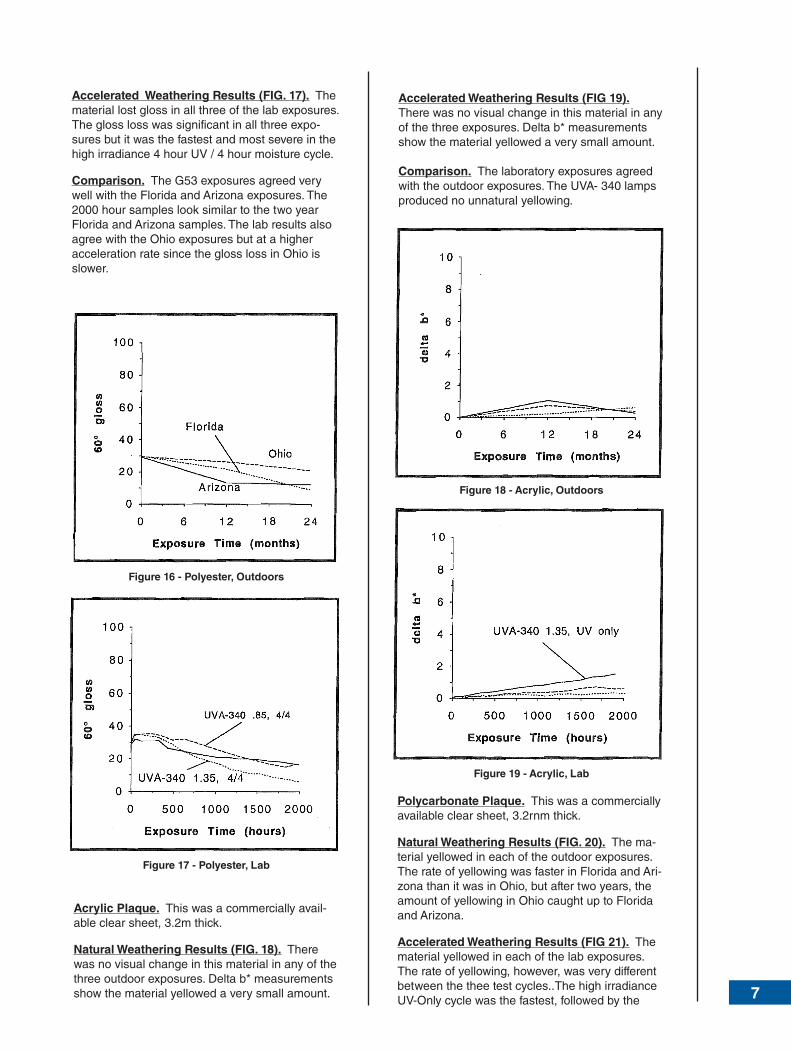
Natural Weathering Results (FIG. 4). The mate-rial went from shiny to nearly flat after two years in each of the three outdoor locations. Although the gloss loss was the same for the three locations, the samples are visually different from one another. The Ohio sample turned darker, the Arizona sample turned yellow, and the Florida sample stayed the same, other than the gloss loss.
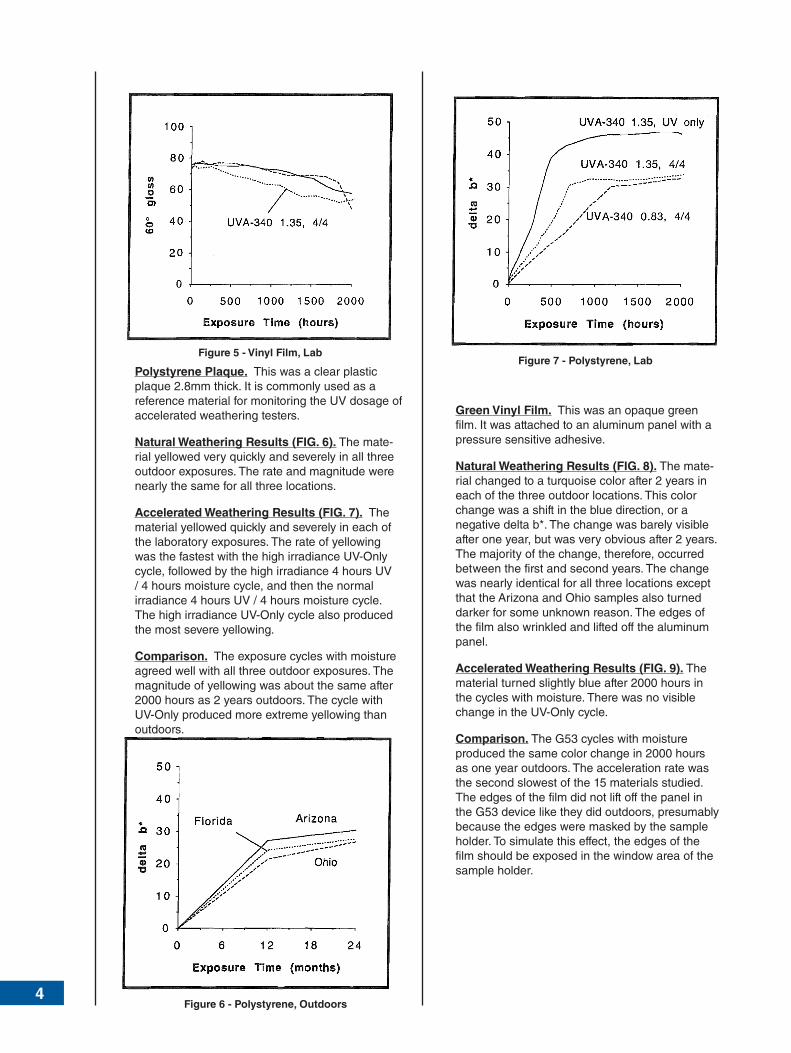
Accelerated Weathering Results (FIG. 5). The material went from a gloss of 75 to 55 after 2000 hours for each of the G53 cycles. The sample exposed to UV-Only turned slightly yellow.
Comparison. The G53 exposure produced the same gloss loss in 2000 hours as six months outdoors. This is the slowest acceleration rate of the 15 materials tested in this study. The yellow-ing seen in Arizona was also seen in the lab tester (with the UV-Only cycle) but this again was at a relatively slow acceleration rate.
Figure 4 - Vinyl Film, Outdoors
4
Figure 5 - Vinyl Film, Lab
Polystyrene Plaque. This was a clear plastic plaque 2.8mm thick. It is commonly used as a reference material for monitoring the UV dosage of accelerated weathering testers.
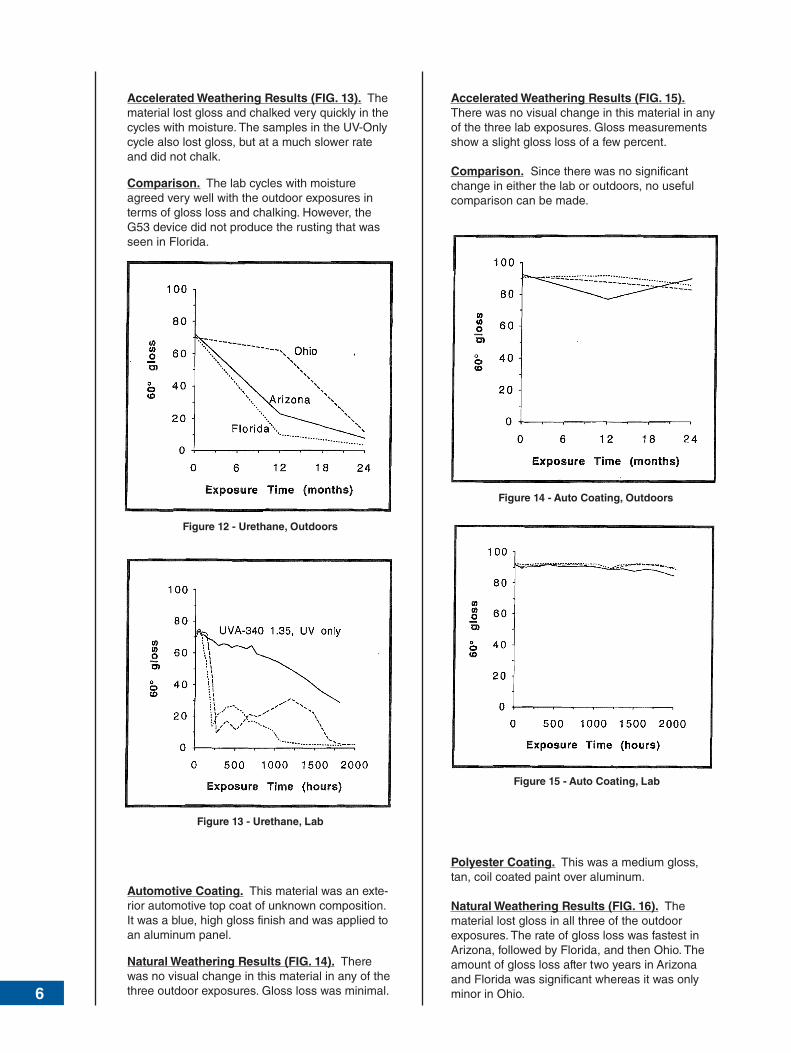
Natural Weathering Results (FIG. 6). The mate-rial yellowed very quickly and severely in all three outdoor exposures. The rate and magnitude were nearly the same for all three locations.
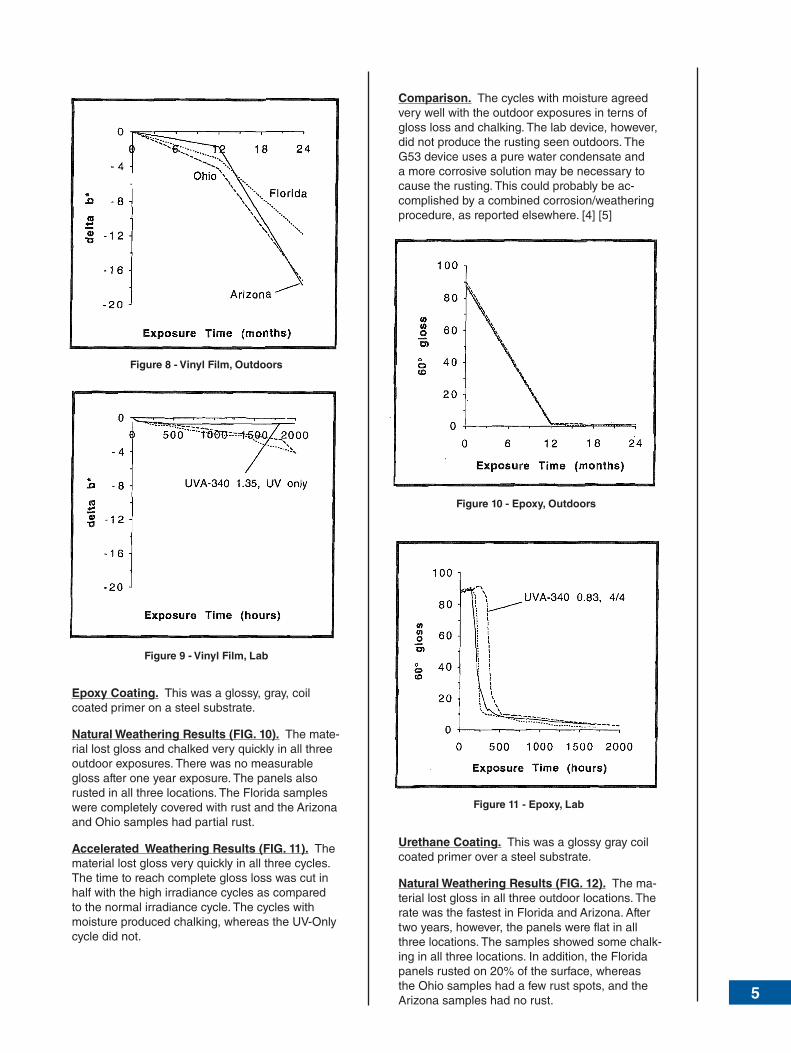
Accelerated Weathering Results (FIG. 7). The material yellowed quickly and severely in each of the laboratory exposures. The rate of yellowing was the fastest with the high irradiance UV-Only cycle, followed by the high irradiance 4 hours UV / 4 hours moisture cycle, and then the normal irradiance 4 hours UV / 4 hours moisture cycle. The high irradiance UV-Only cycle also produced the most severe yellowing.
Comparison. The exposure cycles with moisture agreed well with all three outdoor exposures. The magnitude of yellowing was about the same after 2000 hours as 2 years outdoors. The cycle with UV-Only produced more extreme yellowing than outdoors.
Figure 6 - Polystyrene, Outdoors
Figure 7 - Polystyrene, Lab
Green Vinyl Film. This was an opaque green film. It was attached to an aluminum panel with a pressure sensitive adhesive.
Natural Weathering Results (FIG. 8). The mate-rial changed to a turquoise color after 2 years in each of the three outdoor locations. This color change was a shift in the blue direction, or a negative delta b*. The change was barely visible after one year, but was very obvious after 2 years. The majority of the change, therefore, occurred between the first and second years. The change was nearly identical for all three locations except that the Arizona and Ohio samples also turned darker for some unknown reason. The edges of the film also wrinkled and lifted off the aluminum panel.
Accelerated Weathering Results (FIG. 9). The material turned slightly blue after 2000 hours in the cycles with moisture. There was no visible change in the UV-Only cycle.
Comparison. The G53 cycles with moisture produced the same color change in 2000 hours as one year outdoors. The acceleration rate was the second slowest of the 15 materials studied. The edges of the film did not lift off the panel in the G53 device like they did outdoors, presumably because the edges were masked by the sample holder. To simulate this effect, the edges of the film should be exposed in the window area of the sample holder.
5
Epoxy Coating. This was a glossy, gray, coil coated primer on a steel substrate.
Natural Weathering Results (FIG. 10). The mate-rial lost gloss and chalked very quickly in all three outdoor exposures. There was no measurable gloss after one year exposure. The panels also rusted in all three locations. The Florida samples were completely covered with rust and the Arizona and Ohio samples had partial rust.
Accelerated Weathering Results (FIG. 11). The material lost gloss very quickly in all three cycles. The time to reach complete gloss loss was cut in half with the high irradiance cycles as compared to the normal irradiance cycle. The cycles with moisture produced chalking, whereas the UV-Only cycle did not.
Figure 8 - Vinyl Film, Outdoors
Figure 9 - Vinyl Film, Lab
Comparison. The cycles with moisture agreed very well with the outdoor exposures in terns of gloss loss and chalking. The lab device, however, did not produce the rusting seen outdoors. The G53 device uses a pure water condensate and a more corrosive solution may be necessary to cause the rusting. This could probably be ac-complished by a combined corrosion/weathering procedure, as reported elsewhere. [4] [5]
Figure 10 - Epoxy, Outdoors
Figure 11 - Epoxy, Lab
Urethane Coating. This was a glossy gray coil coated primer over a steel substrate.
Natural Weathering Results (FIG. 12). The ma-terial lost gloss in all three outdoor locations. The rate was the fastest in Florida and Arizona. After two years, however, the panels were flat in all three locations. The samples showed some chalk-ing in all three locations. In addition, the Florida panels rusted on 20% of the surface, whereas the Ohio samples had a few rust spots, and the Arizona samples had no rust.
6
Accelerated Weathering Results (FIG. 13). The material lost gloss and chalked very quickly in the cycles with moisture. The samples in the UV-Only cycle also lost gloss, but at a much slower rate and did not chalk.
Comparison. The lab cycles with moisture agreed very well with the outdoor exposures in terms of gloss loss and chalking. However, the G53 device did not produce the rusting that was seen in Florida.
Figure 12 - Urethane, Outdoors
Figure 13 - Urethane, Lab
Automotive Coating. This material was an exte-rior automotive top coat of unknown composition. It was a blue, high gloss finish and was applied to an aluminum panel.
Natural Weathering Results (FIG. 14). There was no visual change in this material in any of the three outdoor exposures. Gloss loss was minimal.
Accelerated Weathering Results (FIG. 15). There was no visual change in this material in any of the three lab exposures. Gloss measurements show a slight gloss loss of a few percent.
Comparison. Since there was no significant change in either the lab or outdoors, no useful comparison can be made.
Figure 14 - Auto Coating, Outdoors
Figure 15 - Auto Coating, Lab
Polyester Coating. This was a medium gloss, tan, coil coated paint over aluminum.
Natural Weathering Results (FIG. 16). The material lost gloss in all three of the outdoor exposures. The rate of gloss loss was fastest in Arizona, followed by Florida, and then Ohio. The amount of gloss loss after two years in Arizona and Florida was significant whereas it was only minor in Ohio.
7
Accelerated Weathering Results (FIG. 17). The material lost gloss in all three of the lab exposures. The gloss loss was significant in all three expo-sures but it was the fastest and most severe in the high irradiance 4 hour UV / 4 hour moisture cycle.
Comparison. The G53 exposures agreed very well with the Florida and Arizona exposures. The 2000 hour samples look similar to the two year Florida and Arizona samples. The lab results also agree with the Ohio exposures but at a higher acceleration rate since the gloss loss in Ohio is slower.
Accelerated Weathering Results (FIG 19). There was no visual change in this material in any of the three exposures. Delta b* measurements show the material yellowed a very small amount.
Comparison. The laboratory exposures agreed with the outdoor exposures. The UVA- 340 lamps produced no unnatural yellowing.
Figure 16 - Polyester, Outdoors
Figure 17 - Polyester, Lab
Acrylic Plaque. This was a commercially avail-able clear sheet, 3.2m thick.
Natural Weathering Results (FIG. 18). There was no visual change in this material in any of the three outdoor exposures. Delta b* measurements show the material yellowed a very small amount.
Figure 18 - Acrylic, Outdoors
Figure 19 - Acrylic, Lab
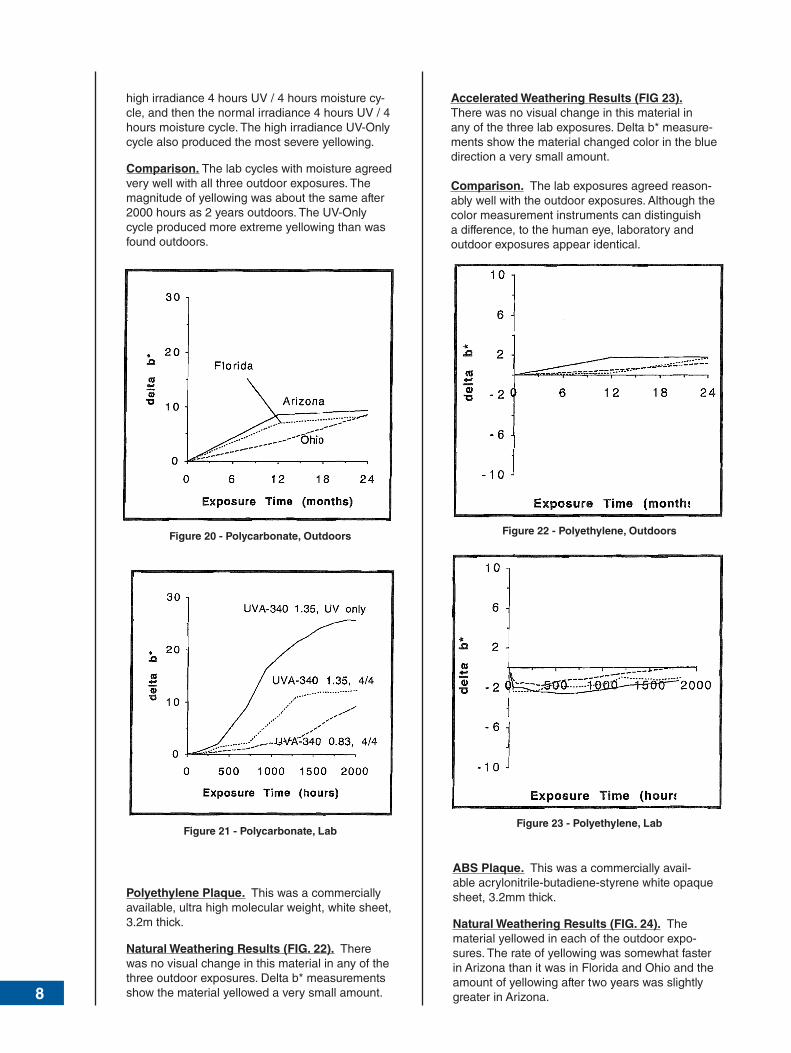
Polycarbonate Plaque. This was a commercially available clear sheet, 3.2rnm thick.
Natural Weathering Results (FIG. 20). The ma-terial yellowed in each of the outdoor exposures. The rate of yellowing was faster in Florida and Ari-zona than it was in Ohio, but after two years, the amount of yellowing in Ohio caught up to Florida and Arizona.
Accelerated Weathering Results (FIG 21). The material yellowed in each of the lab exposures. The rate of yellowing, however, was very different between the thee test cycles..The high irradiance UV-Only cycle was the fastest, followed by the
8
high irradiance 4 hours UV / 4 hours moisture cy-cle, and then the normal irradiance 4 hours UV / 4 hours moisture cycle. The high irradiance UV-Only cycle also produced the most severe yellowing.
Comparison. The lab cycles with moisture agreed very well with all three outdoor exposures. The magnitude of yellowing was about the same after 2000 hours as 2 years outdoors. The UV-Only cycle produced more extreme yellowing than was found outdoors.
Figure 20 - Polycarbonate, Outdoors
Figure 21 - Polycarbonate, Lab
Polyethylene Plaque. This was a commercially available, ultra high molecular weight, white sheet, 3.2m thick.
Natural Weathering Results (FIG. 22). There was no visual change in this material in any of the three outdoor exposures. Delta b* measurements show the material yellowed a very small amount.
Accelerated Weathering Results (FIG 23). There was no visual change in this material in any of the three lab exposures. Delta b* measure-ments show the material changed color in the blue direction a very small amount.
Comparison. The lab exposures agreed reason-ably well with the outdoor exposures. Although the color measurement instruments can distinguish a difference, to the human eye, laboratory and outdoor exposures appear identical.
Figure 22 - Polyethylene, Outdoors
Figure 23 - Polyethylene, Lab
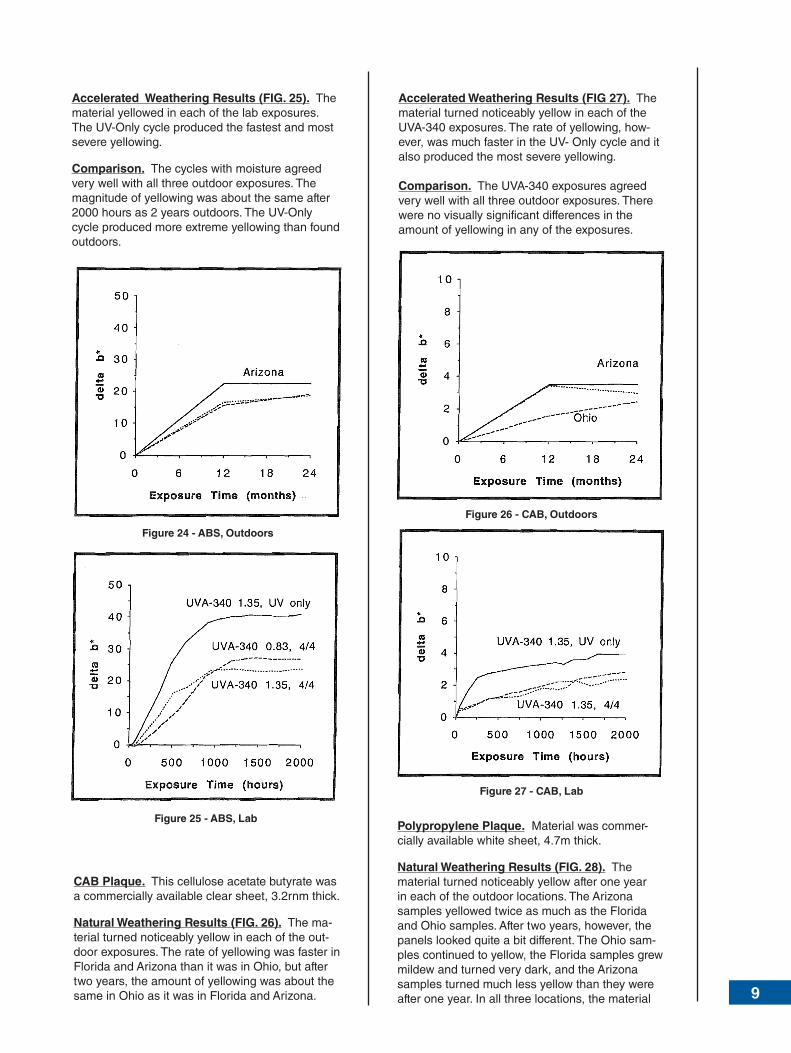
ABS Plaque. This was a commercially avail-able acrylonitrile-butadiene-styrene white opaque sheet, 3.2mm thick.
Natural Weathering Results (FIG. 24). The material yellowed in each of the outdoor expo-sures. The rate of yellowing was somewhat faster in Arizona than it was in Florida and Ohio and the amount of yellowing after two years was slightly greater in Arizona.
9
Accelerated Weathering Results (FIG. 25). The material yellowed in each of the lab exposures. The UV-Only cycle produced the fastest and most severe yellowing.
Comparison. The cycles with moisture agreed very well with all three outdoor exposures. The magnitude of yellowing was about the same after 2000 hours as 2 years outdoors. The UV-Only cycle produced more extreme yellowing than found outdoors.
Accelerated Weathering Results (FIG 27). The material turned noticeably yellow in each of the UVA-340 exposures. The rate of yellowing, how-ever, was much faster in the UV- Only cycle and it also produced the most severe yellowing.
Comparison. The UVA-340 exposures agreed very well with all three outdoor exposures. There were no visually significant differences in the amount of yellowing in any of the exposures.
Figure 24 - ABS, Outdoors
Figure 25 - ABS, Lab
CAB Plaque. This cellulose acetate butyrate was a commercially available clear sheet, 3.2rnm thick.
Natural Weathering Results (FIG. 26). The ma-terial turned noticeably yellow in each of the out-door exposures. The rate of yellowing was faster in Florida and Arizona than it was in Ohio, but after two years, the amount of yellowing was about the same in Ohio as it was in Florida and Arizona.
Figure 26 - CAB, Outdoors
Figure 27 - CAB, Lab
Polypropylene Plaque. Material was commer-cially available white sheet, 4.7m thick.
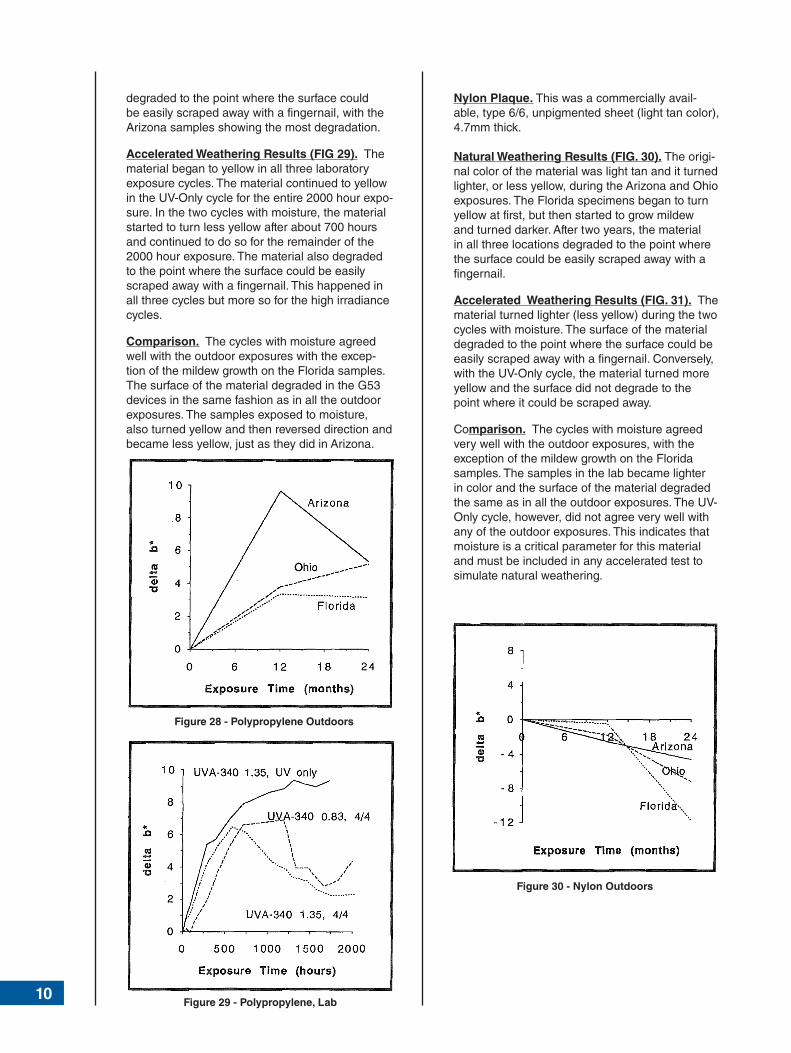
Natural Weathering Results (FIG. 28). The material turned noticeably yellow after one year in each of the outdoor locations. The Arizona samples yellowed twice as much as the Florida and Ohio samples. After two years, however, the panels looked quite a bit different. The Ohio sam-ples continued to yellow, the Florida samples grew mildew and turned very dark, and the Arizona samples turned much less yellow than they were after one year. In all three locations, the material
10
degraded to the point where the surface could be easily scraped away with a fingernail, with the Arizona samples showing the most degradation.
Accelerated Weathering Results (FIG 29). The material began to yellow in all three laboratory exposure cycles. The material continued to yellow in the UV-Only cycle for the entire 2000 hour expo-sure. In the two cycles with moisture, the material started to turn less yellow after about 700 hours and continued to do so for the remainder of the 2000 hour exposure. The material also degraded to the point where the surface could be easily scraped away with a fingernail. This happened in all three cycles but more so for the high irradiance cycles.
Comparison. The cycles with moisture agreed well with the outdoor exposures with the excep-tion of the mildew growth on the Florida samples. The surface of the material degraded in the G53 devices in the same fashion as in all the outdoor exposures. The samples exposed to moisture, also turned yellow and then reversed direction and became less yellow, just as they did in Arizona.
Figure 28 - Polypropylene Outdoors
Nylon Plaque. This was a commercially avail-able, type 6/6, unpigmented sheet (light tan color), 4.7mm thick.
Natural Weathering Results (FIG. 30). The origi-nal color of the material was light tan and it turned lighter, or less yellow, during the Arizona and Ohio exposures. The Florida specimens began to turn yellow at first, but then started to grow mildew and turned darker. After two years, the material in all three locations degraded to the point where the surface could be easily scraped away with a fingernail.
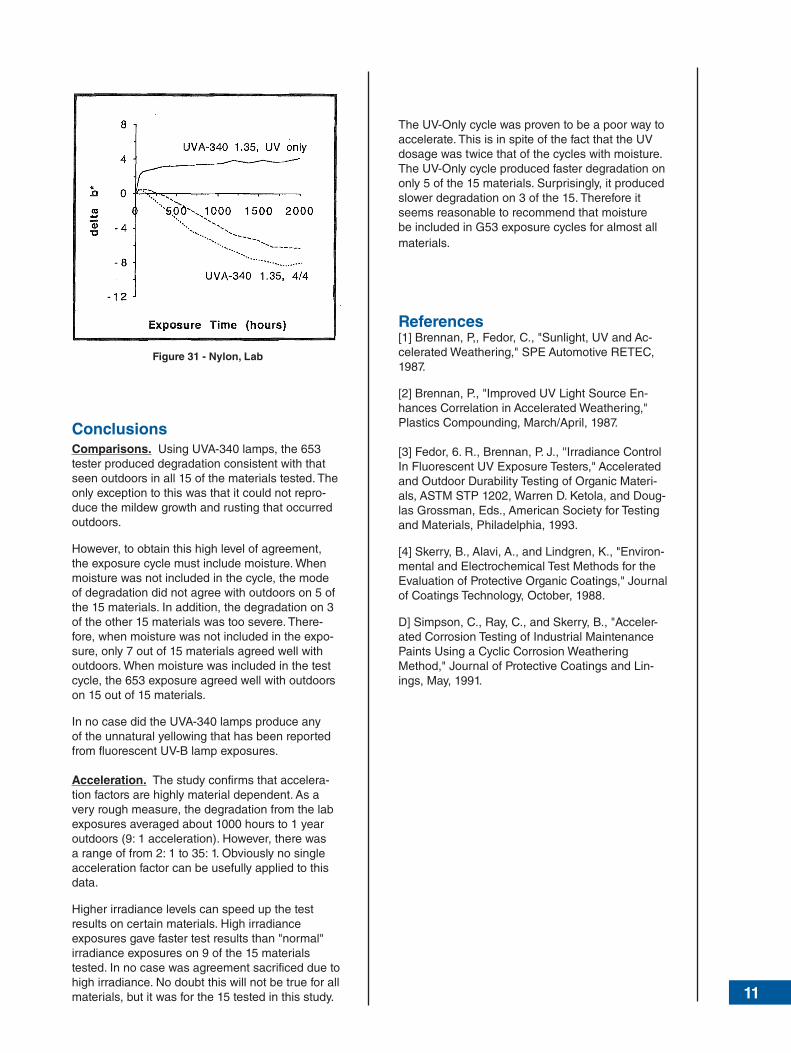
Accelerated Weathering Results (FIG. 31). The material turned lighter (less yellow) during the two cycles with moisture. The surface of the material degraded to the point where the surface could be easily scraped away with a fingernail. Conversely, with the UV-Only cycle, the material turned more yellow and the surface did not degrade to the point where it could be scraped away.
Comparison. The cycles with moisture agreed very well with the outdoor exposures, with the exception of the mildew growth on the Florida samples. The samples in the lab became lighter in color and the surface of the material degraded the same as in all the outdoor exposures. The UV-Only cycle, however, did not agree very well with any of the outdoor exposures. This indicates that moisture is a critical parameter for this material and must be included in any accelerated test to simulate natural weathering.
Figure 29 - Polypropylene, Lab
Figure 30 - Nylon Outdoors
11
Conclusions Comparisons. Using UVA-340 lamps, the 653 tester produced degradation consistent with that seen outdoors in all 15 of the materials tested. The only exception to this was that it could not repro-duce the mildew growth and rusting that occurred outdoors. However, to obtain this high level of agreement, the exposure cycle must include moisture. When moisture was not included in the cycle, the mode of degradation did not agree with outdoors on 5 of the 15 materials. In addition, the degradation on 3 of the other 15 materials was too severe. There-fore, when moisture was not included in the expo-sure, only 7 out of 15 materials agreed well with outdoors. When moisture was included in the test cycle, the 653 exposure agreed well with outdoors on 15 out of 15 materials. In no case did the UVA-340 lamps produce any of the unnatural yellowing that has been reported from fluorescent UV-B lamp exposures.
Acceleration. The study confirms that accelera-tion factors are highly material dependent. As a very rough measure, the degradation from the lab exposures averaged about 1000 hours to 1 year outdoors (9: 1 acceleration). However, there was a range of from 2: 1 to 35: 1. Obviously no single acceleration factor can be usefully applied to this data.
Higher irradiance levels can speed up the test results on certain materials. High irradiance exposures gave faster test results than "normal" irradiance exposures on 9 of the 15 materials tested. In no case was agreement sacrificed due to high irradiance. No doubt this will not be true for all materials, but it was for the 15 tested in this study.
Figure 31 - Nylon, Lab
The UV-Only cycle was proven to be a poor way to accelerate. This is in spite of the fact that the UV dosage was twice that of the cycles with moisture. The UV-Only cycle produced faster degradation on only 5 of the 15 materials. Surprisingly, it produced slower degradation on 3 of the 15. Therefore it seems reasonable to recommend that moisture be included in G53 exposure cycles for almost all materials.
References [1] Brennan, P,, Fedor, C., "Sunlight, UV and Ac-celerated Weathering," SPE Automotive RETEC, 1987. [2] Brennan, P., "Improved UV Light Source En-hances Correlation in Accelerated Weathering," Plastics Compounding, March/April, 1987.
[3] Fedor, 6. R., Brennan, P. J., ''Irradiance Control In Fluorescent UV Exposure Testers," Accelerated and Outdoor Durability Testing of Organic Materi-als, ASTM STP 1202, Warren D. Ketola, and Doug-las Grossman, Eds., American Society for Testing and Materials, Philadelphia, 1993. [4] Skerry, B., Alavi, A., and Lindgren, K., "Environ-mental and Electrochemical Test Methods for the Evaluation of Protective Organic Coatings," Journal of Coatings Technology, October, 1988. D] Simpson, C., Ray, C., and Skerry, B., "Acceler-ated Corrosion Testing of Industrial Maintenance Paints Using a Cyclic Corrosion Weathering Method," Journal of Protective Coatings and Lin-ings, May, 1991.
LU-8035.1 © 2011 Q-Lab Corporation. All Rights Reserved.Q-Lab, the Q-Lab logo and QUV are registered trademarks of Q-Lab Corporation.
Q-Lab Corporation www.q-lab.com
Q-Lab Europe, Ltd.Bolton, England Tel: [email protected]
Q-Lab Deutschland, GmbHSaarbrücken, GermanyTel: [email protected]
Q-Lab China 中国代表处Shanghai, China 中国上海电话: [email protected]
Q-Lab HeadquartersWestlake, OH USATel: [email protected]
Q-Lab Florida Homestead, FL USA Tel: [email protected]
Q-Lab Arizona Buckeye, AZ USA Tel: [email protected]