Embed Size (px)
Citation preview
`
Comparison between People’s Bank of China
and European Central Bank –
Central Bank Independence and Price Stability
Author: Siyun Shen
Email: [email protected]
Program: D D I M
June, 2011 Master Thesis in University Luiss Guido

2 / 76
Table of Contents
List of Tables and Figures________________________________________________________ 4
Abstract ______________________________________________________________________ 5
1. Introduction of Thesis _______________________________________________________ 6
1.1 Background ____________________________________________________________ 6
1.2 Objective of research _____________________________________________________ 7
1.3 Research method and thesis framework ______________________________________ 7
1.4 Research contribution ____________________________________________________ 8
2. Literature Review __________________________________________________________ 9
2.1 Organizational structures and instruments of central banks _______________________ 9
2.2 The effect of central bank independence on price stability _______________________ 10
2.2.1 The meaning of central bank independence _____________________________ 10
2.2.2 Measurements of central bank independence ____________________________ 11
2.2.3 Empirical evidence ________________________________________________ 13
2.3 Wage growth __________________________________________________________ 14
2.4 Income inequality ______________________________________________________ 17
3. The Central Bank Frameworks in China and Euro Zone ___________________________ 18
3.1 History of two central banks ______________________________________________ 18
3.2 Organizational structures of two central banks ________________________________ 20
3.3 Monetary policy objectives of two central banks ______________________________ 22
3.4 Monetary policy operations of two central banks ______________________________ 23
3.5 Results from the comparison ______________________________________________ 29
4. Central Bank Independence and Price Stability __________________________________ 29
4.1 Theory without income consideration _______________________________________ 29
4.1.1 Among industrialized countries _______________________________________ 29
4.1.2 Comparison between the PBC and ECB ________________________________ 35
4.2 Including income variable in the theory _____________________________________ 41
4.2.1 Wage dynamic in China and Euro-zone ________________________________ 41
4.2.1.1 Rising wage in China __________________________________________ 41
3 / 76
4.2.1.2 Wage convergence in euro zone _________________________________ 44
4.2.2 Inflation VS. Nominal wage growth ___________________________________ 46
4.3 Inflation in rapid developing economies _____________________________________ 47
4.4 Income inequality ______________________________________________________ 49
4.4.1 Causes of income inequality _________________________________________ 50
4.4.2 Inflation affects the poor in China _____________________________________ 52
4.4.3 Solutions to decrease the income inequality _____________________________ 54
5. Recent inflation in China ____________________________________________________ 55
5.1 Background in recent inflation ____________________________________________ 55
5.2 Causes of inflation analysis _______________________________________________ 56
5.3 Central bank independence for inflation targeting _____________________________ 61
6. Importance of central bank independence in developing countries ___________________ 61
6.1 Why improve central bank independence? ___________________________________ 62
6.1.1 Monetary policy efficiency __________________________________________ 62
6.1.2 Economic Environment for development _______________________________ 65
6.2 The determinant of central bank independence ________________________________ 66
7. Conclusion of thesis _______________________________________________________ 71
References __________________________________________________________________ 73
Acknowledgements ___________________________________________________________ 76
4 / 76
List of Tables and Figures
Table 1: Euro-system monetary policy operations ____________________________________ 28
Table 2: Political independence of central banks _____________________________________ 30
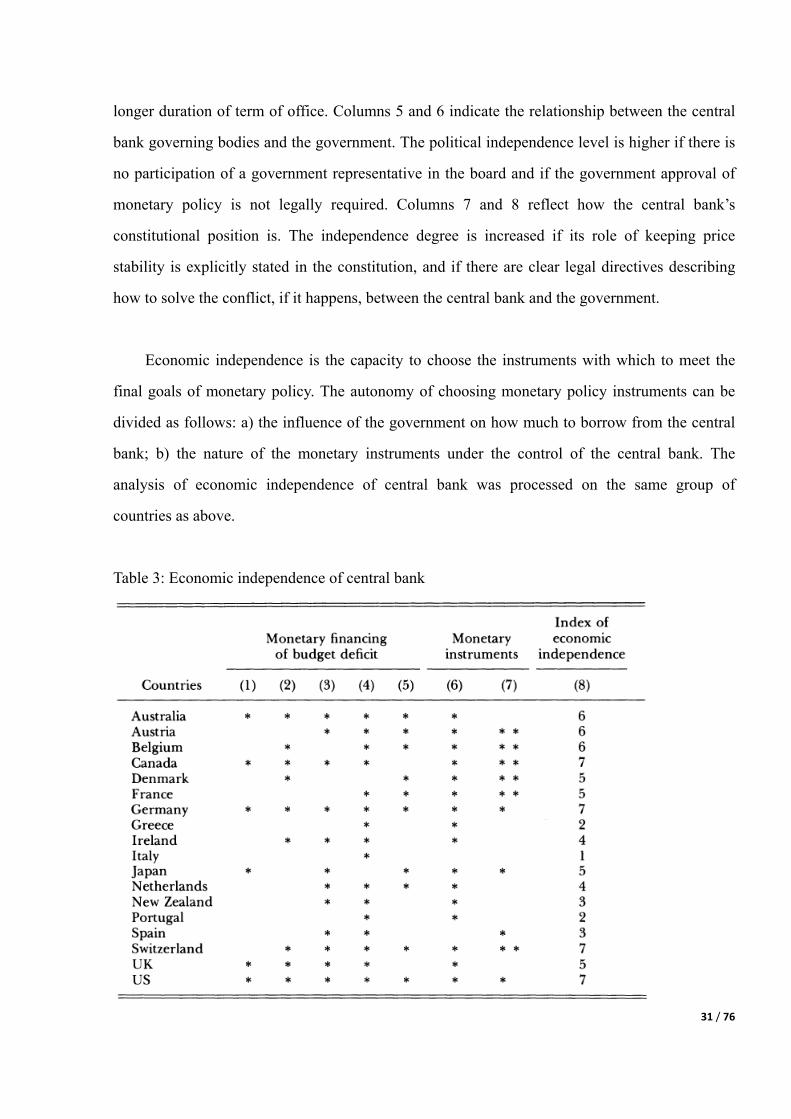
Table 3: Economic independence of central bank ____________________________________ 31
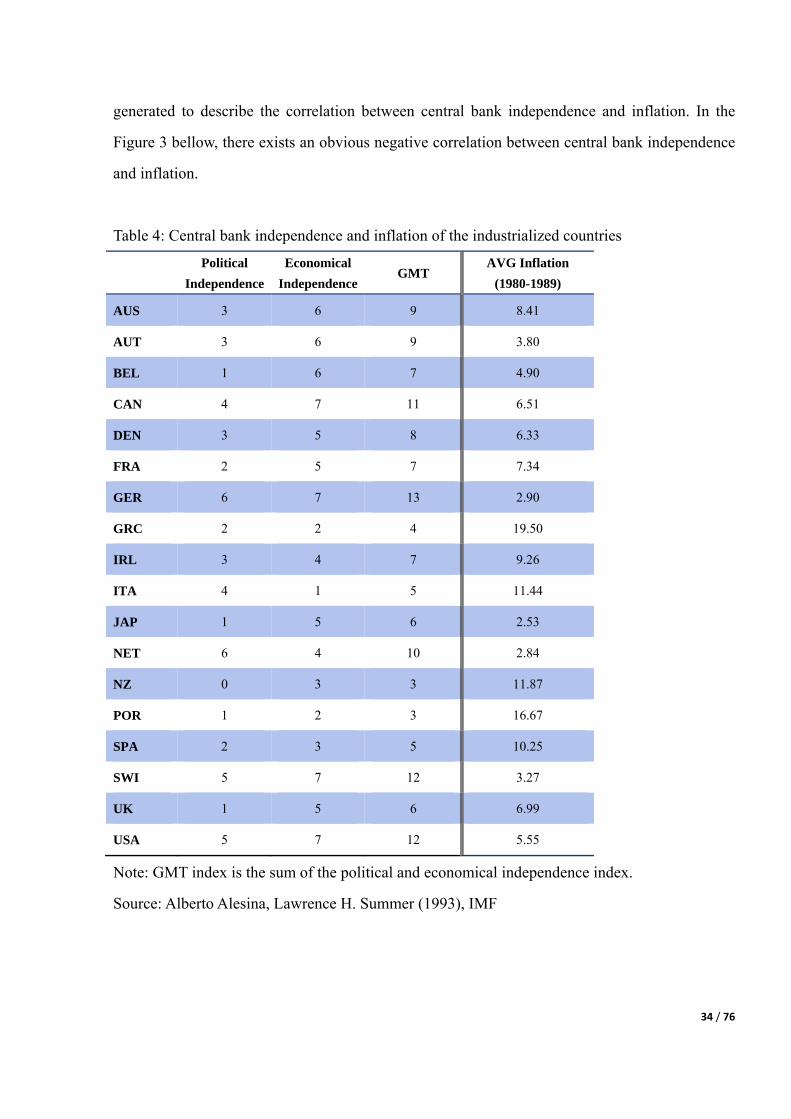
Table 4: Central bank independence and inflation of the industrialized countries ____________ 34
Table 5: Coding scheme of CBI indicator __________________________________________ 37
Table 6: Score for CBI index ____________________________________________________ 39
Table 7: Average monthly wage and growth rate _____________________________________ 45
Table 8: Inflation rates in BRICs (2000-2010) _______________________________________ 48
Figure 1: Organizational Structure of the ECB ______________________________________ 21
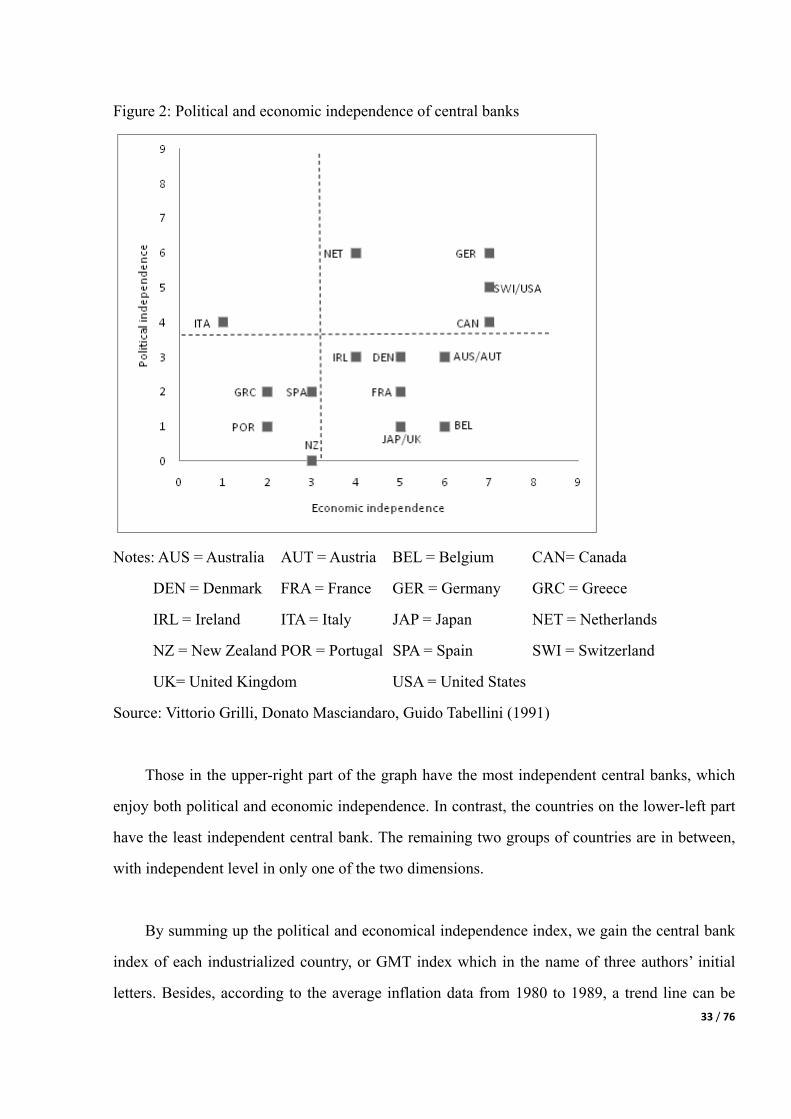
Figure 2: Political and economic independence of central banks ________________________ 33
Figure 3: Scattered spots and trend line of average inflation (1980-1989) _________________ 35
Figure 4: Comparison of price stability between the ECB and the PBC (1999-2010) _________ 40
Figure 5: Average monthly wage in China (RMB) ____________________________________ 43
Figure 6: Wage growth rate between euro-area and China ______________________________ 46
Figure 7: Comparison between nominal wage growth and inflation ______________________ 47
Figure 8: Trend line of inflations in BRICs _________________________________________ 49
Figure 9: Urban unemployment rate (1990-2010) ____________________________________ 50
Figure 10: Average wage income between region and type of enterprise, 2009 _____________ 53
Figure 11: Service inflation replaces food inflation ___________________________________ 58
Figure 12: Bill and Bond issuance to sterilize inflow _________________________________ 59

5 / 76
Abstract
The negative link between central bank independence and inflation has been studied in the
range of the industrialized countries for a long time. This paper empirically analyses the effect of
central bank independence between the China and euro zone in the recent decade. Based on the
statistical data available between China and the member countries in euro zone, the research
reflects that despite a comparatively lower independence level of central bank in China, its effect
leading to a higher inflation is not obvious. The higher volatility of Chinese inflation maybe only
partly results from the lower independence degree in its central bank, but there are other possible
causes existed. To better evaluate the intensity of the inflation, the research takes the variants like
income growth per capita and rapid economic developing into consideration. Because of the
reality that during this decade China has experienced remarkable income growth, and thus a
sharp increase of earning of employees, so the pressure of inflation on average person is partly
offset and, thus, not so severe. Besides, the Chinese inflation rate is at the lowest level among all
the rapid developing economies, so that again it makes ground for people relieving from anxiety
about the inflation.
The paper also analyzes the issue of income distribution in China, and points out that the
income inequality deserves more attention than the inflation problem because that will results in
the pressure of inflation focusing on a specific group. In general, the paper holds a double-edge
attitude to the central bank independence. In one aspect, the low degree of central bank
independence is not the main cause of recent inflation in China, and it maybe only accounts for a
little part of the inflation in recent decade. The paper presents some other possible factors which
may arouse the price surge in China. In another aspect, the improvement of central bank
independence is, in the long run, necessary for the sustainable development of Chinese economy,
and hence, the paper introduces the determinants for central bank independence.
Key Words: Central bank independence, Inflation, Price stability, Wage growth, Income
inequality
6 / 76
1. Introduction of Thesis
1.1 Background
Among the six months before April, 2011 China has raised four times of the interest rate to
curb its inflation surge. This arouses the attentions from every corner of the world. As China is
at present the world's most rapidly growing economy and its increasing imports is a key driver
of Asia's economic recovery, so that to tighten economy in China will have international
consequences and this makes all of the world pay the attention to the movements of China.
Because of the limited autonomy in People’s Bank of China (PBC), some analysts argue that to
effectively practice the inflation targeting in China the degree of central bank independence
should be improved. Besides, the central bank independence may also partly play a role on the
inflation problem except some causes as Balassa-Samuelson effect and difficulty in sterilization,
supply shocks, etc.
Even though the anxieties of Chinese inflation spreads everywhere overseas, the local
employees are more optimistic about the business prospect according to a report released in the
end of 2010, which states that the employees look forward to an average wage increase of 13
percent in 2011, up from 12 percent for 2010. Taking the inflation into consideration, the
employees still enjoy a real wage increase of 8 percent. Therefore, the employees gain more
money and can keep purchasing foods and household goods without being largely influenced by
the increase of price. To accept the logic above, one condition has to be promised – the equality
of income distribution. However, China has been afflicted by the income inequality since the
reform of labor market in 1997. There are income disparities not only among regions but also in
different sectors. The Gini coefficient, an income distribution gauge used by economists,
worsened from below 30 in 1980 to 47 in 2010. Hence, for the specific group who is at the
lowest income, it is difficult to overcome the price surge especially in food sector. The Chinese
government has begun to carry out measures to ensure fair income distribution and sets it as an
important task for the next five years. The government will tackle the distribution problem in
these aspects: a) increase the salary of low-income group and minimum living allowances; b)
restrain the salary in the industries with overly high incomes; c) protect lawful income, ban
7 / 76
illegal income and regulate excessively high income.
1.2 Objective of research
China is developing in a unique way and there is no lessons, among those industrialized
economies, matching it so well and hence can be learned. Therefore, the research of the central
bank independence and the intensity of inflation should be put under a unique setting and to
consider more economic variants so that acquire the comprehensive understanding of the issues
of research. Generally speaking, the paper tries to illustrate several points as following:
1) The difference between the PBC and the ECB in terms of organizational structure,
monetary policy objective, and monetary policy operations.
2) How large the difference between the independence level of the PBC and the ECB, and
what is the effect of the difference on the price stability in recent decade?
3) Is recent inflation in China really severe considering the factors as fast growth of income
and rapid economic development? To which one between income inequality and inflation
deserves to pay more attention?
4) What are the main causes from the recent Chinese inflation? What is the function of an
autonomic central bank for Chinese economic development in the long run?
1.3 Research method and thesis framework
The research method adopted is basically empirical analysis and the data will be generally
collected from authorized website such as World Bank, International Monetary Fund, National
Bureau of Statistics of China, etc. With systematic arrangements and calculation, the author
manages to explain the issues and points by the tables and graphs.
The thesis can be divided as seven parts. The literature review will be listed in the second
part. In the third part an introduction of the history, structure, monetary policy objective and
operations of the People’s Bank of China will be presented as a comparison with that of the
European Central Bank. In the fourth part, following a brief explanation of the theory about the
effect of independence level of central bank on price stability in China and euro zone, the
8 / 76
variants of income growth and rapid economic development will be included to further analyze
the recent inflation in China. In the end of this part, the author mentions that the income
inequality should be place more concerns than the inflation itself. In the fifth part, the author
analyzes the various reasons of the recent inflation in China. Afterwards, the paper turns to the
long-term function of central bank independence for the economic development in China. And
the determinants of central bank independence are discussed. To conclude the thesis, a summary
and the conclusion of the paper will be presented in the final part.
1.4 Research contribution
First of all, most of the papers about the relationship between central bank independence
and inflation focused on the central banks of industrialized countries and adopting the data
before 1990s. This thesis tries to bridge the gap to add one developing country inside the model
to compare the effect of independence between the PBC and the ECB. In addition, the statistical
data in former papers before 1998, when the ECB was established (exercised in 1999), cannot
reflect the influence of the ECB on the member countries of euro zone in terms of inflation.
Hence it is necessary to recollect updated data to illustrate the situation after the incumbency of
the ECB.
Secondly, simply weighting the inflation without considering the income growth is a
common way in former researches but unable to comprehensively analyze the intensity of
inflation. This paper discusses the price inflation issue combined with growth of income,
illustrates the trends in these aspects between China and euro zone. Besides, the inflation
situation is compared among four of the rapid developing economies - BRICs. Since the rapid
developing economies generally have a higher inflation than those in the industrialized countries,
so there are more values when analyze the Chinese inflation in such a group of economies which
stay in similar condition.
Thirdly, the paper emphasize on the effect of income inequality on inflation, which
indicates that the poor group in China will be afflicted by the price surge because their income

9 / 76
growth and wage level is not enough to offset the increase of price. Compared with inflation
issue in China, the issue of income disparity should be paid more attention to. This is a
characteristic which makes China special and different to other industrialized countries when
weighting the intensity of inflation.
Finally, the thesis indicates that the primary causes of recent inflation in China. Although
low degree of CBI maybe has its influence on price stability in China, it is less decisive on recent
inflation than the factors like Balassa-Samuelson effect, sterilization in pegged exchange rate,
supply shock in food. The analysis of the possible causes of inflation and can serve as a reference
for the relevant decision-making officers to solve the problem of price surge.
2. Literature Review
2.1 Organizational structures and instruments of central banks
The introduction of the PBC’s structure and history is discussed by Paul Conway, Richard
Herd (2010), which indicates the development of the PBC from the time before liberation of
China to the near 2000s. Yoon Je Cho (2000) presents in his paper the transition of banking
system in China. It includes several aspects as the independence of the central bank to implement
the monetary policy has been enhanced, the bank regulation change from solo-economic focus to
increasing prudential focus. Dong He (2008) introduces the monetary policies of the PBC. The
dual monetary policy objective and policy framework which consists of final target, intermediate
targets, and operating target are presented although the PBC does not appear to articulate them
clearly. Dong He also classifies the monetary instruments as two categories, for one thing, those
can be easily observed by the public as reserve requirement ratio, deposit and lending rate, open
market operations, and for another, those cannot be easily observed like windows guidance and
administrative measures.
A systematic comparison of the Euro-system, US Federal Reserve System, and the Bank of
Japan is presented by Dieter Gerdesmeier (2007). The structures and organization of these three
central banking systems reflect different historical conditions and national features. Barbara
10 / 76
Roffia (2006) find that the central banking practices around the world have evolved in the
direction of greater independence, transparency and the adoption of monetary policy committees.
Goodfriend (1999) observes that both the Fed and the Euro-system are federal central bank
systems. The ECB has in general a role similar to that of the Fed’s Board of Governors, while the
12 NCBs of the Euro-system play a role similar to the 12 regional Federal Reserve Banks in the
US. In a similar style the president of the ECB chairs the Governing Council meetings in much
the same way as the chairman of the Fed’s Board of Governors chairs the meeting of the Federal
Open Market Committee. As to the monetary policy objective, Wynne (1999) and Bernanke
(2003) find that the ECB has the mandate to pursue price stability which contracts with the Fed’s
multiple-objective mandate. However, it has been argued that despite its multiple objectives, the
Fed has traditionally placed more emphasis on achieving price stability and, in recent years,
there have been requirements for a clearer price stability mandate for the Fed. According to
Winkler (2002) the effective way to communication of monetary policy requires a balance to be
struck between being open about the complex nature of policymaking, and simplifying the
presentation of this process in the interest of greater clarity. Dieter Gerdesmeier also explain the
main elements of the ECB’s monetary policy strategy – a quantitative definition of price stability
and a comprehensive analysis of the risks to price stability. The different risks to price stability
are assessed by integrating economic analysis with monetary analysis into a unified framework.
The monetary instruments of the ECB is illustrated by Olli Lehtimaki (2009) to make readers to
understand how differences in available instruments may lead to different policy decisions
during the recent financial turmoil. It proposes that in the euro area there are limited instruments
available to conduct monetary policy, compared to those available in the US. The main
refinancing operations are the most important in pursuing the objective of the ECB under normal
circumstances, but the fine tuning operations plays the most noticeable role during the turmoil.
The standing facilities are aimed to provide or absorb overnight liquidity, hence indicating the
stance of monetary policy and affecting the overnight interest rate.
2.2 The effect of central bank independence on price stability
2.2.1 The meaning of central bank independence
11 / 76
Most discussions of central bank independence have focused on two key dimensions of
independence. The first dimension consists of those institutional characteristics that insulate the
central bank from political influence in defining its policy objectives. The second dimension
consists of those factors that allow the central bank to freely implement instruments in pursuit of
monetary policy objective. Grilli, Masciandaro, and Tabellini (1991) named these two
dimensions “political independence” and “economic independence”. A more common
terminology is come up with by Debelle and Fischer (1994) who called these two dimensions
“goal independence” and “instrument independence”. Goal independence refers to the central
bank’s autonomy to determine the goal of policy without the direct influence of the fiscal
authority. In the UK, the Bank of England lacks goal independence becuase the inflation target is
set by the government. In the US, the Federal Reserve’s goals are set in the legal charter, but
these goals are described in vague terms (e.g. maximum employment), allowing the Fed to
translate them into operational goals. In euro-system, price stability is mandated as the goal of
the ECB, but the ECB can choose how to interpret this goal in terms of a specific price index and
definition of price stability. Thus, the Fed and the ECB has a higher level of goal independence.
When it comes to instrument independence, it refers only to the central bank’s ability to freely
adjust its policy instruments in pursuit of the goals of monetary policy. The Bank of England,
despite lacking goal independence, has instrument independence. It is able to sets its instruments
without influence from the government. The Fed and the ECB have complete instrument
independence.
2.2.2 Measurements of central bank independence
The usual approach to quantify the central bank independence has been to create an index of
CBI based on some elements in the charter or status of the central bank. One of the earliest
attempts at creating an index of CBI was from Bade and Parkin (1985) who measured the degree
of legal CBI in the post-Bretton Woods period in 12 OECD countries according to the degree of
financial and policy independence that the central banks enjoyed. The financial factors were the
ability to set the remuneration of the members of central bank’s governing board, control the
central bank’s budgets and allocate its profits. The policy factors refer to the ability to appoint

12 / 76
the central bank’s board members, the proportion of board members appointed by the
government and whether it was the government or the board who had the final decision on
monetary policy. Countries were given scores from 1 to 4 in each category, with 4 being the
highest and 1 being the lowest level of CBI. The authors found that financial independence was
not a significant determinant of inflation, and policy independence was an important determinant
of inflation in the expected direction.
An alternative early measurement of legal CBI was created by Grilli, Masciandaro and
Tabellini (1991), or GMT, which based on economic and political factors in 18 OECD countries
over the period 1950-1989. Although the political factors adopted by GMT were the same as the
policy factors employed by Bade and Parkin, the economic factors GMT considered were the
ability of the government to determine the conditions under which it could borrow from the
central bank and the choice of monetary instruments. In each category the scale ranged from 0 to
7, the higher the score the more independent the central bank was thought to be. GMT
discovered that the negative link between inflation and the economic factors was statistically
significant but that between inflation and the political factors was not. Alesina and Summers
(1993) created a “hybrid” index of legal CBI by averaging the indices produced by Bade and
Parkin and GMT. In addition, Alesina and Summers expanded the number of countries in Bade
and Parkin’s sample with four more countries and used data for the 1955-1988 period. They also
pointed out a negative correlation between CBI and inflation.
The indices created by Cukierman (1992) for 70 countries over the 1950-1989 periods are
much more comprehensive than those from other authors. Unlike the other authors, Cukierman
(1992) went beyond the legal measures to produce practical indices of CBI. Legal CBI (LCBI)
was determined from answers to 16 questions covering the four areas: the terms and conditions
for appointing and dismissing the chief executive officer or the governor of the central bank (4
questions); the formulation of monetary policy (3 questions); the objectives of monetary policy
(1 question); and the conditions for lending to government (8 questions). Each of the questions is
rated by a numerical score ranging from 0 (the lowest level) to 1 (the highest level). Practical
13 / 76
independence has two parts: the turnover rate of the central bank governor (TOR); and the index
constructed from the answers resulted from a questionnaire dealing with the actual practice
(QCBI). The scores for the index on practical CBI also range from 0 to 1. To reflect the changes
in central bank rules and other developments that have taken place since Cukierman published
his data on CBI in 1992, a number of researchers have practiced to update the data on legal CBI
and TOR. Two of such data sets are the legal CBI data created by De Souza (2001) and the TOR
data created by Sturm and de Haan (2001). De Souza provides data on legal CBI in order to
assess the relationship between indicators of legal CBI and indicators of central bank
accountability. The legal variables used by De Souza are in large extent based on Cukierman’s
variables, but De Souza employed different numerical coding to reflect revisions in the charters
of 32 central banks (including the European Central Bank). In contrast to the 16 questions and 4
categories adopted by Cukierman, De Souza used 9 questions covering 3 categories: personal
independence (3 questions); political independence (4 questions); and economic and financial
independence (2 questions). The scores for the questions ranged from 0 to 1. Sturm and De Haan
(2001) studied only less developed countries for which TOR is thought to be a better index of
CBI than LCBI. They provide TOR figures that cover the 1990-98 periods.
2.2.3 Empirical evidence
In 1990s many countries, both developed and developing, adopted reforms that increased
the central bank independence. This trend was largely caused by the empirical analysis of the
relationship between CBI and price stability. Several authors like Bade and Parkin (1982), Grilli,
Masciandaro, and Tabellini (1991) found that among the developed coutries, central bank
independence was negatively correlated with average inflation. The estimated effect of
independence on inflation was empirically and economically significant. The form of
independence may also have effect on inflation. Debelle and Fisher (1994) reported evidence that
it was goal independence and instrument independence that produced low average inflation,
although the empirical evidences were weak.
Even if the central bank independence leads to lower inflation, the benefit from an
14 / 76
autonomic central bank would be greatly weakened if it also leads to greater real economic
instability. However, Alesina and Summers (1993) found that there was little relationship being
found between measures of real economic and central bank independence. In other words,
countries with more automatic central bank enjoy lower average inflation rate without suffering
from more volatile real economic activity, so that it appears to be a free lunch.
While the central bank independence was proposed to be negatively associated with
inflation among developed countries, this was not the case among developing countries.
Cukierman (1992) found that turnover rate could better reflect the degree of central bank
independence in the developing countries and legal independence measures may be a better
index for independence in industrialized countries. Jan Egbert Sturm and Jakob de Haan (2001)
stated in their paper that turnover rates of central bank governors were positively correlated with
inflation. Countries that experienced rapid turnover among their top level officers also tended to
experience volatile price change.
On the other hand, the empirical work of the function of CBI on price stability has been
criticized along two aspects. For one thing, studies of central bank independence and inflation
often failed to control adequately the other factors that might account for cross-country
differences of inflation. After controlling the other potential variants of inflation, Campillo and
Miron (1997) found that CBI plays no role in determining inflation outcomes. For another,
taking a country’s degree of central bank independence as exogenous may be problematic. Posen
(1993) argued that both low inflation and central bank independence reflect the presence of a
strong constituency for low inflation. Average inflation and the degree of central bank
independence are jointly determined by the influence of political constituency who opposed to
inflation. Without the constituency, simply increasing CBI will not lead to decrease of average
inflation.
2.3 Wage growth
The economic reform in 1970s made China experience a smooth and rapid economic
15 / 76
growth. Jun Han and Junsen Zhang (2007) introduce some important events during 1990s
stimulating the change of wage growth rate such as the liberalization of labor market, the broken
the “iron bowl” of employment for the workers in the state owned enterprises, and the large
proportion worker being laid off. Giles, Park, and Cai (2006) document the employment
participation rate from 1996 to 2001 using data from the China Urban Labor Survey. But the
dataset only contains limited regional information of five large cities (Shanghai, Wuhan,
Shenyang, Fuzhou, and Xi’an). Jun Han and Junsen Zhang (2007) observe in their research a
phenomenon of rising urban wage, increasing unemployment levels and declining participation
level. The wage level has been largely understated in the Statistical Yearbook of China.
Imai (2000) indicate that the pre-reform China adopted a remuneration schema that paid
worker less than the value of their marginal product, which means an implicit tax on workers.
John A. Bishop, Andrew Grodner and Haiyong Liu (2007) make a hypothesis that the earning
growth in China results from the reduction of implicit taxes paid by the workers. The labor
market reform was accompanied by the weakening of the state’s monopolistic power. To finance
capital investment, the government increasingly turned to foreign investment, which increased
from 6.2 billion $US in 1988 to 111.4 billion in 1993. Thus, the ability and necessity of raising
funds through implicit taxes on labor has fallen during that period.
As to the comparison of earning growth between China and India, Oliver Bargain and
Zhong Zhao (2007) undertake an empirical analysis and witness a phenomenon that although
there is a steep rise of earning in both countries China is much faster than India. They focus on
the role of differences in educational opportunity and return to education to explain the
difference of average earning in two countries.
When it comes to the situation of wage growth in euro zone, quite a number of papers focus
on the labor market effect of euro-system. On the theoretical side, Gruner and Hefeker (1999)
and Cukierman and Lippi (2001) argue that euro-system might lead to higher nominal wages,
unemployment and inflation in euro-system member countries. The intuitive reason in their
16 / 76
papers is that a centralization of monetary policy increases the number of trade unions.
Consequently, the central bank response less to national or sector-specific wage increases which
induces trade unions to act more aggressively. According to Jensen (1993) monetary policy
cooperation may increase nominal wages, inflation and decrease employment when the national
economies are subject to symmetric shocks. The reason is that inflation becomes more uncertain
in a cooperative context as compared to a non-cooperative context. This results in trade unions to
require higher wages. Posen and Popov Gould (2006) investigate the impact of euro-system on
wages empirically and find that the euro-system has not led to more aggressive wage claims.
Rather, euro-system has strengthened wage restraint. However, the research does not allow them
to conclude to what extent the observed movement of wages was particular to member states of
the euro area or rather a manifestation of a more general trend common to all industrial
countries.
Several papers analyze the impact of the euro-system on labor market reforms. For instance,
according to Sibert and Sutherland (2000) monetary centralization increases the incentive to
make labor markets more flexible and to reform factors which affect the inflation bias if
macroeconomic shocks are uncorrelated across countries or the number of member countries in
the monetary union is large because in this case the central bank is unable to stabilize shocks. In
contrast, if the opposite holds true then a decentralized monetary policy may generate more
reforms since countries aim at protecting themselves from others’ policies. Hence, a common
monetary policy may produce more inflation than a decentralized measure. On the empirical side,
Duval and Elmeskov (2006) investigate whether the introduction of the euro-system enhances or
hinders product and labor market reform and observe a slowdown of intensity of reform in those
euro-zone member countries after the introduction of the euro-system.
As to the wage convergence in euro zone, Pichelmann (2001) was the first study to
investigate such an area. He examines the situation of the convergence by calculating
cross-country correlation coefficients for nominal wages and nominal unit labor costs for two
periods ranging from 1970-1985 and from 1986-1999 respectively. While the results of research
17 / 76
reflect that some countries tend to depart from the overall development, he basically finds a
tendency towards stronger nominal and real wage convergence which is mainly triggered by a
core group of EU-11 countries. Similar evidence has been illustrated in the European
Commission (2003). This study investigates cross-country coordination among different sectors
through calculating correlation coefficients and through establishing regression for specific
sectors in selected countries during the period of 1980 – 2001 (e.g. textile sector in Italy or
fabricated metal sector in Belgium). They find significant correlation in some sectors especially
in those of trading sectors. However, they conclude that the convergence was stronger in the
1980s than in the 1990s. Mora et al (2005) tests the degree of convergence of wage and
productivity in the euro zone member countries. With a data sample from OECD national
accounts, he estimates the β-convergence of unit labor costs, nominal wages, real wages and
labor productivity for the period of 1980 – 2001. He finds robust evidence in the convergence of
unit labor costs, nominal wages and productivity, but for real wage there is less evidence.
Dullien and Fritsche (2008) take an alternate approach and examine whether divergences of
relative nominal unit labor should be judged as “harmful”. Harmful divergences are defined as
divergences result from structural rigidities which might have serious economic consequences in
the medium and long run. They find the development of relative nominal unit labor costs is well
in line for most members of the euro zone, except for Portugal and Spain.
2.4 Income inequality
The continued high growth in China since its economic reform in 1970s has been
accompanied by rising income inequality. The literature on income inequality in China is
extensive. Three types of data have been adopted by researchers: unit-level household survey
data, aggregate income data, and grouped household survey data. Because of the absence of
consistent data covering the entire nation, studies based on unit-level data often focus on a
particular segment of the population, such as urban households (Cao and Nee 2005, Meng 2004)
or rural households (Gustafsson and Li 2002). Aggregate data, at the provincial level, have been
used to investigate the spatial dimension of inequality by Hussain and Zhuang (1994), Kanbur
18 / 76
and Zhang (2005). More recently, attempts have been made to study the Chinese income
inequality by extrapolating unit-level data from grouped household income data. Remarkable
examples are Ravallion and Chen (2007) and Chotikapanich et al. (2007). Despite these efforts,
the picture of income inequality in China is still incomplete, and many questions yet get no
answers. For instance, although the widening spatial disparity and urban–rural income gap are
often highlighted as the key drivers of increases in the national inequality, quantification of their
relative contributions with data representative of the entire nation is still absent.
Tun Lin, Juzhong Zhuang, Damaris Yarcia, and Fen Lin (2008) investigate the income
inequality in China with two objectives. The first objective is to examine the trends of urban,
rural and overall inequality at the national, regional, and provincial level during 1990 – 2004.
The second is to carry out decomposition analysis to examine and quantify to what extent the
increase in the national inequality were driven by within-urban and within-rural inequality,
inequality between urban and rural population, and the within-inequality of regions and
provinces.
Some authors as Gustaffson et al (2008), Kahn and Riskin (2008) show that after a period of
sharp increase since the reform the rise of overall inequality in China has slowed down since the
second half of 1990s. They conclude from empirical evidences that within-urban and
within-rural inequality and regional inequality in the east part of China have been narrowed
because of expanded urbanization, increased employment opportunities for the rural population
and the trickling down effect of macroeconomic growth.
3. The Central Bank Frameworks in China and Euro Zone
3.1 History of two central banks
The People’s Bank of China (PBC) was built up on 1st December, 1948, from the merger of
three banks - the Bank of Northern China, the Bank of North Sea, and the Northwest Peasant
Bank. It was located originally in Shijiazhuang, Hebei province and then moved to Beijing after
the liberation of China in October, 1949. In order to cater to the name of socialism the PBC was

19 / 76
established and it was the only state-owned bank at that time. During the period of 1949 to 1979,
the PBC practiced the dual functions as central bank and general banking. It was not until 17th
September, 1983, did the PBC relieve its duties of commercial and saving banking functions, and
was ordered to perform exclusively the functions of a national central bank. And the original
deposit and lending transactions was transferred to the Industrial and Commercial Bank of China
(ICBC) which was established for this specific purpose.
With the “Law of the PBC” passed in 1995, the PBC began to take responsibility of
implementing monetary policy and banking supervision. According to the “Law of the PBC”, it
is to “independently implement monetary policies under the leadership of the State Council”.
Although the PBC has independence of implement monetary policy, the PBC operates under the
leadership of the State Council and needs to seek approval of the State Council prior to
implementation. In December 1998 the financial system reform created a new organizational
structure of the PBC, in which 9 trans-province branches were established in corresponding
economic region plus 20 financial supervisory offices located in the major cities.
When it comes to the European Central Bank (ECB), it was established in June 1998 in
Frankfurt, Germany, which formally replaced the European Monetary Institute (EMI) according
to the requirement of Maastricht Treaty. It was not until the introduction of the euro on 1 January
1999 did the ECB exercise its full function. At that time the design of European Monetary Union
(EMU) – one central bank, a free trade zone, and one currency within the EU – was fulfilled in
the third stage of development. To achieve the common goal that make business transactions
work more easily and smoothly, the EU adopts a common currency - euro. Up to now euro has
been in circulation among 17 of the 27 member countries of the EU.
To join the Euro Zone, the countries have to meet four criteria laid out by the Maastricht
Treaty to prove its eligibility. First, a country’s inflation rate was not to exceed the average
inflation rate of the three best performing member states by more than 1.5 percent. Second, long
term interest rates were not to exceed the average of the three best performing member states by
20 / 76
more than 2 percentage points. Third, the exchange rate of a country’s currency must have stayed
within the normal margins provided by the exchange rate mechanism for at least two years,
without devaluing against the currency of any other member states. Fourth, a country’s
government deficit-to-GDP ratio must not exceed 3 percent and its ration of government
debt-to-GDP must not exceed 60 percent (Dominguez, 2006).
According to the ECB the accomplishments of the integration of currency in financial
sectors are as following:
The euro area’s interbank money market is fully integrated.
The euro denominated bond market is well integrated, deep and liquid, and provides a
wide choice of investments and funding.
The euro area equity market is increasingly viewed as single market.
Domestic and cross-border mergers and acquisitions have increased among banks in the
euro area.
3.2 Organizational structures of two central banks
The top management of the PBC is composed of the governor and a certain number of
deputy governors. The candidacy of governor is nominated by the Premier of the State Council
and approved by the National People’s Congress (NPC), his appointment and removal from
office is decided by the president of the country. As to deputy governors, their appointments and
removals are subjected to the powers of the Premier of the State Council. For both the governor
and deputy governors, no terms of service is available.
The Monetary Policy Committee (MPC) plays a consultative role for the monetary policy
making and adjustment. It includes four members of the PBC (the governor, two deputy
governors, the administrator of the State Administration of Foreign Exchange), eight members of
the government (a deputy secretary of State Council, a vice minister of State Development and
Reform Commission, a vice minister of Ministry of Finance, a director of National Statistic
Bureau, the chairman of China Banking Regulatory Commission (CBRC), the chairman of China

21 / 76
Securities Regulatory Commission (CSRC), the chairman of China Insurance Regulatory
Commission (CIRC), the finance institute director of the Development Research Center of the
State Council), and three represents from state owned enterprises and academic area. The MPC
meets quarterly and its meeting opinions are attached as annex to policy decisions.
The ECB is made up of three governing bodies – the Governing Council, the Executive
Board, and the General Council. The graph bellow can better illustrate the relationship among
them.
Figure 1: Organizational Structure of the ECB
Source: European Central Bank Working Paper Series
The Governing Council’s role is to set down guidelines of action and make decisions which
ensure the continued performance of the tasks of the euro-system, and to formulate monetary
policy related to the interest rates and liquidity in euro zone. The Governing Council consists of
the six members of the Executive Board, and the governors of the national central banks of the
euro zone countries. The Executive Board plays a role to implement the monetary policy of the
NCB2
European System of Central Banks (ESCB)
ECBNCB1 NCB1…
Executive Board (6 members)
Governing Council (23 members)
Governors of NCBs (17 members in euro area)
Euro‐system
General Council
Governors of NCBs (non‐euro area)
NCB18 NCB19 NCB27…

22 / 76
ECB, prepare for meetings of the Governing Council, and conduct the daily business of the ECB.
The Executive Board is comprised of the president, the vice-president and four board members
who are appointed on the basis of professional merits and banking experiences. As to General
Council, it performs the reporting tasks on meeting, contributes to the advisory functions of the
ECB, the collection of statistical data. Its members include the president and vice-president of
the ECB plus all the governors of national central banks of the 27 EU member states. In other
words, it consists of representatives of both the euro area countries and the non-euro area
countries. The members of the Executive Board are appointed for a non-renewable eight year
term, the terms of office for the governors of national central banks range between five and eight
years.
3.3 Monetary policy objectives of two central banks
From 1984, when the PBC relieved the commercial banking functions, to 1995, China
practiced a dual monetary policy objective – promoting economic growth and maintaining the
stability of price. This objective was believed to be suitable to the traditional Planned Economy.
Nonetheless, as the coming of economic reform in China, the objective seemed out of date and
was revised in the “Law of the PBC” in 1995. The new objective of the monetary policy is to
maintain the stability of the value of the currency and therefore promote economic growth,
which put the priority to the stability of value of the currency and emphasized that the main
contribution of monetary policy is to build a favorable currency environment.
Compare with Chinese monetary policy objective, the euro-system has a definitely
dominant objective which is price stability. What the Treaty states is as following: “the primary
objective of the euro-system shall be to maintain price stability, without prejudice to the
objective of price stability, the euro-system shall support the general economic policies of the
Community with a view to contributing to the achievement of the objectives of the Community.
In pursuing its objective, the euro-system has to act in accordance with the principle of an open
market economy with free competition, favoring an efficient allocation of resources”. Therefore,
the hierarchy of objectives in the Treat determines the dominant position of price stability.
23 / 76
Besides, the ECB defined a clear quantitative standard that “maintain the year-on-year increase
in the Harmonised Index of Consumer Price (HICP) of below, but close to 2 percent over the
medium term”.
3.4 Monetary policy operations of two central banks
The monetary policy operations in China have experienced financial sector reform which
changed from direct controlling to indirect money market controlling. But at present the
liberalization of interest rate is yet not thorough. Wholesale transactions are now fully liberalized,
and the ceilings of lending rates and the floors of deposit rates are removed in retail transactions,
but a ceiling of deposit rates and a floor of lending rates is still retained in retail transactions. The
reason for such a special mechanism of interest rates framework is to protect banks’
intermediation margins (Zhou, 2005). Some financial innovations have paved the way to the
provision of market-based funds to corporations without subject to the control of banks’ interest
rates. First, the commercial paper (CP) has provided the large corporations with access to
funding. Although CP is subject to the PBC guidance in the primary market, its trading rates are
free in secondary market. Hence, it brings to more flexibility when price short-term financing
through the CP market than at the banks’ loan market. For this reason, the CP market expands
rapidly comparing to the market of loans, with a year-on-year increase of 51 percent in CP
balance in contrast to 14 percent for banks’ loan. Second, banks’ discount operations is beyond
the interest rates controls on banks lending operations, so that banks can make loans to the
customers at the rate below the statutory line. Finally, the liberalization of the foreign exchange
swap market in July 2005 combined with a free current account has built a way for
circumventing the control of interest rate. Corporations can access to the foreign exchange to
combine the Non Deliverable Forward (NDF) rates and spot operations to create a synthetic
RMB borrowing which at a lower interest rate below the domestic market and the PBC interest
rates.
Similar to other industrialized countries’ central banks, the PBC adopts a set of monetary
policy operations to practice liquidity management which is listed as following:

24 / 76
1) Standing facilities (SFs)
The PBC practices the SFs like: a) automatic collateralized lending (ACL). Banks can obtain
liquidity from the PBC at a rate below the rediscount rate, which is 2.97 percent if arranged
during the trading day; b) excess reserves facility (ERR), which amount to an automatic
deposit facility. Banks deposit their excess reserves in the PBC with a remunerated rate
which has been lowered from 1.62 percent in 2003 to 0.72 in 2008.
2) Open marketing operations (OMOs)
OMOs were introduced in 1993, paused in 1997 then re-introduced in May 1998, when the
PBC started transactions on bond which later replaced by repurchase transactions (repos). In
June 2002, the PBC started adopting reverse t-bonds repos to cope with foreign exchange
inflows. In September, when it ran out of t-bonds, the PBC started to sell its own bills,
following a transition period during which outstanding repos were converted into PBC bills.
OMOs are practiced two (or more) times a week. A primary dealer system in OMO was
started in 1998. In December 2005, the PBC made a trial use of foreign exchange swaps.
3) Reserve requirement (RRs)
Since the mid-1980s the ratio of RR was reduced from a peak of 13 percent to 8 percent in
March 1998, and to 6 percent in November 1999. In 2003 and 2004, the PBC raised the RRs
ratio to 7 percent and later to 7.5 percent. In April 2004 a differentiated RRs system was
adopted by the PBC in which banks with capital up to certain ratios or asset quality below
certain standards have to afford higher required reserves. The RRs ratio was raised three
times in 2006 (June, August and November), and again in January 2007 to 9.5 percent (10
percent for the financial institutions with a weak financial position) and till January 2010 to
16 percent.
4) Interest rate controls
Since October 2004, when the ceiling of banks’ lending rate and the floor of their deposit
rates were eliminated, banks depend on a mechanism to protect their intermediation margins:
deposit rates are set with a ceiling and lending rates with a floor. Since then, the PBC has
changed several times the benchmark rate in response to the macroeconomic unbalance. The
most recent adjustment was in April, 2011 which the PBC raised the lending and deposit

25 / 76
benchmark rates 25 bps respectively.
5) Window guidance
Despite the elimination of credit plans in 1998, the PBC holds meeting for the financial
institutions to provide guidance on credit growth and financial allocation. It is believed that
windows guidance includes lending volume guidelines. As an instrument of monetary policy,
Geiger (2006) contends that window guidance has been relatively successful because the
governor of the PBC who in charge of implementation is a higher ranking official than those
at the commercial banks.
6) Other administrative measures
Sometimes the PBC issues forced PBC bills aimed at commercial banks whose loans
growth is considered too fast.
Among them OMOs in the form of issuance of PBC bills play an important role for
sterilization of excess liquidity, and RRs provides necessary support to OMOs. So far, the cost of
sterilization through OMOs was restrained because of a positive differential between foreign and
domestic money market rates. However, this policy has involved a cost for the banking sector
when banks’ deposit rates have been kept above money market or PBC bill rates. In practice, the
PBC control short term interest rates so that it controls liquidity conditions in the interbank
market, and sets the rates of its bills, those two things related by its manipulation. Indeed, there is
a relative close relationship between the PBC bills rates and short-term interbank repo rates.
However, bank deposit and lending rates have been detached from PBC bills rates or money
market rates although they are also set by the PBC.
The interaction between the PBC’s standing facilities and OMOs is not fully consistent with
practices in the mature markets. Typically, OMOs aim at generating stable liquidity conditions. It
involves steering bank’s excess reserves to levels in line with banks’ minimum working balance,
avoiding excess reserves. Through the deposit standing facility, banks may be offered the
possibility to place its excess funds with the central bank, but the central bank would not use the
facility to sterilize liquidity on a permanent basis, as is the case in China with the excess reserves
26 / 76
facility but only to stabilize market rates. The implication of the current interaction between the
standing facilities and OMOs is that, if the financial institutions are allowed to freely price their
operations the short-term money market rate would be close to the excess reserve rates.
Considering its current level it is not a smart solution, hence, the PBC continues to rely on
administrative measures – windows guidance. Windows guidance was introduced in 1998 when
the PBC eliminated bank-by-bank credit ceilings. This instrument became institutionalized until
June 2003, when the PBC started the guidance process by publishing a notice aimed at curbing
the expansion of credit to the real estate sector. Together with the use of other monetary
instruments, the adoption of window guidance by the PBC is reported to the public in its
Quarterly Monetary Policy Reports and website.
The operation framework within euro-system includes Open Market Operations and
Standing Facilities (See Table1). The former are the most important operations which are
generally executed by NCBs on the initiative of the ECB and usually conducted in the monetary
market – the market in which the maturity of transactions is less than one year, while the later are
processed by the ECB and are available to the euro-system counterparties on their own initiative.
The OMOs can be divided into the four categories according to their purpose and
procedures:
1) Main refining operations
This is the most important type of OMOs that represents the key monetary policy measures
in the euro-system. They transfer the liquidity to the banking system and adjust the interest
rate to an appropriate status. Main refining operations are processed on a weekly basis and
have a maturity of one week. They are executed through standard tenders who process in
line with a pre-announced schedule. And they are executed within 24 hours from the
announcement to the communication of result. In general, all the credit institutions located
in euro zone are potentially eligible counterparties who can take part in this operation.
2) Long-term refinancing operations
With a period of three month maturity, long-term refinancing operations aim to provide

27 / 76
long term liquidity to the banking system. The operations prevent all the liquidity in the
monetary market from having to be rolled back over every week. Like the main
refinancing operations, the long-term refinancing operations are managed as standard
tenders in a decentralized manner, and all eligible counterparties can participate in the
operations.
3) Fine-tuning operation
Fine-tuning operations are conducted in specialized purpose, which can either be liquidity
absorbing or liquidity providing. They focus on managing liquidity situation and steering
interest rates, especially smoothing the effects of interest rate of unexpected liquidity
fluctuation. They are normally executed through quick tenders, which take one hour from
announcement to communication of allotment results. In principle, they are executed by
the NCBs, but Governing Council can decide to have bilateral fine-tuning operations
executed by the ECB. A good example is foreign exchange swap, which consist of two
transactions – a spot and a forward exchange transaction – which are executed at the same
time for the same quantity and therefore offset each other.
4) Structural operation
Structural operations are designed to adjust the structural liquidity position of the
euro-system related to the banking system. The measures for execution of the structural
operations are reverse transactions, outright operations or the issuance of debt certificates.
The standing facilities consist of two types of measures as follows. Through controlling of
these two rates of standing facilities, the ECB establishes a corridor within which the overnight
money market rate can fluctuate:
1) Marginal lending facility
The marginal lending facility provides collateralized overnight loans from central banks to
other financial institutions at a predetermined interest rate. Since the interest rate is
normally substantially higher than the corresponding market rate so that those institutions
only use it to gain fund as a last resort. Because the access to the marginal lending facility
is limited by the amount of collateral available, the interest rate generally provide a ceiling
28 / 76
for the overnight rate in the money market.
2) Deposit facility
In contrast to the marginal lending facility, the deposit facility allows the banks to make
overnight deposit with central bank at a predetermined interest rate. Since the interest rate
on the overnight deposit is substantially lower than the corresponding market rate so that
the counterparties only choose this facility when they cannot use their fund in other ways.
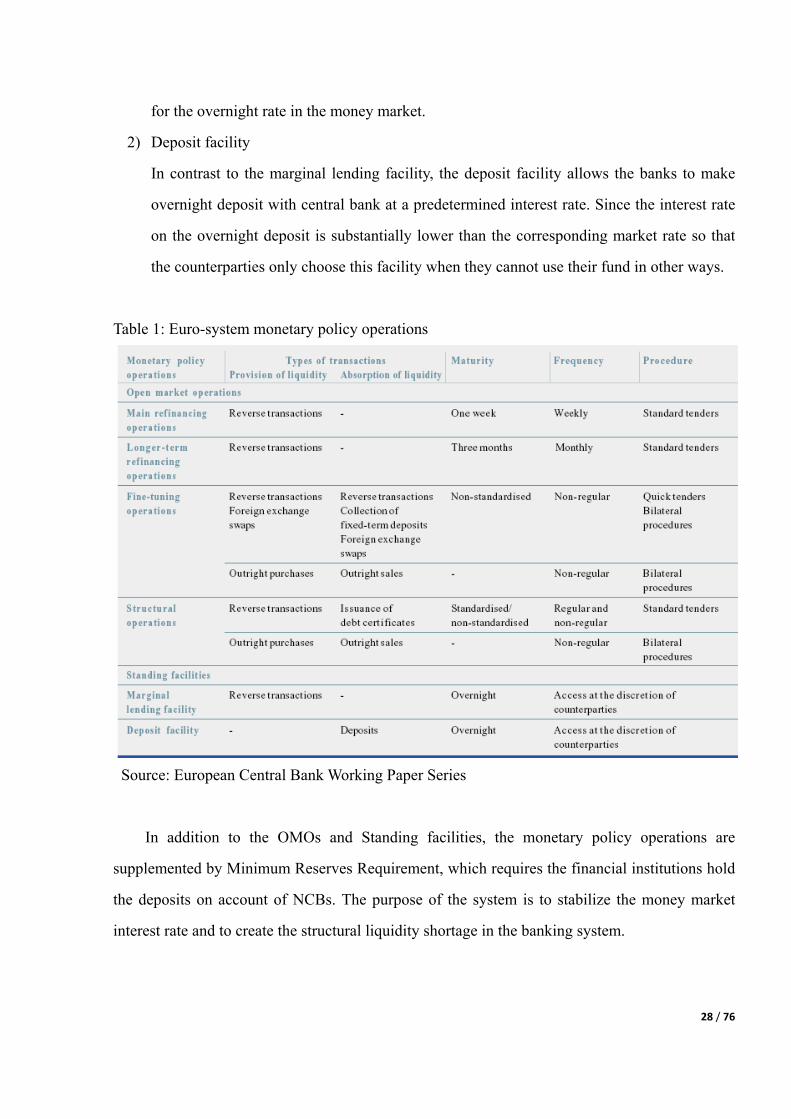
Table 1: Euro-system monetary policy operations
Source: European Central Bank Working Paper Series
In addition to the OMOs and Standing facilities, the monetary policy operations are
supplemented by Minimum Reserves Requirement, which requires the financial institutions hold
the deposits on account of NCBs. The purpose of the system is to stabilize the money market
interest rate and to create the structural liquidity shortage in the banking system.
29 / 76
3.5 Results from the comparison
From the comparison of every aspects between the PBC and the ECB, there are two points can
be concluded. For one thing, the differences in the organizational structure and the objective of
monetary policy of the two central banks are remarkable which may account for the large
disparity in their degree of central bank independence. For example, the appointment of governor
and terms of office largely determine the political independence, and the objective of monetary
policy determines the position of price stability in the hierarchy of different goals. For another, in
China the economic reform has driven the application of modern monetary policy instruments as
those in the euro-system. In this case, China also can adjust the economic conditions effectively
and better cope with the impact of inflation.
4. Central Bank Independence and Price Stability
4.1 Theory without income consideration
4.1.1 Among industrialized countries
The degree of central bank independence varies largely across different countries. Some
former authors made researches on the effect of central bank independence on the rate of
inflation and made conclusion that central bank independence promotes price stability (Vittorio
Grilli, Guido Tabellini 1991, Lawrence H. Summers 1993). To gauge the level of central bank
independence the authors adopted two dimensions: political independence and economic
independence. Political independence is the capacity to choose the final goal of monetary policy
like inflation or the level of economic activity. This capacity is in turn determined by three
aspects of a monetary regime - a) the procedure for appointing the members of the central bank
governing bodies; b) the relationship between the governing bodies and the government; c) the
formal responsibilities of the central bank.
The author gave a table as below which listing the 18 countries in terms of their scores in
the three aspects.
30 / 76
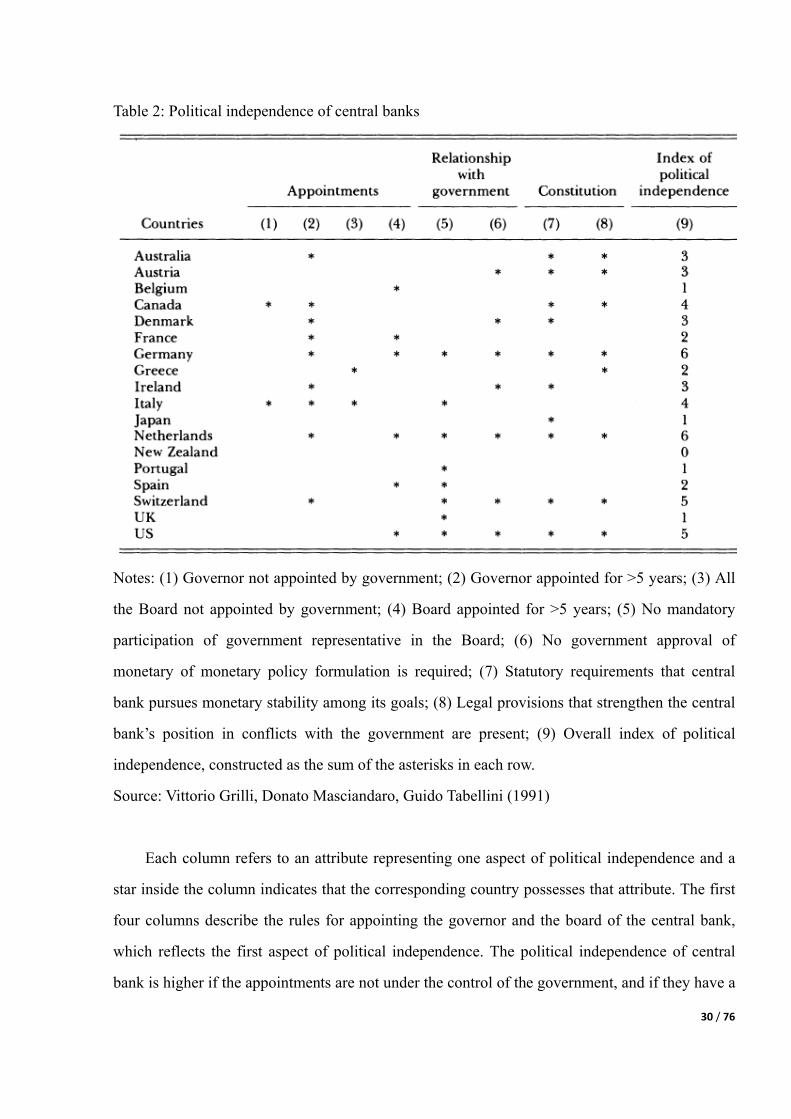
Table 2: Political independence of central banks
Notes: (1) Governor not appointed by government; (2) Governor appointed for >5 years; (3) All
the Board not appointed by government; (4) Board appointed for >5 years; (5) No mandatory
participation of government representative in the Board; (6) No government approval of
monetary of monetary policy formulation is required; (7) Statutory requirements that central
bank pursues monetary stability among its goals; (8) Legal provisions that strengthen the central
bank’s position in conflicts with the government are present; (9) Overall index of political
independence, constructed as the sum of the asterisks in each row.
Source: Vittorio Grilli, Donato Masciandaro, Guido Tabellini (1991)
Each column refers to an attribute representing one aspect of political independence and a
star inside the column indicates that the corresponding country possesses that attribute. The first
four columns describe the rules for appointing the governor and the board of the central bank,
which reflects the first aspect of political independence. The political independence of central
bank is higher if the appointments are not under the control of the government, and if they have a
31 / 76
longer duration of term of office. Columns 5 and 6 indicate the relationship between the central
bank governing bodies and the government. The political independence level is higher if there is
no participation of a government representative in the board and if the government approval of
monetary policy is not legally required. Columns 7 and 8 reflect how the central bank’s
constitutional position is. The independence degree is increased if its role of keeping price
stability is explicitly stated in the constitution, and if there are clear legal directives describing
how to solve the conflict, if it happens, between the central bank and the government.
Economic independence is the capacity to choose the instruments with which to meet the
final goals of monetary policy. The autonomy of choosing monetary policy instruments can be
divided as follows: a) the influence of the government on how much to borrow from the central
bank; b) the nature of the monetary instruments under the control of the central bank. The
analysis of economic independence of central bank was processed on the same group of
countries as above.
Table 3: Economic independence of central bank

32 / 76
Notes: (1) Direct credit facility: not automatic; (2) Direct credit facility: market interest rate; (3)
Direct credit facility: temporary; (4) Direct credit facility: limited amount; (5) Central bank does
not participate in primary market for public debt; (6) Discount rate set by central bank; (7)
Banking supervision not entrusted to the central bank (**) or not entrusted to the central bank
alone (*); (8) Overall index of economic independence (being the sum of the asterisks in
columns 1-7).
Source: Vittorio Grilli, Donato Masciandaro, Guido Tabellini (1991)
The government can access to the central bank credit by direct credit facilities (column 1-4)
or by central bank purchasing government securities in the primary market (column 5).
Economic independence of the central bank is higher if direct credit to the government is:
non-automatic (column 1), at a market interest rate (column 2), explicitly states as temporary
(column 3), and in a limited amount (column 4). As to the nature of monetary instruments, the
columns 6 and 7 describe this aspect. Column 6 reveals that whether the central bank have
control of discount rate so that to determine the level of interest rate. Banking supervision,
especially those administrative instruments like portfolio constraints on bank intermediaries or
ceilings to private bank loans, is explained in column 7. In order to facilitate the government
borrowing these instruments administratively increase the private demand for government
securities. Hence, they can weaken the central bank independence by lessening the monetary
control of the market.
One interesting finding is that political and economic independence are not always
positively correlated. Because of this, four groups of countries can be identified within the two
independences coordinate.
33 / 76
Figure 2: Political and economic independence of central banks
Notes: AUS = Australia AUT = Austria BEL = Belgium CAN= Canada
DEN = Denmark FRA = France GER = Germany GRC = Greece
IRL = Ireland ITA = Italy JAP = Japan NET = Netherlands
NZ = New Zealand POR = Portugal SPA = Spain SWI = Switzerland
UK= United Kingdom USA = United States
Source: Vittorio Grilli, Donato Masciandaro, Guido Tabellini (1991)
Those in the upper-right part of the graph have the most independent central banks, which
enjoy both political and economic independence. In contrast, the countries on the lower-left part
have the least independent central bank. The remaining two groups of countries are in between,
with independent level in only one of the two dimensions.
By summing up the political and economical independence index, we gain the central bank
index of each industrialized country, or GMT index which in the name of three authors’ initial
letters. Besides, according to the average inflation data from 1980 to 1989, a trend line can be
34 / 76
generated to describe the correlation between central bank independence and inflation. In the
Figure 3 bellow, there exists an obvious negative correlation between central bank independence
and inflation.
Table 4: Central bank independence and inflation of the industrialized countries
Political Independence
Economical Independence
GMT AVG Inflation
(1980-1989)
AUS 3 6 9 8.41
AUT 3 6 9 3.80
BEL 1 6 7 4.90
CAN 4 7 11 6.51
DEN 3 5 8 6.33
FRA 2 5 7 7.34
GER 6 7 13 2.90
GRC 2 2 4 19.50
IRL 3 4 7 9.26
ITA 4 1 5 11.44
JAP 1 5 6 2.53
NET 6 4 10 2.84
NZ 0 3 3 11.87
POR 1 2 3 16.67
SPA 2 3 5 10.25
SWI 5 7 12 3.27
UK 1 5 6 6.99
USA 5 7 12 5.55
Note: GMT index is the sum of the political and economical independence index.
Source: Alberto Alesina, Lawrence H. Summer (1993), IMF

35 / 76
Figure 3: Scattered spots and trend line of average inflation (1980-1989)
Source: Alberto Alesina, Lawrence H. Summer (1993), IMF
4.1.2 Comparison between the PBC and ECB
To extend the model above, the author makes the same analysis between the PBC and the
ECB. The ECB is the central bank of the euro zone rather than of a country so that it is difficult
to compare the independence of the ECB with that of the PBC. Hence, the author compares these
two central banks’ independence level under several elements of concept.
Firstly, the central bank independence can be divided as three elements:
1) Personal independence
It refers to the influence of the government to the appointment process for the
governor, the duration of the terms of office, and dismissal procedures.
2) Financial independence
It concerns the separation between the financial of the government and of the central
bank, as well as the setting of the bank’s budget.
3) Functional independence
This is also named policy independence, which is related to the autonomy in
36 / 76
formulating and executing monetary policy.
Secondly, the independence levels of the ECB and the PBC are judged under these elements
above. The PBC has a relevantly lower score in all these elements. a) In the aspect of personal
independence, the PBC’s governor and deputy governors are nominated by the State Council
without clear requirement of qualification, and no specific terms of office is stipulated. This may
facilitate those who have political background to be selected. The State Council has its leeway to
nominate and appoint persons who are “loyal” to the government. b) As to financial
independence, the Law of the PBC stipulates that the budget of the PBC shall be incorporated in
the central budget after the examination of the Ministry of Finance, and should be under the
supervision of the Ministry of Finance. Besides, although the Law of Central Bank (1995) stated
that the Ministry of Fiscal is not allowed to get loans from the PBC, the loans was actually issued
in a transformed type – central bank refinancing. Central bank refinancing can be divided as two
types according to its purpose: for monetary policy execution and for financial stability. However,
in reality there is a large part of annual refinancing belong to policy lending to the projects as
public utilities in poor area, supporting loss-making state owned companies, subsidy to the
agri-business, and infrastructure building. And this sum of refinancing is actually a secret form
of loans to government. c) The fact that the operation of the PBC is under the leadership of the
State Council undermines the functional independence in large extent. Before implementing the
monetary policy decisions about money supply, interest rate and exchange rate, the PBC should
report them to the State Council for examination and approval. Therefore, most of the important
decisions of monetary policy fall into the control of the State Council while the PBC can only
autonomously master a little part of them. Since there is a conflict between the objective to
“maintain the value of currency” and to “promote economic growth”, and the State Council
usually has a bias towards the latter, hence it is difficult for the PBC to fulfill its function of
maintaining the value of currency.
When it comes to the ECB, the provisions of the Treaty established that the Euro-system is
independent from any political influence. Four main provisions promise the independence of the
37 / 76
Euro-system and its making decision. a) The ECB’s financial decisions are kept separate from
the financial interests of the European Community. The ECB has its own budget, and its capital
is subscribed and paid up by the NCBs among euro area. b) The ECB’s members of Governing
Council are endowed with relatively long terms, while a rule stipulates that members of the
Executive Board cannot be reappointed, therefore potential influence on individual members of
the ECB’s decision-making bodies is minimized. c) The Euro-system’s independence is
strengthened by the prohibition laid down in the Treaty of any supply of credit from central bank
to the public sector. d) As to the functional aspect, the ECB is at its disposal to choose the
instruments necessary to conduct its monetary policy and is authorized to decide autonomously
how and when to use them.
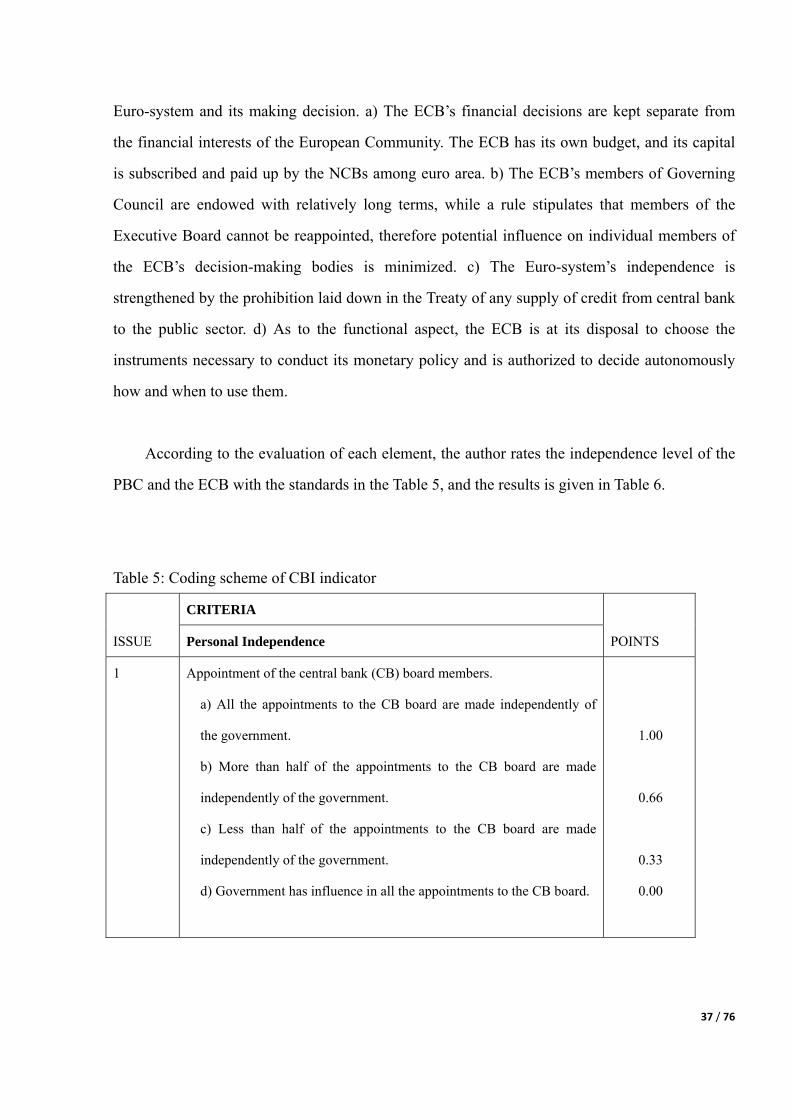
According to the evaluation of each element, the author rates the independence level of the
PBC and the ECB with the standards in the Table 5, and the results is given in Table 6.
Table 5: Coding scheme of CBI indicator
ISSUE
CRITERIA
POINTS Personal Independence
1 Appointment of the central bank (CB) board members.
a) All the appointments to the CB board are made independently of
the government.
b) More than half of the appointments to the CB board are made
independently of the government.
c) Less than half of the appointments to the CB board are made
independently of the government.
d) Government has influence in all the appointments to the CB board.
1.00
0.66
0.33
0.00
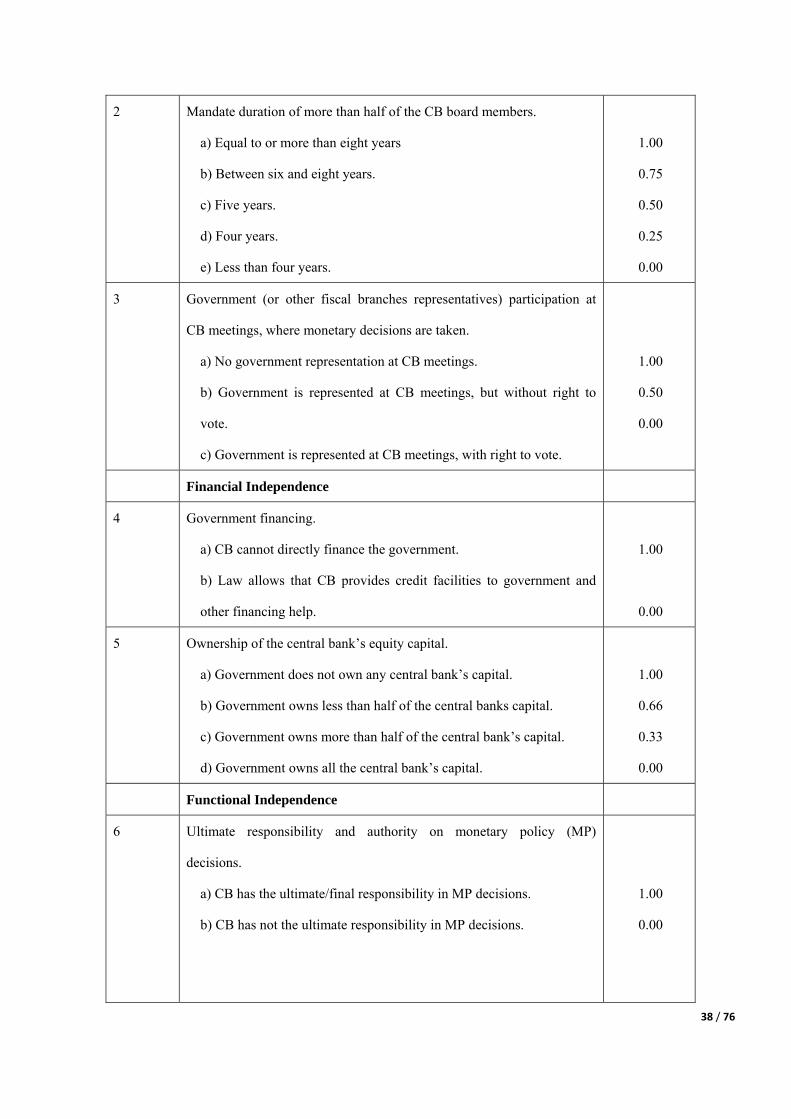
38 / 76
2 Mandate duration of more than half of the CB board members.
a) Equal to or more than eight years
b) Between six and eight years.
c) Five years.
d) Four years.
e) Less than four years.
1.00
0.75
0.50
0.25
0.00
3 Government (or other fiscal branches representatives) participation at
CB meetings, where monetary decisions are taken.
a) No government representation at CB meetings.
b) Government is represented at CB meetings, but without right to
vote.
c) Government is represented at CB meetings, with right to vote.
1.00
0.50
0.00
Financial Independence
4 Government financing.
a) CB cannot directly finance the government.
b) Law allows that CB provides credit facilities to government and
other financing help.
1.00
0.00
5 Ownership of the central bank’s equity capital.
a) Government does not own any central bank’s capital.
b) Government owns less than half of the central banks capital.
c) Government owns more than half of the central bank’s capital.
d) Government owns all the central bank’s capital.
1.00
0.66
0.33
0.00
Functional Independence
6 Ultimate responsibility and authority on monetary policy (MP)
decisions.
a) CB has the ultimate/final responsibility in MP decisions.
b) CB has not the ultimate responsibility in MP decisions.
1.00
0.00

39 / 76
7 Price stability.
a) It is the sole objective.
b) It is one of two objectives, but preference is given to price stability.
c) It is one among various other objectives.
d) Law does not establish anything about policy objectives.
1.00
0.66
0.33
0.00
8 Banking supervision.
a) Not considered in the objectives or functions of the CB.
b) It is one of the CB functions or objectives, where we find also price
stability as a policy objective.
c) It dominates other CB functions or objectives.
1.00
0.50
0.00
9 Monetary policy (MP) instruments.
a) CB enjoys autonomy in MP instruments selection.
b) CB is not autonomous in the selection of MP instruments.
1.00
0.00
Source: de Souza (2001)
Table 6: Score for CBI index
Institution Central Bank Independence
Personal Financial Functional Total
ECB 2.50 2.00 2.66 7.16
PBC 0.75 1.00 1.66 3.41
Source: de Souza (2001), and author’s calculation
Finally, the author compares the inflation change of both central banks from the 1999 to
2010. As illustrated in Figure 4, after the establishment of the ECB the inflation in euro area has
been kept close to two percent especially from 2000 to 2007. In 2008 the inflation jumped to 3.3%
as a result of a price surge in energy and food in the international range. But in 2009 the inflation
trend was immediately under control. When it comes to the situation in China there was larger
degree in the change of inflation during the period. From 2002 the inflation kept going up to

40 / 76
nearly 4 percent in 2004, then dropped continuously two years to 1.47 percent in 2006. Again it
rebounded to its peak in 5.9 percent in 2008, and following a minus figure in 2009 it began to
surge from 3.33 percent in 2010.
Figure 4: Comparison of price stability between the ECB and the PBC (1999-2010)
Source: Eurostat Dataset, IMF
In conclusion, the data above indicates that the inflation in China demonstrates a greater
volatility than that in euro zone. And the newly wave inflation from 2009 may surpass the peak
point of 5.9 percent in 2008 so that creates a trouble in the macroeconomic environment in China.
On the other hand, the effect of central bank independence on the price stability is not so obvious.
In one aspect, the volatilities of inflation can be attributed to many outside shocks, such as in
1999 China was subject to the influence of Asia financial crisis and stayed in the economic
trough with an inflation of minus 1.4%. As to its peak rate at 5.9 percent in 2008 and its recent
surge in price, there are still many explanations for the situation, such as Balassa-Samuelson
Effect, Sterilization in pegged exchange rate, etc, which will be introduced in detail in Section 5.
So people can only assume that the central bank independence partly influence the price stability
of China. In another aspect, the euro area has enjoyed more stable economic environment in
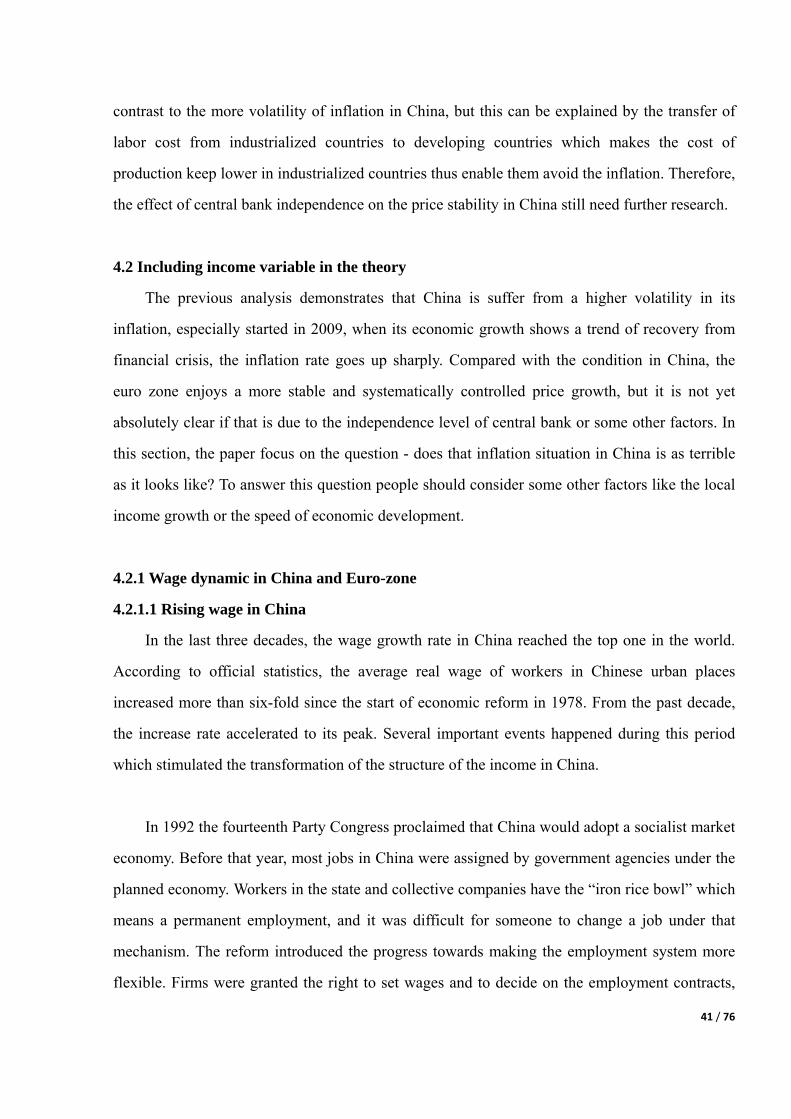
41 / 76
contrast to the more volatility of inflation in China, but this can be explained by the transfer of
labor cost from industrialized countries to developing countries which makes the cost of
production keep lower in industrialized countries thus enable them avoid the inflation. Therefore,
the effect of central bank independence on the price stability in China still need further research.
4.2 Including income variable in the theory
The previous analysis demonstrates that China is suffer from a higher volatility in its
inflation, especially started in 2009, when its economic growth shows a trend of recovery from
financial crisis, the inflation rate goes up sharply. Compared with the condition in China, the
euro zone enjoys a more stable and systematically controlled price growth, but it is not yet
absolutely clear if that is due to the independence level of central bank or some other factors. In
this section, the paper focus on the question - does that inflation situation in China is as terrible
as it looks like? To answer this question people should consider some other factors like the local
income growth or the speed of economic development.
4.2.1 Wage dynamic in China and Euro-zone
4.2.1.1 Rising wage in China
In the last three decades, the wage growth rate in China reached the top one in the world.
According to official statistics, the average real wage of workers in Chinese urban places
increased more than six-fold since the start of economic reform in 1978. From the past decade,
the increase rate accelerated to its peak. Several important events happened during this period
which stimulated the transformation of the structure of the income in China.
In 1992 the fourteenth Party Congress proclaimed that China would adopt a socialist market
economy. Before that year, most jobs in China were assigned by government agencies under the
planned economy. Workers in the state and collective companies have the “iron rice bowl” which
means a permanent employment, and it was difficult for someone to change a job under that
mechanism. The reform introduced the progress towards making the employment system more
flexible. Firms were granted the right to set wages and to decide on the employment contracts,
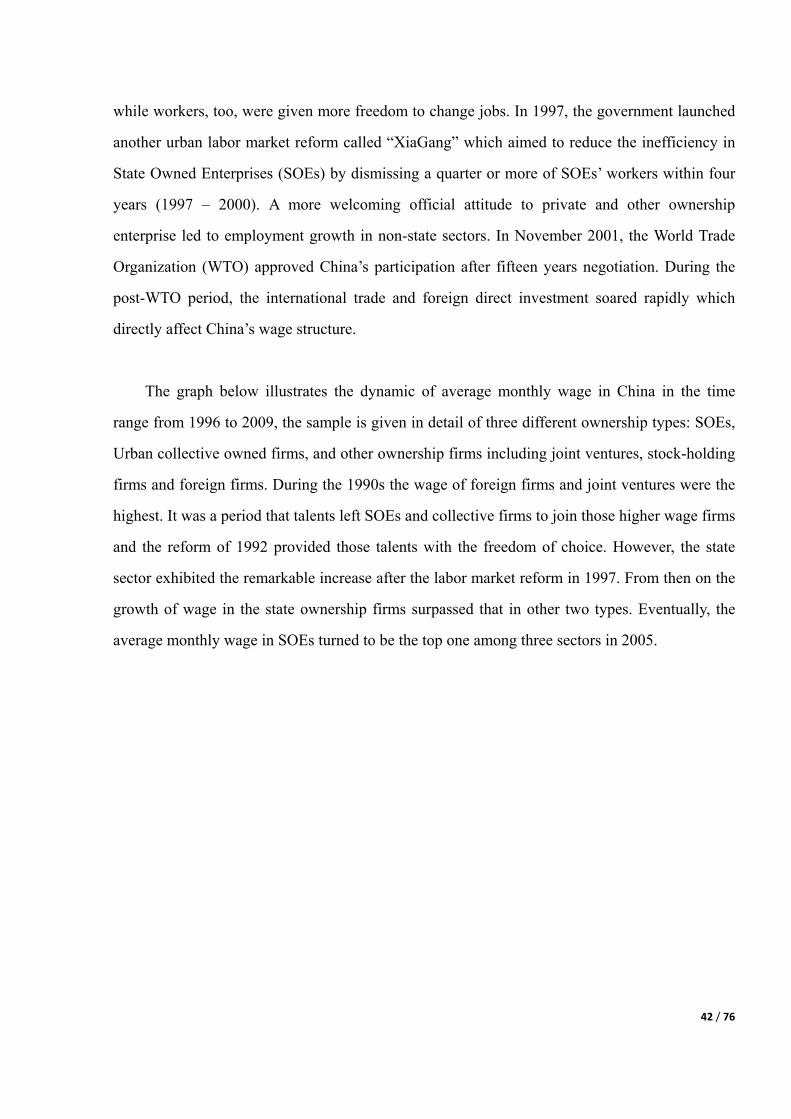
42 / 76
while workers, too, were given more freedom to change jobs. In 1997, the government launched
another urban labor market reform called “XiaGang” which aimed to reduce the inefficiency in
State Owned Enterprises (SOEs) by dismissing a quarter or more of SOEs’ workers within four
years (1997 – 2000). A more welcoming official attitude to private and other ownership
enterprise led to employment growth in non-state sectors. In November 2001, the World Trade
Organization (WTO) approved China’s participation after fifteen years negotiation. During the
post-WTO period, the international trade and foreign direct investment soared rapidly which
directly affect China’s wage structure.
The graph below illustrates the dynamic of average monthly wage in China in the time
range from 1996 to 2009, the sample is given in detail of three different ownership types: SOEs,
Urban collective owned firms, and other ownership firms including joint ventures, stock-holding
firms and foreign firms. During the 1990s the wage of foreign firms and joint ventures were the
highest. It was a period that talents left SOEs and collective firms to join those higher wage firms
and the reform of 1992 provided those talents with the freedom of choice. However, the state
sector exhibited the remarkable increase after the labor market reform in 1997. From then on the
growth of wage in the state ownership firms surpassed that in other two types. Eventually, the
average monthly wage in SOEs turned to be the top one among three sectors in 2005.
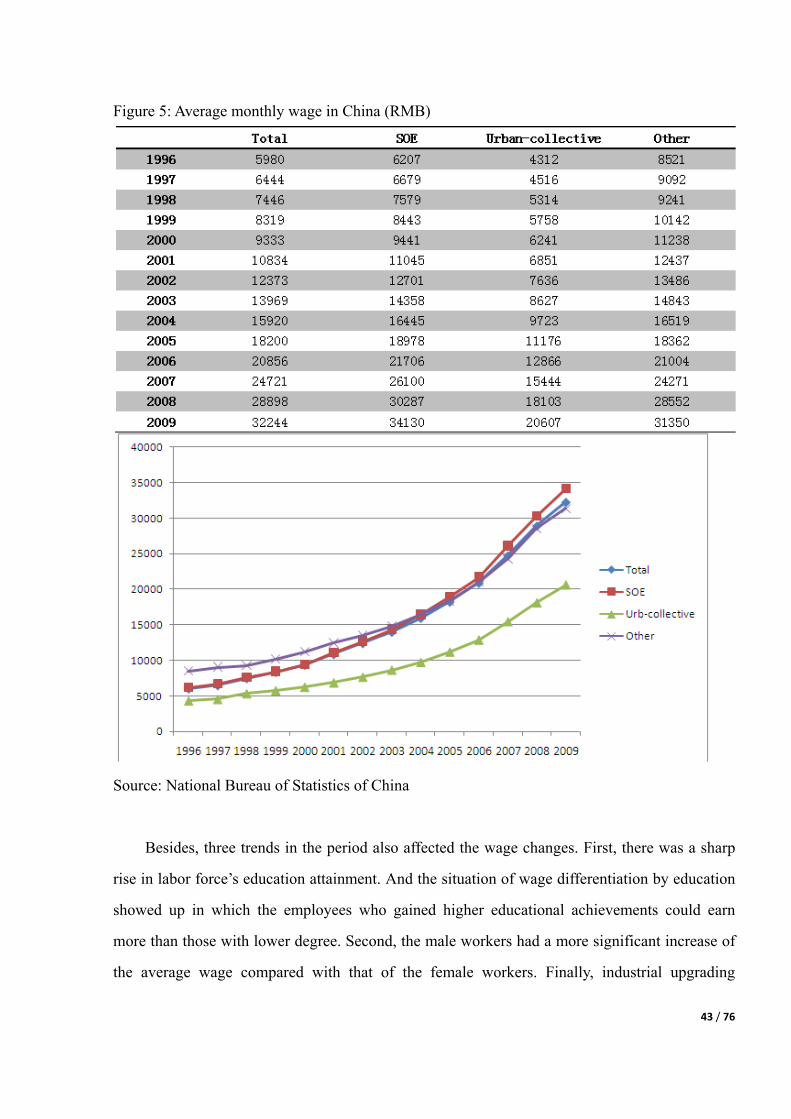
43 / 76
Figure 5: Average monthly wage in China (RMB)
Source: National Bureau of Statistics of China
Besides, three trends in the period also affected the wage changes. First, there was a sharp
rise in labor force’s education attainment. And the situation of wage differentiation by education
showed up in which the employees who gained higher educational achievements could earn
more than those with lower degree. Second, the male workers had a more significant increase of
the average wage compared with that of the female workers. Finally, industrial upgrading
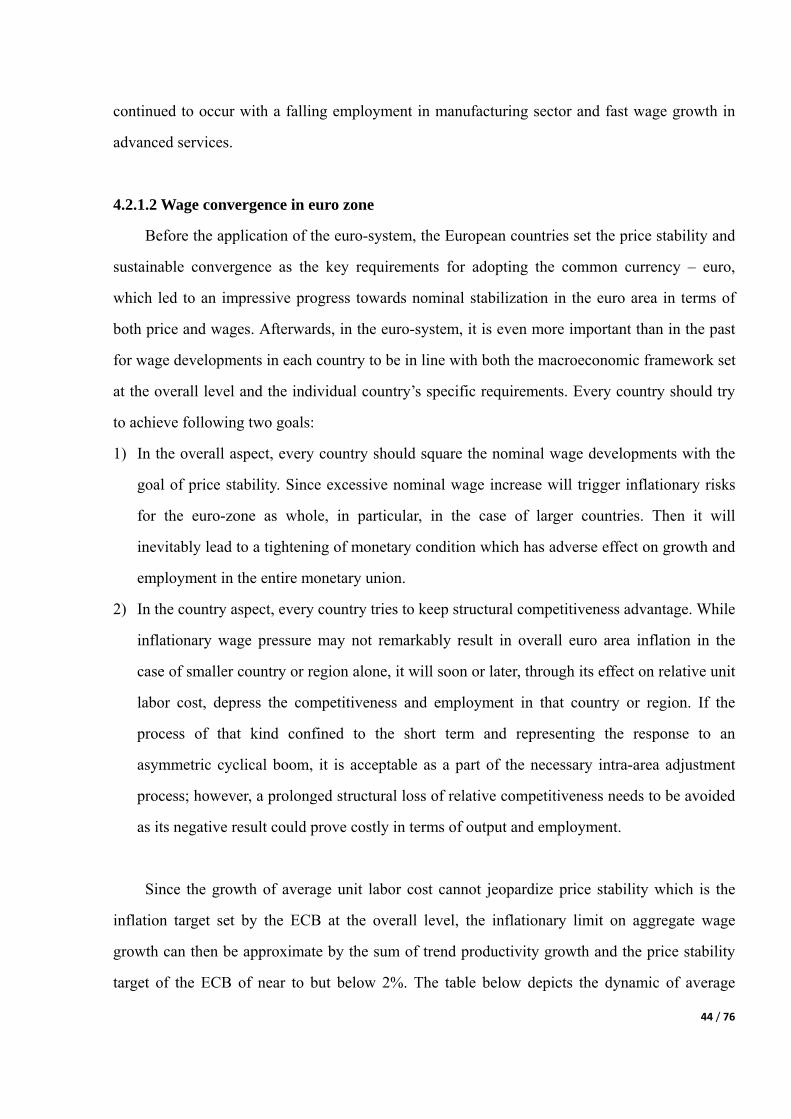
44 / 76
continued to occur with a falling employment in manufacturing sector and fast wage growth in
advanced services.
4.2.1.2 Wage convergence in euro zone
Before the application of the euro-system, the European countries set the price stability and
sustainable convergence as the key requirements for adopting the common currency – euro,
which led to an impressive progress towards nominal stabilization in the euro area in terms of
both price and wages. Afterwards, in the euro-system, it is even more important than in the past
for wage developments in each country to be in line with both the macroeconomic framework set
at the overall level and the individual country’s specific requirements. Every country should try
to achieve following two goals:
1) In the overall aspect, every country should square the nominal wage developments with the
goal of price stability. Since excessive nominal wage increase will trigger inflationary risks
for the euro-zone as whole, in particular, in the case of larger countries. Then it will
inevitably lead to a tightening of monetary condition which has adverse effect on growth and
employment in the entire monetary union.
2) In the country aspect, every country tries to keep structural competitiveness advantage. While
inflationary wage pressure may not remarkably result in overall euro area inflation in the
case of smaller country or region alone, it will soon or later, through its effect on relative unit
labor cost, depress the competitiveness and employment in that country or region. If the
process of that kind confined to the short term and representing the response to an
asymmetric cyclical boom, it is acceptable as a part of the necessary intra-area adjustment
process; however, a prolonged structural loss of relative competitiveness needs to be avoided
as its negative result could prove costly in terms of output and employment.
Since the growth of average unit labor cost cannot jeopardize price stability which is the
inflation target set by the ECB at the overall level, the inflationary limit on aggregate wage
growth can then be approximate by the sum of trend productivity growth and the price stability
target of the ECB of near to but below 2%. The table below depicts the dynamic of average
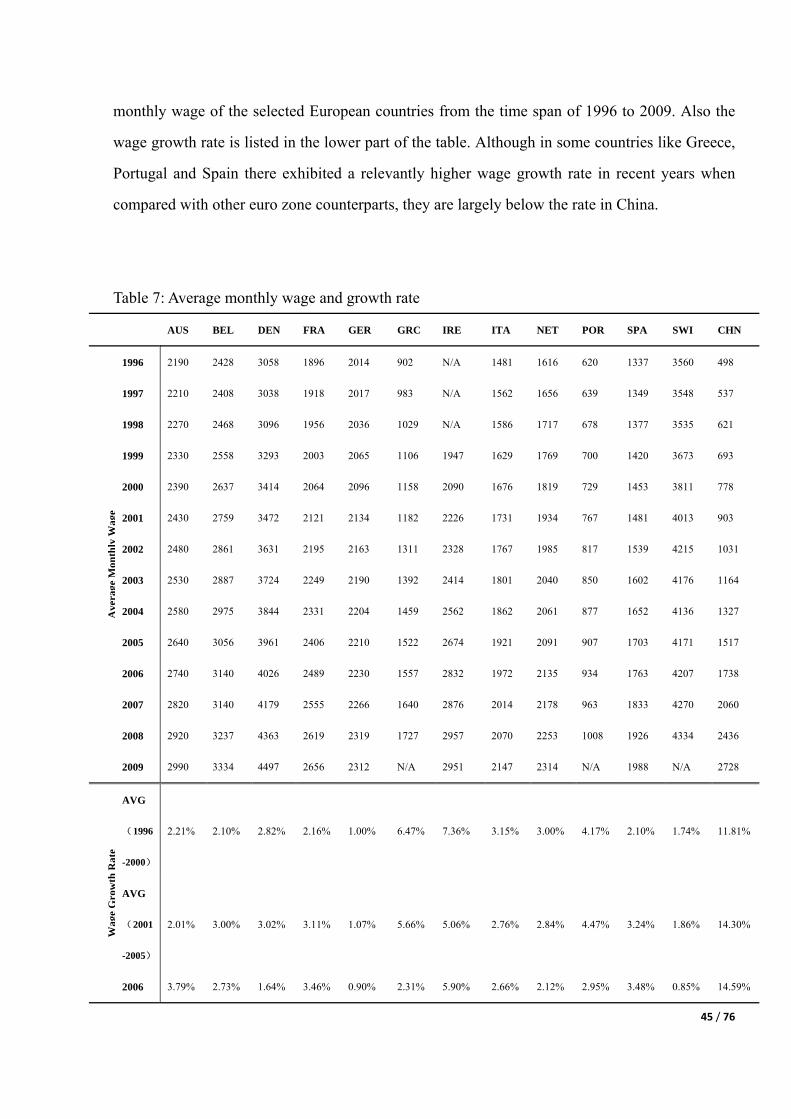
45 / 76
monthly wage of the selected European countries from the time span of 1996 to 2009. Also the
wage growth rate is listed in the lower part of the table. Although in some countries like Greece,
Portugal and Spain there exhibited a relevantly higher wage growth rate in recent years when
compared with other euro zone counterparts, they are largely below the rate in China.
Table 7: Average monthly wage and growth rate
AUS BEL DEN FRA GER GRC IRE ITA NET POR SPA SWI CHN
Ave
rage
Mon
thly
Wag
e
1996 2190 2428 3058 1896 2014 902 N/A 1481 1616 620 1337 3560 498
1997 2210 2408 3038 1918 2017 983 N/A 1562 1656 639 1349 3548 537
1998 2270 2468 3096 1956 2036 1029 N/A 1586 1717 678 1377 3535 621
1999 2330 2558 3293 2003 2065 1106 1947 1629 1769 700 1420 3673 693
2000 2390 2637 3414 2064 2096 1158 2090 1676 1819 729 1453 3811 778
2001 2430 2759 3472 2121 2134 1182 2226 1731 1934 767 1481 4013 903
2002 2480 2861 3631 2195 2163 1311 2328 1767 1985 817 1539 4215 1031
2003 2530 2887 3724 2249 2190 1392 2414 1801 2040 850 1602 4176 1164
2004 2580 2975 3844 2331 2204 1459 2562 1862 2061 877 1652 4136 1327
2005 2640 3056 3961 2406 2210 1522 2674 1921 2091 907 1703 4171 1517
2006 2740 3140 4026 2489 2230 1557 2832 1972 2135 934 1763 4207 1738
2007 2820 3140 4179 2555 2266 1640 2876 2014 2178 963 1833 4270 2060
2008 2920 3237 4363 2619 2319 1727 2957 2070 2253 1008 1926 4334 2436
2009 2990 3334 4497 2656 2312 N/A 2951 2147 2314 N/A 1988 N/A 2728
Wag
eG
row
thR
ate
AVG
(1996
-2000)
2.21% 2.10% 2.82% 2.16% 1.00% 6.47% 7.36% 3.15% 3.00% 4.17% 2.10% 1.74% 11.81%
AVG
(2001
-2005)
2.01% 3.00% 3.02% 3.11% 1.07% 5.66% 5.06% 2.76% 2.84% 4.47% 3.24% 1.86% 14.30%
2006 3.79% 2.73% 1.64% 3.46% 0.90% 2.31% 5.90% 2.66% 2.12% 2.95% 3.48% 0.85% 14.59%
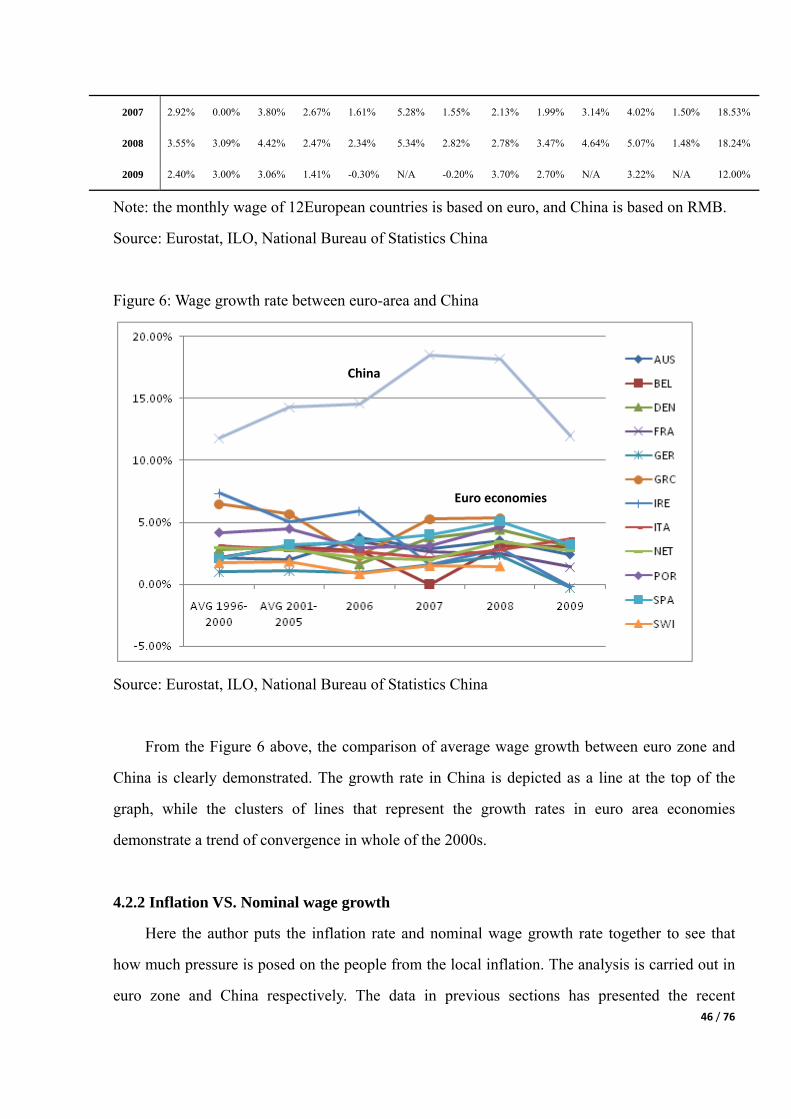
46 / 76
2007 2.92% 0.00% 3.80% 2.67% 1.61% 5.28% 1.55% 2.13% 1.99% 3.14% 4.02% 1.50% 18.53%
2008 3.55% 3.09% 4.42% 2.47% 2.34% 5.34% 2.82% 2.78% 3.47% 4.64% 5.07% 1.48% 18.24%
2009 2.40% 3.00% 3.06% 1.41% -0.30% N/A -0.20% 3.70% 2.70% N/A 3.22% N/A 12.00%
Note: the monthly wage of 12European countries is based on euro, and China is based on RMB.
Source: Eurostat, ILO, National Bureau of Statistics China
Figure 6: Wage growth rate between euro-area and China
Source: Eurostat, ILO, National Bureau of Statistics China
From the Figure 6 above, the comparison of average wage growth between euro zone and
China is clearly demonstrated. The growth rate in China is depicted as a line at the top of the
graph, while the clusters of lines that represent the growth rates in euro area economies
demonstrate a trend of convergence in whole of the 2000s.
4.2.2 Inflation VS. Nominal wage growth
Here the author puts the inflation rate and nominal wage growth rate together to see that
how much pressure is posed on the people from the local inflation. The analysis is carried out in
euro zone and China respectively. The data in previous sections has presented the recent
China
Euro economies

47 / 76
statistical data of inflation and nominal wage growth in China as well as the data of inflation in
euro zone. To calculate the nominal wage growth in euro zone, the author averages the individual
wage growth rate of the 12 European countries above as a proximate. The graph below describes
the situation that the nominal wage growth has been nearly 10 percent higher than the inflation in
China from 1999 to 2009. Whereas in euro area the nominal wage growth demonstrates close
degree with the inflation.
Figure 7: Comparison between nominal wage growth and inflation
Source: Eurostat, ILO, National Bureau of Statistics China
Hence, according to the empirical evidence the situation looks like this: although China
suffers from relevantly higher inflation in recent decade, people there enjoy an even higher
growth in earning at the same time, gaining more money so that be able to relieve the pressure of
increasing price. In other words, the consequence of inflation in China is not so severe.
4.3 Inflation in rapid developing economies

48 / 76
Rapid developing economies often have a relevantly higher inflation rate than those
developed countries. The “BRICs” – Brazil, Russia, India and China – are all experiencing rising
inflation and adopting similar instruments to prevent the prices of goods from out of control.
Therefore it is more reasonable to put China into the BRICs setting for analyze the intensity of
its inflation. The inflation data of BRICs nations of recent decade in the table below depicts the
general price changes in these rapid developing economies.
Table 8: Inflation rates in BRICs (2000-2010)
2000 2001 2002 2003 2004 2005 2006 2007 2008 2009 2010
Brazil 7.06 6.84 8.43 14.78 6.60 6.88 4.20 3.64 5.67 4.90 5.04
Russia 20.78 21.46 15.78 13.67 10.89 12.68 9.68 9.01 14.11 11.65 6.85
India 4.01 3.78 4.30 3.81 3.77 4.25 6.18 6.37 8.35 10.88 13.19
CHINA 0.40 0.73 -0.77 1.17 3.90 1.82 1.47 4.77 5.90 -0.69 3.33
Source: IMF, National Bureau of Statistics of China
The reason of why the BRICs usually confront with higher inflation can be explained in two
aspects. For one thing, domestic supply shocks, especially with respect to the agricultural sector,
play an important role in driving inflation. Regardless the shock is temporary or permanent, the
extent of the impact on inflation depends on how large the weight of the affected sector accounts
for in consumer price. For example, the food share is relevantly large in rapid developing
countries. Furthermore, food price tent to fluctuate because of the influence of weather and the
presence of trade barriers. Therefore, a rise in food price not only raises short-run inflation due to
their high weight in CPI but also engender a sustained increase in the inflation rate via
expectation of inflation. Besides, the energy consumption also accounts for a relatively large
share in the CPI consumption basket. Most of the rapid developing economies have changed
from administer-price system to the market-price system in determination of the price of energy.
Some economies have faced inflationary pressure over the liberation period.
For another, to confine the exchange rate within the target range, the rapid developing
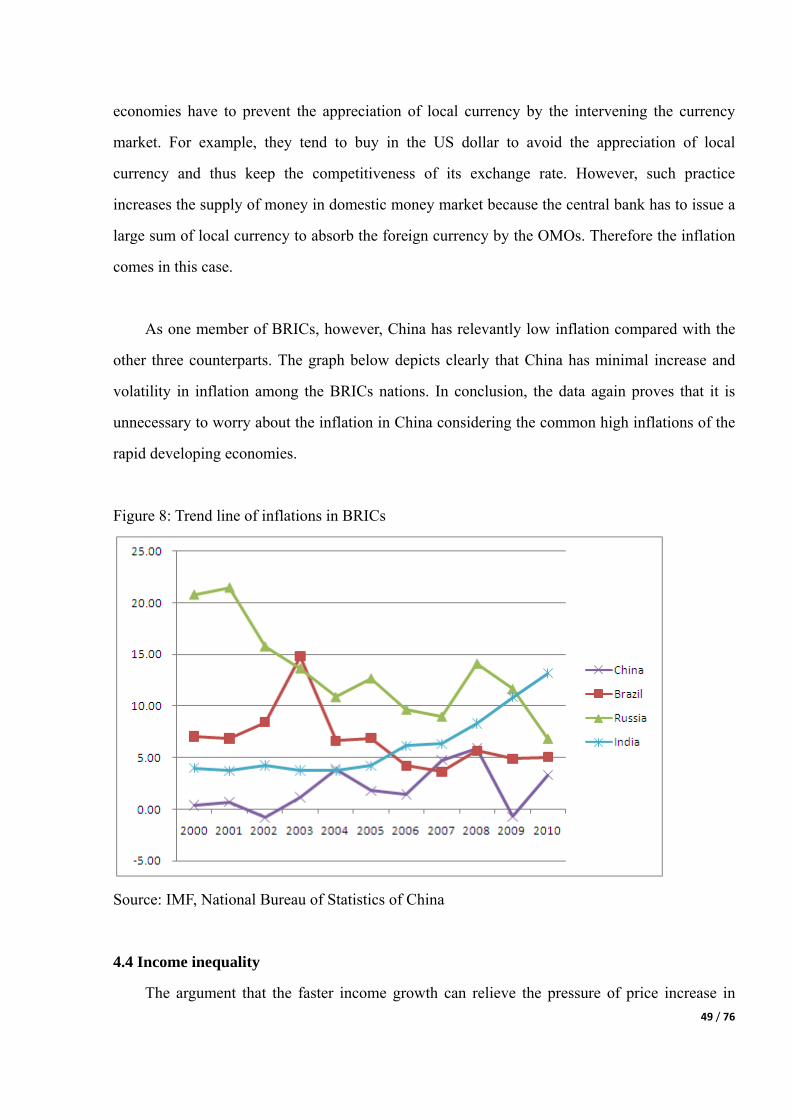
49 / 76
economies have to prevent the appreciation of local currency by the intervening the currency
market. For example, they tend to buy in the US dollar to avoid the appreciation of local
currency and thus keep the competitiveness of its exchange rate. However, such practice
increases the supply of money in domestic money market because the central bank has to issue a
large sum of local currency to absorb the foreign currency by the OMOs. Therefore the inflation
comes in this case.
As one member of BRICs, however, China has relevantly low inflation compared with the
other three counterparts. The graph below depicts clearly that China has minimal increase and
volatility in inflation among the BRICs nations. In conclusion, the data again proves that it is
unnecessary to worry about the inflation in China considering the common high inflations of the
rapid developing economies.
Figure 8: Trend line of inflations in BRICs
Source: IMF, National Bureau of Statistics of China
4.4 Income inequality
The argument that the faster income growth can relieve the pressure of price increase in

50 / 76
China can only be tenable with the precondition that there is no severe disparity in the income
distribution in China. However, the reality goes to the opposite direction.
4.4.1 Causes of income inequality
1) Structural change in labor market
The labor market reform in 1997 was a turning point both on economic growth pattern and
income disparity. Labor market reform has been aimed at achieving better allocation of labor
resources and stimulating working enthusiasm, so to increase the economic growth. Nevertheless,
in the respective of individuals the reform firstly caused changes in employment status and
income levels. Income inequality in China has continued to increase as a side effect of the labor
market reform. Before 1997 the labor market reflected a gradual adjustment of employment and
income structure. The growth rate of productivity per capita was in line with that of average
wage so that the benefit of economic growth was share by most of people. After 1997,
employment restructuring became more radical. People’s employment status went divergence.
Taking a look at China’s urban unemployment rate, people can see that the registered
unemployment rate goes up continuously after 1997.
Figure 9: Urban unemployment rate (1990-2010)
Source: National Bureau of Statistics China, TradingEconimics.com
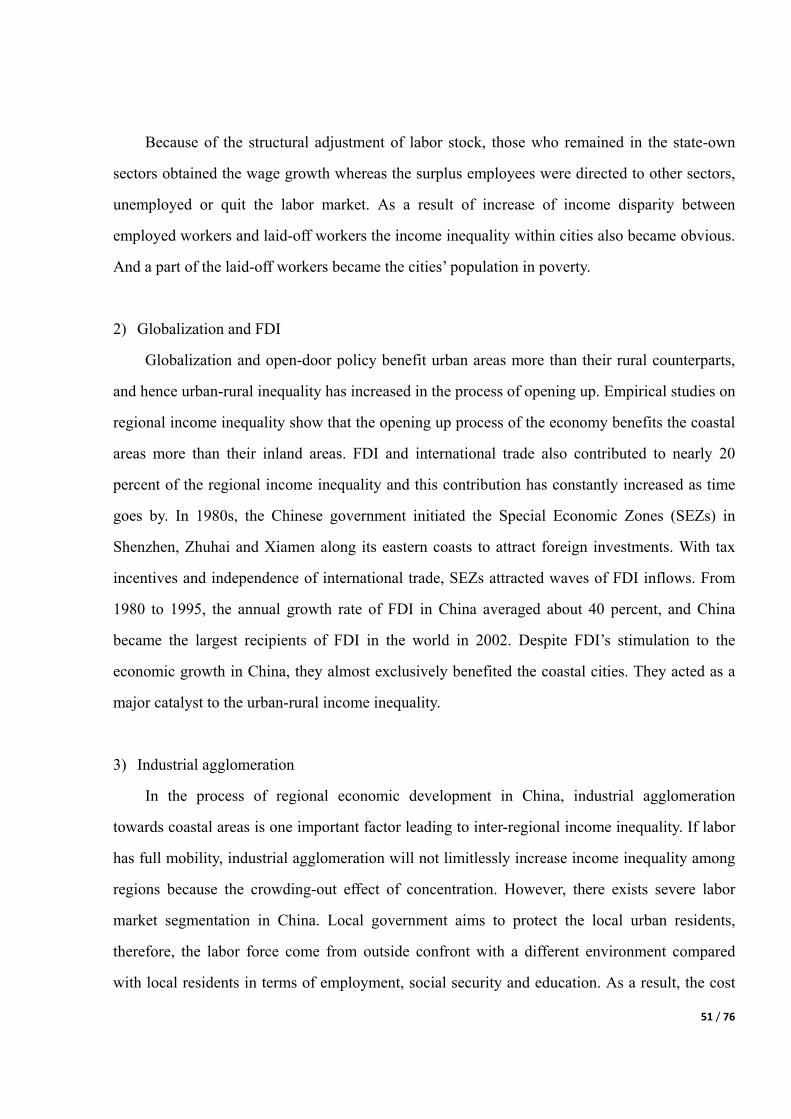
51 / 76
Because of the structural adjustment of labor stock, those who remained in the state-own
sectors obtained the wage growth whereas the surplus employees were directed to other sectors,
unemployed or quit the labor market. As a result of increase of income disparity between
employed workers and laid-off workers the income inequality within cities also became obvious.
And a part of the laid-off workers became the cities’ population in poverty.
2) Globalization and FDI
Globalization and open-door policy benefit urban areas more than their rural counterparts,
and hence urban-rural inequality has increased in the process of opening up. Empirical studies on
regional income inequality show that the opening up process of the economy benefits the coastal
areas more than their inland areas. FDI and international trade also contributed to nearly 20
percent of the regional income inequality and this contribution has constantly increased as time
goes by. In 1980s, the Chinese government initiated the Special Economic Zones (SEZs) in
Shenzhen, Zhuhai and Xiamen along its eastern coasts to attract foreign investments. With tax
incentives and independence of international trade, SEZs attracted waves of FDI inflows. From
1980 to 1995, the annual growth rate of FDI in China averaged about 40 percent, and China
became the largest recipients of FDI in the world in 2002. Despite FDI’s stimulation to the
economic growth in China, they almost exclusively benefited the coastal cities. They acted as a
major catalyst to the urban-rural income inequality.
3) Industrial agglomeration
In the process of regional economic development in China, industrial agglomeration
towards coastal areas is one important factor leading to inter-regional income inequality. If labor
has full mobility, industrial agglomeration will not limitlessly increase income inequality among
regions because the crowding-out effect of concentration. However, there exists severe labor
market segmentation in China. Local government aims to protect the local urban residents,
therefore, the labor force come from outside confront with a different environment compared
with local residents in terms of employment, social security and education. As a result, the cost
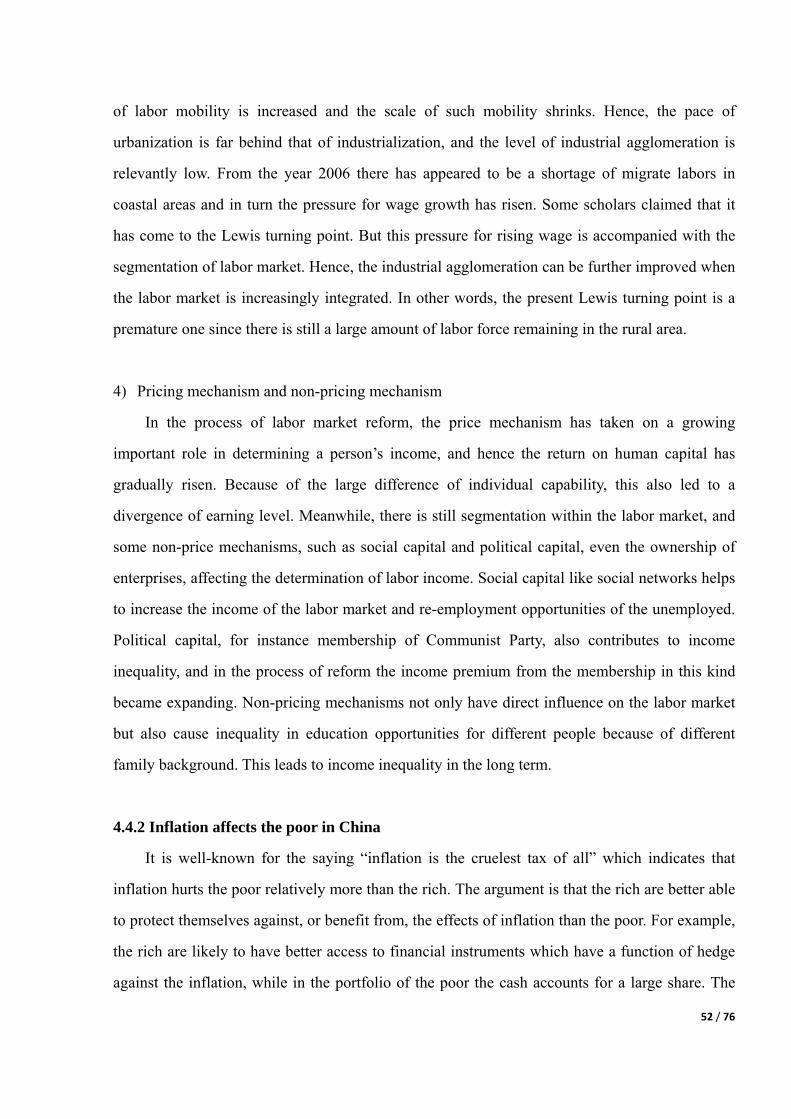
52 / 76
of labor mobility is increased and the scale of such mobility shrinks. Hence, the pace of
urbanization is far behind that of industrialization, and the level of industrial agglomeration is
relevantly low. From the year 2006 there has appeared to be a shortage of migrate labors in
coastal areas and in turn the pressure for wage growth has risen. Some scholars claimed that it
has come to the Lewis turning point. But this pressure for rising wage is accompanied with the
segmentation of labor market. Hence, the industrial agglomeration can be further improved when
the labor market is increasingly integrated. In other words, the present Lewis turning point is a
premature one since there is still a large amount of labor force remaining in the rural area.
4) Pricing mechanism and non-pricing mechanism
In the process of labor market reform, the price mechanism has taken on a growing
important role in determining a person’s income, and hence the return on human capital has
gradually risen. Because of the large difference of individual capability, this also led to a
divergence of earning level. Meanwhile, there is still segmentation within the labor market, and
some non-price mechanisms, such as social capital and political capital, even the ownership of
enterprises, affecting the determination of labor income. Social capital like social networks helps
to increase the income of the labor market and re-employment opportunities of the unemployed.
Political capital, for instance membership of Communist Party, also contributes to income
inequality, and in the process of reform the income premium from the membership in this kind
became expanding. Non-pricing mechanisms not only have direct influence on the labor market
but also cause inequality in education opportunities for different people because of different
family background. This leads to income inequality in the long term.
4.4.2 Inflation affects the poor in China
It is well-known for the saying “inflation is the cruelest tax of all” which indicates that
inflation hurts the poor relatively more than the rich. The argument is that the rich are better able
to protect themselves against, or benefit from, the effects of inflation than the poor. For example,
the rich are likely to have better access to financial instruments which have a function of hedge
against the inflation, while in the portfolio of the poor the cash accounts for a large share. The
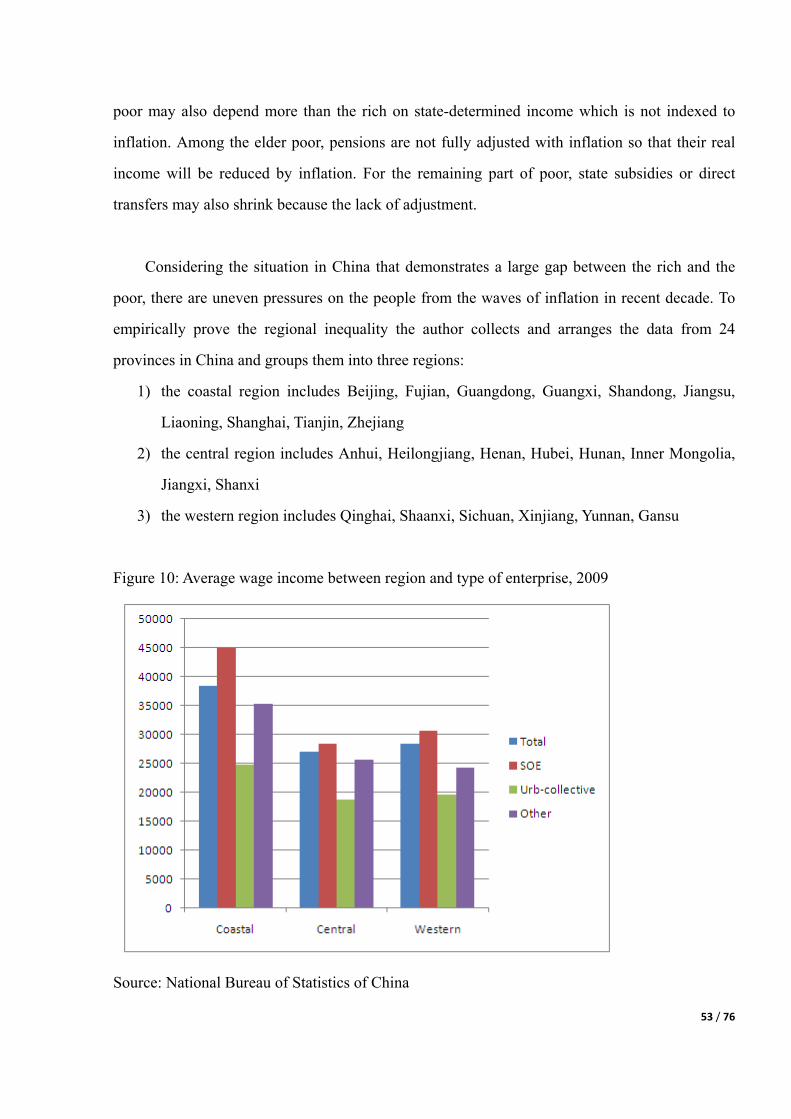
53 / 76
poor may also depend more than the rich on state-determined income which is not indexed to
inflation. Among the elder poor, pensions are not fully adjusted with inflation so that their real
income will be reduced by inflation. For the remaining part of poor, state subsidies or direct
transfers may also shrink because the lack of adjustment.
Considering the situation in China that demonstrates a large gap between the rich and the
poor, there are uneven pressures on the people from the waves of inflation in recent decade. To
empirically prove the regional inequality the author collects and arranges the data from 24
provinces in China and groups them into three regions:
1) the coastal region includes Beijing, Fujian, Guangdong, Guangxi, Shandong, Jiangsu,
Liaoning, Shanghai, Tianjin, Zhejiang
2) the central region includes Anhui, Heilongjiang, Henan, Hubei, Hunan, Inner Mongolia,
Jiangxi, Shanxi
3) the western region includes Qinghai, Shaanxi, Sichuan, Xinjiang, Yunnan, Gansu
Figure 10: Average wage income between region and type of enterprise, 2009
Source: National Bureau of Statistics of China

54 / 76
From the graph above, there was a large gap of the average wage between coastal region
and central-western region among all the three types of enterprise in 2009. In the central and
western regions the wage incomes were normally 30 percent lower than that in coastal region.
Besides, the gap also exists within the region among different type of enterprise. Employees in
urban collective corporations earned a minimal amount compared with the counterparts in other
types of corporations. Therefore, those workers in central and western regions or those employed
in the urban collective sectors suffered more, assuming their other sources of income remained in
an average level, from the effect of increasing price even though there were high rate of wage
growth occurring. When it comes to those unemployed and the elder, the situations can be even
worse.
4.4.3 Solutions to decrease the income inequality
With the rapid economic development, China has changed from an egalitarian economy to a
more unequal one. The Gini coefficient of China increased from 23 in 1980 to 47 in 2010,
surpassing the warning level of 40. Confronted with severe inequality problem, China has
adopted several policies to control the situation.
1) Policies for rural area development
Given the rising urban-rural inequality, China State Council issued six annual No. 1
documents, from 2004 to 2009, focusing on rural development which demonstrated enhanced
efforts on increasing rural income and living standards. In the following years, the government
carried out some investments on the rural infrastructures, among them the most famous is
Western Region Development Project which aimed at infrastructure construction and
development stimulation in the lagged rural inland areas. Besides, the policies like rural resident
social security, gradually phasing out agricultural tax will no doubt have a positive effect on
decreasing the inequality.
2) Removing educational disparity
55 / 76
Education disparity between rural and urban areas has imposed a crucial effect on future
income inequality. Therefore, the central government practiced a serial of actions to improve the
rural education. In 2007, the government started to eliminate the tuition fee in rural area and
began to finance the eligible students. Full coverage of rural compulsory education narrowed the
gap of urban-rural educational accessibility. But still there are many works need to do to remove
the difference of educational quality between rural and urban areas. Rural schools lag behind
urban ones in terms of qualification of teachers, condition of school facilities and per student
budgetary funds.
3) Encouraging rural-to-urban migration
Rural-to-urban migration is said to be a major equalizing factor in Chinese development.
Migration relieves the surplus labor in rural areas, thereby increase the productivity of the
workers that remain in rural areas. Remittance from urban area to rural households increases the
rural income and reduces rural poverty. Migration also helps to speed up the urbanization in
China. However, the existence of household registration limits the migrants’ access to education,
healthcare and other welfare benefits their urban counterparts enjoy. Facing these barriers, the
migrants are usually in a nomadic status until the urban residence permission is expired. Hence,
the household registration system actually creates the segmentation of labor market and hinders
the rural-to-urban mobility. Recently, many cities in China have lifted certain barriers of
migration because of the benefits from migration. Some started to provide urban status to the
qualified migrants for future development.
5. Recent inflation in China
5.1 Background in recent inflation
Chinese macroeconomic conditions have experienced a large up and down at the wake of
global financial crisis in 2008-2009. Affected by significant decrease of external demand, growth
of real GDP moderated from 10.6 percent year-on-year in the first quarter of 2008 to 6.1 percent
during the first quarter of 2009. With the help of stimulating instruments, real GDP growth began
to pick up to 7.9 percent in the second quarter of 2009 and increased to 10.7 percent during the

56 / 76
fourth quarter.
Equally remarkable was performance of consumer price index. Inflation was a major
concern at the beginning of 2008, when CPI reached cyclical high of 8.7 percent in February. In
order to contain inflation pressure, the PBC adopted a variety of tightening measures. During the
second half of 2008, the CPI decreased rapidly as a result of falling price of global commodity,
and its deflation of price extended into much of 2009 until the expansionary package come up by
the government. Hence, CPI then picked up in second half of 2009 and in February it was 2.7
percent up on a year ago. With the higher price of raw materials, producer prices were also
increased which posed pressure on the CPI in the beginning of 2010. In December, 2010 the
average of CPI inflation was reported 3.3 percent which is above the long-term target of 3
percent.
In March, 2011 China’s inflation has reached 5.4 percent, the highest rate in two years.
Food prices continued to be the big concern, rising 11.7 percent over a year ago, and the
non-food inflation also has reached a new high at 2.3 percent since 2001. To tighten the money
supply, the PBC announced that the deposit reserve ratio will be raised 0.5% which implying that
the large financial institutions will have to keep 20.5% of their deposits in reserves. It was the
fourth time this year that the PBC raised its reserve ratio.
5.2 Causes of inflation analysis
Although the CBI has its possibility to influence the inflation in China as what it did in the
OECD in 1980s, it is more likely that some other causes result in the situation of inflation.
1) Balassa-Samuelson Effect
This theory tries to explain for price differential between countries. The fundamental idea is
a distinction of goods between the tradable and the non-tradable. People cannot produce 10,000
haircuts in China and import them into the EU, as you can do it with shoes. Consequently the
price of the tradable is determined on the world market. The non-tradable sector is usually
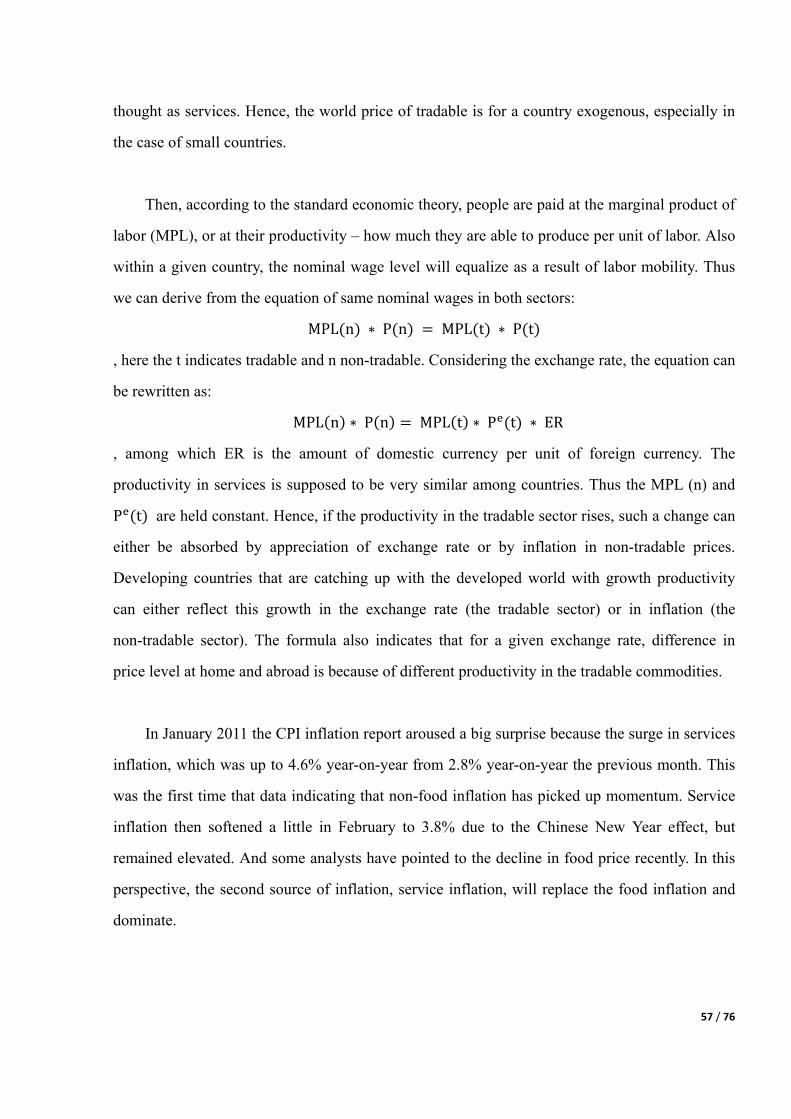
57 / 76
thought as services. Hence, the world price of tradable is for a country exogenous, especially in
the case of small countries.
Then, according to the standard economic theory, people are paid at the marginal product of
labor (MPL), or at their productivity – how much they are able to produce per unit of labor. Also
within a given country, the nominal wage level will equalize as a result of labor mobility. Thus
we can derive from the equation of same nominal wages in both sectors:
MPL n P n MPL t P t
, here the t indicates tradable and n non-tradable. Considering the exchange rate, the equation can
be rewritten as:
MPL n P n MPL t P t ER
, among which ER is the amount of domestic currency per unit of foreign currency. The
productivity in services is supposed to be very similar among countries. Thus the MPL (n) and
P t are held constant. Hence, if the productivity in the tradable sector rises, such a change can
either be absorbed by appreciation of exchange rate or by inflation in non-tradable prices.
Developing countries that are catching up with the developed world with growth productivity
can either reflect this growth in the exchange rate (the tradable sector) or in inflation (the
non-tradable sector). The formula also indicates that for a given exchange rate, difference in
price level at home and abroad is because of different productivity in the tradable commodities.
In January 2011 the CPI inflation report aroused a big surprise because the surge in services
inflation, which was up to 4.6% year-on-year from 2.8% year-on-year the previous month. This
was the first time that data indicating that non-food inflation has picked up momentum. Service
inflation then softened a little in February to 3.8% due to the Chinese New Year effect, but
remained elevated. And some analysts have pointed to the decline in food price recently. In this
perspective, the second source of inflation, service inflation, will replace the food inflation and
dominate.
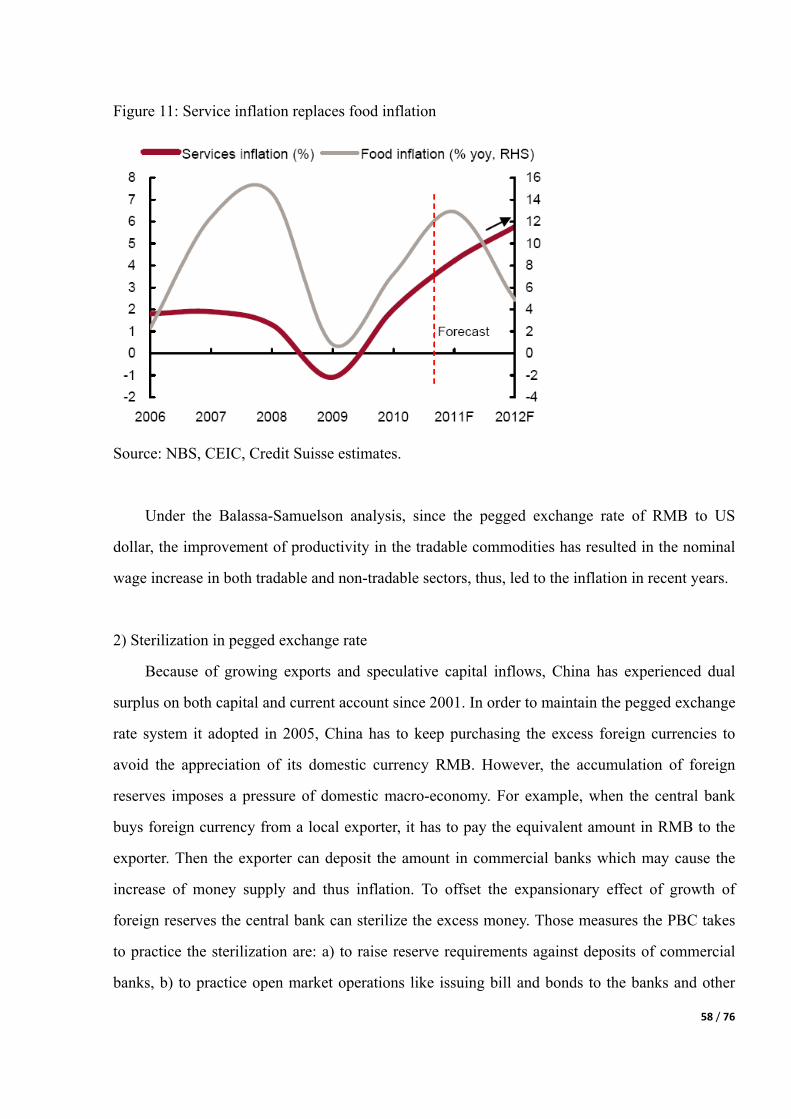
58 / 76
Figure 11: Service inflation replaces food inflation
Source: NBS, CEIC, Credit Suisse estimates.
Under the Balassa-Samuelson analysis, since the pegged exchange rate of RMB to US
dollar, the improvement of productivity in the tradable commodities has resulted in the nominal
wage increase in both tradable and non-tradable sectors, thus, led to the inflation in recent years.
2) Sterilization in pegged exchange rate
Because of growing exports and speculative capital inflows, China has experienced dual
surplus on both capital and current account since 2001. In order to maintain the pegged exchange
rate system it adopted in 2005, China has to keep purchasing the excess foreign currencies to
avoid the appreciation of its domestic currency RMB. However, the accumulation of foreign
reserves imposes a pressure of domestic macro-economy. For example, when the central bank
buys foreign currency from a local exporter, it has to pay the equivalent amount in RMB to the
exporter. Then the exporter can deposit the amount in commercial banks which may cause the
increase of money supply and thus inflation. To offset the expansionary effect of growth of
foreign reserves the central bank can sterilize the excess money. Those measures the PBC takes
to practice the sterilization are: a) to raise reserve requirements against deposits of commercial
banks, b) to practice open market operations like issuing bill and bonds to the banks and other
59 / 76
financial institutions. The graph below depicts the central bank bill since 2000 and the total bond
outstanding as a percentage of foreign reserves in recent decade. Both pictures reflect an
increasing trend in sterilization especially after 2006.
Figure 12: Bill and Bond issuance to sterilize inflow
Source: CEIC, PBC
Sterilizing inflows is not a costless measure. As a matter of fact, it has adverse effect in the
long run. Accumulation of foreign assets can only lead to a loss in profit. Because the foreign
assets basically have a low interest rate, whereas the interest rate paid for issuing bill is
60 / 76
comparatively higher, so the sterilization will cause a loss in account of central bank. Besides,
with the nearly pegged exchange rate to US dollar, the Chinese currency failed to appreciate and
thus further increase Chinese trade surplus. As a result there is an expansion in export sector and
a spillover of spending from the high profits and wages in export sector to domestic sectors.
Therefore, overheating will eventually emerge, but mainly through the spillovers from the
export-led growth rather than directly from domestic demand growth. To put in other words,
sterilization suppressed the monetary expansion that would otherwise occur under the conditions
of an undervalued exchange rate, but it could not prevent other needed economic adjustment.
The fact that there is an overall surplus in the balance of payment serves as a signal that the
economy is over-competitive at current exchange rate. To return to the equilibrium level of
balance of payment without exchange rate adjustment, either the domestic price level must
change through monetary expansion and inflation, or the export sector must expand until the
incremental spending, from raw material procurement or increased wages and profit, spills over
into other sectors sufficiently to create the same result.
3) Supply shock and domestic demand
As the data previously depicted that the food price surges is especially obvious, and the
supply shock aspects has the influence on food-driven inflation in the short run. China is the
world’s largest agricultural producer by volume, but the country’s planting land and total
production is in decline as a result of urbanization. Agricultural yields and growth in the
livestock and fisheries sectors are improving, but not at a rate able to keep up with the increase
of domestic demand. Meat production is growing in China, but the demand of meat is rising
faster. Global agricultural commodity prices have been increasing at an accelerated speed since
2003 because of a variety of structural and cyclical cause. In China, the higher price of pork has
compelled consumers turn to the poultry. Chinese production of pork accounts for the half of
total world production. In middle 2006 a sharp decline in hog cycle prompted a nature reduction
of inventory. By spring 2007, pork prices surged as a result of supply shortfall, which
accompanied by the outbreak of disease and other factors such as the migration of farm workers
who produced 70 percent of pork output. Although the price caps was practiced and seemed to
61 / 76
have solved the short-term problem, but the outlook remains full of uncertainty.
5.3 Central bank independence for inflation targeting
As the cause analysis indicates, the low level of central bank independence is not the main
reason for the recent decade inflation, but still it is necessary to mention the importance of
central bank independence in order to cure the inflation situation. While China does not enjoy the
central bank independence as high as the level of many other developed countries, it does have
an important role to play on inflation target. For much of the past the target was from 2 to 4
percent, and inflation is currently above the higher end of this range. And China should set new
target to manage expectation of increases in consumer and asset prices. Accelerating inflation
and difficulties of managing the high level of bank liquidities suggests that the stabilizing of
expectations might now be appropriate. The people’s Bank of China has raised interest rate in
four times during the recent six months, reflecting the government’s determination to curb
inflation and growing property prices that hurt social stability.
Considering the central bank’s limited independence and government controls on interest
rates, adopting formal inflation targeting would be premature. However, the PBC could adopt
some features of an anchoring system such as announcing an explicit inflation objective or target
range and committing to achieve it for several years. The credibility of any central bank is
indispensable in inflation targeting so the PBC need freedom to control over managing its
reserves, to liberalize interest rates and exchange rates. Managing the expectation of inflation
also require a credibility of monetary intentions to financial market.
6. Importance of central bank independence in developing countries
Despite less obvious effect of CBI on the recent Chinese inflation, there are still some
reasons to improve the CBI level for the sake of a long run economic development. Considering
that China is on the way of globalization, and the market-oriented economy requires further
development, hence, the improvement of independence degree of central bank will make the
financial industry practicing in a more healthily environment.

62 / 76
6.1 Why improve central bank independence?
6.1.1 Monetary policy efficiency
An independent central bank may promote a more credible monetary policy, making market
expectations to be more focused on central bank’s signals. It enhances the monetary policy
efficiency in several aspects as follows.
1) Predictability of monetary policy
Monetary policy predictability is often understood as the capability of the financial markets
to foresee correctly the future decisions of the central bank about monetary policy. One of the
key factors of monetary policy predictability is transparency. But to guide the expectations on the
interest rates only transparency is not enough, it is necessary that a long term communication
established which demonstrating a consistency between words and facts as well as the
knowledge of decision-making procedures. Essential for foreseeing the decisions of monetary
policy of central bank is the strategy of the monetary policy. If the central bank is transparent in
terms of strategy, it supplies a systematic framework on its monetary policy decisions and it
provides clear objectives and methods. These allow the population to evaluate the central bank’s
behavior which is the purpose of a high level of credibility, a necessary precondition if the
central bank tries to elaborate a predictable monetary policy. If the central bank and the private
agents have full information about the economy, a perfect predictability of the monetary policy
can be achieved under a minimal level of transparency. Actually, however, the available
information of the monetary policy decisions is limited and this is the reason to continuously
evaluate new economic, financial and monetary information which bear on central bank’s
objectives.
The importance of predictability in central bank’s practice was significantly influenced by
the role of the expectations in the economic thinking, particularly by the revolution of the
reasonable expectations. If the economic agents believe in the commitment of the central bank to
reduce inflation in a persistent way, this will affect the current inflation as a result of the
63 / 76
adjustment of the expectations on the future prices. That is the importance of predictability for
the effectiveness of the monetary policy. In conclusion, a high level of the monetary policy
predictability appears if central bank’s strategy is perceived by the population as credible, if the
policy makers accept the strategy in their inner meetings and in the external communications, if,
in consequence, the private long-term expectations are consistent with the central bank’s
objectives, even under the conditions of external shocks. A high predictability must be therefore
regarded as a normal result of central bank’s observance of its own monetary policy strategy.
Thus, the predictability of the decisions on the interest rates can be regarded as a reflection of the
general understanding by the population of the central bank’s monetary policy framework, and of
the private sector’s ability to transform the economic conditions into prediction of the directions
of policy, of the central bank’s credible strategy.
2) Transparency of monetary policy
A monetary policy is transparent when all the information on it is open and freely available,
which is an important factor to monitor and control efficiently the monetary policy. A higher
transparency of the central bank has been achieved largely by its higher independence and
responsibility; it has been noticed that transparency, and its main instrument - communication,
have a positive effect on the predictability and effectiveness of the monetary policy. By keeping
transparency, the central bank can reduce the level of information asymmetry thus increasing the
predictability of the monetary policy beyond the simple interpretation of the past regulations of
the monetary policy; however, transparency must not be understood as an independent meaning
because its limited effectiveness. Monetary policy transparency can be regarded from two
perspectives: transparency of the monetary policy strategy and transparency of the monetary
policy situation. The consequences of transparency depend on the specific contexts, its effect is
not necessarily positive, but generally there are two types of effects, termed as “information
effects”, which rely directly on the relevant information, and “stimulant effects”, which affect the
behavior based on the new structure of information. The practice of the monetary policy
transparency has a high degree of diverse, and it evolves in time. Three empirical tendencies can,
nevertheless, be identified: a) the central banks consider transparency very important for the
64 / 76
monetary policy; b) monetary policy transparency has increased significantly over the past two
decades; c) monetary policy transparency exhibits a substantial heterogeneity of the national and
regional monetary policy frameworks. For the transparency to provide a positive impact on the
predictability, the type of information released by the central bank is important, and also is
important the way by which the information is communicated to the economic agents and to the
market.
3) Central bank credibility
The expectations of the future play an overwhelming role in the activities of the consumers,
in their planning and decision makings. Therefore their trust in the nominal anchors and the
nominal stability is of utmost importance. Without enough trust in the monetary policy the
consumers may expect price hikes and the persistently increasing cost. Hence, the trust in the
monetary policy offsets the nominal fluctuations, the production fluctuations. The monetary
policy’s credibility depends on two factors: a) the economic agents relying their decisions on a
uncertain evolution of the inflation; the monetary policy will be credible if the evolution they
consider uncertain is consistent with the nominal anchor; b) trust is correlated with the pattern of
reaction; if inflation is higher than the target of the central bank because of the shocks, there
must be confidence that the instruments of monetary policy will reduce the inflation to the level
indicated by the nominal anchor. And a temporal deviation has no adverse effects on credibility.
The monetary policy cannot be implemented efficiently without a good interaction with the fiscal
policy. The annual public budgets should be anchored in a long-term planning and the fiscal
policy shouldn’t have pro-cyclic effects. The higher transparency of the monetary policy
contributes to a higher credibility since transparency promotes the predictability of central banks’
behavior and diminishes the uncertainty.
4) Central bank’s communication
Communication is an integral part of the monetary policy, the central banks emphasizing
the transparency of their decisions by facilitating the communication and making the volume of
information available to the public. These factors contribute mainly to the higher independence

65 / 76
includes: a) setting inflation targeting as the essential goal of the monetary policy, which
emphasizing the communication practices of the central bank; b) taking management of market
expectations as an important part of the monetary policy, which explains the existence of the
communication channels to the participants on the market. One aspect of communication is for
the central bank to form the essential economic indicators and to take into consideration the
prospective nature of the monetary economy. The publishing of these forecasts offers the
population additional information about the possible direction of the monetary policy. The
publishing of the prospective direction of the monetary policy is accompanied by the opinion of
the evolution of the state of the economy. There is a risk that this opinion is interpreted as a
quasi-promise or as a firm engagement as to the monetary policy, which may lead to false
expectations and incorrect adjustments of expectations for interest rates. The future path of the
monetary policy is announced by the central banks either through explicitly quantitative values,
or through qualitative information in the official reports or accounts. The qualitative
communications are characterized by the frequency of the announcements, by the policy
direction or the time horizon. For one thing, the central banks aim to increase the short-term
predictability by supplying indications of the monetary policy orientations, and for another, the
central banks have enhanced the short-term predictability of the future policy by the use of the
forecasting approach when the economic conditions are adequate. One important aspect of the
central bank’s policy is the way by which the commercial bank’s decisions are motivated and
their clear, complete and efficient communication. A long-term communication of the central
bank with the financial markets, and a beneficial transparency of the monetary policy are two
aspects determined by the interactions among the monetary policy, the communication, and the
financial markets. The link among the monetary policy, the communication and the financial
markets has raised attention in recent years. The communication between the central banks and
the financial markets contributes to the establishment and consolidation of the monetary policy
credibility, the improved communication offers advantages to the functions of the financial
markets and establishes proper solutions to make the economic activity more efficient.
6.1.2 Economic Environment for development

66 / 76
Early studies (Adelman 1958, Abramovitz 1986, Rostow 1990, Rodrik 2003) said that
regardless of the growth model, rate of growth in an economy can be described as a function of
two determinants: proximate and fundamental determinants. The proximate determinants answer
the question “How” and would include a country’s input factors like technology, human capital,
physical capital, labor and natural resources. These have been emphasized specifically in the
Harrod-Domar, the Solow neoclassical and Endogenous growth models. Economists have
demonstrated that successful economies are those with high rates of accumulation of human and
physical capital, and with sustained technological progress.
When it comes to fundamental determinants, they answer the question “Why?” and they
relate to those variables that have significant influence on a country’s capacity to accumulate
factors of production and to invest in the production of knowledge. They consist of factors such
as openness or integration with the rest of the world, the geography factors as climate,
topography and natural resources, and the institutional framework or the country’s social
capability. Social capability refers to the various institutional arrangements which set the
framework for the productive economic activities, and without which the market economies
cannot function properly (Snowdon and Vane, 2005). Central banks come under the class of
institutions. From economists’ researches in recent years, there is now widespread acceptance of
the idea that good governance and institutions, proper incentives structures are important
preconditions for growth and development. Macroeconomic stability is important for sustainable
long term growth. Price stability engendered by independent and well-run central banks serves as
a base in contributing to macroeconomic stability.
6.2 The determinant of central bank independence
The degree of central bank independence varies considerably among the industrialized
countries. The question is which factors ultimately determine the level of central bank
independence. These determinants can be categorized as follows:
1) The equilibrium level of unemployment

67 / 76
The first determinant of central bank independence may be the average employment-driven
inflationary bias in country. This inflationary bias can be approximated empirically by the
equilibrium or natural rate of unemployment. Cukieraman (1994) shows that the larger the
average employment-driven inflationary bias in a country, the higher will be the costs for the
government to override the central bank and thus the more independent the central bank is.
Because in the case of nominal-wage contracts, unexpected inflation has positive effects on the
levels of both production and employment, a higher equilibrium or natural rate of unemployment
is enjoyed by the government.
2) Government debt
The stock of government debt is another potential determinant of central bank independence.
The larger sum the government wants to borrow from the capital market, the more weight will be
placed on lower inflationary expectations and, thus, on lower nominal interest rate in capital
market. The benefits of a decrease of the real value of government debt by unexpected inflation
do not outweigh the costs of borrowing with permanently higher interest payments as a result of
lower credibility. Cukierman (1994) argues that the larger the debt, the more likely it is that
politicians will delegate authority to the central bank and the more independent the central bank
will be. This hypothesis is empirically researched by De Haan and Van Hag (1995) for several
ways of independence for the period of 1980s. Using gross government debt as a percentage of
GDP in their regression analysis, these authors find no significant index for the debt ratio.
3) Dependence on foreign trade, foreign investment, multilateral lending
Some world-system researchers (e.g. Van Rossem 1996) find that when a country more
depend on foreign trade, foreign investment and multilateral lending, it is more likely to conform
to the world standards such as independence of central bank. Trading creates conformity to world
standards, because as a country increasingly relies on foreign market to obtain the inputs or sell
its products, its status and reputation in the world become more important. In this case,
governments seek strong currencies, thus lower inflation, as a way to improve national status and
reputation in the global arena. For instance, states with lower inflation and a stronger currency

68 / 76
enjoy more weight in the international negotiation (Helleiner 1994). There is also evidence
proves that the public, especially in the export-oriented economies, prefers low inflation not only
as a way to protect their purchasing power but also as a sign of national reputation (Shiller
1996).
Foreign direct investment (FDI) is another factor which influences the conformity to world
standards, because it makes countries depend on the decisions made by overseas organizations,
for instance, the multinational firms. One issue concerning the foreign investment is the recipient
country’s credibility within the international financial network. Politicians are likely to enhance
the CBI in order to continue attracting foreign capital (Maxfield 1997; McNamara 2002). The
control of monetary variables by an autonomous central bank is assumed to reassure foreign
investors that the value of their investment will maintained in the future, because the inflation
will be kept low and the foreign exchange rate will not move adversely to their interests. The key
point is that not all of the foreign investors concern the CBI because some of them can access to
more direct and reliable information channels. The multinational firms are assumed preferring
high CBI for their use of host countries as export platforms, which has been increasingly the case
with FDI since the 1980s (UNCTD 2002).
A good example of multilateral lending is IMF, the agency in charge of assisting countries
in financial difficulty. It has placed more value on CBI with the agreement of lending. As in the
case of foreign trade and FDI, loans from the IMF make countries more likely to adopt formal
structures or practices that help them enhance, or at least keep, their status and reputation within
the international community.
4) Normative and competitive imitation
According to the researches of socialists, the actors embedded in a network of relationship
may adopt similar pattern of behaviors based on two different types of imitation: normative and
competitive (DiMaggio and Powell 1983; Mizruchi 1993; Guler et al 2002). When it comes to
normative imitation, actors who share strong connections to one another in the social network

69 / 76
tend to adhere to a group of identity, solidarity and conformity. Extended the argument to the
international level, normative effects are likely to spread across countries who engage in a large
amount of transactions with each other (Guler et al 2002). In other words, the countries that
display tight trade relationship are more likely to adopt similar patterns of behaviors, including
the agreement of independence level of central banks. In fact, central bank independence often
becomes a symbol of group membership which means that a failure to observe it leads to
rejection from the group.
When it comes to competitive imitation, countries that compete with each other in the same
commodity markets are likely to adopt similar pattern of behavior so that not to lose ground
relative to others (Guler et al 2002). Take a example of countries A and B trade with the rest of
world in the same commodity category. Even when countries A and B export to different third
countries, a more independence central bank in country A will likely promote the improvement
of independence level of central bank in country B for two reasons. First, the two countries are
more likely to monitor each other in order to learn from each other if they are competitors in
trade. In other words, competitive relationship creates a social channel for comparison,
communication and imitation. The second reason for imitation is the risk of failure to obtain
benefit in the competing environment. In this case, the benefit is inflow of foreign capital under
the assumption that high CBI delivers signal of economic stability which preferred by foreign
investors. This argument is analogous to the idea that actors with equal positions in a network
tend to imitate each other so as to enhance their own performance. The similar theory was
proposed by White (1981) that markets are structured fields in which competitors observe each
other. Therefore, equivalent countries tend to behave similarly, because they learn from the peers
how to become more effective at improving status in trade.
5) Financial opposition to inflation
According to this perspective, the CBI can not influence the level of inflation directly in
terms of a negative correlation unless through a third party factor between them. This factor is
financial opposition to inflation (FOI) within a country. The monetary policy is driven by a

70 / 76
coalition of interests in society, because central banks will be prepared to practice strong
anti-inflationary actions only when there is a coalition of interests which capable of protecting
their anti-inflationary policy. In industrialized countries, the financial sector represents a
coalition like this. There are four indicators that explain and measure financial opposition to
inflation:
a) Countries with financial sectors that have universal banking are expected to have a greater
financial opposition to inflation than those without such sectors.
b) Countries with less supervision of the central bank over the financial factor are expected
to have more financial opposition to inflation.
c) Countries with federal system of government are expected to have a greater financial
opposition to inflation.
d) Countries with less fractionalization of the political party framework are expected to have
a more financial opposition to inflation.
These indicators build up the ultimate determinants of central bank independence and the
level of inflation. From the empirical researches of Posen (1993), it showed that there is clear
statistical evidence that supports a causal link between financial opposition to inflation and CBI
thus low inflation. Cukierman (1992) stated that countries with broad financial markets and a
substantial amount of financial intermediation were more likely to offer high level of
independence to their central banks. The possible disruption because of low CBI and more
inflation in the process of intermediation between savings and investment are proportional to the
size of the financial sector in a country. As a result, countries with large financial market are
more likely to have more CBI than are those with narrow financial markets.
6) Public opposition to inflation
Another important determinant of CBI is public support for the objective of price stability
or public opposition to inflation. The experience of the public with extremely high inflation in
the past is generally seen as the reason for public intensive opposition to inflation. This implies
that there exists a two-way causal relationship between CBI and the level of inflation: an

71 / 76
independent central bank may lead to low inflation in the medium or long run, but high inflation
may result in an autonomous central bank in the very long run. There seems to be a threshold
value for the level of inflation above which public opposition to inflation in a country will be
stimulated and taken into account by the politicians. In general, the conclusion can be drawn that
CBI is strongly related with society’s support of price stability, although not every society or
every government will be prepared to accept such an independent position in central bank.
7) Other determinants
Eijffinger and Schaling (1995) proposed that in the game theory model the higher the
variance of productivity shocks, the lower will be the optimal degree of CBI. The intuition for
this argument is that if the variance of productivity shocks increase, the economy will become
more unstable if other conditions remain same, hence the need for an active stabilization policy
will thus become greater. With a constant relative weight placed on price stability, the balance
between credibility and flexibility will shift toward greater monetary accommodation by the
authors.
In addition, the researchers also found that the steeper the slope of Phillips curve, the higher
is the optimal level of CBI. If the slope of the Phillips curve increased, the benefits from the
unanticipated inflation will rise. Thus it becomes more tempting for the government to inflate the
economy and, in turn, the society’s credibility problem receives more attention. With constant
relative weight placed on price stability, the balance between credibility and flexibility will shift
toward greater commitment to fight inflation.
7. Conclusion of thesis
From the analysis above, although the author find the inflation in China a bit higher, at least
with greater volatility, it is difficult to totally attribute the phenomenon to the effect of central
bank independence. In fact, the stable and lower inflation in euro zone also has the alternative
explanation without the relation to CBI. That is the globalization of the developed countries
leading to the transfer of production to the developing economies. Thus the unit labor cost is kept

72 / 76
down in those developed countries so that avoids the inflation caused by increasing labor cost.
Despite the recent inflation in China reflecting a higher upwards trend, the intensity and
consequence of it should be weighted under the consideration of income growth of Chinese
workers. Because of the even higher speed in average wage growth, workers do not feel so
obvious the burden of price increase. But the income inequality problem results in an unequal
pressure to population. A part of people who are at a lower income growth rate and depend more
on the cash saving may confront with heavier blow from the inflation while the richer group is
influenced a little. Besides, to better evaluate the inflation situation in China, it is necessary to
compare its data with that in the countries of similar economic status, such as the rapid
developing economies rather than only with the data in the euro zone. Only analyzing under the
BRICs system, the reality that a rapid developing country normally has a relevantly higher
inflation can be reflected and inflation in China is at the lowest level in this system.
Finally, even though the central bank independence has not much correlation with the recent
inflation, it deserves paying attention to its function on the long-term economic development in
China. In this paper, the author only investigates the determinants of central bank independence.
As to the measures to improve the degree of central bank independence, there is the difficulty to
thoroughly change the legal CBI towards to the level of the industrialized countries because of
the political reasons in China. Hence, the further study of how to increase the central bank
independence in China is undertaken by more academic researchers.

73 / 76
References
[1] Vittorio Grilli, Donato Masciandaro, Guido Tabellini, E.M., M.P. (1991). Political and
Monetary Institutions and Public Financial Policies in the Industrial Countries. Economic
Policy, 6(13), 341 - 392.
[2] Alberto Alesina, Lawrence H. Summers (1993). Central Bank Independence and
Macroeconomic Performance: Some Comparative Evidence. Journal of Money, Credit and
Banking, 25(2), 151 - 162.
[3] Donato Masciandaro, M. Quintyn, M. W. Taylor (2008). Inside and Outside of the Central
Banks: Independence and Accountability in Financial Supervision, Trend and Determinants.
“Paolo Baffi” Centre Research Paper Series, No: 2008-15.
[4] Dieter Gerdesmeier, F. P. Mongelli, B. Roffia (2007). The Eurosystem, the US Federal
Reserve and the Bank of Japan, Similarities and Differences. European Central Bank
Working Paper Series, No 742.
[5] Olli Lehtimaki (2009). Evaluation of the European Central Bank’s Reaction to the Recent
Financial Crisis within the Two-pillar Framework. Helsinki School of Economics, 2009-05.
[6] Dong He, Laurent L. Pauwels (2008). What Promotes the People’s Bank of China to Change
its Monetary Policy Stance? Evidence from a Discrete Choice Model. Hong Kong Monetary
Authority Working Paper, 2008-06.
[7] Paul Conway, Richard Herd, Thomas C. (2010). Reforming China’s Monetary Policy
Framework to Meet Domestic Objectives. OECD Economics Department Working Papers,
No.822, OECD Publishing, http://dx.doi.org/10.1787/5km32vmsq6f2-en.
[8] Shuanglin Lin (2003). China’s Government Debt: How Serious. China: An International
Journal, 1(1), 73 - 98.
[9] Gheoghe Manolescu (2010). Dimensions of the Monetary Policy. Spiru Haret University,
2010-01.
[10] Carl E. Walsh (2005). Central Bank Independence. University of California, Santa Cruz,
2005-12.
[11] Hafiz A. Akhand (1998) Central Bank Independence and Growth: A Sensitive Analysis. The
Canadian Journal of Economics / Revue canadienne d’Economique, 31(2), 303-317.

74 / 76
[12] Jan Egbert Sturm, Jakob de Haan (2001). Central Bank Independence and Inflation in
Developing Countries: The Role of Influential Observations. Netherland: University of
Groningen, Germany: CESifo, 2001-05.
[13] Alex Cukierman (2005). Central Bank Independence and Monetary Policymaking
Institutions – Past Present and Future. Vina del Mar, Chile: Annual Meeting of the Chilean
Economic Society, 2005-09.
[14] Olivier Bargain, S. K. Bhaumik, M. Chakrabarty, Zhong Zhao (2007). Earnings Differences
between Chinese and Indian Wage Earners, 1987-2004: Trends and the Impact of Education.
University College Dublin, 2007-08.
[15] Heiner Mikoscha, Jan-Egbert Sturmb (2011). Has the EMU Reduced Wage Growth and
Unemployment? Testing a Model of Trade Union Behaviour. Swizerland: KOF Swiss
Economic Institute, 2011-04.
[16] Benedicta Marzinotto (2007).Why So Much Wage Restraint in EMU? The Role of Country
Size Integrating Trade Theory with Monetary Policy Regime Accounts. Italy: University of
Udine, 2007-03.
[17] Patrick Belser, R. Freeman, S. Lee (2010). Global Wage Report 2010/11: Wage policies in
times of crisis. Geneva, Swizerland: International Labour Office, 2010.
[18] Suqin Ge, Dennis Tao Yang (2010). Accounting for Rising Wages in China. US: Virginia
Tech, HK: Chinese University of Hong Kong, 2010-10.
[19] Ramskogler, Paul (2010). The State of Wage Convergence in the European Monetary Union
The interdependence of European Manufacturing Wage Growth and its Limited Impact on
Competitiveness. Vienna University of Economics and Business Working Paper, No. 130,
2010-01.
[20] Jun Han, Junsen Zhang (2007). Wages, Participation and Unemployment in the Economic
Transition of Urban China. HK: Chinese University of Hong Kong, 2007-04.
[21] Stefan Collignon (2009). Wage Developments in Euro-zone: the Failure of the
Macroeconomic Dialogue. Pisa, Italy: Sant’Anna School of Advanced Studies, 2009-03.
[22] Toralf Pusch (2011). Wage Policy Coordination in the Euro-zone – A Robust Concept for
Greater Macroeconomic Stability? International Policy Analysis, 2011-03.
75 / 76
[23] Tun Lin, Juzhong Zhuang, D. Yarcia, F. Lin (2008). Income Inequality in the People’s
Republic of China and Its Decomposition: 1990-2004. Asian Development Review, 2008-01.
[24] William Easterly, Stanley Fischer (2000). Inflation and the Poor. Journal of Money, Credit
and Banking, 1999-04.
[25] Terence Tai-Leung Chong, Ning Zhang, Qu Feng (2011). Structural Changes and Regional
Disparity in China's Inflation. Economic Bulletin, 31(1), 572 - 583.
[26] Ming Lu, Shiqing Jiang (2008). Labor Market Reform, Income Inequality and Economic
Growth in China. China & World Economy, 16(6), 63 - 80.
[27] Lingyi Sun (2010). Economic Transformation and Urban-Rural Disparity in China,
2002-2008. Undergraduate Economic Review, 6(1), Article 10.
[28] James Obben (2006).Does Central Bank Independence Really Offer a ‘FREE LUNCH’to
Countries? Department of Applied and International Economics Discussion Paper, No. 06.
[29] Hongyi Li, Hengfu Zou (2002). Inflation, Growth, and Income Distribution: A
Cross-Country Study. Annals of Economic and Finance, No. 3, 85 - 101.
[30] Chenying Zhang (2010). Sterilization in China: Effectiveness and Cost. The Wharton School,
University of Pennsylvania, 2010-09.

76 / 76
Acknowledgements
I am so grateful to the tutors who give me the favor during my working on the paper. Prof.
Giorgio Di Giorgio enlightened me in the research direction and kindly instructed me where I
could find useful reading materials and data sources. Prof. Ferri Giovanni gave me important
suggestions containing his profound understanding of the research area. In particular, Prof.
Youzhen Zhao patiently helped me to improve the structure of the paper and to decorate the
verbalism of paper. I could not accomplish the research without their helps.
Besides, I appreciate my considerate roommate Berry and housemate Moses. Berry allowed
me to disturb his sleeping many midnights for my overtime on the paper, and Moses helpfully
built a quiet environment for my focusing on the research.
Finally, I would like to thank my families for their never-stopped support on me and
continuing confidence in my capability to succeed.