Embed Size (px)
Citation preview

Iran. J. Chem. Chem. Eng. Research Article Vol. 39, No. 3, 2020
Research Article 213
Comparison of Adsorption Properties of Activated Carbons
with Different Crops Residues as Precursors
for Gold Cyanide Recovery: An Iranian Gold Industry Guide
Salehi, Ehsan*+; Yarali, Majid; Ebadi Amooghin, Abtin
Department of Chemical Engineering, Faculty of Engineering, Arak University,
P.O. Box 38156-8-8349 Arak, I.R. IRAN
ABSTRACT: Adsorption of gold cyanide on three types of Activated Carbons (ACs) has been
investigated in batch and column adsorption conditions. Applied ACs have been derived from different
crops precursors i.e., coconut shell (CAC), peach stone (PAC) and walnut shell (WAC). As peach stone
and walnut shell are abundant agricultural residues in Iran, the activated carbons produced from these
precursors are economically preferable for the gold recovery process. The ACs were characterized
using FTIR, SEM, BET, and Wet-Bed Compaction Hardness analyses. Batch equilibrium adsorption
data was analyzed using the Langmuir, Freundlich, Temkin, and Dubinin–Radushkevich isotherm
models. Freundlich isotherm was in better agreement with the equilibrium data and the maximum
adsorption capacity (40.8 mg/g) was tabulated for CAC. Adsorption kinetics was also modeled using
pseudo-first order, pseudo-second order, and intraparticle diffusion models. The PAC recorded
the highest removal rate in the light of better agreement of the pseudo second order model. Fixed-bed
column experiments were carried out at different initial gold concentrations (30, 50 mg/L) to determine
the characteristics of the breakthrough curves. The maximum bed capacity (37.55 mg/g) was obtained
for CAC. Three dynamic adsorption models including, Thomas, Yoon–Nelson, and Adam–Bohart,
were applied to describe the breakthrough curves. Both Thomas and Yoon–Nelson models were
in appropriate agreement with the experimental column adsorption data. This research introduces
peach stone as a promising precursor considering availability, technical features, and economical
aspects for the production of AC for gold recovery from cyanide leach solutions. Results are also
conductive for gold mining industries to select the appropriate activated carbon.
KEYWORDS: Adsorption; Pregnant liquor; Gold cyanide; Fixed-bed column; Breakthrough
curves.
INTRODUCTION
Gold is a valuable metal which plays an impressive role
in the world economic affairs due to the increasing demand
for gold usage in jewelry, electronics, and medicine
industries. Typically, gold is not directly recovered.
Extraction of gold in industrial scale involves two
important steps: reducing the size of the ore rocks
* To whom correspondence should be addressed.
+ E-mail: [email protected] ; [email protected]
1021-9986/2020/3/213-229 17/$/6.07

Iran. J. Chem. Chem. Eng. Salehi E. et al. Vol. 39, No. 3, 2020
214 Research Article
(physical processing), separating gold from other
components comprising the ore rocks (chemical
processing). Among chemical treatments, cyanidation is
the most commonly used method for gold leaching from
its ore [1-3]. The chemical reaction is as follows [2]:
s aq g lAu CN O H O 224 8 2 (1)
aqaqAu CN OH
2
4 4
To extract gold, the gold-cyanide complex
(
2(aq)Au(CN) ) is adsorbed on the large surface area of the
activated carbon followed by selecting an appropriate
technique from a variety of recovery technologies. Among
conventional methods for the extraction of gold complexes
from cyanide leach solution, adsorption onto activated
carbon is the most prevalent process. Carbon in Pulp (CIP),
Carbon in Column (CIC), and Carbon in Leach (CIL) are
three common AC-based technologies for the gold cyanide
recovery [4-6]; however, the CIP is the most prevalent
technique [7, 8]. The other important process for gold
recovery is the Merrill-Crowe zinc precipitation.
The advantages of CIP over zinc precipitation method include
not only more efficient gold recovery but also lower
operating and capital costs [9].
Gold production process includes two important unit-
operations as “activated carbon adsorption” and “elution”.
The loaded ACs is leached out after adsorption and gold
is recovered. The gold-rich eluant obtained from the elution
stage contains the extracted gold and is called the pregnant
liquor.
Activated carbon is a highly porous organic material
composed of a series of graphitic plates, which are
interconnected by carbon-carbon bonds. This structure
creates high porosity and gives an extensive internal
surface area for adsorption of gold. Activated carbon
can be derived from a variety of different precursors including
coal, wood, agricultural wastes and inorganic materials
like, lignite which are the primary materials used to make
commercial-scale activated carbons. Moreover,
agricultural residues such as hard nut shells (macadamia,
almond, pecan, walnut and hazelnut) and fruit stones
(apricot, cherry and peach stones) [10-13], are also
economically favorable alternative sources for activated
carbon production. The starting material (precursor) can
greatly affect the activated carbon characteristics such as
pore size, pore distribution, reactive sites type and density
and mechanical hardness. Coconut shell is the most
prevalent precursor for the ACs applied in the gold
recovery industry because of its high adsorption capacity,
suitable uptake rate, and high physicochemical stability
against abrasion and compaction in CIC unit [7, 13].
To maximize the gold loading on the activated carbon which
affects the overall gold production yield, it is important
to select a high quality activated carbon with appropriate
chemical and physical properties.
Many studies have concentrated on the adsorption of
complex aqAu CN
2 onto activated carbons made from
raw materials such as agricultural wastes and modified
ACs [13, 14-19]. The potential of our country, Iran,
for producing ACs from abundant vernacular raw materials
such as peach stone and walnut shell is an important issue
which cannot be ignored by the Iranian gold mining
industries. Accordingly, techno-economic feasibility of
replacing CAC with the more available (due to the
abundant sources) WAC and PAC needs to be
investigated.
To the authors’ knowledge, a few research focused
on the gold adsorption from the Au-pregnant liquor
on the ACs with different starting materials are reported
in the literature. This study is aimed at comprehensive batch
and dynamic adsorption investigation of three types of
activated carbons (CAC, WAC, and PAC) applied in gold
cyanide recovery. Isothermal, kinetics and fixed-bed
column properties of the AC/gold-cyanide adsorption
system have been thoroughly tackled. Various chemical
and morphological analyses were also performed to
characterize and understand the chemical/structural
differences among the ACs. The obtained results would be
conductive to the mining industries to select the best AC
alternative regarding both economic and technical
viewpoints for the gold recovery from the gold-cyanide
rich liquor.
EXPERIMENTAL SECTION
Materials
Coconut-shell based granular Activated Carbon (CAC)
which is currently used in the process line (Zar Kuh mining
company, Qorveh, Kurdistan, Iran) provided by Haycarb
Company, Sri Lanka. Peach-core based granular Activated
Carbon (PAC) and Walnut-shell based granular Activated
Carbon (WAC) gifted by the Part Chemical Company,
Hamedan, Iran, were also applied in order to be compared

Iran. J. Chem. Chem. Eng. Comparison of Adsorption Properties of Activated Carbons ... Vol. 39, No. 3, 2020
Research Article 215
Table 1: Physical Characteristics of applied ACs.
Activated Carbon Parameter
WAC PAC CAC
6×12 6×12 6×12 Mesh (US standard sieve size)
85 95 99 Attrition hardness (%)
400 500 560 Density(kg/m3)
7 3 1.8 Ash content (%)
5 <10 2 Moisture content (%)
1120 1180 1232 SBET (m2/g)
3.2 ± 0.05 2.0 ± 0.05 1.3 ± 0.05 WBCH* (cm)
*Bed height lost at initial bed mass of 10 g and external mass of 30 kg after 48 h.
with CAC for the adsorption of
2(aq)Au(CN) . The
specifications of the ACs are listed in Table 1. Sodium
cyanide (NaCN), sodium hydroxide (NaOH), Silver nitrate
(AgNO3), and potassium iodide (KI) were obtained from
Merck. The
2(aq)Au(CN) solution was directly supplied
from the pregnant liquor discharged from the CIC unit.
All the other reagents were of analytical grade and used
as received.
Characterization
Various tests were employed to determine the physical
and chemical properties of the ACs. The BET surface areas
of the three ACs were calculated according to physical
adsorption/desorption of nitrogen at 77 K using Gemini
VII 2390 Surface Area Analyzer. The scanning electron
microscope (SEM, Philips XL30 model) was used to
examine the microstructure of the adsorbents.
The adsorbents were also analyzed using ABB Bomem
(model: MB-104) FTIR spectrometer in order to identify
the functional groups of the ACs. A novel compaction
resistance test namely, wet-bed compaction hardness
was designed and performed to compare the mechanical
resistance of the ACs in column mode.
Gold Recovery Experiments
-
2 aqAu CN Solution
The aqAu CN
2solution was directly obtained from
the pregnant liquor discharged from the desorption stage
of the actual process. For each adsorption test, this solution
was diluted by water to prepare desired sample solutions
with distinct gold concentrations. Next step was adjusting
the cyanide concentration and the pH of the sample
solutions to those of the actual process line. The free
cyanide (CN¯) was measured through titration with silver
nitrate (AgNO3), using potassium iodide (KI) as the
indicator, and adjusted to the desired value by adding
predetermined amount of the NaCN. pH of all the sample
solutions were adjusted to 11 by adding 1.25 M NaOH
solution.
Static equilibrium adsorption
Batch adsorption tests were carried out by introducing
3 g of adsorbent in 2.5 l bottles containing 1 l gold solution
with various initial concentrations (10–200 mg/l) at room
temperature. The bottles were sealed and roll-shacked
at constant rotation speed of 60 rpm for 24 h to reach
the equilibrium. Afterwards, the solution was filtered
with common filter papers and the final concentration
of the supernatant solution was measured using atomic
absorption spectrophotometer (Varian SpectrAA220).
The amount of gold adsorbed per unit mass of adsorbent (qe)
can be determined by using the following equation:
ee
C C Vq
m
0 (2)
where Ce is the equilibrium concentration of gold
(mg/l) in the supernatant.
Equilibrium adsorption data were analyzed using four
widely-used isotherms including Langmuir Eq. (3),
Freundlich Eq. (4) and two more models including
Temkin, and Dubinin–Redushkevich (D-R).

Iran. J. Chem. Chem. Eng. Salehi E. et al. Vol. 39, No. 3, 2020
216 Research Article
max L ee
L e
q k Cq
k C
1 (3)
ne f eq k C 1 (4)
Where qmax is the maximum adsorption capacity,
kL (l/mg) is the Langmuir constant related to the free energy
of adsorption. kf ((mg/g) (l/mg)1/n) is the Freundlich
sorption constant and 1/n is related to the adsorption
intensity. To measure the adsorption favorability,
a dimensionless constant named, separation factor (RL),
is defined by the following equation:
LL
Rk C
0
1
1 (5)
For a favorable adsorption, the amount of RL should be
between zero and 1.
The Temkin isotherm is given by the following
equation:
e eT
RTq Ln AC
b (6)
Where A is the Temkin isotherm constant (l/g), bT is
the Temkin constant related to adsorption heat (J/mol), R is
the gas universal constant (8.314 J/mol K) and T is
the absolute temperature (K).
The Dubinin–Radushkevich (D-R) isotherm is presented
by Eq. (7) to (9):
e max tq q exp B q 2 (7)
e
RTLnC
11 (8)
EB
1
2 (9)
where ε is the Polanyi potential, E is the free energy
of adsorption (J/mol) and B is the constant related
to the sorption energy (mol2/J2).
It is worth mentioning that the equilibrium, kinetic and
subsequently the dynamic constants were calculated
through non-linear regression using Curve Fitting Toolbox
of MATLAB (R2009a) software.
Kinetics
Adsorption kinetic tests were conducted to evaluate
the gold adsorption rate and mechanism. Batch adsorption
tests were performed using rolling bottle shaking method
in 2.5 l bottles containing 1 l gold cyanide solution and 3g
of the adsorbent at room temperature (25 ±2 ◦C).
The bottles were sealed and rolled at constant rotation speed
of 60 rpm for 6 h. During the operation, gold solution
samples were being taken in predetermined time intervals.
The content of the bottles were filtered as before and gold
concentration of the filtrate was analyzed by the atomic
absorption spectrophotometer. The gold uptake at time t
was calculated by the following equation:
tt
C C Vq
m
0 (10)
Where qt is the amount of solute adsorbed per unit mass
of the adsorbent (mg/g), C0 and Ct are the initial and time-
dependent gold concentrations in the
2(aq)Au(CN)
solution (mg/l), respectively. V (l) is the volume of
the
2(aq)Au(CN) sample solution, and m is the adsorbent
dry mass (g).
In present work, pseudo-first-order Eq. (11), pseudo-
second-order Eq. (12) and intraparticle diffusion (Eq. (13)),
models were employed to describe the kinetic of
the adsorption process:
le t e
k tlog q q logq
.
2 303 (11)
t eeq qk q
2
2
1 1 2 (12)
.t pq k t 0 5 (13)
where qe and qt are the amount of solute adsorbed
per unit mass of adsorbent (mg/g) at equilibrium and at time t,
respectively. k1 (min-1), k2 (g/mg min) and kp (mg/g min0.5)
are adsorption rate constants.
It is worthy of notice that all the experiments (including
isothermal, kinetics and column tests) have been randomly
replicated in triplicate and the maximum deviation from
the average values was less than 5%.
Validity of static and dynamic adsorption models
In addition to the prevalently used correlation
coefficient (R2), the hybrid error function (HYBRID)
was also used to measure the goodness of the fits.
The HYBRID equation can be expressed as:

Iran. J. Chem. Chem. Eng. Comparison of Adsorption Properties of Activated Carbons ... Vol. 39, No. 3, 2020
Research Article 217
exp calN
eiei
expi l ei
q qHYBRID
N p q
2
100 (14)
Where expeiq (mg/g) is the observed adsorption amount
for the i-th experiment, caleiq is the adsorption amount
estimated by the isotherm model, N is the number of
the observations and p is the number of the parameters used
in the model. The smaller values of the HYBRID function
reflects the appropriateness of the applied model.
For the kinetics and fixed bed column studies, qei is replaced
by qti and Cti , respectively.
Fixed-bed column
Setup
A plastic cylinder with an internal diameter of 1.5 cm
and the length of 19 cm was used as the fixed-bed column.
A thin layer of glass wool was placed at the bottom of the
column to prevent stream channeling and blockage of the
plastic tube by the adsorbents during the process. 7g of
fresh AC was loaded in the column for each run.
The 2(aq)
Au(CN)
solution of known concentration
(30, 50 mg/L) was continuously fed upward into the column
at the constant flow rate of 20 mL/min using a roller clamp
tubing system. This system consists of a plastic tube and
a roller clamp. Plastic tube connects the reservoir of the gold
solution to the bottom of the column and the roller clamp
was used to control the flow rate of the solution.
The 2
Au(CN) solution samples were collected from
the outlet of the column at pre-determined time intervals and
analyzed for gold concentration using atomic absorption
spectrophotometer (Varian SpectrAA220).
Mathematical framework
The analysis of the breakthrough curves is an
appropriate way to evaluate the performance of a typical
fixed-bed column. Mechanism of adsorption process, flow
velocity and feed concentration are important factors
obtained through the breakthrough curves. Commonly,
the breakthrough curve is defined as the ratio of the outlet gold
concentration to the feed concentration (Ceff /Co)
as a function of time or volume of the effluent, Veff (mL),
as shown by the following equation:
ff totalV Qt (15)
where Q and ttotal represent the volumetric flow rate
(mL/min) and time (min), respectively. The point where
Ceff /Co=0.05 is defined as breakthrough time (tb) while
exhaustion time (te) corresponds to Ceff /Co=0.95.
The amount of the total gold adsorbed, qtotal (mg),
by the column can be obtained from the area under
the breakthrough curve using the following equation:
t total t total
rtotal ad efft t
QA Qq C dt C C dt
00 01000 1000
(16)
The total amount of gold received by the column,
mtotal (mg), is represented as below:
totaltotal
C Qtm 0
1000 (17)
The equilibrium gold uptake or in other word,
the maximum capacity of the column, qe (mg/g),
can be written as:
totaleq
m (18)
where m (g) is the dry mass of the adsorbent loaded
in the column. At equilibrium, unabsorbed gold
concentration in the dynamic adsorption system
is calculated as follows:
total totaleq
eff
m qc
V
1000 (19)
The total removal percentage (Y) of gold is also
evaluated as given by Eq. (19):
total
total
qY
m 100 (20)
Modeling of column data
Thomas model
This breakthrough model estimates the adsorption
capacity of the bed. Constant void fraction of the column,
negligible radial and axial dispersion in the bed, isobaric
and isothermal operating conditions, no signs of resistance
against intraparticle and external diffusion are some
of the basic assumptions of this model [20]. The linearized
form of the Thomas model is given by:
ThTh
t
C k q mln k C t
C Q
0 001 (21)

Iran. J. Chem. Chem. Eng. Salehi E. et al. Vol. 39, No. 3, 2020
218 Research Article
Where kTh (mL/min.mg) is the Thomas rate constant,
q0 (mg/g) is the adsorption capacity of the column,
Ct (mg/L) is the effluent gold concentration at time t and
at last t is flow time (min).
Yoon-Nelson model
The Yoon–Nelson model has been developed based
on the assumption that the decrease in the probability of each
adsorbate is proportional to the probability of its
adsorption and breakthrough on the adsorbent [21, 22].
Simplicity and fewer requirements to the detailed column
data are some advantages of this model [23].The linearized
form of the Yoon–Nelson model for a single component
system is represented by:
tYN YN
t
Cln k t k
C C
0 (22)
where kYN (min-1) and τ (min) are the Yoon-Nelson rate
constant and the time required for 50% adsorbate
breakthrough, respectively.
Adams-Bohart model
Adams-Bohart model is based on the theory of surface
reaction and assumes that equilibrium does not reach
immediately [24]. This model is proper for the description
of the initial part of the breakthrough curve [25].
The Adams-Bohart model is expressed as follows:
tAB AB
C Zln k C t k N
C U 0 0
0 0
(23)
where kAB (l/mg .min) is the Adam–Bohart kinetic
constant, U0 (cm/min) is the linear velocity calculated
by dividing the flow rate by the column section area, Z (cm)
is the bed depth of the column and N0 (mg/L) is the
saturation concentration.
RESULTS AND DISCUSSION
Characterization
FT-IR
Fig. 1(a) presents the FTIR spectra for CAC before and
after adsorption of gold. In the case of unloaded CAC,
three major intense peaks around 3428, 1383 and 1083 cm-
1 besides a moderate band at 1616 cm-1 are related to O-H
stretching, O-H bending, C–O–C stretching and C=C
stretching vibrations, respectively [26]. Considering these
peaks, the main functional groups on the surface of
the CAC can be expressed as hydroxyl and carboxylic
anhydride groups. Figs. 1(b) and 1(c) show the FT-IR
spectra of loaded and unloaded PAC and WAC,
respectively. For both unloaded ACs, the adsorption peaks
around 3100-3500 cm-1 region are attributed to OH
stretching band of hydroxyl groups, the peak at 1125 cm-1
can be ascribed to O-H (carboxylic) or C-O (phenolic) and
furthermore, the absorption bands at 1380-1700 cm-1
region are ascribed to carbonyl (C=O, stretching vibration)
and aromatic (CH) groups [27]. For unloaded PAC
the band at 2360 cm-1 indicates the existence of C≡N
in the nitrogen containing functional groups.
Most of the spectral analyses used to identify
the mechanism of gold adsorption, have resulted in reduction
of the ionic gold to the elemental gold [28, 29]. For
all the Au-loaded ACs in Fig. 1, shift of specific FT-IR peaks
signify the interactions between the solute and the
functional groups on the surface of the adsorbents. Similar
observation is obtained for the IR spectra after gold
adsorption elsewhere [28, 29]. For example in Fig. 1(a),
O-H stretching at 3428 shifts to 3447 cm-1 and C=C
stretching at 1616 changes to1630 cm-1. The peaks at
1383 and 1083 cm-1 shifts to 1401 and 1108, respectively.
In addition to this, for Au-loaded CAC and PAC, the increase
in the intensity of the bands at 1558 cm-1 and 1586 cm-1
can be attributed to the oxidation of hydroxyl groups
on the surface of the ACs to the carbonyl groups as shown below:
R OH R O H e (24)
Thus, OH stretching vibration of hydroxyl groups
plays an important role in gold adsorption. As can be seen
in Fig. 1, the intensity of OH stretching vibration for
various adsorbents before adsorption follows this order:
CAC > PAC > WAC
The other important difference among the three ACs
before adsorption appears at 1000-1130 cm-1 region.
The intensity of this band which can be ascribed to Si-O
stretching vibration of mineral elements in the carbons
[30], obeys the following order: WAC > PAC > CAC.
This result is in agreement with the amount of ash content
presented in the ACs structure, as depicted in Table 1.
Ash content reduces the adsorption capacity of the ACs.
The increase in the transmittance intensity of the gold-
loaded ACs is the consequence of oxidation of functional
groups during reduction of gold- cyanide complex ions and
appearance of R=O stretching band [28].

Iran. J. Chem. Chem. Eng. Comparison of Adsorption Properties of Activated Carbons ... Vol. 39, No. 3, 2020
Research Article 219
Fig. 1: FT-IR spectra of the adsorbents: CAC (a), PAC (b) and
WAC (c).
Wet-Bed Compaction Hardness (WBCH)
Based on the authors’ knowledge, this method
has not been referenced elsewhere. This is an innovative test
and defined for measuring the mechanical compaction
resistance of the wet bed against hydrostatic pressure.
This is an important property for the adsorption beds
when applied in dynamic or column mode.
The WBCH test applied for comparing mechanical
resistance of different ACs against compaction in the wet
bed condition includes a graduated cylinder (2.2 cm
internal diameter and 24 cm height), piston and weights.
For performing each test, the same amount of the
adsorbent (10g) is loaded in the cylinder. Afterwards,
the wet AC is pressurized by the piston and weights (30kg)
at the top of it. Bed length changes after 48 h were measured.
The results are reported in the last raw of the Table 1.
According to the results, CAC recorded the least bed
height lost among all the tested ACs. PAC and WAC
tabulated the subsequent places. The current outcome is
in tune with the reported attrition hardness for the ACs (Table 1).
SEM
The SEM images of the ACs with various
magnifications are shown in Fig. 2. Image J software
was applied for analyzing the SEM micrographs. Pore size
distribution plots and corresponding results for each
adsorbent are depicted in Fig. 3 and Table 2, respectively.
As can be seen, CAC has the least value of average
pore diameter. The lower pore diameter results in higher
surface area which is in accordance with the values of SBET
reported in Table 1. The calculated values of the standard
deviation in Table 2 demonstrates semi-homogeneous
dispersion and consequently more favorable pore size
distribution of CAC in comparison to the other ACs. Thus,
the favorability of the porous structure according
to the SEM analysis results is as follows: CAC > PAC > WAC
Isotherms
The Langmuir and Freundlich adsorption isotherms
were applied to fit the adsorption equilibrium data of CAC,
PAC and WAC. Results are shown in Fig. 4(a).
The Temkin and D-R isotherms were the two more models
used for the curve fitting as depicted in Fig. 4(b).
Constants, correlation coefficients (R2) and HYBRID
values obtained from the curve fitting of the isotherm
models are listed in Table 3.
Wavelength (1/cm)
0 1000 2000 3000 4000
110
105
100
95
90
85
80
Tra
nsm
ita
nce
Wavelength (1/cm)
0 1000 2000 3000 4000
110
105
100
95
90
85
80
Tra
nsm
ita
nce
Wavelength (1/cm)
0 1000 2000 3000 4000
110
105
100
95
90
85
80
Tra
nsm
ita
nce
(a)
(b)
(c)

Iran. J. Chem. Chem. Eng. Salehi E. et al. Vol. 39, No. 3, 2020
220 Research Article
Fig. 2: SEM images of the adsorbents: CAC (A [500x], B [5000x]), PAC (C [1000x], D [2500x]) and WAC (E [1000x], F [3000x]).

Iran. J. Chem. Chem. Eng. Comparison of Adsorption Properties of Activated Carbons ... Vol. 39, No. 3, 2020
Research Article 221
Table 2: SEM image analyzing parameters for the adsorbents porous structure.
Adsorbents Parameter
WAC PAC CAC
21.20 18.56 17.61 Average pore diameter (µm)
6.73 6.52 4.38 Standard deviation of pore size
1344.42 1613.84 2200.23 Total number of pores per scanned surface unit (mm-2)
Fig. 3: Pore size distribution for the adsorbents.
According to the results, the Freundlich model
provides the best fit to the equilibrium data for both CAC
and PAC, as obtained by other researchers [13, 14]. This
is concluded from the minimum values of HYBRID and
maxium values of R2. According to the isotherm
hypotheses, some features such as multilayer coverage of
adsorbates, heterogeneity of reactive sites and
nonuniformity of energy distribution on the surface of AC
are ascertained [31]. In the case of WAC, the highest and
the lowest values of R2 and HYBRID belong to the
Freundlich and Temkin models, respectively. Parameter N
(Table 3) represents values larger than unity which
indicates that the type of the adsorption is physical. CAC
exhibits the most adsorption capacity (qmax) which can be
attributed to the higher intensity of OH stretching vibration
and further BET surface area compared to the other ACs.
The larger Langmuir constant (KL) of PAC indicates
the higher surface energy and affinity toward the adsorbate.
Because RL values obtained for all the adsorbents (Table 3)
at initial concentration of 100 mg/L are below than unity,
it is concluded that the adsorption is favorable.
The Temkin model assumes the adsorption heat of
the molecules would decrease linearly with the surface
coverage [32, 33]. The values of R2 for the Temkin model
are acceptable but not as good as those obtained
for the Freundlich model. So, it is more presumable that
the ACs follows nonlinear energy distribution rather than
linear one. 1/bT parameter of the Temkin equation represents
the potential of the adsorbents for gold complex chelation.
According to the data presented in Table 3, CAC
introduces the most affinity toward gold cyanide among
the other ACs. In addition, positive values of bT signify
that the adsorption process is exothermic [33].
D-R model introduces the lowest correlation
coefficient in comparison to the other models. The highest
value of E is belonged to CAC. As the E value for all three
adsorbents is less than 8kJ/mol, the physical and
multilayer adsorption nature of 2
Au(CN) on the ACs
can be inferred [34]. This result is in tune with what
obtained in relation to the Freundlich model. In addition,
the high values of the parameter B (Table 3), the porosity
factor, confirms the concept of the physical sorption
as outlined by the other isotherm models [34].
The Gibbs free energy change (ΔG0) is a
thermodynamic parameter which can be calculated by the
Van’t Hoff equation:
LAG RTlnk 0 (25)
Where T is the absolute temperature (K), R is
the universal gas constant (8.314 J/mol.K) and kL
is the thermodynamic equilibrium constant estimated
by the Langmuir isotherm rate constant. Negative values
of ΔG0 for all the ACs (Table 3) confirm the spontaneity
of the adsorption. Obtained amounts of ΔG0 for all
three ACs (less than 40 kJ/mol) is another verification
to the fact that the physisorption is occurred [35, 36].
Kinetics
A series of kinetic models were applied to describe
the adsorption rate of 2(aq)
Au(CN) on various ACs.
These models include the pseudo-first order, pseudo-second
0
2
4
6
8
10
12
14
16
18
20
22
1-5 5-10 10-15 15-20 20-25 25-30 30-35 35-40 40-45
Fre
qu
ency
Diameter (µm)
CAC
PAC
WAC

Iran. J. Chem. Chem. Eng. Salehi E. et al. Vol. 39, No. 3, 2020
222 Research Article
Table 3: Isotherm parameters for gold adsorption on CAC, PAC and WAC.
Isotherm Parameters Adsorbent
CAC PAC WAC
Langmuir qmax 40.80 32.97 23.12
KL 0.123 0.140 0.073
RL 0.075 0.066 0.120
R2 0.962 0.938 0.950
ΔG0(kJ/mol) -11.92 -12.24 -10.63
HYBRID 32.278 40.498 20.555
Freundlich Kf 8.067 7.543 4.340
N 2.556 2.888 2.870
R2 0.992 0.987 0.950
HYBRID 7.784 10. 177 23.411
Temkin A 1.471 1.766 0.710
bT 300.1 385.0 502.3
R2 0.968 0.947 0.910
HYBRID 20.481 22.015 19.768
D-R qmax 30.37 26.19 19.06
E(kJ/mol) 0.537 0.518 0.196
B(×106) 1.732 1.858 12.910
R2 0.830 0.810 0.860
HYBRID 199.075 166.105 53.632
Fig. 4: Isotherm models for gold adsorption on the ACs.
0 10 20 30 40 50 60 70 80 90 100 0
5
10
15
20
25
30
35
40
Qe (
mg/g
)
Ce (mg/l)
CAC PAC WAC Temkin D-R
Ce (mg/L)
0 10 20 30 40 50 60 70 80 90 100
50
45
40
35
30
25
20
15
10
5
0
Qe (
mg
/g)
Ce (mg/L)
0 10 20 30 40 50 60 70 80 90 100
40
35
30
25
20
15
10
5
0
Qe (
mg
/g)
(a) (b)

Iran. J. Chem. Chem. Eng. Comparison of Adsorption Properties of Activated Carbons ... Vol. 39, No. 3, 2020
Research Article 223
Table 4: Kinetic parameters of Pseudo-first-order (PFO) and Pseudo-second-order (PSO)
models for gold adsorption on CAC, PAC and WAC.
Adsorbent
CAC PAC WAC
PFO Model-calc. qe 9.358 9.088 7.027
K1 (h-1) 0.95 1.14 0.64
R2 0.996 0.995 0.995
HYBRID 0.952 1.047 0.987
PSO Model-calc. qe 10.89 10.3 8.76
K2 (mg.g-1.h-1) 0.112 0.16 0.076
R2 0.999 0.999 0.997
HYBRID 0.023 0.255 0.392
Fig. 5: The adsorbed amount of gold as a function of time onto
the adsorbents.
Fig. 6: Intraparticle-diffusion plots for adsorption of gold
on the ACs.
order and intraparticle diffusion kinetic models. Fig. 5
shows the adsorbed amount of gold complex on different
ACs as a function of time.
As can be seen, equilibrium (or adsorption capacity)
for PAC occurs earlier than the other two ACs. In order to
compare the kinetic characteristics of the activated
carbons, the constant parameters, regression coefficients
and HYBRID values are reported in Table 4. Both of
the kinetic models suggest high correlation coefficients
and favorable agreement between the qt values calculated
from the models and those obtained from the experiments;
however, lower HYBRID values indicates that the psudo-
second order model is of higher appropriateness.
This leads to select the pseudo-second order model
for representing the sorption kinetics.
Higher uptake rate constant (k2) belongs to PAC which
verifies the superior adsorption rate of the gold complex
onto PAC.
The plots of qt versus t0.5 for gold adsorption
on different adsorbents (Fig.6) are nonlinear. Therefore,
it is concluded that the intraparticle diffusion is not the sole
rate-controlling mechanism of the adsorption.
Fixed-bed column study
Column data analysis
The breakthrough curves obtained for the ACs at two
0 1 2 3 4 5 6 0 1
2
3
4
5
6
7
8
9
Time (hour)
Q (
mg
/g)
PAC
CAC
WAC
Second order First order
0
2
4
6
8
10
12
0 1 2 3
Q(m
g/g
)
t^0.5 (min)
CAC
PAC
WAC
Time (h)
0 1 2 3 4 5 6
9
8
7
6
5
4
3
2
1
0
Q (
mg/g
)

Iran. J. Chem. Chem. Eng. Salehi E. et al. Vol. 39, No. 3, 2020
224 Research Article
Fig. 7: Effect of initial concentration on gold removal by CAC
(a), PAC (b) and WAC (c).
different gold inlet concentrations (30 and 50 mg/L)
are shown in Fig.7. Adsorption parameters, calculated
according to the mathematical framework, are presented
in Table 5. As can be concluded from both Fig.7 and Table 5,
higher feed concentration results in faster breakthrough
time (tb) and steeper slope of the breakthrough curve.
As it is obvious from Fig. 7, for all the adsorbents
(especially PAC and WAC) with 50 mg/l
2(aq)Au(CN)
as the feed, the adsorption rate is initially high and after
sometimes decreases by reducing the removal efficiency
of the system and finally meets a constant at the
equilibrium time, t=600 and t=300 min for PAC and WAC,
respectively. At the lower influent concentration (30 mg/l),
after the mentioned times, the adsorbents are still
unsaturated and able to receive more inlet solution.
In other words, higher feed concentration results in faster bed
saturation and consequently faster completion of the
breakthrough time.
According to the literature, the performance of the
breakthrough curves is less affected by the feed
concentration when heavy metals are the adsorbing
components [37]. The insignificant effect of the feed
concentration on the adsorbents performances (Fig.8) may
be also attributed to unremarkable amounts of bed
adsorption capacity (q0 values in Thomas model).
Moreover, there is not sufficient concentration driving
force in the system when feed is a dilute solution.
Therefore, breakthrough curves characteristics are not
highly affected by the feed concentration.
It is noticeable that PAC, at both concentrations, shows
the highest value of tb. This means that better utilization of
the bed adsorption capacity is possible for this activated
carbon. This may be attributed to better adsorption kinetic
of PAC compared to the other ACs.
For all the breakthrough curves, Mass Transfer Zone (MTZ)
lies between C/C0 = 0.05 to C/C0 = 0.95. Considering
constant operating conditions such as type of the adsorbent
used, the initial concentration of influent and the residence
time, the higher values of tb (longer breakthrough time)
results in the lower values of MTZ. This reduction
in the length of MTZ reflects better utilization of the
adsorption capacity of the bed in the adsorption process.
Increasing the gold concentration in the influent
provides higher driving force for mass transfer,
so the adsorbents saturation occurs more rapidly. This results
in a decrease in the exhaust time (te) and the treated volume (Veff).
0 100 200 300 400 500 600 700 800 900 0
0.1
0.2
0.3
0.4
0.5
0.6
0.7
0.8
0.9 C
eff /
C0
Au 50 mg/l
Au 30 mg/l
Thomas Au 50 mg/l
Thomas Au 30 mg/l
Time (min)
0 100 200 300 400 500 600 700 0
0.1
0.2
0.3
0.4
0.5
0.6
0.7
0.8
0.9
1
Time (min)
Ceff /
Co
Au 50 mg/l
Thomas Au 50 mg/l
Au 30 mg/l
Thomas Au 30 mg/l
0 100 200 300 400 500 600 0
0.1
0.2
0.3
0.4
0.5
0.6
0.7
0.8
0.9
1
Time (min)
Ceff /
C0
Au 50 mg/l
Au 30 mg/l
Thomas Au 50 mg/l
Thomas Au 30 mg/l
Time (h)
0 100 200 300 400 500 600 700 800 900
0.9
0.8
0.7
0.6
0.5
0.4
0.3
0.2
0.1
0
Ceff /
C0
(a)
Time (h)
0 100 200 300 400 500 600 700
1
0.9
0.8
0.7
0.6
0.5
0.4
0.3
0.2
0.1
0
Ceff /
C0
(b)
Time (h)
0 100 200 300 400 500 600
1
0.9
0.8
0.7
0.6
0.5
0.4
0.3
0.2
0.1
0
Ceff /
C0
(c)
Iran. J. Chem. Chem. Eng. Comparison of Adsorption Properties of Activated Carbons ... Vol. 39, No. 3, 2020
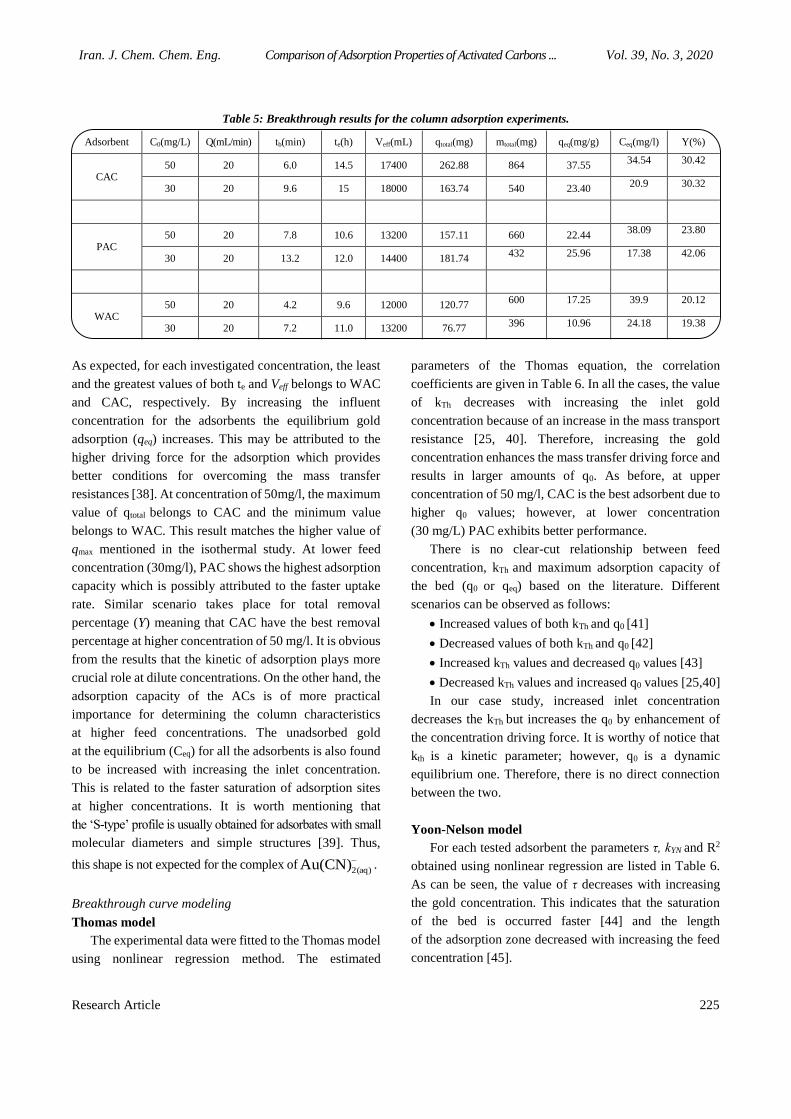
Research Article 225
Table 5: Breakthrough results for the column adsorption experiments.
Y(%) Ceq(mg/l) qeq(mg/g) mtotal(mg) qtotal(mg) Veff(mL) te(h) tb(min) Q(mL/min) C0(mg/L) Adsorbent
30.42 34.54 37.55 864 262.88 17400 14.5 6.0 20 50
CAC 30.32 20.9
23.40 540 163.74 18000 15 9.6 20 30
23.80 38.09 22.44 660 157.11 13200 10.6 7.8 20 50
PAC 42.06 17.38 25.96 432
181.74 14400 12.0 13.2 20 30
20.12 39.9 17.25 600 120.77 12000 9.6 4.2 20 50
WAC 19.38 24.18 10.96 396
76.77 13200 11.0 7.2 20 30
As expected, for each investigated concentration, the least
and the greatest values of both te and Veff belongs to WAC
and CAC, respectively. By increasing the influent
concentration for the adsorbents the equilibrium gold
adsorption (qeq) increases. This may be attributed to the
higher driving force for the adsorption which provides
better conditions for overcoming the mass transfer
resistances [38]. At concentration of 50mg/l, the maximum
value of qtotal belongs to CAC and the minimum value
belongs to WAC. This result matches the higher value of
qmax mentioned in the isothermal study. At lower feed
concentration (30mg/l), PAC shows the highest adsorption
capacity which is possibly attributed to the faster uptake
rate. Similar scenario takes place for total removal
percentage (Y) meaning that CAC have the best removal
percentage at higher concentration of 50 mg/l. It is obvious
from the results that the kinetic of adsorption plays more
crucial role at dilute concentrations. On the other hand, the
adsorption capacity of the ACs is of more practical
importance for determining the column characteristics
at higher feed concentrations. The unadsorbed gold
at the equilibrium (Ceq) for all the adsorbents is also found
to be increased with increasing the inlet concentration.
This is related to the faster saturation of adsorption sites
at higher concentrations. It is worth mentioning that
the ‘S-type’ profile is usually obtained for adsorbates with small
molecular diameters and simple structures [39]. Thus,
this shape is not expected for the complex of
2(aq)Au(CN) .
Breakthrough curve modeling
Thomas model
The experimental data were fitted to the Thomas model
using nonlinear regression method. The estimated
parameters of the Thomas equation, the correlation
coefficients are given in Table 6. In all the cases, the value
of kTh decreases with increasing the inlet gold
concentration because of an increase in the mass transport
resistance [25, 40]. Therefore, increasing the gold
concentration enhances the mass transfer driving force and
results in larger amounts of q0. As before, at upper
concentration of 50 mg/l, CAC is the best adsorbent due to
higher q0 values; however, at lower concentration
(30 mg/L) PAC exhibits better performance.
There is no clear-cut relationship between feed
concentration, kTh and maximum adsorption capacity of
the bed (q0 or qeq) based on the literature. Different
scenarios can be observed as follows:
Increased values of both kTh and q0 [41]
Decreased values of both kTh and q0 [42]
Increased kTh values and decreased q0 values [43]
Decreased kTh values and increased q0 values [25,40]
In our case study, increased inlet concentration
decreases the kTh but increases the q0 by enhancement of
the concentration driving force. It is worthy of notice that
kth is a kinetic parameter; however, q0 is a dynamic
equilibrium one. Therefore, there is no direct connection
between the two.
Yoon-Nelson model
For each tested adsorbent the parameters τ, kYN and R2
obtained using nonlinear regression are listed in Table 6.
As can be seen, the value of τ decreases with increasing
the gold concentration. This indicates that the saturation
of the bed is occurred faster [44] and the length
of the adsorption zone decreased with increasing the feed
concentration [45].

Iran. J. Chem. Chem. Eng. Salehi E. et al. Vol. 39, No. 3, 2020
226 Research Article
Table 6: Parameters of the column models for gold-cyanide adsorption on different activated carbons.
Operating
conditions Thomas parameters Yoon–Nelson parameters Adams–Bohart parameters
Adso
rpti
on
Q(m
L/m
in)
m(g
)
C0(m
g/l
)
KT
H(m
L/m
in
.mg)
×10
-5
q0(m
g/g
)
×10
4
R2
HY
BR
ID
KY
N(m
in-1
)
×10
-3
τ(m
in)
R2
HY
BR
ID
KA
B(l/m
in.m
g) ×
10-5
N0(m
g/L
)
×10
4
R2
HY
BR
ID
CAC
20 7 50 9.04 2.913 0.866 0.6571 4.69 195.4 0.866 0.6 1.625 5.665 0.686 1.978
20 7 30 13.40 2.128 0.882 0.9928 4.55 222.8 0.882 0.68 3.226 3.321 0.742 2.27
PAC
20 7 50 17.52 1.50 0.836 0.9231 8.40 109.5 0.836 0.91 2.782 3.209 0.631 1.9
20 7 30 18.54 2.281 0.912 1.054 5.19 285.2 0.912 0.97 6.086 2.367 0.839 2.24
WAC
20 7 50 36.25 0.7384 0.769 1.573 18.13 51.68 0.769 1.56 2.196 3.053 0.489 1.61
20 7 30 43.69 0.5287 0.702 1.78 13.09 61.69 0.702 1.7 3.453 2.024 0.478 1.66
Adams-Bohart model
Using nonlinear regression analysis, the relative
constants and correlation coefficients for all the three
adsorbents were calculated and the results are reported
in Table 6. The saturation concentration of gold (N0)
is enhanced with an increase in the influent concentration
due to the higher loading of adsorbate on the bed.
As expected, the maximum and minimum values of N0
for both tested concentration belongs to CAC and WAC,
respectively. The KAB values decreases with increasing
the gold concentration in the feed. This fact indicates that
the kinetics of the overall system is mainly affected by
the external mass transfer at the initial part of the adsorption
column [25].
A comparison among R2 values obtained for all
the three models reveals that both the Thomas and Yoon-
Nelson provide appropriate fit in comparison to the
Adams-Bohart model under the same experimental conditions.
Considering the highest R2 and the lowest HYBRID
values, the Yoon-Nelson is the best model for the dynamic
modeling of the AC/gold adsorption system. Similar
results have been obtained by other researchers [38, 46].
So, it can be said that the adsorption process is not dominated
by the surface diffusion mechanism.
Fig. 8 represents the breakthrough curves for gold
adsorption by various adsorbents at the same operating
condition. The breakthrough curve for gold adsorption
onto CAC is less steep than the curves of the other
adsorbents. After 600 min of continuous flow, both PAC
and WAC curves experience exhaustion, while CAC does
not. Thus, it is inferred that the favorability of the column
adsorption by the ACs follows this order: CAC > PAC >
WAC
CONCLUSIONS
Gold adsorption from gold-cyanide leach solution onto
three types of activated carbons with different precursors
including walnut shell, peach stone, and coconut shell
was investigated in both batch and fixed-bed column
adsorption conditions. Characterization of the adsorbents
was performed using FTIR, BET, SEM and WBCH tests
and CAC suggested superior specifications such as surface
area (2200 m2/g), chemistry and hardness values (% 99
and 1.3 cm). The Freundlich isotherm was well fitted
to the equilibrium adsorption data and CAC recorded the
highest adsorption capacity around 41 mg/g. Pseudo-second-
order model provides better description of the kinetic data
with the higher adsorption rate constant ascribed to PAC.
In the fixed-bed column study, higher gold inlet concentrations
resulted in faster bed saturation, steeper breakthrough
curves and higher bed adsorption capacity. According to
the results, CAC introduced better performance in both
batch and continuous adsorption modes. With considering
the economic considerations and the availability of
the starting materials for the production of activated carbon
in our country, peach stone AC is demonstrated to be
a potential alternative to the coconut shell-based AC
for applying in gold extraction process.
Acknowledgments
The authors gratefully thank Zar Kuh Mining
Company (Qorveh, Kurdistan, Iran) for their support
during completion of this project.
Nomenclature
A Temkin isotherm constant, l/g
AC Activated carbon
Iran. J. Chem. Chem. Eng. Comparison of Adsorption Properties of Activated Carbons ... Vol. 39, No. 3, 2020
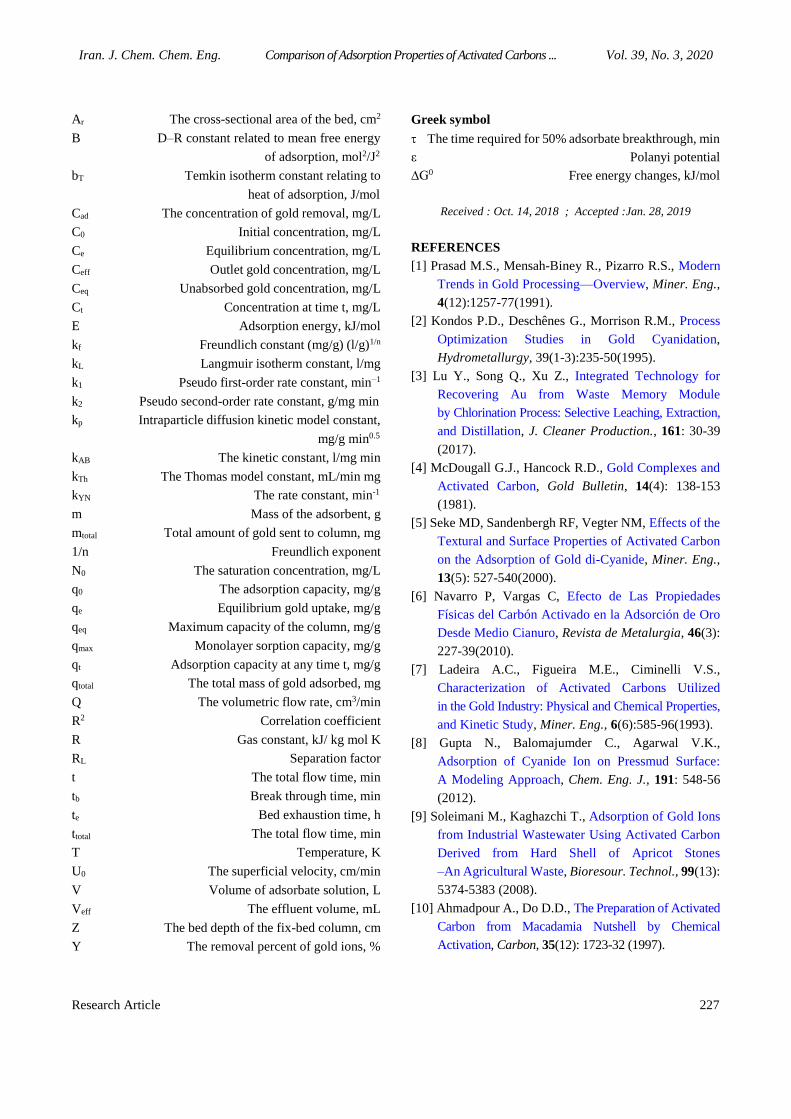
Research Article 227
Ar The cross-sectional area of the bed, cm2
B D–R constant related to mean free energy
of adsorption, mol2/J2
bT Temkin isotherm constant relating to
heat of adsorption, J/mol
Cad The concentration of gold removal, mg/L
C0 Initial concentration, mg/L
Ce Equilibrium concentration, mg/L
Ceff Outlet gold concentration, mg/L
Ceq Unabsorbed gold concentration, mg/L
Ct Concentration at time t, mg/L
E Adsorption energy, kJ/mol
kf Freundlich constant (mg/g) (l/g)1/n
kL Langmuir isotherm constant, l/mg
k1 Pseudo first-order rate constant, min−1
k2 Pseudo second-order rate constant, g/mg min
kp Intraparticle diffusion kinetic model constant,
mg/g min0.5
kAB The kinetic constant, l/mg min
kTh The Thomas model constant, mL/min mg
kYN The rate constant, min-1
m Mass of the adsorbent, g
mtotal Total amount of gold sent to column, mg
1/n Freundlich exponent
N0 The saturation concentration, mg/L
q0 The adsorption capacity, mg/g
qe Equilibrium gold uptake, mg/g
qeq Maximum capacity of the column, mg/g
qmax Monolayer sorption capacity, mg/g
qt Adsorption capacity at any time t, mg/g
qtotal The total mass of gold adsorbed, mg
Q The volumetric flow rate, cm3/min
R2 Correlation coefficient
R Gas constant, kJ/ kg mol K
RL Separation factor
t The total flow time, min
tb Break through time, min
te Bed exhaustion time, h
ttotal The total flow time, min
T Temperature, K
U0 The superficial velocity, cm/min
V Volume of adsorbate solution, L
Veff The effluent volume, mL
Z The bed depth of the fix-bed column, cm
Y The removal percent of gold ions, %
Greek symbol
The time required for 50% adsorbate breakthrough, min
ε Polanyi potential
∆G0 Free energy changes, kJ/mol
Received : Oct. 14, 2018 ; Accepted :Jan. 28, 2019
REFERENCES
[1] Prasad M.S., Mensah-Biney R., Pizarro R.S., Modern
Trends in Gold Processing—Overview, Miner. Eng.,
4(12):1257-77(1991).
[2] Kondos P.D., Deschênes G., Morrison R.M., Process
Optimization Studies in Gold Cyanidation,
Hydrometallurgy, 39(1-3):235-50(1995).
[3] Lu Y., Song Q., Xu Z., Integrated Technology for
Recovering Au from Waste Memory Module
by Chlorination Process: Selective Leaching, Extraction,
and Distillation, J. Cleaner Production., 161: 30-39
(2017).
[4] McDougall G.J., Hancock R.D., Gold Complexes and
Activated Carbon, Gold Bulletin, 14(4): 138-153
(1981).
[5] Seke MD, Sandenbergh RF, Vegter NM, Effects of the
Textural and Surface Properties of Activated Carbon
on the Adsorption of Gold di-Cyanide, Miner. Eng.,
13(5): 527-540(2000).
[6] Navarro P, Vargas C, Efecto de Las Propiedades
Físicas del Carbón Activado en la Adsorción de Oro
Desde Medio Cianuro, Revista de Metalurgia, 46(3):
227-39(2010).
[7] Ladeira A.C., Figueira M.E., Ciminelli V.S.,
Characterization of Activated Carbons Utilized
in the Gold Industry: Physical and Chemical Properties,
and Kinetic Study, Miner. Eng., 6(6):585-96(1993).
[8] Gupta N., Balomajumder C., Agarwal V.K.,
Adsorption of Cyanide Ion on Pressmud Surface:
A Modeling Approach, Chem. Eng. J., 191: 548-56
(2012).
[9] Soleimani M., Kaghazchi T., Adsorption of Gold Ions
from Industrial Wastewater Using Activated Carbon
Derived from Hard Shell of Apricot Stones
–An Agricultural Waste, Bioresour. Technol., 99(13):
5374-5383 (2008).
[10] Ahmadpour A., Do D.D., The Preparation of Activated
Carbon from Macadamia Nutshell by Chemical
Activation, Carbon, 35(12): 1723-32 (1997).

Iran. J. Chem. Chem. Eng. Salehi E. et al. Vol. 39, No. 3, 2020
228 Research Article
[11] Toles C.A., Marshall W.E., Johns M.M., Granular
Activated Carbons from Nutshells for the Uptake of
Metals and Organic Compounds, Carbon, 35(9):
1407-1414 (1997).
[12] Aygün A., Yenisoy-Karakaş S., Duman I., Production
of Granular Activated Carbon from Fruit Stones and
Nutshells and Evaluation of Their Physical, Chemical
and Adsorption Properties, Micropor. Mesopor.
Mater., 66(2-3): 189-195 (2003).
[13] Soleimani M., Kaghazchi T., Activated Hard Shell of
Apricot Stones: A Promising Adsorbent in Gold
Recovery, Chin. J. Chem. Eng., 16(1):112-118
(2008).
[14] Yalcin M., Arol A.I., Gold Cyanide Adsorption
Characteristics of Activated Carbon of Non-Coconut
Shell Origin, Hydrometallurgy, 63(2):201-206 (2002).
[15] Ramírez-Muñiz K., Song S., Berber-Mendoza S.,
Tong S., Adsorption of the Complex Ion Au (CN)
2-onto Sulfur-Impregnated Activated Carbon in
Aqueous Solutions, J. Colloid Interface Sci., 349(2):
602-606 (2010).
[16] Poinern G.E., Senanayake G., Shah N., Thi-Le X.N.,
Parkinson G.M., Fawcett D., Adsorption of the
Aurocyanide, Au(CN)2-Complex on Granular
Activated Carbons Derived from Macadamia Nut
Shells–A Preliminary Study, Miner. Eng., 24(15):
1694-1702 (2011).
[17] Buah W.K., Williams P.T., Granular Activated Carbons
from Palm Nut Shells for Gold di-Cyanide Adsorption,
Int. J. Miner. Metall. Mater., 20(2):172-9(2013).
[18] Asadi-Kesheh R., Mohtashami S.A., Kaghazchi T.,
Asasian N., Soleimani M., Bagasse-Based
Adsorbents for Gold Recovery from Aqueous
Solutions, Sep. Sci. Technol., 50(2): 223-232 (2015).
[19] Vargas C, Navarro P, “Adsorption of Au(CN)2 Onto
Activated Carbon Impregnated with a Cationic
Surfactant”, 7th International Seminar on
Hydrometallurgy, (2015).
[20] Dolphen R., Sakkayawong N., Thiravetyan P.,
Nakbanpote W., Adsorption of Reactive Red 141
from Wastewater onto Modified Chitin, J. Hazard.
Mater., 145(1-2): 250-255 (2007).
[21] Baral S.S., Das N., Ramulu T.S., Sahoo S.K., Das S.N.,
Chaudhury GR, Removal of Cr (VI) by thermally
Activated Weed Salvinia Cucullata in a Fixed-Bed
Column, J. Hazard. Mater., 161(2-3):1427-35(2009).
[22] Ahmad A.A., Hameed B.H., Fixed-Bed Adsorption of
Reactive Azo Dye onto Granular Activated Carbon
Prepared from Waste, J. Hazard. Mater., 175(1-3):
298-303 (2010).
[23] Yoon Y.H., NELSON J.H., Application of Gas
Adsorption Kinetics I. A Theoretical Model for
Respirator Cartridge Service Life, Am. Ind. Hyg.
Assoc. J., 45(8): 509-516 (1984).
[24] Goel J., Kadirvelu K., Rajagopal C., Garg V.K.,
Removal of Lead (II) by Adsorption Using Treated
Granular Activated Carbon: Batch and Column
Studies, J. Hazard. Mater., 125(1-3): 211-220 (2005).
[25] Aksu Z., Gönen F., Biosorption of Phenol
by Immobilized Activated Sludge in a Continuous
Packed Bed: Prediction of Breakthrough Curves,
Process Biochem., 39(5): 599-613(2004).
[26] Huang C.C., Li H.S., Chen C.H., Effect of Surface
Acidic Oxides of Activated Carbon on Adsorption of
Ammonia, J. Hazard. Mater., 159(2-3):5 23-527 (2008).
[27] Martinez M.L., Torres M.M., Guzman C.A., Maestri D.M.,
Preparation and Characteristics of Activated Carbon
from Olive Stones and Walnut Shells, Ind. Crops.
Prod., 23(1): 23-28 (2006).
[28] Abidin M.A., Jalil A.A., Triwahyono S., Adam S.H.,
Kamarudin N.N., Recovery of Gold (III) from
an Aqueous Solution onto a Durio Zibethinus Husk,
Biochem. Eng. J., 54(2):124-131(2011).
[29] Gurung M., Adhikari B.B., Kawakita H., Ohto K.,
Inoue K., Alam S., Recovery of Au (III) by Using Low
Cost Adsorbent Prepared from Persimmon Tannin
Extract, Chem. Eng. J., 174(2-3): 556-63 (2011).
[30] Lladó J., Lao-Luque C., Ruiz B., Fuente E.,
Solé-Sardans M., Dorado A.D., Role of Activated
Carbon Properties in Atrazine and Paracetamol
Adsorption Equilibrium and Kinetics, Process Saf.
Environ., 95:51-9(2015).
[31] Srihari V., Das A., Comparative Studies on
Adsorptive Removal of Phenol by Three Agro-Based
Carbons: Equilibrium and Isotherm Studies,
Ecotoxic. Environ. Saf., 71(1): 274-283(2008).
[32] Hydari S., Sharififard H., Nabavinia M.,
Reza Parvizi M., A Comparative Investigation on
Removal Performances of Commercial Activated
Carbon, Chitosan Biosorbent and Chitosan/Activated
Carbon Composite for Cadmium, Chem. Eng. J., 193:
276-282 (2012).

Iran. J. Chem. Chem. Eng. Comparison of Adsorption Properties of Activated Carbons ... Vol. 39, No. 3, 2020
Research Article 229
[33] Salehi E., Madaeni S.S., Rajabi L., Derakhshan A.A.,
Daraei S., Vatanpour V., Static and Dynamic
Adsorption of Copper Ions on Chitosan/Polyvinyl
Alcohol Thin Adsorptive Membranes: Combined
Effect of Polyethylene Glycol and Aminated Multi-
Walled Carbon Nanotubes, Chem. Eng. J., 215: 791-
801 (2013).
[34] Wu X.W., Ma H.W., Li J.H., Zhang J., Li Z.H.,
The Synthesis of Mesoporous Aluminosilicate Using
Microcline for Adsorption of Mercury (II), J. Colloid
Interface Sci., 315(2):555-561(2007).
[35] Aydın H., Baysal G., Adsorption of Acid Dyes
in Aqueous Solutions by Shells of Bittim (Pistacia
Khinjuk Stocks), Desalination, 196(1-3): 248-59 (2006).
[36] Bulut Y., Aydın H., A Kinetics and Thermodynamics
Study of Methylene Blue Adsorption on Wheat
Shells, Desalination, 194(1-3):259-67(2006).
[37] Tovar-Gómez R, Moreno-Virgen M.R., Dena-Aguilar J.A.,
Hernández-Montoya V., Bonilla-Petriciolet A.,
Montes-Morán M.A., Modeling of Fixed-Bed
Adsorption of Fluoride on Bone Char Using a Hybrid
Neural Network Approach, Chem. Eng. J., 228:1098-
109(2013).
[38] Chen S., Yue Q., Gao B., Li Q., Xu X., Fu K.,
Adsorption of Hexavalent Chromium from Aqueous
Solution by Modified Corn Stalk: A Fixed-Bed
Column Study, Bioresour. Technol., 113: 114-20
(2012).
[39] Walker G.M., Weatherley L.R., Adsorption of Acid
Dyes on to Granular Activated Carbon in Fixed Beds,
Water Res., 31(8): 2093-2101(1997).
[40] Han R., Zhang J., Zou W., Xiao H., Shi J., Liu H.,
Biosorption of Copper (II) and Lead (II) from
Aqueous Solution by Chaff in a Fixed-Bed Column,
J. Hazard. Mater., 133(1-3): 262-8(2006).
[41] Hernandez-Eudave M.T., Bonilla-Petriciolet A.,
Moreno-Virgen M.R., Rojas-Mayorga C.K., Tovar-
Gomez R, Design Analysis of Fixed-Bed Synergic
Adsorption of Heavy Metals and Acid Blue 25
on Activated Carbon, Desalin. Water Treat., 57(21):
9824-36(2016).
[42] Yahaya N.K., Abustan I., Latiff M.F., Bello O.S.,
Ahmad M.A., Fixed-bed Column Study for Cu (II)
Removal from Aqueous Solutions Using Rice Husk
Based Activated Carbon, Int. J. Eng. Technol., 11(1):
248-252 (2011).
[43] Shahbazi A., Younesi H., Badiei A., Functionalized
SBA-15 Mesoporous Silica by Melamine-Based
Dendrimer Amines for Adsorptive Characteristics of
Pb (II), Cu (II) and Cd (II) Heavy Metal Ions in Batch
and Fixed Bed Column, Chem. Eng. J., 168(2): 505-
518 (2011).
[44] Ho Y.S., McKay G., Sorption of Dye from Aqueous
Solution by Peat, Chem. Eng. J., 70(2): 115-124
(1998).
[45] Goel J., Kadirvelu K., Rajagopal C., Garg V.K.,
Removal of Lead (II) by Adsorption Using Treated
Granular Activated Carbon: Batch and Column
Studies, J. Hazard. Mater., 125(1-3): 211-220 (2005).
[46] Nazari G., Abolghasemi H., Esmaieli M., Pouya E.S.,
Aqueous Phase Adsorption of Cephalexin by Walnut
Shell-Based Activated Carbon: A Fixed-Bed Column
Study, Appl. Surf. Sci., 375:144-153 (2016).