Embed Size (px)
Citation preview
© The author; licensee Universidad Nacional de Colombia. Revista DYNA, 86(209), pp. 25-29, April - June, 2019, ISSN 0012-7353
DOI: http://doi.org/10.15446/dyna.v86n209.73970
Comparison of alumina ball size distribution in two white cement grinding units using Swebrec function•
Ismael Eduardo Rivera-Madrid a, Marlon Rincón-Fulla a, b, Adriana Osorio-Correa c, Lina Chica-Osorio d,
Oswaldo Bustamante-Rúa e & Juan María Menéndez-Aguado f
a Institución Universitaria Pascual Bravo, Medellín, Colombia. [email protected], [email protected] b Escuela de física. Universidad Nacional de Colombia, sede Medellín, Colombia [email protected]
c Grupo Procesos Fisicoquímicos Aplicados, Facultad de Ingeniería, Universidad de Antioquia, Medellín, Colombia. [email protected] d Grupo GICI. Facultad de Ingenierías, Universidad de Medellín, Medellín, Colombia. [email protected]
e CIMEX. Facultad de Minas. Universidad Nacional de Colombia, sede Medellín, Colombia. [email protected] f Escuela Politécnica de Mieres, Universidad de Oviedo, Oviedo, Spain. [email protected]
Received: August 2nd, 2018. Received in revised form: January 28th, 2019. Accepted: February 21th, 2019.
Abstract The results of characterizing the alumina ball size distribution in two mills of a crushing and grinding plant are shown. The mills were unloaded and the ball charge was screened in order to establish the ball size distribution. For both mills, the balls retained during the unloading were compared to the balls retained at the beginning of the process, and additionally, they were compared to the results obtained by the Swebrec adjusted distribution model. In both cases, the experimental data have had a good fit with this model. This practice is important in order to establish the best ball charge at the beginning of the operation and the ball recharge in the steady state. Keywords: ball size distribution; grinding; size distribution model.
Comparación de la distribución de tamaño de bolas de alúmina en dos unidades de molienda de cemento blanco utilizando la función
Swebrec
Resumen El presente artículo, muestra los resultados de la caracterización de la distribución del tamaño de bolas de alúmina en dos unidades de molienda de una planta industrial de cemento blanco. En la descarga de los molinos, las bolas fueron cribadas para establecer su distribución de tamaño. En ambas unidades, se compararon las bolas retenidas en la descarga con las existentes al comienzo del proceso, modelando dicha distribución con la función Swebrec. Los datos experimentales mostraron un buen ajuste con este modelo. Esta práctica es importante para establecer la carga correcta de bolas al comienzo de la operación y la recarga requerida en el estado estacionario. Palabras clave: distribución de tamaño de bola; molienda; modelo de distribución de tamaño.
1. Introduction In the manufacture of cement, the grinding process is
governed by many factors, one of them is the ball size distribution, in effect, not hitting a good distribution of ball size, could affect not only the output but also the product quality and energy consumption [1]. In addition, one of the
How to cite: Rivera-Madrid, I.E, Rincón-Fulla, M, Osorio-Correa, A, Chica-Osorio, L, Bustamante-Rúa, O. and Menéndez-Aguado, J. M. Comparison of alumina ball size distribution in two white cement grinding units using Swebrec function.. DYNA, 86(209), pp.25-29, April - June, 2019.
ways to decrease the energy consumption in the mills is to make the mill reach the steady state in a shorter period of time and it has been proven that the size of the ball is one of the most critical parameters that influences this stage of the grinding process [2].
In general, the ball size distribution (BSD) is unknown, since its measurement leads to the difficult task of unloading
Rivera-Madrid et al / Revista DYNA, 86(209), pp.25-29, April - June, 2019.
26
the mill and classifying the balls into different sizes. The measurement of the load of the mill on a laboratory
scale can be done by means of a weighing platform. Industrial-scale circuits demand more sophisticated measurement techniques [3]. Most of the solutions to this problem are very expensive, so the possibility of screening the grinding bodies more than once is not feasible. For this purpose, the study of the make-up ball charge and the wear processes is necessary to derive population balance models, as obtained by Menacho and Concha [4,5]; Concha et al. [6], and Herbst and Fuerstenau [7]. Recently, [8] used a simulation that combined the milling circuits and the BSD to determine the best make-up ball charge applicable to a platinum-bearing ore. Studies performed by Austin et al. [9] have been focused on the grinding performance through the very well-known selection function, which also has been used by Katubilwa and Moys [10] and Bwalya et al. [11] to obtain the BSD in coal mills. In addition, modeling works for ceramic balls in tumbling mills were addressed by [12] and [13], respectively.
Furthermore, some research work has been conducted where alumina powder is ground by using different ball size distributions. For instance, [14] performed a phenomenological study in which he compared unimodal and bimodal ball size distributions to a mixture of alumina powder and zirconia. Findings in his research better results with the bimodal size distribution ball. Additionally, [15] examined the efficiency of a laboratory mill where alumina powder was milled by zirconia beads in an aqueous medium and found that for a specific mill’s rotation speed there is an optimal size ball that minimizes the alumina particle size.
There are several mathematical models applied to the particle size distribution. Djamarani and Clark characterized the particle size through fine and coarse fractions using a Rosin-Rammler (RR) distribution function [16]. García et al. successfully applied the Rosin-Rammler [17] and Gates-Gaudin-Schumann (GGS) [18,19] models to the agglomerated cork with excellent results and stated that these models could be implemented for other kinds of materials [20]. In the present study, the BSD for two mills of a white cement crushing and the grinding plant was characterized using the Swebrec model. This model, in the beginning, was proposed to exclusively describe the particle size distribution of blasting products, and in some cases primary crushing operations, with a good fitting in the full-size range [21,22]. However, Osorio et al. used this model to describe PSD in fine grinding processes [23] and Menendez-Aguado et al. use for the fitting of surface detrital sediment [24].
2. BSD mathematical model and results
Considering that cumulative passing function F(x) can be
expressed as:
𝐹𝐹(𝑥𝑥) =1
1 + 𝑓𝑓(𝑥𝑥) (1)
Taking into consideration that f(xmax) = 0 and f(x50) =1,
the function is fixed at xmax and x50. Finally, f(x) is:
𝑓𝑓(𝑥𝑥) = �𝑙𝑙𝑙𝑙 �𝑥𝑥𝑚𝑚𝑚𝑚𝑚𝑚
𝑥𝑥 �
𝑙𝑙𝑙𝑙 �𝑥𝑥𝑚𝑚𝑚𝑚𝑚𝑚𝑥𝑥50
��
𝑏𝑏
(2)
As a consequence, the Swebrec distribution function can
be described:
𝐹𝐹(𝑥𝑥) =1
1 + �𝑙𝑙𝑙𝑙 �𝑥𝑥𝑚𝑚𝑚𝑚𝑚𝑚
𝑥𝑥 �
𝑙𝑙𝑙𝑙 �𝑥𝑥𝑚𝑚𝑚𝑚𝑚𝑚𝑥𝑥50
��
𝑏𝑏 (3)
Where F(x) is cumulative passing at x size; xmax is
maximum size; x50 size passing 50% weight and b the curve waving parameter. 3. Experimental procedure and initial condition
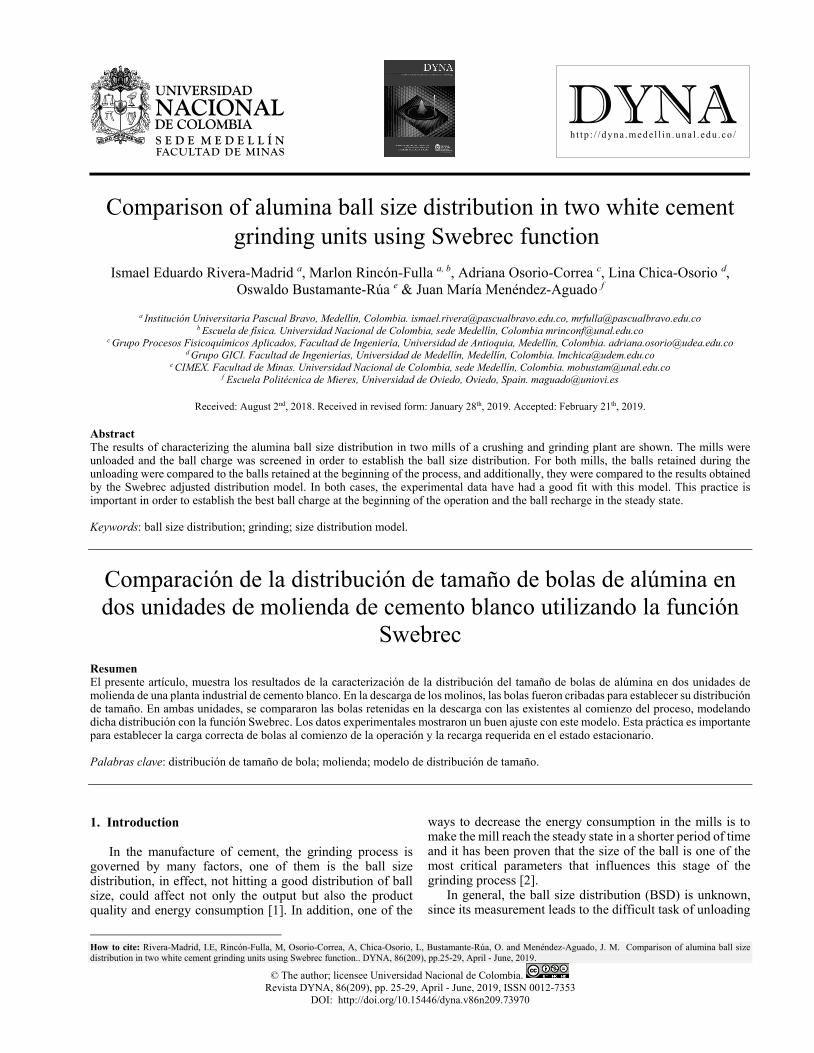
During the mill’s maintenance stop of a crushing and grinding plant, the ball bed for two mills was unloaded with its 25 tons for unit 1 and 39 tons for unit 2 of alumina balls. The mill’s inner diameter D (usable diameter) is 242 cm and the mill’s inner length (usable length) is 650 cm. Fig. 1 shows an interior view of the mill employed in this study.
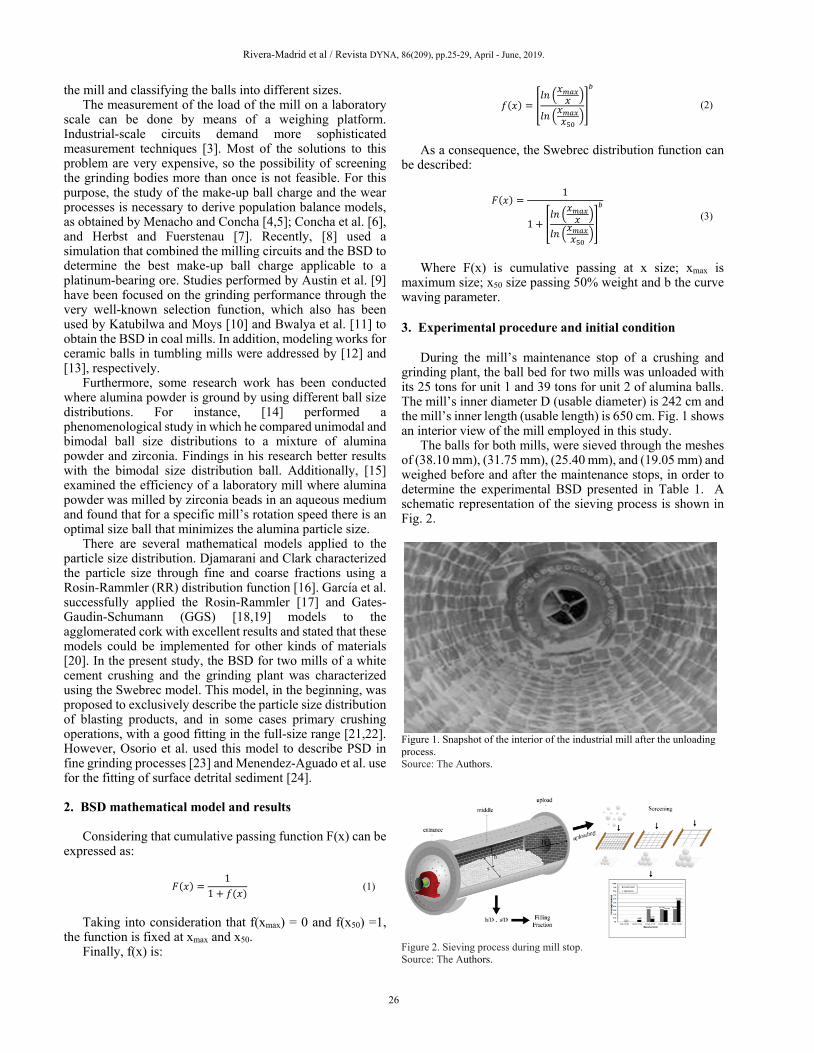
The balls for both mills, were sieved through the meshes of (38.10 mm), (31.75 mm), (25.40 mm), and (19.05 mm) and weighed before and after the maintenance stops, in order to determine the experimental BSD presented in Table 1. A schematic representation of the sieving process is shown in Fig. 2.
Figure 1. Snapshot of the interior of the industrial mill after the unloading process. Source: The Authors.
Figure 2. Sieving process during mill stop. Source: The Authors.
Rivera-Madrid et al / Revista DYNA, 86(209), pp.25-29, April - June, 2019.
27
a)
b)
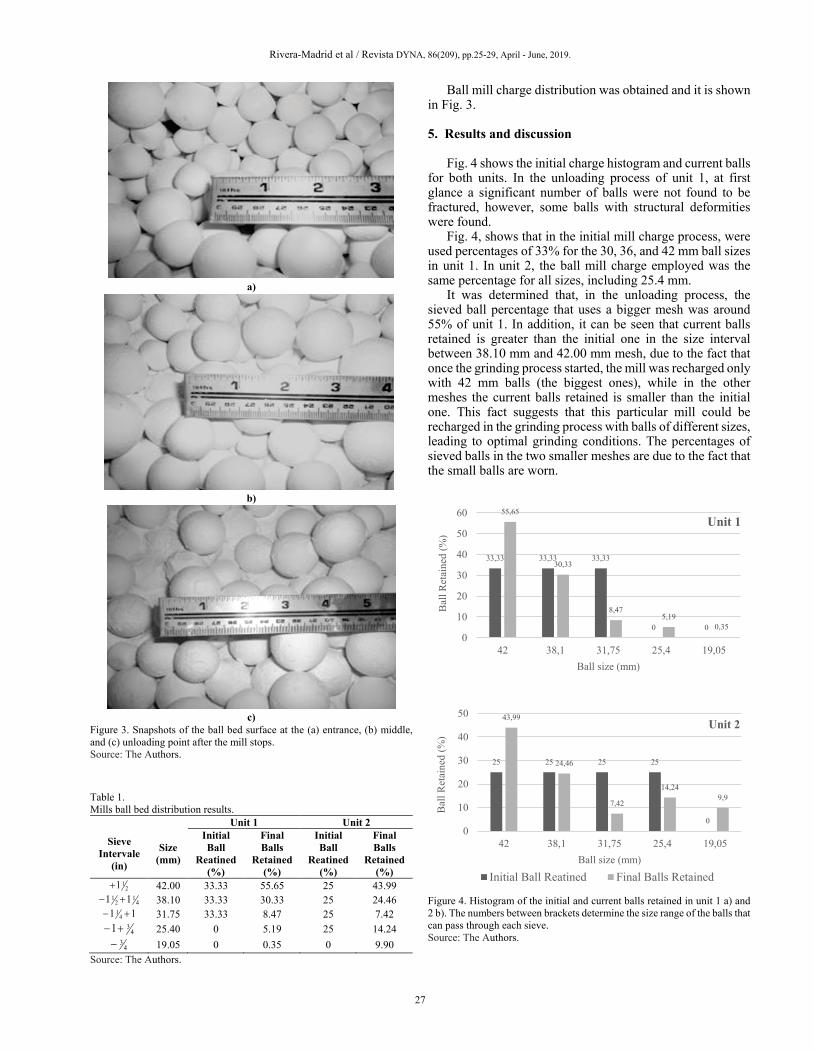
c) Figure 3. Snapshots of the ball bed surface at the (a) entrance, (b) middle, and (c) unloading point after the mill stops. Source: The Authors.
Table 1. Mills ball bed distribution results.
Unit 1 Unit 2
Sieve Intervale
(in)
Size (mm)
Initial Ball
Reatined (%)
Final Balls
Retained (%)
Initial Ball
Reatined (%)
Final Balls
Retained (%)
211+ 42.00 33.33 55.65 25 43.99
41
21 11 +− 38.10 33.33 30.33 25 24.46
11 41 +− 31.75 33.33 8.47 25 7.42
431+− 25.40 0 5.19 25 14.24
43− 19.05 0 0.35 0 9.90
Source: The Authors.
Ball mill charge distribution was obtained and it is shown in Fig. 3.
5. Results and discussion
Fig. 4 shows the initial charge histogram and current balls
for both units. In the unloading process of unit 1, at first glance a significant number of balls were not found to be fractured, however, some balls with structural deformities were found.
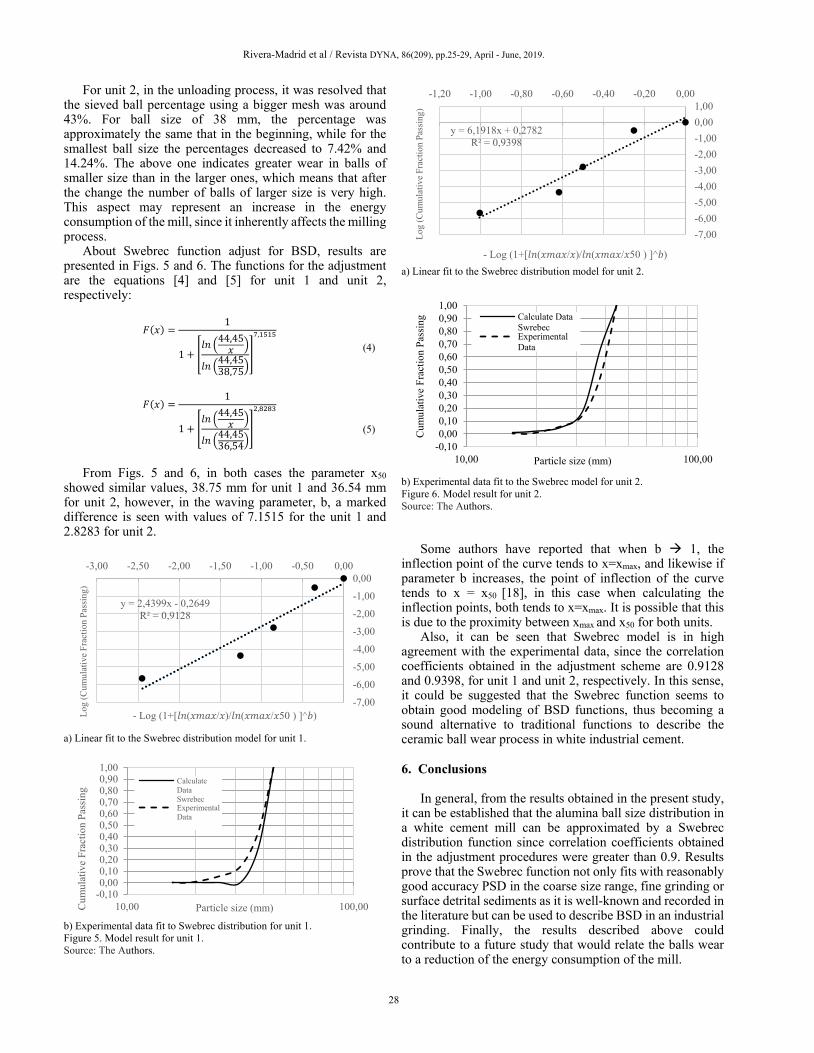
Fig. 4, shows that in the initial mill charge process, were used percentages of 33% for the 30, 36, and 42 mm ball sizes in unit 1. In unit 2, the ball mill charge employed was the same percentage for all sizes, including 25.4 mm.
It was determined that, in the unloading process, the sieved ball percentage that uses a bigger mesh was around 55% of unit 1. In addition, it can be seen that current balls retained is greater than the initial one in the size interval between 38.10 mm and 42.00 mm mesh, due to the fact that once the grinding process started, the mill was recharged only with 42 mm balls (the biggest ones), while in the other meshes the current balls retained is smaller than the initial one. This fact suggests that this particular mill could be recharged in the grinding process with balls of different sizes, leading to optimal grinding conditions. The percentages of sieved balls in the two smaller meshes are due to the fact that the small balls are worn.
Figure 4. Histogram of the initial and current balls retained in unit 1 a) and 2 b). The numbers between brackets determine the size range of the balls that can pass through each sieve. Source: The Authors.
33,33 33,33 33,33
0 0
55,65
30,33
8,475,19
0,350
10
20
30
40
50
60
42 38,1 31,75 25,4 19,05
Bal
l Ret
aine
d (%
)
Ball size (mm)
Unit 1
25 25 25 25
0
43,99
24,46
7,42
14,249,9
0
10
20
30
40
50
42 38,1 31,75 25,4 19,05
Bal
l Ret
aine
d (%
)
Ball size (mm)
Unit 2
Initial Ball Reatined Final Balls Retained
Rivera-Madrid et al / Revista DYNA, 86(209), pp.25-29, April - June, 2019.
28
For unit 2, in the unloading process, it was resolved that the sieved ball percentage using a bigger mesh was around 43%. For ball size of 38 mm, the percentage was approximately the same that in the beginning, while for the smallest ball size the percentages decreased to 7.42% and 14.24%. The above one indicates greater wear in balls of smaller size than in the larger ones, which means that after the change the number of balls of larger size is very high. This aspect may represent an increase in the energy consumption of the mill, since it inherently affects the milling process.
About Swebrec function adjust for BSD, results are presented in Figs. 5 and 6. The functions for the adjustment are the equations [4] and [5] for unit 1 and unit 2, respectively:
𝐹𝐹(𝑥𝑥) =
1
1 + �𝑙𝑙𝑙𝑙 �44,45
𝑥𝑥 �
𝑙𝑙𝑙𝑙 �44,4538,75�
�
7,1515 (4)
𝐹𝐹(𝑥𝑥) =
1
1 + �𝑙𝑙𝑙𝑙 �44,45
𝑥𝑥 �
𝑙𝑙𝑙𝑙 �44,4536,54�
�
2,8283
(5)
From Figs. 5 and 6, in both cases the parameter x50 showed similar values, 38.75 mm for unit 1 and 36.54 mm for unit 2, however, in the waving parameter, b, a marked difference is seen with values of 7.1515 for the unit 1 and 2.8283 for unit 2.
a) Linear fit to the Swebrec distribution model for unit 1.
b) Experimental data fit to Swebrec distribution for unit 1. Figure 5. Model result for unit 1. Source: The Authors.
a) Linear fit to the Swebrec distribution model for unit 2.
b) Experimental data fit to the Swebrec model for unit 2. Figure 6. Model result for unit 2. Source: The Authors.
Some authors have reported that when b 1, the
inflection point of the curve tends to x=xmax, and likewise if parameter b increases, the point of inflection of the curve tends to x = x50 [18], in this case when calculating the inflection points, both tends to x=xmax. It is possible that this is due to the proximity between xmax and x50 for both units.
Also, it can be seen that Swebrec model is in high agreement with the experimental data, since the correlation coefficients obtained in the adjustment scheme are 0.9128 and 0.9398, for unit 1 and unit 2, respectively. In this sense, it could be suggested that the Swebrec function seems to obtain good modeling of BSD functions, thus becoming a sound alternative to traditional functions to describe the ceramic ball wear process in white industrial cement.
6. Conclusions
In general, from the results obtained in the present study,
it can be established that the alumina ball size distribution in a white cement mill can be approximated by a Swebrec distribution function since correlation coefficients obtained in the adjustment procedures were greater than 0.9. Results prove that the Swebrec function not only fits with reasonably good accuracy PSD in the coarse size range, fine grinding or surface detrital sediments as it is well-known and recorded in the literature but can be used to describe BSD in an industrial grinding. Finally, the results described above could contribute to a future study that would relate the balls wear to a reduction of the energy consumption of the mill.
y = 2,4399x - 0,2649R² = 0,9128
-7,00
-6,00
-5,00
-4,00
-3,00
-2,00
-1,00
0,00-3,00 -2,50 -2,00 -1,50 -1,00 -0,50 0,00
Log
(Cum
ulat
ive
Frac
tion
Pass
ing)
- Log (1+[𝑙𝑙𝑙𝑙(𝑥𝑥𝑚𝑚𝑎𝑎𝑥𝑥/𝑥𝑥)/𝑙𝑙𝑙𝑙(𝑥𝑥𝑚𝑚𝑎𝑎𝑥𝑥/𝑥𝑥50 ) ]^𝑏𝑏)
-0,100,000,100,200,300,400,500,600,700,800,901,00
10,00 100,00Cum
ulat
ive
Frac
tion
Pass
ing
Particle size (mm)
CalculateDataSwrebecExperimentalData
y = 6,1918x + 0,2782R² = 0,9398
-7,00-6,00-5,00-4,00-3,00-2,00-1,000,001,00
-1,20 -1,00 -0,80 -0,60 -0,40 -0,20 0,00
Log
(Cum
ulat
ive
Frac
tion
Pass
ing)
- Log (1+[𝑙𝑙𝑙𝑙(𝑥𝑥𝑚𝑚𝑎𝑎𝑥𝑥/𝑥𝑥)/𝑙𝑙𝑙𝑙(𝑥𝑥𝑚𝑚𝑎𝑎𝑥𝑥/𝑥𝑥50 ) ]^𝑏𝑏)
-0,100,000,100,200,300,400,500,600,700,800,901,00
10,00 100,00
Cum
ulat
ive
Frac
tion
Pass
ing
Particle size (mm)
Calculate DataSwrebecExperimentalData
Rivera-Madrid et al / Revista DYNA, 86(209), pp.25-29, April - June, 2019.
29
References
[1] Zhang, J., Bai, Y., Dong, H., Wu, Q. and Ye, X., Influence of ball size distribution on grinding effect in horizontal planetary ball mill. Advanced Powder Technology, 25(3), pp. 983-990, 2014. DOI: 10.1016/j.apt.2014.01.018
[2] Razavi-Tousi, S.S. and Szpunar, J.A., Effect of ball size on steady state of aluminum powder and efficiency of impacts during milling. Powder Technology, 284, pp. 149-158, 2015. DOI: 10.1016/j.powtec.2015.06.035
[3] Kolacz, J., Measurement system of the mill charge in grinding ball mill circuits. Minerals Engineering, 10(12), pp 1329-1338, 1997. DOI: 10.1016/S0892-6875(97)00124-6
[4] Menacho, J.M. and Concha, F., Mathematical model of ball wear in grinding mills II. General solution, Powder Technology, 52(3), pp. 267-277, 1987. DOI: 10.1016/0032-5910(87)80116-X
[5] Menacho, J.M. and Concha, F., Mathematical model of ball wear in grinding mills I. Zero order wear rate. Powder Technology, 47(1), pp. 87-96, 1986. DOI: 10.1016/0032-5910(86)80013-4
[6] Concha, F., Magne, L. and Austin, L.G., Optimization of the make-up ball charge in a grinding mill. International Journal of Minerals Processing, 34(3), pp. 231-241, 1992. DOI: 10.1016/0301-7516(92)90076-9
[7] Herbst, J.A. and Fuerstenau, D.W., Scale-up procedures for continuous grinding mill design using population balance models. International Journal of Minerals Processing, 7(1), pp. 1-31, 1981. DOI: 10.1016/0301-7516(80)90034-4
[8] Chimwani, N., Mulenga, F.K. and Hildebrandt, D., Ball size distribution for the maximum production of a narrowly-sized mill product. Powder Technology, 284, pp. 12-18, 2015. DOI: 10.1016/j.powtec.2015.06.037
[9] Austin, L.G., Klimpe, R.R. and Luckie, P., Process engineering of size reduction: ball milling. New York: SME/AIME, 1984.
[10] Katubilwa, F.M. and Moys, M.H., Effect of ball size distribution on milling rate. Minerals Engineering, 22(15), pp. 1283-1288, 2009. DOI: 10.1016/j.mineng.2009.07.008
[11] Bwalya, M., Moys, M.H., Finnie, G.J. and Mulenga, F.K., Exploring ball size distribution in coal grinding mills. Powder Technology, 257, pp. 68-73, 2014. DOI: 10.1016/j.powtec.2014.02.044
[12] Yildirim, K., Cho, H. and Austin L.G., The modeling of dry grinding of quartz in tumbling media mills. Powder Technology, 105(1-3), pp. 210-221, 1999. DOI: 10.1016/S0032-5910(99)00140-0
[13] Rivera, I.E., Álvarez-Rodríguez, B., Bustamante, O., Restrepo-Baena, O.J. and Menéndez-Aguado, J.M., Ceramic ball wear prediction in tumbling mills as a grinding media selection tool. Powder Technology, 268, pp. 373-376, 2014. DOI: 10.1016/j.powtec.2014.08.056
[14] Fruhstorfer, J., Schafföner, S. and Aneziris, C.G., Dry ball mixing and deagglomeration of alumina and zirconia composite fine powders using a bimodal ball size distribution. Ceramics International, 40(9 Part B), pp. 15293-15302, 2014. DOI: 10.1016/j.ceramint.2014.07.027
[15] Shin, H., Lee, S., Jung, H.S. and Kim, J-B., Effect of ball size and powder loading on the milling efficiency of a laboratory-scale wet ball mill. Ceramics International, 39(8), pp. 8963-8968, 2013. DOI: 10.1016/j.ceramint.2013.04.093
[16] Djamarani, K.M. and Clark, I.M., Characterization of particle size based on fine and coarse fractions. Powder Technology, 93(2), pp. 101-108, 1997. DOI: 10.1016/S0032-5910(97)03233-6
[17] Rosin, P. and Rammler, E.. The laws governing the fineness of powdered coal. J. Inst. Fuel, 7, pp. 29-36, 1933.
[18] Gates, A.O., Kick vs. Rittinger: an experimental investigation in rock crushing performed at Purdue University. Trans AIME, 52, pp. 875- 909, 1915.
[19] Schumann, J., Principles of comminution I: size distribution and surface calculations. Trans. AIME, Tech. Publ. 1189, 1940.
[20] Macías-García A., Cuerda-Correa, E.M, and Díaz-Díez, M.A. Application of the Rosin-Rammler and Gates-Gaudin-Schumann models to the particle size distribution analysis of agglomerated cork. Materials Characterization, 52(2), pp. 159- 164, 2004. DOI: 10.1016/j.matchar.2004.04.007
[21] Ouchterlony, F., The Swebrec function: linking fragmentation by blasting and crushing. Journal Mining Technology. Transactions of the Institutions of Mining and Metallurgy: Section A., 114(1), pp. 29-44, 2005. DOI: 10.1179/037178405X44539
[22] Ouchterlony, F., Olsson, M., Nyberg, U., Andersson, P. and Gustavsson, L., Constructing the fragment size distribution of a bench blasting round, using the new Swebrec function. International Symposium of Rock Fragmentation by Blasting, 2006.
[23] Osorio, A.M., Menéndez-Aguado, J.M., Bustamante, O. and Restrepo, G.M., Fine grinding size distribution analysis using the Swebrec function. Powder Technology, 258, pp. 206-208, 2014. DOI: 10.1016/j.powtec.2014.03.036
[24] Menéndez-Aguado, J.M., Peña-Carpio, E. and Sierra, C., Particle size distribution fitting of surface detrital sediment using the Swebrec function. Journal of Soils and Sediments, 15(9), pp. 2004-2011, 2015. DOI: 10.1007/s11368-017-1689-1.
I.E. Rivera-Madrid, is full time professor at Institución Universitaria Pascual Bravo. PhD. in Engineering, mention in Materials Science and Technology, in 2014, of Universidad Nacional de Colombia. BSc. in Mathematics. ORCID: 0000-0003-0184-4697 M. Rincón-Fulla, is full time professor at Institución Universitaria Pascual Bravo. PhD. in Sciences-Physics, in 2017 of Universidad Nacional de Colombia. BSc. in Physics Engineering. ORCID: 0000-0002-7972-3636 A.M. Osorio-Correa, is full time profesor at Universidad de Antioquia. PhD. in Engineering, in 2014 of Universidad de Antioquia. BSc. Chemical Engineering. PFA. ORCID: 0000-0002-6413-9023 L.M. Chica-Osorio, is full time professor at Universidad de Medellín, PhD. in Engineering, mention in Materials Science and Technology, in 2014 of Universidad Nacional de Colombia. BSc. in Mining and Metallurgy Engineering in 2007. GICI. ORCID: 0000-0001-8873-5017 M.O. Bustamante-Rúa, is titular profesor at Universidad Nacional de Colombia, Sede Medellín. PhD. in Engineering Sciences with a Mention Extractive Metallurgy - Mining of the Universidad de Concepción - Chile, in 2002. BSc. in Mining and Metallurgy Engineering. CIMEX. ORCID: 0000-0002 -1692 -991X J.M. Menéndez-Aguado, is titular professor at Universidad de Oviedo, Spain. DSc. in Mining Engineering Universidad de Oviedo, España. ORCID: 0000-0002-6216-6984