Embed Size (px)
Citation preview
De Bilt, 2014 | Technical report; TR-347
Comparison of automatic and manual precipitation networks in the Netherlands
Theo Brandsma


Comparison of automatic and manual precipitation networks in the Netherlands
Date October 2014 Status Final


Comparison of automatic and manual precipitation networks in the Netherlands| October 2014
Pagina 5 van 42
Colofon
Titel Comparison of automatic and manual precipitation networks in the Netherlands
Auteurs Theo Brandsma ([email protected])


Comparison of automatic and manual precipitation networks in the Netherlands| October 2014
Pagina 7 van 42
Table of contents
Foreword—9
1 Introduction—10 1.1 Problem description—10 1.2 Scope and objectives—10
2 Data and methods—12 2.1 Data—12 2.1.1 Automatic Network—12 2.1.2 Manual Network—12 2.2 Methodology—16 2.2.1 Selection of period and station pairs—16 2.2.2 Calculation of derived variables—17
3 Results—19 3.1 Annual mean precipitation differences—19 3.2 Seasonal mean precipitation differences—22 3.3 Differences in number of wetdays—23 3.4 Probability distribution of daily amounts—24 3.5 Effect of weather variables on precipitation differences—27 3.5.1 Temperature—27 3.5.2 Precipitation intensity—28 3.5.3 Wind speed—28 3.5.4 Combined effects—30 3.6 Effect of rounding errors—30
4 Discussion—34
5 Summary, conclusions and recommendations—37
References—40
Appendix A. Station and instrument relocations—41


Comparison of automatic and manual precipitation networks in the Netherlands| October 2014
Pagina 9 van 42
Foreword
KNMI operates two networks for in-situ precipitation measurements in the Netherlands. The first is an automatic network (AN) of 32 stations, where precipitation is measured continuously with automatic rain gauges. This network almost coincides with the network of automatic weather stations (AWS). The second is a dense manual network (MN) of about 325 stations, where voluntary observers measure 24-hour precipitation sums once per day at 0800 UTC. The AN has a high temporal resolution (currently 1-min). This is important for the study of short-duration extremes, nowcasting and, increasingly, for real-time radar calibration. The MN has a long continuity of instruments and methods and is important for climate monitoring and hydrological research and applications. Today there is a growing need to expand AN, mainly to improve real time radar calibration for hydrological purposes. On the other hand, there is a need to continue MN for climate monitoring purposes. To obtain an optimal combination of AN and MN it is important to compare both networks and to understand differences in precipitation measurements obtained with both networks. This report describes this comparison and may serve as background information for the design of the precipitation networks in the Netherlands and elsewhere.

Comparison of automatic and manual precipitation networks in the Netherlands| October 2014
Pagina 10 van 42
1 Introduction
1.1 Problem description Like many other meteorological institutes in the world, KNMI operates two precipitation networks side by side: an automatic network (AN) and a manual network (MN). Traditionally, MNs have been used as reference networks providing daily precipitation sums, while ANs have been used to obtain precipitation intensity with high temporal resolution. Following former WMO recommendations, KNMI corrected the AN precipitation such that their 0800-0800 UTC precipitation sums (on an hourly basis) agreed with the 0800 UTC measurement of the manual rain gauges positioned next to the automatic gauge1. In 1981 this practice was abandoned, because there was an increase in the number of automatic rain gauges and these gauges were at positions (e.g. airfields) where manual observations were not feasible. It is well known that precipitation measurements are affected by losses (WMO, 1984) resulting in undercatch. The most important loss results from wind induced errors. These may amount to about 10% for rainfall and 50% for snow. Other losses are e.g. due to wetting2 of internal walls of the collector and the container when it is emptied and due to evaporation3. For automatic raingauges additional losses may occur due to e.g. the operation of a heating element at low temperatures. It is estimated that MN in the Netherlands measures on average about 5% too little precipitation (wind and wetting error), which equals about 50 mm/year (Braak, 1945; Warmerdam, 1981). It is further observed that AN measures about 5% less precipitation than MN (Overeem, 2009) resulting in a total undercatch of about 10%. WMO (2008) states in its requirements an achievable measurement uncertainty for daily precipitation sums of 5% or 0.1 mm (whatever the largest absolute amount). It is clear that AN does not meet this requirement. Internationally, there is a trend to expand ANs and to decrease, or even to dismantle, MNs. Given the large error of ANs, however, the suitability of these networks for climate monitoring purposes may be questioned. Detailed comparisons are therefore needed between MNs and ANs. Although we have a rough indication of the differences between AN and MN for the Netherlands, a detailed comparison is still lacking.
1.2 Scope and objectives The main objective of this study is to quantify and understand the differences in precipitation amounts between AN and MN in the Netherlands. The study is further meant to support (changes in) the design of those networks in the Netherlands and elsewhere and to guide possible instrumental improvements. The comparison is restricted to the 2001-2013 period and MN is used as a reference. Although MN is not an absolute reference, it is used here as such. Inhomogeneities due to e.g. stations relocations are not quantified, they are considered here as an integral part of the uncertainty in the precipitation of the network. 1 Until 1970 the measuring time was 7:40 UTC. 2 The wetting error occurs when precipitation adheres to the inside walls of the gauge and evaporates (or sublimates)
without being recorded. 3 The evaporation error is generally small or negligible for gauges with protected containers, such as those used in
the present study.

Comparison of automatic and manual precipitation networks in the Netherlands| October 2014
Pagina 11 van 42
Chapter 2 describes both networks and defines the methodology. Chapter 3 presents results of the comparison and an exploration of factors that may affect the differences between AN and MN . Chapters 4 and 5 present a discussion, a summary and conclusions and recommendations.

Comparison of automatic and manual precipitation networks in the Netherlands| October 2014
Pagina 12 van 42
2 Data and methods
In this chapter we first describe the two precipitation networks AN and MN. The layout of the networks, the metadata and the instruments are presented. A selection of 31 station pairs is used for the comparison as described in the methods section. Metadata about relocations is presented in Appendix A.
2.1 Data
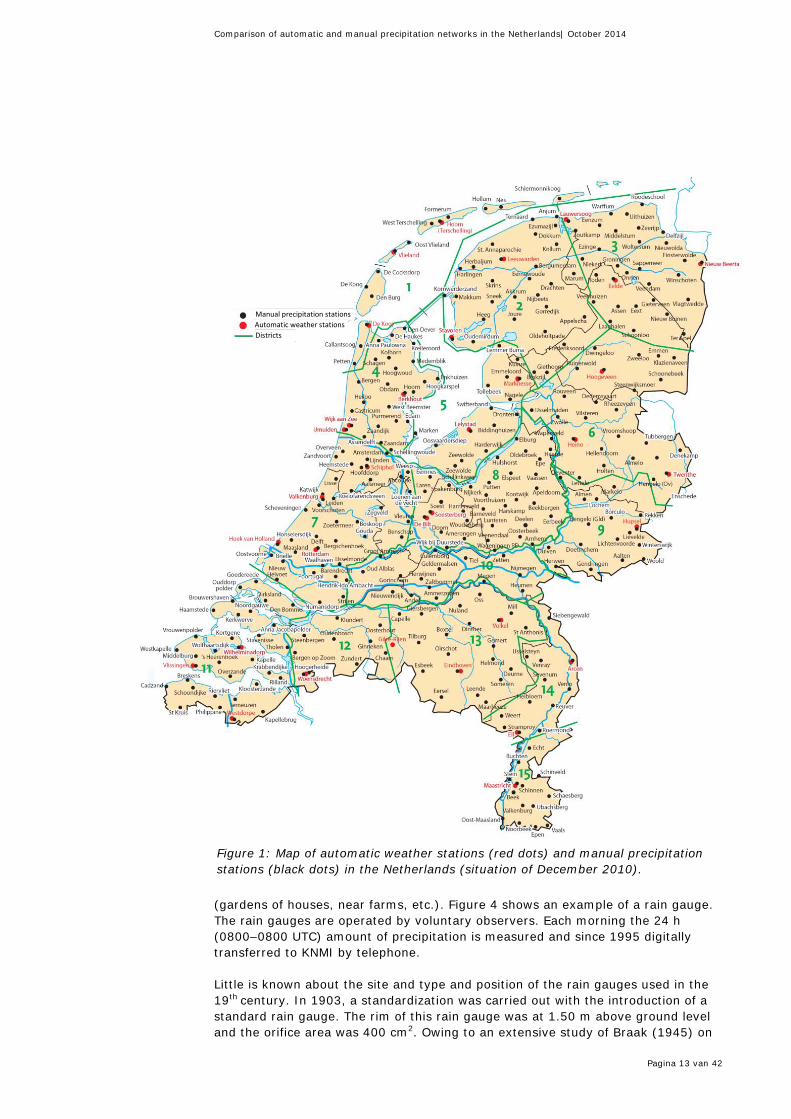
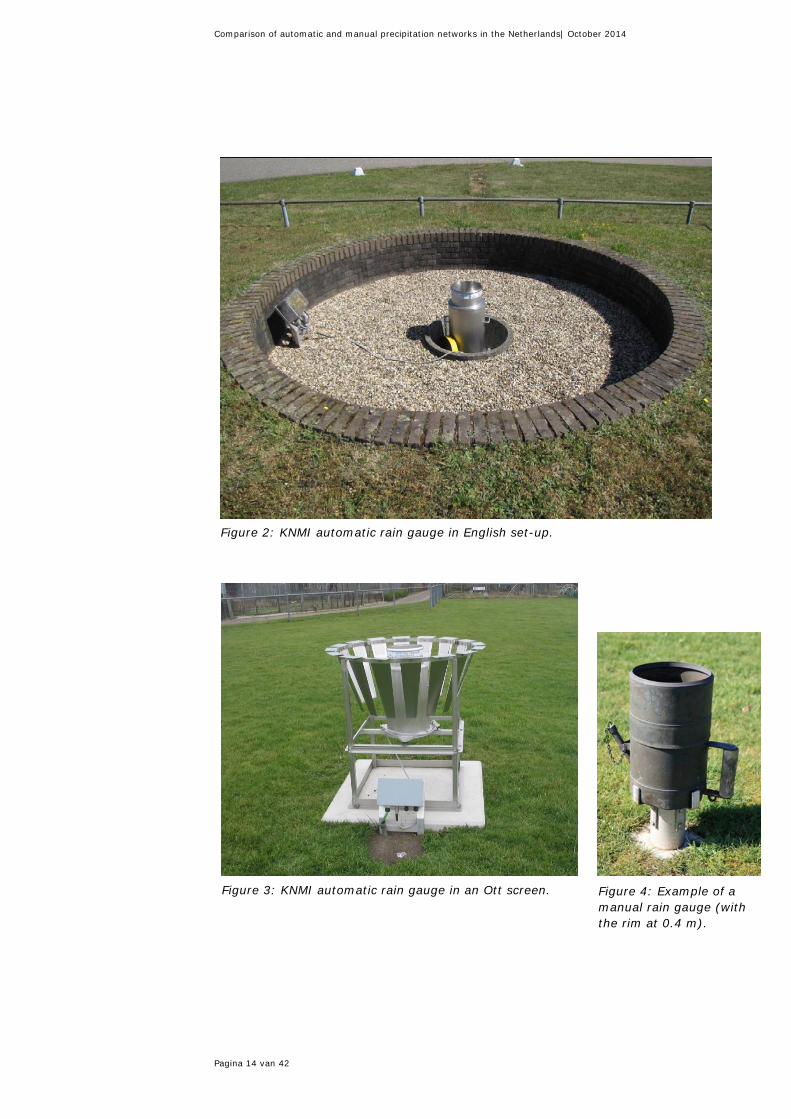
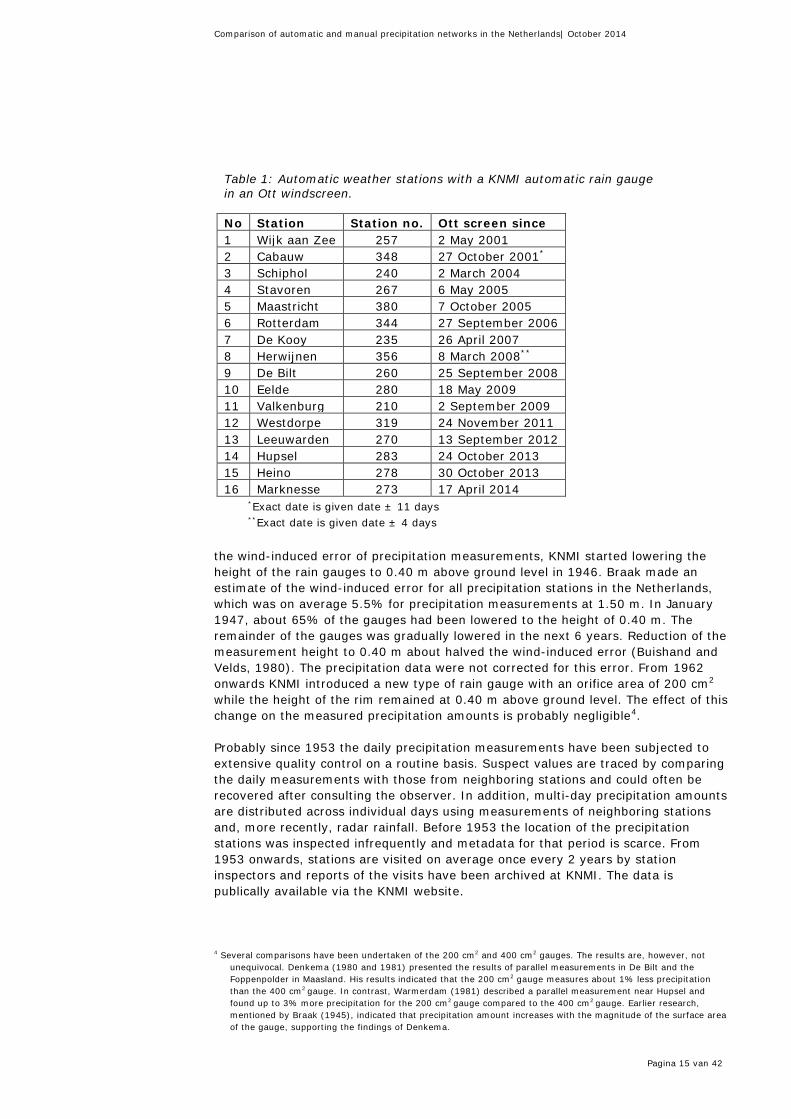
2.1.1 Automatic Network Figure 1 shows the location of the automatic weather stations (AWS) and the manual rainfall stations in the Netherlands. The rain gauges of AN are installed at 32 of the 35 AWS locations in the Netherlands. They are mostly situated in open areas. Precipitation is measured using the so-called KNMI rain gauge (see e.g. Wauben, 2004, for a drawing and details). This electric gauge is of a floating type and measures precipitation with a time resolution of 12 seconds. The funnel and reservoir are heated for temperatures ≤ 4°C in order to melt solid precipitation. The gauge has a calibration interval of 14 months. Currently, precipitation values are archived at 1-min, 10-min and 1-hour time steps. The hourly data is validated by the validation division and is used in this research. The hourly data is publically available via the KNMI website. The majority of the automatic rain gauges are placed in a so-called English setup (see Figure 2). The setup consists of a pit surrounded by a circular wall with a diameter of 3 m and a height of 40 cm. The gauge is placed on a small concrete box with a drainage tube. The pit is filled with gravel in order to avoid vegetation and splashing in of precipitation. The soil around the outer rim gently slopes upward to the brick wall in order to create a horizontal airflow above the orifice of the precipitation gauge. This reduces the errors induced by wind field deformations due to the presence of the sensor itself. The slope and surroundings are covered with grass. The English setup is intended to have no wind-induced loss. A 1-year comparison study of Braak (1945), however, showed a 2.7% annual loss of the English setup (with the largest losses in the winter half-year) with respect to a reference setup with no wind error (comparable to the WMO reference gauge). The study took place in De Voorst, the Netherlands, and was performed with two identical manual gauges measured each morning at 8:00 local time. The English setup is slowly abandoned and today almost half of the rain gauges are now situated in an Ott windscreen (see Figure 3). The Ott screen has a height and diameter of 1 m. For the stations that are currently equipped with an Ott screen, Table 1 presents the introduction dates. The reason for the transition to Ott screens is that the English setup is rather costly to build and requires additional maintenance. At some locations problems occur due to high ground water levels and/or poor drainage. The English setup is also sensitive to debris, since leafs, grass and sand are easily blown into the precipitation gauge and may cause instrument failures. Wauben (2004) compared the English set-up with the set-up using an Ott screen in De Bilt and found an annual mean (extra) loss of the Ott screen, compared to the English set-up, of 1.5%. In the windy season the differences may be up to 6%.
2.1.2 Manual Network The MN is maintained since 1850. The number of rain gauges gradually increased in the period 1850–1950 and an almost constant network size since 1946. Currently there are about 325 rain gauges (see Figure 1 for the station locations) with an average distance of 9.9 km. The gauges are mostly located in sheltered locations
Comparison of automatic and manual precipitation networks in the Netherlands| October 2014
Pagina 13 van 42
(gardens of houses, near farms, etc.). Figure 4 shows an example of a rain gauge. The rain gauges are operated by voluntary observers. Each morning the 24 h (0800–0800 UTC) amount of precipitation is measured and since 1995 digitally transferred to KNMI by telephone. Little is known about the site and type and position of the rain gauges used in the 19th century. In 1903, a standardization was carried out with the introduction of a standard rain gauge. The rim of this rain gauge was at 1.50 m above ground level and the orifice area was 400 cm2. Owing to an extensive study of Braak (1945) on
Figure 1: Map of automatic weather stations (red dots) and manual precipitation stations (black dots) in the Netherlands (situation of December 2010).
Manual precipitation stations Automatic weather stations Districts
Comparison of automatic and manual precipitation networks in the Netherlands| October 2014
Pagina 14 van 42
Figure 2: KNMI automatic rain gauge in English set-up.
Figure 3: KNMI automatic rain gauge in an Ott screen. Figure 4: Example of a manual rain gauge (with the rim at 0.4 m).
Comparison of automatic and manual precipitation networks in the Netherlands| October 2014
Pagina 15 van 42
the wind-induced error of precipitation measurements, KNMI started lowering the height of the rain gauges to 0.40 m above ground level in 1946. Braak made an estimate of the wind-induced error for all precipitation stations in the Netherlands, which was on average 5.5% for precipitation measurements at 1.50 m. In January 1947, about 65% of the gauges had been lowered to the height of 0.40 m. The remainder of the gauges was gradually lowered in the next 6 years. Reduction of the measurement height to 0.40 m about halved the wind-induced error (Buishand and Velds, 1980). The precipitation data were not corrected for this error. From 1962 onwards KNMI introduced a new type of rain gauge with an orifice area of 200 cm2 while the height of the rim remained at 0.40 m above ground level. The effect of this change on the measured precipitation amounts is probably negligible4. Probably since 1953 the daily precipitation measurements have been subjected to extensive quality control on a routine basis. Suspect values are traced by comparing the daily measurements with those from neighboring stations and could often be recovered after consulting the observer. In addition, multi-day precipitation amounts are distributed across individual days using measurements of neighboring stations and, more recently, radar rainfall. Before 1953 the location of the precipitation stations was inspected infrequently and metadata for that period is scarce. From 1953 onwards, stations are visited on average once every 2 years by station inspectors and reports of the visits have been archived at KNMI. The data is publically available via the KNMI website. 4 Several comparisons have been undertaken of the 200 cm2 and 400 cm2 gauges. The results are, however, not
unequivocal. Denkema (1980 and 1981) presented the results of parallel measurements in De Bilt and the Foppenpolder in Maasland. His results indicated that the 200 cm2 gauge measures about 1% less precipitation than the 400 cm2 gauge. In contrast, Warmerdam (1981) described a parallel measurement near Hupsel and found up to 3% more precipitation for the 200 cm2 gauge compared to the 400 cm2 gauge. Earlier research, mentioned by Braak (1945), indicated that precipitation amount increases with the magnitude of the surface area of the gauge, supporting the findings of Denkema.
Table 1: Automatic weather stations with a KNMI automatic rain gauge in an Ott windscreen.
No Station Station no. Ott screen since 1 Wijk aan Zee 257 2 May 2001 2 Cabauw 348 27 October 2001*
3 Schiphol 240 2 March 2004 4 Stavoren 267 6 May 2005 5 Maastricht 380 7 October 2005 6 Rotterdam 344 27 September 2006 7 De Kooy 235 26 April 2007 8 Herwijnen 356 8 March 2008**
9 De Bilt 260 25 September 2008 10 Eelde 280 18 May 2009 11 Valkenburg 210 2 September 2009 12 Westdorpe 319 24 November 2011 13 Leeuwarden 270 13 September 2012 14 Hupsel 283 24 October 2013 15 Heino 278 30 October 2013 16 Marknesse 273 17 April 2014
*Exact date is given date ± 11 days **Exact date is given date ± 4 days

Comparison of automatic and manual precipitation networks in the Netherlands| October 2014
Pagina 16 van 42
2.2 Methodology The precipitation data has been used as it is distributed to the public and used in KNMI products. This means that no corrections have been made e.g. for station relocations and instrumental changes like the gradual change from English setup to the use of the Ott screen for AN.
2.2.1 Selection of period and station pairs We considered the 13-year period 2001-2013. In this period most of the stations have complete data. To compare AN and MN, we selected stations pairs consisting of an AN station and the most nearby MN station. The automatic weather stations IJmuiden, Vlieland and Woensdrecht in Figure 1 have no automatic rain gauge and for Wijk aan Zee the first 4 months are missing. Those four stations are not included in the analysis. Figure 5 shows the locations of the 31 selected AN locations. Table 2 presents the basic metadata of the 31 station pairs including the distance between the stations. Information about relocations is presented in Appendix A. Relocations usually cause a change in environment of the gauge and thus the wind error.
Figure 5: Positions of the 31 automatic rain gauges that have been compared with the most nearby manual rain gauge (see Table 2). The strikethrough stations have no automatic rain gauge or have not enough data.
KNMI automatic weather stations
Comparison of automatic and manual precipitation networks in the Netherlands| October 2014
Pagina 17 van 42
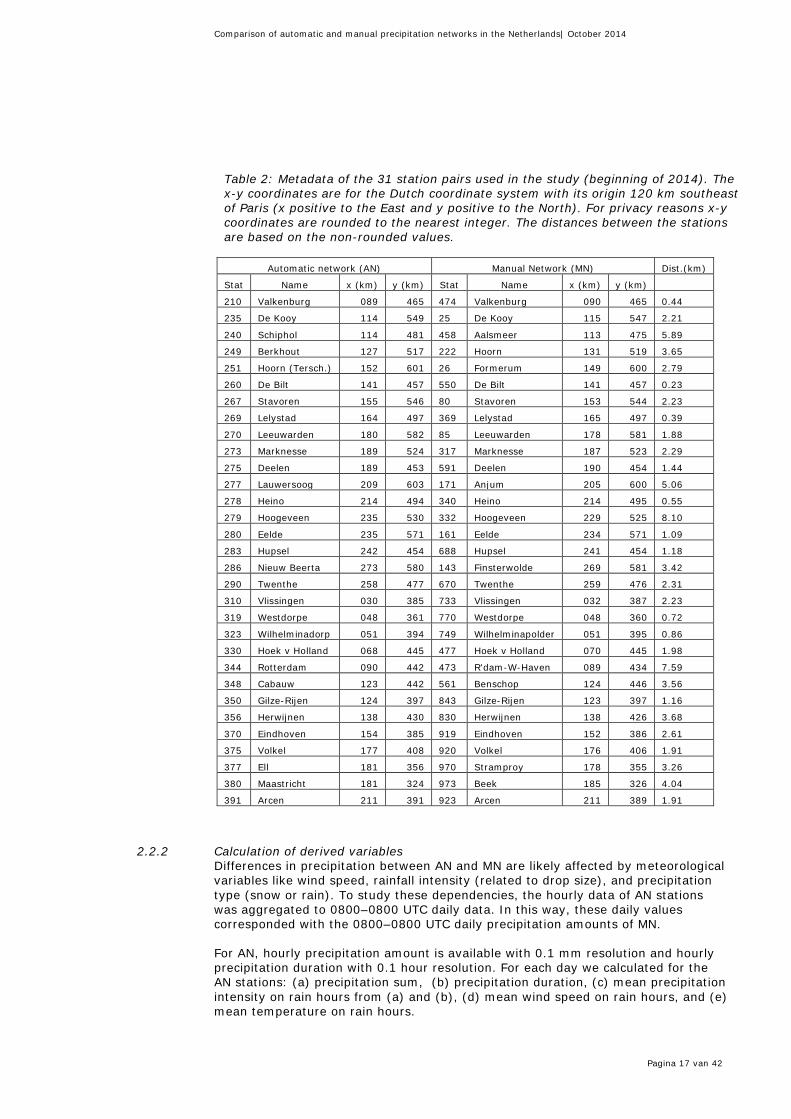
2.2.2 Calculation of derived variables Differences in precipitation between AN and MN are likely affected by meteorological variables like wind speed, rainfall intensity (related to drop size), and precipitation type (snow or rain). To study these dependencies, the hourly data of AN stations was aggregated to 0800–0800 UTC daily data. In this way, these daily values corresponded with the 0800–0800 UTC daily precipitation amounts of MN. For AN, hourly precipitation amount is available with 0.1 mm resolution and hourly precipitation duration with 0.1 hour resolution. For each day we calculated for the AN stations: (a) precipitation sum, (b) precipitation duration, (c) mean precipitation intensity on rain hours from (a) and (b), (d) mean wind speed on rain hours, and (e) mean temperature on rain hours.
Table 2: Metadata of the 31 station pairs used in the study (beginning of 2014). The x-y coordinates are for the Dutch coordinate system with its origin 120 km southeast of Paris (x positive to the East and y positive to the North). For privacy reasons x-y coordinates are rounded to the nearest integer. The distances between the stations are based on the non-rounded values.
Automatic network (AN) Manual Network (MN) Dist.(km)
Stat Name x (km) y (km) Stat Name x (km) y (km)
210 Valkenburg 089 465 474 Valkenburg 090 465 0.44
235 De Kooy 114 549 25 De Kooy 115 547 2.21
240 Schiphol 114 481 458 Aalsmeer 113 475 5.89
249 Berkhout 127 517 222 Hoorn 131 519 3.65
251 Hoorn (Tersch.) 152 601 26 Formerum 149 600 2.79
260 De Bilt 141 457 550 De Bilt 141 457 0.23
267 Stavoren 155 546 80 Stavoren 153 544 2.23
269 Lelystad 164 497 369 Lelystad 165 497 0.39
270 Leeuwarden 180 582 85 Leeuwarden 178 581 1.88
273 Marknesse 189 524 317 Marknesse 187 523 2.29
275 Deelen 189 453 591 Deelen 190 454 1.44
277 Lauwersoog 209 603 171 Anjum 205 600 5.06
278 Heino 214 494 340 Heino 214 495 0.55
279 Hoogeveen 235 530 332 Hoogeveen 229 525 8.10
280 Eelde 235 571 161 Eelde 234 571 1.09
283 Hupsel 242 454 688 Hupsel 241 454 1.18
286 Nieuw Beerta 273 580 143 Finsterwolde 269 581 3.42
290 Twenthe 258 477 670 Twenthe 259 476 2.31
310 Vlissingen 030 385 733 Vlissingen 032 387 2.23
319 Westdorpe 048 361 770 Westdorpe 048 360 0.72
323 Wilhelminadorp 051 394 749 Wilhelminapolder 051 395 0.86
330 Hoek v Holland 068 445 477 Hoek v Holland 070 445 1.98
344 Rotterdam 090 442 473 R'dam-W-Haven 089 434 7.59
348 Cabauw 123 442 561 Benschop 124 446 3.56
350 Gilze-Rijen 124 397 843 Gilze-Rijen 123 397 1.16
356 Herwijnen 138 430 830 Herwijnen 138 426 3.68
370 Eindhoven 154 385 919 Eindhoven 152 386 2.61
375 Volkel 177 408 920 Volkel 176 406 1.91
377 Ell 181 356 970 Stramproy 178 355 3.26
380 Maastricht 181 324 973 Beek 185 326 4.04
391 Arcen 211 391 923 Arcen 211 389 1.91

Comparison of automatic and manual precipitation networks in the Netherlands| October 2014
Pagina 18 van 42
For wind speed the mean hourly values have been used as measured at AN stations (usually at 10 m height). Temperature is measured at 1.5 m. Depending on the situation, precipitation differences between AN and MN may be described by both percentage differences (PD) and absolute differences (AD). PD is defined as:
PD = 100PAN − PMN
PMN
where PAN is the precipitation of the AN and PMN of the MN. AD is defined as:
AD = PAN − PMN The results are presented using MN as a reference.

Comparison of automatic and manual precipitation networks in the Netherlands| October 2014
Pagina 19 van 42
3 Results
In this chapter we first compare the annual and seasonal mean precipitation differences between AN and MN. Second, we discuss the difference in the number of wet days of both networks. Third, the probability distributions of the daily precipitation amounts are compared to study the effect of precipitation amount on the differences between AN and MN. Fourth, we explore the effects of temperature, precipitation intensity and wind speed on the network differences. Finally, the effect of rounding errors is discussed.
3.1 Annual mean precipitation differences Figure 6 shows the time series of the mean annual precipitation amounts of AN and MN. As expected, the mean precipitation amounts for MN are larger than those for AN. For AN the mean annual precipitation for the 2001-2013 period equals 812.8 mm and for MN 868.4 mm. The mean difference is thus 55.5 mm. Figure 7 shows the annual percentage difference (PD) between AN and MN of the precipitation amounts shown in Figure 6. The annual PD varies between -5.0% in 2007 and - 9.2% in 2013. The mean PD equals -6.4%. Testing the series for homogeneity using the Buishand-test5 (Buishand, 1982), shows a statistically significant (5% level) step change of 2% in 2009. In the period 2001-2008 the mean PD equals -5.6% and from 2009-2013 -7.6%.
Figure 6: Mean annual precipitation amounts for the AN and the MN in the period 2001-2013 (average of the amounts of the 31 stations defined in Table 2).
5 The version used here is the so-called cumulative deviations test. It uses the maximum of the absolute values of
the adjusted partial sums.
2001 2002 2003 2004 2005 2006 2007 2008 2009 2010 2011 2012 2013Year
600
700
800
900
1000
Pre
cipi
tatio
n (m
m)
Manual networkAutomatic network

Comparison of automatic and manual precipitation networks in the Netherlands| October 2014
Pagina 20 van 42
Figure 7: Percentage differences between the annual precipitation amounts of the AN and the MN in the 2001-2013 period. The error bars give the 2×SE values.
Figure 8: Percentage differences between the annual precipitation amounts of the AN and the MN in the 2001-2013 period for the individual stations.
The annual PD for all 31 station pairs separately is shown in Figure 8. The figure shows that there are large differences between the pairs. The changes in the individual series cannot easily be linked to stations relocations or the introduction of the Ott screen. There is, however, a weak correlation (r = 0.4) between the
2001 2002 2003 2004 2005 2006 2007 2008 2009 2010 2011 2012 2013Year
-12
-10
-8
-6
-4
-2
0
Perc
enta
ge d
iffer
ence
(%)
2000 2005 2010 2000 2005 2010 2000 2005 2010 2000 2005 2010 2000 2005 2010 2000 2005 2010
Year
-20-10
01020
-20-10
01020
-20-10
01020
-20-10
01020
-20-10
01020
-20-10
01020
Diff
eren
ce (%
)
Valkenburg De Kooy Schiphol Berkhout Hoorn Terschelling De Bilt
Stavoren Lelystad Leeuwarden Marknesse Deelen Lauwersoog
Heino Hoogeveen Eelde Hupsel Nieuw Beerta Twenthe
Vlissingen Westdorpe Wilhelminadorp Hoek van Holland Rotterdam Cabauw
Gilze-Rijen Herwijnen Eindhoven Volkel Ell Maastricht
Arcen

Comparison of automatic and manual precipitation networks in the Netherlands| October 2014
Pagina 21 van 42
Figure 9: Percentage differences between the annual precipitation amounts of the AN and the MN in the 2001-2013 period for (a) the 31 station pairs (as in Figure 7), (b) with all available MN stations, and (c) using only station pairs with English set-up.
interannual variability of PD of each station pair and the distance between the AN station and the corresponding MN station. It is of interest to know the reason for the observed step change in Figure 7. Figure 9 therefore shows two extra curves in addition to the one presented in Figure 7. The orange curve shows PD for the case where the annual mean values for the MN are calculated from all 317 manual stations with complete data. The shape of the curve is similar to the original curve for the 31 stations pairs. The step change in 2009 is still statistically significant and amounts to 1.4% which is slightly smaller than for the 31 stations pairs. Apparently, the step change is not sensitive to the selection of MN stations. The gray curve in Figure 9 shows PD for the case where only the 18 stations are considered that have an English set-up throughout the 2001-2013 period (see Table 1)6. Again the shape of the curve is similar to the original curve for the 31 stations pairs and the step change in 2009 is statistically significant and amounts 1.5%. Obviously, the step change is also not caused by the change of the English set-up to the set-up with an Ott screen. This could somewhat be expected because Table 1 shows that the change of the English set-up to the Ott screen happens gradually and not stepwise. Another reason that could explain the step change is instrumental failure of the automatic rain gauges. It is reported that an increasing number of instruments has problems with the heating device (within the calibration term of 14 months). The
6 For the stations Hupsel and Heino we made an exception because they have less than 3 months of data with an Ott
screen in the period of interest.
2001 2002 2003 2004 2005 2006 2007 2008 2009 2010 2011 2012 2013
Year
-12
-10
-8
-6
-4
-2
0
Perc
enta
ge d
iffer
ence
(%)
AN = 31 & MN = 31 stationsAN = 31 & MN 317 stationsAN = 18 & MN = 18 stations (English set-up)

Comparison of automatic and manual precipitation networks in the Netherlands| October 2014
Pagina 22 van 42
heating device should turn of automatically at temperatures > 4°C but this not always occurs. This results in extra wetting losses. As an alternative to the step change, the trend in the data in Figure 7 can also be explained by a linear trend, where the noise around the fit results from natural variation. In that case, there is a highly significant linear trend of -0.246%/year (t=-4.4). The trend (not shown) gives a change of the annual mean PD between 2001 and 2013 of -4.88 to -7.84%, a change of 3.0%.
3.2 Seasonal mean precipitation differences Figure 10 shows for AN and MN the annual cycle of monthly mean precipitation. The figure shows that there is a strong seasonal variation with the smallest precipitation
Figure 10: Mean monthly precipitation amounts for the AN and the MN in the period 2001-2013 (average of the amounts of the 31 stations defined in Table 2).
Figure 11: Percentage differences between the monthly precipitation amounts of the AN and the MN in the 2001-2013 period. The error bars give the 2×SE values.
Jan Feb Mar Apr May Jun Jul Aug Sep Oct Nov Decmonth
0
20
40
60
80
100
Prec
ipita
tion
(mm
)
Manual networkAutomatic network
Jan Feb Mar Apr May Jun Jul Aug Sep Oct Nov Decmonth
-10
-8
-6
-4
-2
0
Diff
eren
ce (%
)

Comparison of automatic and manual precipitation networks in the Netherlands| October 2014
Pagina 23 van 42
amounts in April (≈ 40 mm) and the largest in July-August (≈ 100 mm). In all months the mean precipitation amounts for MN are larger than those for AN. PD in Figure 11 shows a clear seasonal cycle and ranges between -7.7 in winter (DJF) and -5.0% in summer (JJA). Differences between rain gauges are often seasonally dependent because of e.g. the seasonal dependence of wind speed and precipitation intensity. Here the operation of the heating element in winter may also contribute to the observed seasonal differences. In the remainder of the chapter this will be discussed further.
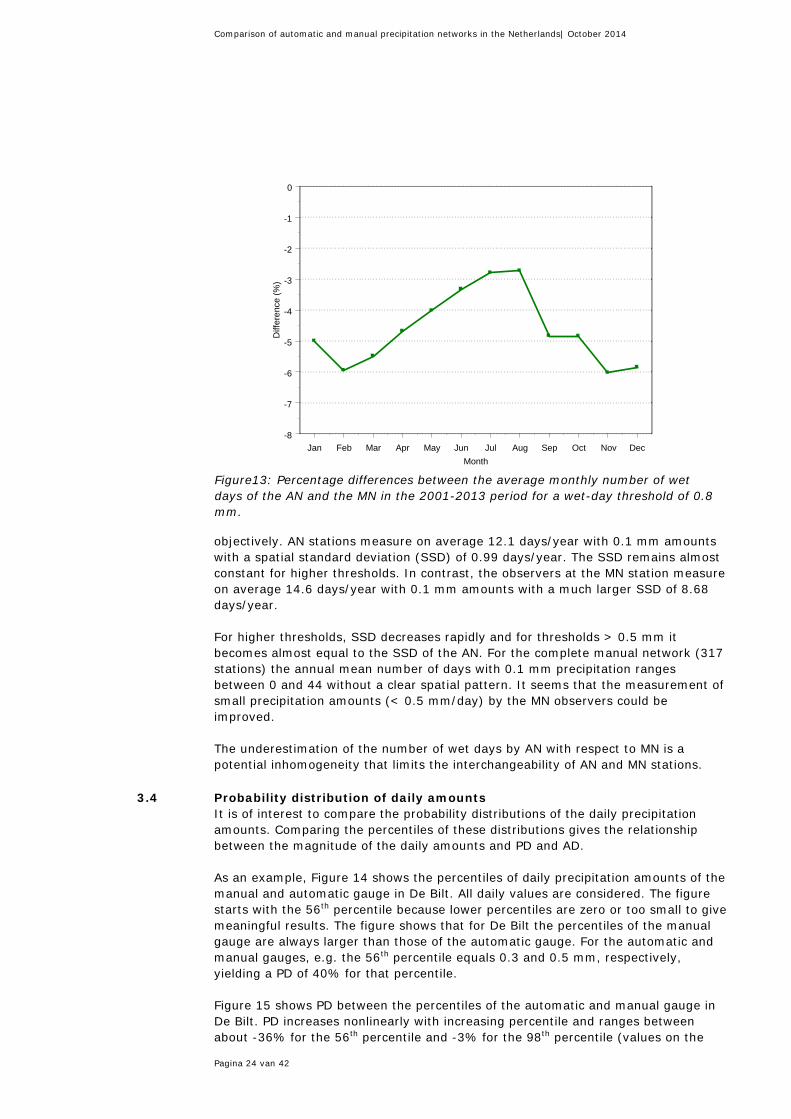
3.3 Differences in number of wet days The number of wet days is an important variable in e.g. climate change studies. Changes in measurement systems may affect this variable. Figure 12 shows PD of the number of wet days as a function of the wet-day threshold (0.1,0.2,…,1.5 mm). For each threshold, PD was calculated per year and averaged per station. Thereafter the mean of the 31 station averages and its standard error (SE) were calculated. As expected, AN has less wet days than MN. For low thresholds (< 0.3 mm) the SE of PD is large. For thresholds ≥ 0.3 mm the SE remains almost constant and the mean PD equals about -4%. Figure 13 shows the annual cycle of PD for the average number of wet days for the 0.8 mm threshold. The annual mean number of wet days for this threshold equals 144 and the monthly mean varies between 8.7 (April) and 14.9 (December) (using the MN data). Figure 13 shows a clear seasonal cycle with PD ranging between -5.6% in winter (DJF) and -3.0% in summer (JJA). There is thus a clear difference in the number of wet days of AN and MN, which may be the result of only small absolute precipitation differences on days with relatively small precipitation amounts. A detailed look at the number of days with a precipitation amount of 0.1 mm reveals that manual observers have some difficulty in measuring such small daily amounts
Figure 12: Percentage differences between the mean number of wet days of the AN and the MN as a function of the wet-day threshold in the 2001-2013 period. The error bars give the 2×SE values.
0.0 0.3 0.6 0.9 1.2 1.5Threshold (mm)
-10
-8
-6
-4
-2
0
Diff
eren
ce (%
)
Comparison of automatic and manual precipitation networks in the Netherlands| October 2014
Pagina 24 van 42
objectively. AN stations measure on average 12.1 days/year with 0.1 mm amounts with a spatial standard deviation (SSD) of 0.99 days/year. The SSD remains almost constant for higher thresholds. In contrast, the observers at the MN station measure on average 14.6 days/year with 0.1 mm amounts with a much larger SSD of 8.68 days/year. For higher thresholds, SSD decreases rapidly and for thresholds > 0.5 mm it becomes almost equal to the SSD of the AN. For the complete manual network (317 stations) the annual mean number of days with 0.1 mm precipitation ranges between 0 and 44 without a clear spatial pattern. It seems that the measurement of small precipitation amounts (< 0.5 mm/day) by the MN observers could be improved. The underestimation of the number of wet days by AN with respect to MN is a potential inhomogeneity that limits the interchangeability of AN and MN stations.
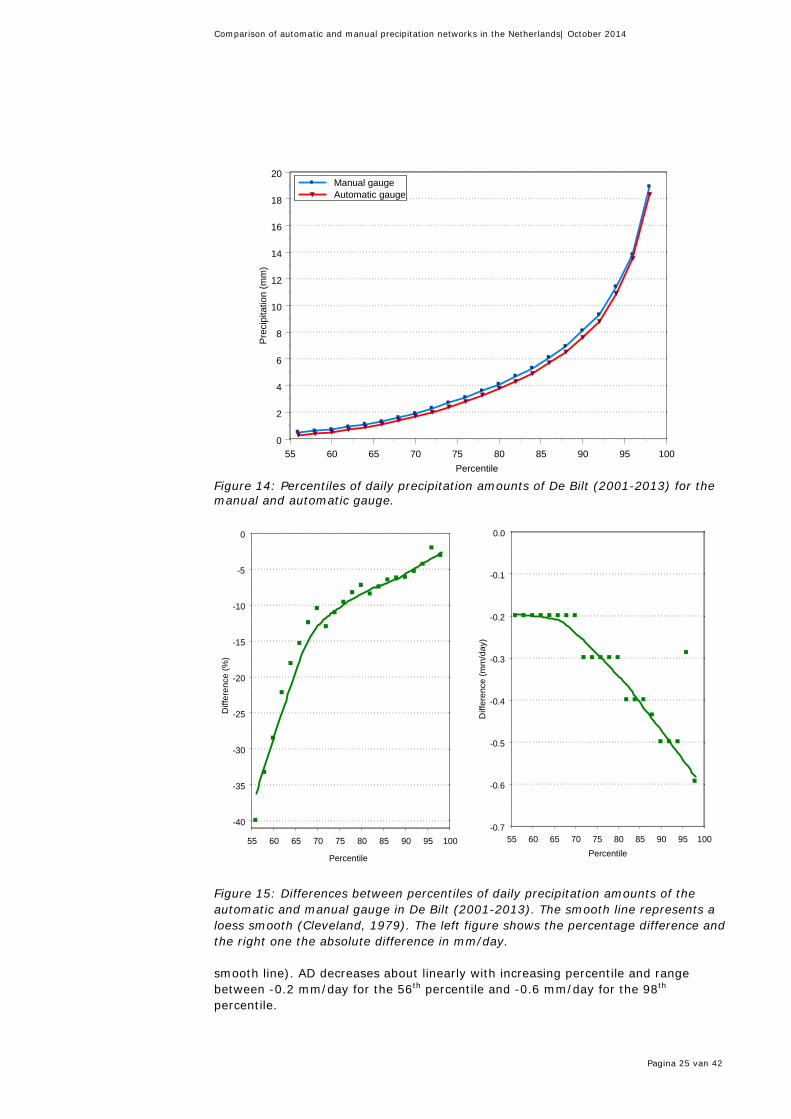
3.4 Probability distribution of daily amounts It is of interest to compare the probability distributions of the daily precipitation amounts. Comparing the percentiles of these distributions gives the relationship between the magnitude of the daily amounts and PD and AD. As an example, Figure 14 shows the percentiles of daily precipitation amounts of the manual and automatic gauge in De Bilt. All daily values are considered. The figure starts with the 56th percentile because lower percentiles are zero or too small to give meaningful results. The figure shows that for De Bilt the percentiles of the manual gauge are always larger than those of the automatic gauge. For the automatic and manual gauges, e.g. the 56th percentile equals 0.3 and 0.5 mm, respectively, yielding a PD of 40% for that percentile. Figure 15 shows PD between the percentiles of the automatic and manual gauge in De Bilt. PD increases nonlinearly with increasing percentile and ranges between about -36% for the 56th percentile and -3% for the 98th percentile (values on the
Figure13: Percentage differences between the average monthly number of wet days of the AN and the MN in the 2001-2013 period for a wet-day threshold of 0.8 mm.
Jan Feb Mar Apr May Jun Jul Aug Sep Oct Nov DecMonth
-8
-7
-6
-5
-4
-3
-2
-1
0
Diff
eren
ce (%
)
Comparison of automatic and manual precipitation networks in the Netherlands| October 2014
Pagina 25 van 42
Figure 14: Percentiles of daily precipitation amounts of De Bilt (2001-2013) for the manual and automatic gauge.
Figure 15: Differences between percentiles of daily precipitation amounts of the automatic and manual gauge in De Bilt (2001-2013). The smooth line represents a loess smooth (Cleveland, 1979). The left figure shows the percentage difference and the right one the absolute difference in mm/day. smooth line). AD decreases about linearly with increasing percentile and range between -0.2 mm/day for the 56th percentile and -0.6 mm/day for the 98th percentile.
55 60 65 70 75 80 85 90 95 100Percentile
0
2
4
6
8
10
12
14
16
18
20
Prec
ipita
tion
(mm
)
Manual gaugeAutomatic gauge
55 60 65 70 75 80 85 90 95 100
Percentile
-40
-35
-30
-25
-20
-15
-10
-5
0
Diff
eren
ce (%
)
55 60 65 70 75 80 85 90 95 100Percentile
-0.7
-0.6
-0.5
-0.4
-0.3
-0.2
-0.1
0.0
Diff
eren
ce (m
m/d
ay)

Comparison of automatic and manual precipitation networks in the Netherlands| October 2014
Pagina 26 van 42
Figure 16: Boxplot of differences between percentiles of daily precipitation amounts of AN and MN stations (2001-2013). Each box represents the differences of the 31 station pairs. The left figure shows the percentage difference and the right one the absolute difference in mm/day. Here and in subsequent figures, each box is bounded by the 25th and 75th percentile, the whiskers extent to the 5th and 95th percentile and the bold dashed line in each box is the median. Note that here the percentiles on the x-axis have a different meaning than those of the boxplot.
Figure 16 shows boxplots of PD and AD for different percentiles, where each box summarizes the values of the 31 station pairs. For the small percentiles, there is a large variation between PD of stations pairs while for the AD this occurs for the large percentiles. The former is probably partly related to the difficulties of MN observers to objectively measure small amounts, while the latter is related to the local nature of extreme precipitation events (especially in summer). The median values show the same behavior as the results for De Bilt in Figure 15. The median PD increases nonlinearly with increasing percentile and ranges between about -25% for the 56th percentile and -5% for the 98th percentile. As for De Bilt, AD decreases about linearly with increasing percentile and ranges between about -0.1 mm/day for the 56th percentile and -0.8 mm/day for the 98th percentile. PDs between the annual maximum daily rainfall amounts are shown in Figure 17. The figure shows a large variation between the station pairs. The median PD values for each year are, however, almost always negative and vary between -6.8% (2012) and 2.8% (2005). On average, the annual maxima of AN are 3.2% smaller than those of MN. AD (not shown) equals on average -0.9 mm/day. The probability distributions of AN and MN stations are thus clearly different. The results show that there is not a straightforward relation that translates the one network into the other.
5456
5860
6264
6668
7072
7476
7880
8284
8688
9092
9496
98100
Percentile (%)
-40
-35
-30
-25
-20
-15
-10
-5
0
5
10
Diff
eren
ce (%
)
5456
5860
6264
6668
7072
7476
7880
8284
8688
9092
9496
98100
Percentile (%)
-1.4
-1.2
-1.0
-0.8
-0.6
-0.4
-0.2
0.0
0.2
Diff
eren
ce (m
m/d
ay)

Comparison of automatic and manual precipitation networks in the Netherlands| October 2014
Pagina 27 van 42
Figure 17: Boxplot of percentage differences between annual maximum daily precipitation amounts of AN and MN stations (2001-2013). Each box represents the percentage differences of the 31 station pairs. The bold dash in each box represents the median.
3.5 Effect of weather variables on precipitation differences
3.5.1 Temperature Figure 18 shows the relationship of PD and AD with temperature (T). For each day, T represents the mean T on hours with precipitation > 0 mm. T-categories were defined using cut points at 0,1,2,…,20°C. PD and AD were then calculated for each station pair and T-category. Thereafter, the mean T, the station mean PD and AD and their 2×SE values were calculated for each T-category.
Figure 18: Differences between the mean precipitation amounts of the AN and the MN as a function of temperature in the 2001-2013 period. The error bars give the 2×SE values. The gray line gives the % of total precipitation in a category. The left figure shows the percentage difference and the right one the absolute difference in mm/day.
2001 2002 2003 2004 2005 2006 2007 2008 2009 2010 2011 2012 2013
Percentile (%)
-30
-20
-10
0
10
20
30
40
Diff
eren
ce (%
)
-2 0 2 4 6 8 10 12 14 16 18 20 22Temperature (°C)
-0.6
-0.5
-0.4
-0.3
-0.2
-0.1
0.0
0.1
0.2
Diff
eren
ce (m
m/d
ay) 0
2
4
6
8
Prec
ipita
ton
in c
ateg
ory
(%)
-2 0 2 4 6 8 10 12 14 16 18 20 22Temperature (°C)
-14
-12
-10
-8
-6
-4
-2
0
2
4
Diff
eren
ce (%
) 0
2
4
6
8
Prec
ipita
ton
in c
ateg
ory
(%)
Comparison of automatic and manual precipitation networks in the Netherlands| October 2014
Pagina 28 van 42
For T > 7°C the figure shows an almost constant PD of about -5% with increasing SE towards the higher end of the T-range. For T ≤ 7°C PD becomes more negative with decreasing T. The SE increases towards the lower end of the T range. Note that for snow (T < 0°C), PD is closest to zero (although it has a large SE). The large negative values of PD for T ≤ 7°C, down to about -10% for T=2.5°C, may partly be caused by the seasonality of meteorological factors that affect precipitation errors. Examples of such factors are wind speed and precipitation intensity. However, the strong change of PD for T between 4 and 7° suggest an instrumental reason as well. The most likely reason is the heating of the automatic rain gauge. The AD are relatively large between 0 and 7°C. The reason that for snow PD and AD are closest to zero, may be that snow that is melted in the automatic gauges (by the heating element) will be measured, whereas snow in manual rain gauges may partly blow out of the gauge before the once daily measurements. Apparently, when compared to MN, this partly compensates for the effect of the heating device at AN stations. Although the heating device of the KNMI automatic rain gauge would only be needed for T < 1°C it is designed to operate for T ≤ 4°C. For T < 2°C the heating is constant and between 2 and 4°C it decreases linearly to zero. In practice the heating device may sometimes also operate for T between 4 and 7°C (Bijma, 2008). The heating may thus cause relatively large amounts of precipitation to evaporate from the funnel wall for T < 7°C, increasing the wetting error. Long lasting precipitation event are likely to be most affected.
3.5.2 Precipitation intensity Precipitation intensity (Pint) may be an important factor influencing the precipitation differences between AN and MN. The drop size determines to a large extent Pint and, consequently, the potential wind error. Pin
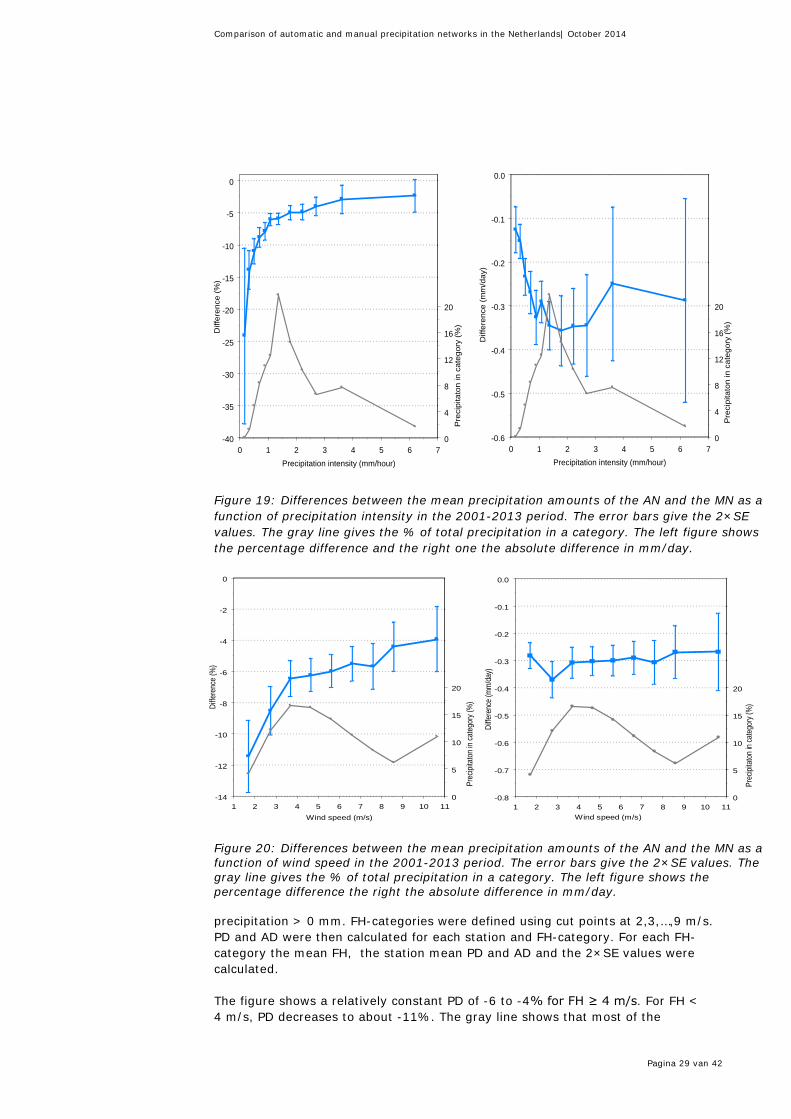
may also affect the potential wetting error, being larger for small Pint. We calculated Pint for each AN station and for each day as the daily precipitation amount divided by the daily rainfall duration (yielding Pint in mm/hour). For each day we calculated an average daily Pint for the Netherlands as a whole from the 31 automatic stations (for each day using only the stations with Pint > 0). These daily values have been used to create Pint categories. Pint can thus be considered as the average precipitation intensity for the Netherlands (for the stations where precipitation occurred). Figure 19 shows the relationship of PD and AD with Pint. Pint-categories were defined using cut points at 0.2, 0.4, 0.6, 0.8, 1.0, 1.2, 1.6, 2.0, 2.5, 3.0, 5.0 mm/hour. PD and AD were then calculated for each station and Pint-category. Thereafter, the mean Pint, the station mean PD and AD and the 2×SE values were calculated for each Pint-category. The figure shows a nonlinear relationship of PD with Pint. For large values of Pint (> 3 mm/hour), PD stabilizes around -2.5%. PD is strongest negative for small values of Pint (i.e. long precipitation duration for the same amount of precipitation). The graph for AD shows that AD becomes stronger negative with increasing Pint up to about Pint = 2.0 mm/hour. For Pint > 2.0 mm/hour AD fluctuates around -0.3 mm/day with large standard errors.
3.5.3 Wind speed Figure 20 shows the relationship of PD and AD with wind speed (FH). For each day, FH was calculated from AN stations as the mean wind speed on hours with
Comparison of automatic and manual precipitation networks in the Netherlands| October 2014
Pagina 29 van 42
Figure 19: Differences between the mean precipitation amounts of the AN and the MN as a function of precipitation intensity in the 2001-2013 period. The error bars give the 2×SE values. The gray line gives the % of total precipitation in a category. The left figure shows the percentage difference and the right one the absolute difference in mm/day.
Figure 20: Differences between the mean precipitation amounts of the AN and the MN as a function of wind speed in the 2001-2013 period. The error bars give the 2×SE values. The gray line gives the % of total precipitation in a category. The left figure shows the percentage difference the right the absolute difference in mm/day.
precipitation > 0 mm. FH-categories were defined using cut points at 2,3,…,9 m/s. PD and AD were then calculated for each station and FH-category. For each FH-category the mean FH, the station mean PD and AD and the 2×SE values were calculated. The figure shows a relatively constant PD of -6 to -4% for FH ≥ 4 m/s. For FH < 4 m/s, PD decreases to about -11%. The gray line shows that most of the
0 1 2 3 4 5 6 7Precipitation intensity (mm/hour)
-40
-35
-30
-25
-20
-15
-10
-5
0
Diff
eren
ce (%
)
0
4
8
12
16
20
Pre
cipi
tato
n in
cat
egor
y (%
)0 1 2 3 4 5 6 7
Precipitation intensity (mm/hour)
-0.6
-0.5
-0.4
-0.3
-0.2
-0.1
0.0
Diff
eren
ce (m
m/d
ay)
0
4
8
12
16
20
Pre
cipi
tato
n in
cat
egor
y (%
)
1 2 3 4 5 6 7 8 9 10 11Wind speed (m/s)
-14
-12
-10
-8
-6
-4
-2
0
Diffe
renc
e (%
)
0
5
10
15
20
Prec
ipita
ton
in ca
tego
ry (%
)
1 2 3 4 5 6 7 8 9 10 11Wind speed (m/s)
-0.8
-0.7
-0.6
-0.5
-0.4
-0.3
-0.2
-0.1
0.0
Diffe
renc
e (m
m/d
ay)
0
5
10
15
20
Prec
ipita
ton
in ca
tego
ry (%
)

Comparison of automatic and manual precipitation networks in the Netherlands| October 2014
Pagina 30 van 42
precipitation is the range where -8 ≤ PD ≤ -5%. The values for AD show an almost constant difference of -0.3 mm/day for all values of FH. In general, wind induced errors are the most important reason for differences in precipitation amounts between rain gauges. Here it seems that, on average, the effect of FH is small or similar for AN and MN. Apparently, FH is not the main explaining factor for PD and AD.
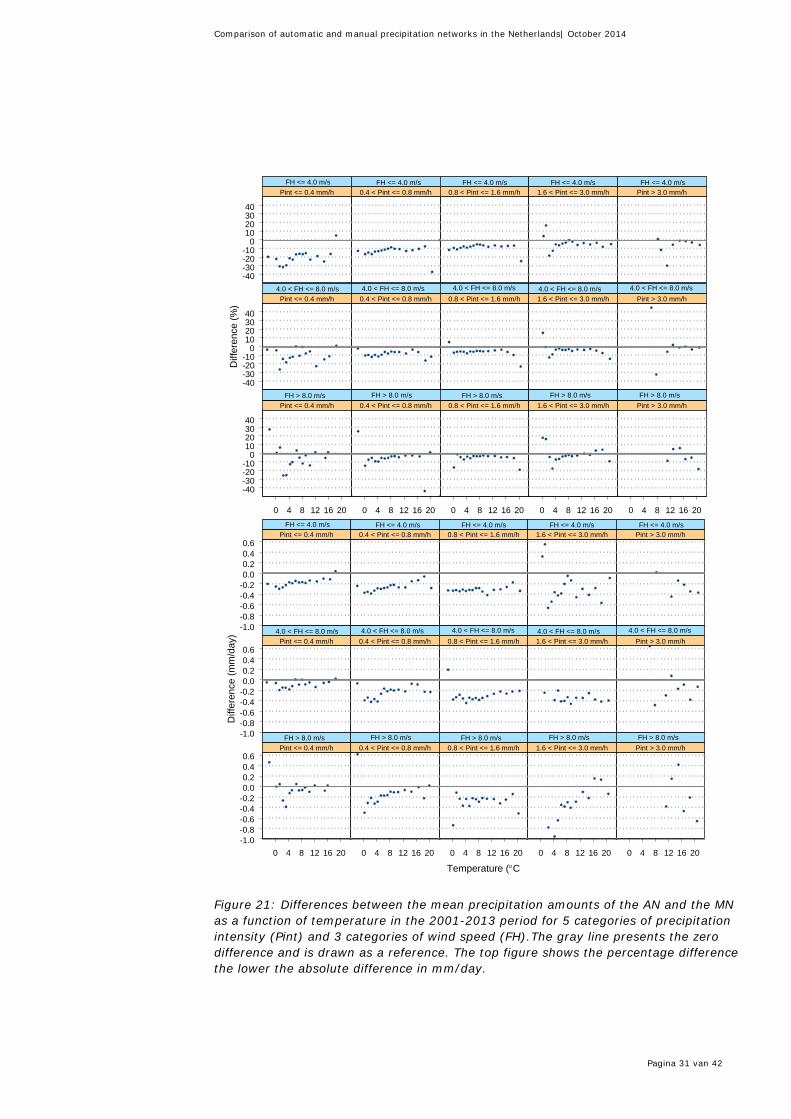
3.5.4 Combined effects Figure 21 explores the relationship of PD and AD with T for 15 combinations of Pint and FH (as presented at the top of each panel). PD and AD were calculated for each Pint and FH combination without distinguishing between stations. The 2×SE values were not calculated here. Pint increases from left to right and FH from top to bottom. As expected, the largest negative PDs are found for small Pint while FH has only a small effect. Also the relationship with T (as shown in Figure 18) is most evident for small Pint. PD becomes almost zero at high FH, especially for Pint > 1.6 mm/hour. For Pint > 1.6 mm/hour, there is no clear effect of FH on the PD-T relationship. Note that for Pint > 3.0 mm/hour, PD for the low temperatures are missing. This is a result of the strong annual cycle of Pint (mean Pint in DJF equals 0.76 mm/hour and in JJA 2.02 mm/hour). Note also that for T < 0°C (snow), PD mainly depends on FH, with PD ranging from negative for FH ≤ 4.0 m/s to strongly positive for FH > 8.0 m/s. The latter may be caused by the effect of snow blown out of the manual gauges. This effect is stronger are large wind speeds. The lower graph shows that AD is mostly between -0.4 and 0.0 mm/day. Again the effect of snow for FH > 8.0 m/s is clearly visible. The results so far, suggest that precipitation amount and Pint are important factors for explaining the precipitation differences between AN and MN. Figure 22 shows AD as a function of precipitation amount for several Pint categories for both winter (DJF) and summer (JJA). Precipitation amount is defined here as the mean of the daily values of the AN and MN gauge for each station pair. The figure shows some interesting facts. In DJF AD becomes stronger negative with increasing precipitation amount and decreasing Pint. AD can be as large as about -1.8 mm/day for the category with the largest precipitation amounts and the lowest Pint values. In general AD becomes closer to zero with decreasing precipitation amount and increasing Pint. The graph for JJA shows the same pattern but the magnitude of AD is only about half that of the DJF graph and the relationship of AD with Pint is not as obvious as for DJF. The large difference between the DJF and JJA graphs in Figure 22 might (partly) be explained by the operation of the heating device. For the same precipitation amount, precipitation duration increases with decreasing values of Pint. Increased duration of precipitation implies that the funnel wall remains wet for longer periods, increasing the wetting error by the artificial heating of the heating device. In JJA the heating device does not operate and cannot explain the negative AD values. It might be that the undercatch of AN with respect to MN in JJA is related to an increased wetting error for AN. AN stations are positioned in open areas whereas MN stations are in sheltered locations. Consequently, wind speeds are larger and exposure time to direct sun light is longer at AN stations compared to MN stations, resulting in larger wetting errors. This undercatch becomes larger with increased precipitation duration.
3.6 Effect of rounding errors A possible source of error in AN data may be the rounding of hourly precipitation values. The validated hourly data are rounded to one decimal and distributed to the public as -1 values for hours with precipitation > 0 and < 0.05 mm (trace precipitation). For practical purposes (like calculating the daily amounts in AN), the
Comparison of automatic and manual precipitation networks in the Netherlands| October 2014
Pagina 31 van 42
Figure 21: Differences between the mean precipitation amounts of the AN and the MN as a function of temperature in the 2001-2013 period for 5 categories of precipitation intensity (Pint) and 3 categories of wind speed (FH).The gray line presents the zero difference and is drawn as a reference. The top figure shows the percentage difference the lower the absolute difference in mm/day.
0 4 8 12 16 20 0 4 8 12 16 20 0 4 8 12 16 20 0 4 8 12 16 20 0 4 8 12 16 20
-40-30-20-10
010203040
-40-30-20-10
010203040
-40-30-20-10
010203040
Diff
eren
ce (%
)
Pint <= 0.4 mm/h 0.4 < Pint <= 0.8 mm/h 0.8 < Pint <= 1.6 mm/h 1.6 < Pint <= 3.0 mm/h Pint > 3.0 mm/h
Pint <= 0.4 mm/h 0.4 < Pint <= 0.8 mm/h 0.8 < Pint <= 1.6 mm/h 1.6 < Pint <= 3.0 mm/h Pint > 3.0 mm/h
Pint <= 0.4 mm/h 0.4 < Pint <= 0.8 mm/h 0.8 < Pint <= 1.6 mm/h 1.6 < Pint <= 3.0 mm/h Pint > 3.0 mm/h
4.0 < FH <= 8.0 m/s
FH <= 4.0 m/sFH <= 4.0 m/sFH <= 4.0 m/sFH <= 4.0 m/sFH <= 4.0 m/s
FH > 8.0 m/s
4.0 < FH <= 8.0 m/s4.0 < FH <= 8.0 m/s4.0 < FH <= 8.0 m/s4.0 < FH <= 8.0 m/s
FH > 8.0 m/sFH > 8.0 m/sFH > 8.0 m/sFH > 8.0 m/s
0 4 8 12 16 20 0 4 8 12 16 20 0 4 8 12 16 20 0 4 8 12 16 20 0 4 8 12 16 20
Temperature (°C
-1.0-0.8-0.6-0.4-0.20.00.20.40.6
-1.0-0.8-0.6-0.4-0.20.00.20.40.6
-1.0-0.8-0.6-0.4-0.20.00.20.40.6
Diff
eren
ce (m
m/d
ay)
Pint <= 0.4 mm/h 0.4 < Pint <= 0.8 mm/h 0.8 < Pint <= 1.6 mm/h 1.6 < Pint <= 3.0 mm/h Pint > 3.0 mm/h
Pint <= 0.4 mm/h 0.4 < Pint <= 0.8 mm/h 0.8 < Pint <= 1.6 mm/h 1.6 < Pint <= 3.0 mm/h Pint > 3.0 mm/h
Pint <= 0.4 mm/h 0.4 < Pint <= 0.8 mm/h 0.8 < Pint <= 1.6 mm/h 1.6 < Pint <= 3.0 mm/h Pint > 3.0 mm/h
4.0 < FH <= 8.0 m/s
FH <= 4.0 m/sFH <= 4.0 m/sFH <= 4.0 m/sFH <= 4.0 m/sFH <= 4.0 m/s
FH > 8.0 m/s
4.0 < FH <= 8.0 m/s4.0 < FH <= 8.0 m/s4.0 < FH <= 8.0 m/s4.0 < FH <= 8.0 m/s
FH > 8.0 m/sFH > 8.0 m/sFH > 8.0 m/sFH > 8.0 m/s

Comparison of automatic and manual precipitation networks in the Netherlands| October 2014
Pagina 32 van 42
Figure 22: Absolute differences between the mean precipitation amounts of the AN and the MN as a function of precipitation amount in the 2001-2013 period for 5 categories of precipitation intensity (Pint) for winter (DJF) and summer (JJA).The straight lines are least-squares fits.
Figure 23: Mean monthly number of -1 values (precipitation < 0.05 mm) in the hourly precipitation data of De Bilt (2001-2013).
-1 values are set to zero. For the present study it is of interest to know the magnitude of the error introduced by the rounding. Figure 23 shows the seasonal cycle of the number of -1 values for De Bilt. The annual number of -1 values in the 2001-2013 period (not shown) varies between
Jan Feb Mar Apr May Jun Jul Aug Sep Oct Nov DecMonth
50
60
70
80
90
Num
ber o
f -1
valu
es
0 2 4 6 8 10 12 14 16 18 20 22 24Precipitation (mm)
-1.8
-1.6
-1.4
-1.2
-1.0
-0.8
-0.6
-0.4
-0.2
0.0
0.2
Diff
eren
ce (m
m/d
ay)
0.6 < Pint <= 1.0 1.0 < Pint <= 1.4 1.4 < Pint <= 2.0 2.0 < Pint <= 3.0 Pint > 3.0
JJA
0 2 4 6 8 10 12 14 16 18 20 22 24Precipitation (mm)
-1.8
-1.6
-1.4
-1.2
-1.0
-0.8
-0.6
-0.4
-0.2
0.0
0.2
Diff
eren
ce (m
m/d
ay)
Pint <= 0.60.6 < Pint <= 1.01.0 < Pint <= 1.41.4 < Pint <= 2.02.0 < Pint <= 3.0
DJF

Comparison of automatic and manual precipitation networks in the Netherlands| October 2014
Pagina 33 van 42
730 (2003) and 1064 (2001) without any visible trend. The mean annual number of -1 values equals 890. For the De Bilt we used the non-rounded 10-min data (not operationally available) for the 2011-2013 period to estimate the effect of rounding. From these values we calculated non-rounded hourly precipitation amounts and compared these with the published hourly amounts (after removing missing and suspect values). There is an average error of 0.007 mm per -1 value. This means 890×0.007 = 6.2 mm/year is missing because of the rounding. The average annual precipitation from the automatic rain gauge in De Bilt equals 859 mm, so the error due to rounding equals 0.72%. If we consider the non-rounded values for all hours, instead of only the -1 values, only 4.1 mm/year is missing, reducing the error due to rounding to 0.43%. The magnitude of the error introduced by rounding is thus small but not negligible. It can easily be accounted for by postponing the rounding and allowing more digits in the database.
Comparison of automatic and manual precipitation networks in the Netherlands| October 2014
Pagina 34 van 42
4 Discussion
The results in this report for the 2001-2013 period show that AN measures about 5-8% less precipitation than MN. Because MN has an undercatch of about 5% (combined wind and wetting error), the total undercatch of AN equals about 10-13%. The precipitation data in this study has been used as it is distributed to the public and used in KNMI products. Although e.g. relocations may affect the results for individual stations, it is unlikely that they bias the general finding of the study (see e.g. Figure 9, where the AN is compared with 317 MN stations). From 2009 onwards, there is a statistical significant increase in the precipitation loss of AN. It is hard to say whether this is a step change or whether it is part of a trend. The increased loss may probably partly be explained by the slow transition to the Ott screen at AN stations and partly by an increase, in recent years, in the number of reported problems with the heating elements of automatic gauges.
Apart from the transition to Ott screens and possible problems with heating elements, there still is a difference between AN and MN of about 5-6%. Although differences in catch of rain gauges can often be explained by differences in wind error, this is probably only partly the reason here. Two factors should be considered. First, MN stations are mostly located in sheltered locations (gardens of houses, near farms, etc.) while AN stations are mostly located in open areas (because of the necessity to measure undisturbed wind speed). This should result in larger a catch at MN stations than at AN stations. The second factor is the situation of the instrument. MN stations have the rim of the gauges installed at 0.4 m above the ground level (without a wind shield) while AN stations have the gauge installed in an English set-up. This should result in a larger catch at AN stations than at MN stations. The effect of both factors probably partly outweigh each other. The gauges in the English set-up are affected by wind speed. Braak (1945) showed for a windy location in De Voorst a wind error of about 2.7% for the English set-up compared to the WMO reference. This error increases with about 1.5% when the English set-up is replaced by a setup with an Ott screen with the rim at 1.0 m above the ground surface (Wauben, 2004). Although the latter result is for the De Bilt and the first for De Voorst, it may tentatively be estimated that the total wind error of the automatic gauge in the Ott screen equals about 2.7+1.5=4.2%. This is only slightly larger than the estimated wind error for MN of about 3%. Kuik (2001) compared in a 1-year experiment for De Bilt the automatic rain gauge in the English setup with 2 manual rain gauges placed next to it with the gauge rim installed at 0.4 m above ground level. Both gauges were thus subject to the same sheltering. The manual gauges measured 3.4% more precipitation than the automatic rain gauges. Kuik stated that the reason for the difference was not clear. In the present study we compared automatic rain gauges with the most nearby manual gauge. Manual rain gauges are mostly situated in more sheltered areas than the automatic gauges. Therefore, it is not surprising that in this study we found that manual gauges measure more than 3.4% more precipitation than the corresponding automatic gauges. The results in the present report suggest that the differences in catch between AN and MN partly originate from differences in wetting errors from the surface of the funnel. The undercatch of AN compared to MN occurs in all seasons and for all magnitudes of daily precipitation amounts. The relative undercatch equals about 25% for small daily amounts (56th percentile) and 5% for the large daily amounts

Comparison of automatic and manual precipitation networks in the Netherlands| October 2014
Pagina 35 van 42
(98th percentile). The absolute undercatch shows an almost linear relationship with percentile of the daily amount and ranges between about 0.1 mm/day (56th percentile) and 0.8 mm/day (98th percentile). Especially in winter (DJF), the undercatch of automatic gauges compared to manual ones strongly depends on precipitation duration and may be as large as 1.8 mm/day for a wet day with > 10 mm of rainfall and low precipitation intensity. The functioning of the heating element of the automatic gauge may be important here. In general it is desirable to minimize the undercatch of a network. Although the undercatch of MN is difficult to reduce, there are several possibilities to reduce the undercatch of AN to become closer to that of MN. First, the recommendations in Bijma (2008) could be implemented. This solves, among others, the problem of the heating element. Second, the implementation of the Ott screen could be stopped (the English setup clearly has a smaller wind error than the setup with the Ott screen). If this is not possible, the wind error of the setup with the Ott screen can somewhat be reduced by lowering the height of the rim of the gauge from 1.0 to 0.7 m above ground level (this reduces the wind speed at rim height by about 10%). Third, the difference between AN and MN can be reduced by about 0.5% by postponing the rounding of the precipitation amounts of AN and allowing more digits in the database. The above measures will probably not be sufficient to reduce the undercatch of AN to the level of MN. Some research is needed to investigate the small losses, like wetting. For instance, it might be of interest to investigate whether there are differences in adhesion of water to the funnel wall of manual and automatic gauge and whether there are differences in drying time of the gauges in the field. The measuring of small amounts (< 0.5 mm/day) by MN observers can be improved. The large spatial variability of the number of days with small amounts suggests that these amounts are not objectively measured (see also Buishand, 1977)7. Additional instruction of the observers might be needed here. The effect of the inadequate measurement of small MN amounts on the results in the present study is probably restricted to an increase of the uncertainty range of the results for small amounts. There is no indication of a systematic effect. Precipitation networks and climate monitoring There are three main sources of error that affect the suitability of precipitation networks for climate monitoring purposes: (1) relocations or changes in the local environment of the gauges, (2) changes in instruments and methods8, and (3) weather-dependent measurements errors (e.g. wind-induced undercatch). For individual stations, the effect of relocations or changes in the local environment may be large because of their impact on both the wind error and the wetting error. However, as long as the changes are not systematic, their effect on a network as a whole is probably small. In the present study, AN stations are located in open areas and MN stations in enclosed areas. For the study period, there are no systematic changes in this practice. In addition, for the Netherlands, Buishand et al. (2012) homogenized the precipitation series of MN and found only minor differences between trends calculated from the homogenized and non-homogenized network. Changes in instruments and methods generally introduce inhomogeneities in existing precipitation series, although they may sometimes decrease the
7 P.46, Fig.6.1 8 Methods apply e.g. to instrumental set-up (e.g. height of the gauge rim above ground level, use of a wind screen),
software settings and calibration of the instruments, regulations concerning: (a) measurement of snow, (b) distribution of multi-day amounts, (c) validation, and (d) dealing with missing values.

Comparison of automatic and manual precipitation networks in the Netherlands| October 2014
Pagina 36 van 42
measurement errors. Correcting for these inhomogeneities is often not feasible or restricted to only the lower order moments. Whereas MNs usually have a long continuity of instruments and methods, this continuity is hard to guarantee with ANs. This is demonstrated in the present study where in the short period 2001-2013 a discontinuity occurred: gradual transition from the English set-up to the set-up with an Ott screen for about half of the AN stations. This introduced a weather-dependent error (Wauben, 2004) that is difficult to correct. In addition, KNMI recently started searching for a commercially available automatic precipitation gauge to replace the current operational automatic gauge. It is known that all available gauges have their own specific errors (Wauben, 2006; WMO, 2009) and each gauge change will introduce a new inhomogeneity. Weather-dependent errors hamper the detection of long-term precipitation change because the relevant weather variables themselves may be subject to long-term changes. For example, an increase in wind speed increases the wind error of precipitation causing an artificial decrease in precipitation. Another example is the increase in temperatures. This affects e.g. the fraction of precipitation falling as snow. Because the wind error for snow is almost an order of magnitude larger than for rain, any change in this fraction results in an artificial change in precipitation. In addition, increased temperatures decrease the frequency of the operation of the heating device (as for the AN gauges in the present study) , thus decreasing the wetting error in winter. For the Netherlands, AN exhibits a much larger undercatch than MN and is probably most affected with respect to its ability to signal long-term precipitation change.
Comparison of automatic and manual precipitation networks in the Netherlands| October 2014
Pagina 37 van 42
5 Summary, conclusions and recommendations
Summary and conclusions This report compares the automatic precipitation network (AN) in the Netherlands with the manual network (MN) in the 2001-2013 period. At 31 locations the hourly precipitation values of AN are aggregated to daily (0800-0800 UTC) values and are compared with the daily precipitation values of the most nearby MN station measured at 0800 UTC. The influence of temperature, wind speed and precipitation intensity is explored using for each AN station the daily mean values of these variables on rain hours. The main conclusion of the study is that AN measures annually 5-8% less precipitation than MN, with an average of 6.4% for the whole 2001-2013 period. This corresponds to about 0.3 mm per wet day. Because MN has an undercatch of about 5% (combined wind and wetting error), the total undercatch of AN equals about 10-13%. This is much larger than the WMO requirement of 5% (achievable measurement error). The other conclusions can be summarized as follows: 1. There is a statistical significant increase of about 2% of the undercatch of AN
with respect MN in the 2001-2013 period. It is unclear whether this is a step change in the annual values in 2009 or a long-term trend. The cause of the increase in undercatch is probably a result of a combination of (a) the slow transition at AN stations of the English setup to a setup with an Ott screen and (b) an increase, in recent years, of problems with the heating elements of automatic gauges at AN stations resulting in an increased wetting loss.
2. The undercatch of AN with respect to MN varies seasonally and equals on average 7.7% in winter (DJF) and 5.0% in summer (JJA).
3. AN underestimates the number of wet days with respect to MN by about 4%. In DJF the underestimation equals 5.6% and in JJA 3.0%.
4. For MN there is an unrealistically large spatial variability in the number of days with small precipitation amounts (< 0.5 mm/day). This suggests that MN observers have difficulties with objectively measuring these amounts. Additional instruction of the observers is recommended.
5. The undercatch of AN with respect to MN strongly depends on precipitation amount. On average the undercatch varies between 25% (≈0.1 mm/day) for the 56th percentile of the probability distribution of the daily amounts (including the days with 0 precipitation) and 5% (≈0.8 mm/day) for the 98th percentile. The 56th and 98th percentiles correspond to a daily precipitation amount of about 0.4 and 17 mm, respectively. For the annual maximum precipitation amounts the undercatch equals on average 3.2% (≈0.9 mm/day).
6. The undercatch of AN with respect to MN is studied as a function of temperature, wind speed, and rainfall intensity. The results suggest that the undercatch for a specific day mainly depends on the precipitation amount and intensity (and thus the precipitation duration). In DJF the undercatch can be as large as 1.8 mm/day for the category with the largest precipitation amounts and the lowest precipitation intensity values. In general the undercatch becomes smaller with decreasing precipitation amount and increasing intensity. For JJA the undercatch as a function of these variables is about half of the DJF values.
Comparison of automatic and manual precipitation networks in the Netherlands| October 2014
Pagina 38 van 42
7. The relatively large values of the undercatch of AN for temperatures ≤ 7°C and the comparison of results for DJF and JJA, suggest that the heating device of the AN gauges amplifies the wetting error.
8. For snow (T < 0°C), the undercatch of AN with respect to MN is close to zero. This is probably a result of the melting of snow by the automatic rain gauges. Snow that is melted will be measured, whereas snow in manual rain gauges may blow out of the gauge. This almost completely compensates for the other errors of AN with respect to MN.
9. Braak (1945) found for the Voorst that the English setup has a wind error of 2.7%. This error increases by about 1.5% when the rain gauge is transferred from the English setup to a setup using an Ott screen (Wauben, 2004). MN stations have on average a wind error of about 3% (Braak, 1945). They are, however, usually subject to more sheltered conditions than AN stations. Kuik (2001) found for De Bilt that two manual gauges measured 3.4% more precipitation than an automatic gauge in an English setup at the same location. It can thus tentatively be deduced that the major part of the undercatch of AN with respect to MN is not related to difference in wind error.
10. Conclusion (9) is confirmed by the finding in the present study that the undercatch of AN with respect to MN is almost independent of wind speed (about 0.3 mm/day for each wind speed class).
Recommendations The following recommendations can be stated: 1. Keep a representative set of MN stations in the future for climate monitoring
purposes, since they have long and stable records and serve as a reference, though not absolute. Today AN cannot satisfy those needs. The total undercatch of AN amounts to 10-13%. This is much larger than the WMO requirement of 5% (achievable measurement error) and leaves too much room for potential inhomogeneities in case of changes in instruments and methods. It is unlikely that commercially available automatic precipitation gauges will solve this issue in the near future.
2. Reduce the undercatch of AN by about 0.5% by postponing the rounding of the precipitation amounts of AN and allowing more digits in the database.
3. Reduce the undercatch of AN by implementing the recommendations in Bijma (2008). This solves, among others, the problem of the heating element.
4. Reduce the undercatch of AN by stopping the implementation of the Ott screen (unless the situation is not suitable for an English set-up). Alternatively, the wind error of the setup with the Ott screen can somewhat be reduced by lowering the height of the rim of the gauge from 1.0 to 0.7 m above ground level (this reduces the wind speed at rim height by about 10%).
5. Study the differences in wetting errors for the automatic and manual gauges for laboratory conditions and in the field.
6. Use the WMO reference set-up for future parallel experiments, e.g. when a new precipitation gauge is selected or evaluated. The gauges of interest should be compared in their normal set-up with the same gauges in a WMO reference pit. Also include the manual gauge (both in the WMO reference pit and in its normal set-up) in such an experiment. The WMO reference pit situates the rain gauge such that the rim of the gauge is at ground level surrounded by a roster (see e.g. Braak, 1945, and WMO, 2009). This eliminates the wind error.

Comparison of automatic and manual precipitation networks in the Netherlands| October 2014
Pagina 39 van 42
7. Provide the voluntary observers of MN with information/guide lines regarding the measurement of small precipitation amounts (< 0.5 mm/day) to solve the large spatial standard deviations of these events.

Comparison of automatic and manual precipitation networks in the Netherlands| October 2014
Pagina 40 van 42
References
Braak, C. Influence of the wind on rainfall measurements, KNMI, De Bilt, Mededelingen en Verhandelingen 48, 1945. Buishand, T.A. Stochastic modelling of daily rainfall sequences, PhD-thesis, University of Wageningen, Wageningen, 1977. Buishand, T.A. Some methods for testing the homogeneity of rainfall records, J. Hydrol. 58: 11-27, 1982. Buishand, T. A. and C.A. Velds. Neerslag en verdamping, KNMI, De Bilt, 1980 (in Dutch). Bijma, J. Onderzoek Problemen en Tekortkomingen Operationele Neerslagmeter (OPETON), KNMI, De Bilt, Internal Report IR 2008-04, 2008 (in Dutch). Cleveland, W.S. Robust locally weighted regression and smoothing scatterplots, Journal of the American Statistical Association 74: 829–836, 1979. Denkema, A. Resultaten van vergelijkende metingen met diverse typen regenmeters in het tijdvak december 1971 – januari 1975 te De Bilt, KNMI, De Bilt, Verslagen V-342, 1980 (in Dutch). Denkema, A. Resultaten van vergelijkende neerslagmetingen in de Foppenpolder (gemeente Maasland), De Bilt, KNMI, Memorandum KD-81-2, 1981 (in Dutch). Kuik, F. Neerslagonderzoek 1989, KNMI, De Bilt, Internal report IR 2001-01, 2001 (in Dutch). Lanza, L. et al. WMO Laboratory Intercomparison of Rainfall Intensity Gauges, Final report, WMO, Geneva, 2006. Overeem, A. Climatology of extreme rainfall from rain gauges and weather radar, Wageningen University, Wageningen, PhD-thesis, 2009. Warmerdam, P.M.M. De invloed van de wind op regenwaarnemingen; een vergelijkend regenmeteronderzoek, H2O 14: 16-20, 1981 (in Dutch). Wauben, W. Precipitation amount and intensity measurements using a windscreen, KNMI, De Bilt, Technical Report TR-262, 2004. Wauben, W. KNMI contribution to the WMO Laboratory Intercomparison of Rainfall Intensity Gauges, KNMI, De Bilt, Technical Report TR-287, 2006. WMO (World Meteorological Organization). International Comparison of National Precipitation Gauges with a Reference Pit Gauge (B. Sevruk and W.R. Hamon). Instruments and Observing Methods Report No. 17, WMO/TDNo. 38, Geneva, 1984. WMO (World Meteorological Organization). Guide to Meteorological Instruments and Methods of Observation (CIMO), WMO-No.8, 2008. WMO (World Meteorological Organization). WMO Field Intercomparison of Rainfall Intensity Gauges (Vigna di Valle, Italy, October 2007 – April 2009). Instruments and
Observing Methods Report No. 99, WMO/TD‐No. 1504, 2009.

Comparison of automatic and manual precipitation networks in the Netherlands| October 2014
Pagina 41 van 42
Appendix A. Station and instrument relocations
Automatic network (AN) Manual Network (MN) Stat Name Stat Name 210 Valkenburg
• 02-09-2009 (885 m) 474 Valkenburg
• 20-02-2001 (200 m) • 27-11-2005 (5 m)
235 De Kooy 25 De Kooy • 10-02-2004 (1100 m) • 14-11-2006 (46 m)
240 Schiphol • 02-03-2004 (4 km)
458 Aalsmeer • 01-11-2007 (58 m) • Feb 2009 (a few meters)
249 Berkhout 222 Hoorn • 26-04-2013 (2 km)
251 Hoorn (Tersch.) 26 Formerum 260 De Bilt
• 25-09-2008 (200 m) 550 De Bilt
267 Stavoren 80 Stavoren • 27-03-2003 (125 m)
269
Lelystad 369 Lelystad
270 Leeuwarden 85 Leeuwarden 273 Marknesse 317 Marknesse
• 06-05-2004 (600 m) • 18-07-2005 (1250 m) • 24-11-2007 (800 m) • 18-06-2008 (2 km)
275 Deelen 591 Deelen 277 Lauwersoog 171 Anjum 278 Heino 340 Heino
• 05-06-2013 (323 m) 279 Hoogeveen 332 Hoogeveen
• 01-07-2004 (tens of m) • 11-09-2005 (tens of m) • 28-09-2005 (1750 m)
280 Eelde 161 Eelde • 22-04-2005 (450 m)
283 Hupsel 688 Hupsel • 25-03-2004 (2 m)
286 Nieuw Beerta 143 Finsterwolde • 11-10-2007 (1 m)
290 Twenthe 670 Twenthe 310 Vlissingen 733 Vlissingen 319 Westdorpe 770 Westdorpe
• 17-07-2001 (20 m) • 05-06-2007 (4 m)
323 Wilhelminadorp 749 Wilhelminapolder • 25-04-2001 (800 m) • 10-12-2003 (ca 1500 m) • 10-01-2013 (430 m)
330 Hoek v Holland 477 Hoek v Holland • 13-04-2001 (6 m)
344 Rotterdam • 28-09-2006 (600 m)
473 R'dam-W-Haven
348 Cabauw 561 Benschop • 01-05-2003 (2 m)

Comparison of automatic and manual precipitation networks in the Netherlands| October 2014
Pagina 42 van 42
350 Gilze-Rijen 843 Gilze-Rijen 356 Herwijnen 830 Herwijnen
• 13-01-2004 (1200 m) 370 Eindhoven 919 Eindhoven
• 13-01-2005 (1450 m) 375 Volkel 920 Volkel
• 17-04-2005 (7 m) • 25-08-2009 (688 m) • 17-08-2011 (3 m)
377 Ell 970 Stramproy • 30-07-2007 (5 m)
380 Maastricht • 01-11-2005 (1770 m)
973 Beek • 30-04-2007 (50 m)
391 Arcen 923 Arcen

A complete list of all KNMI-publications (1854 – present) can be found on our website www.knmi.nl/knmi-library/knmipub_en.html
The most recent reports are available as a PDF on this site.