Embed Size (px)
Citation preview
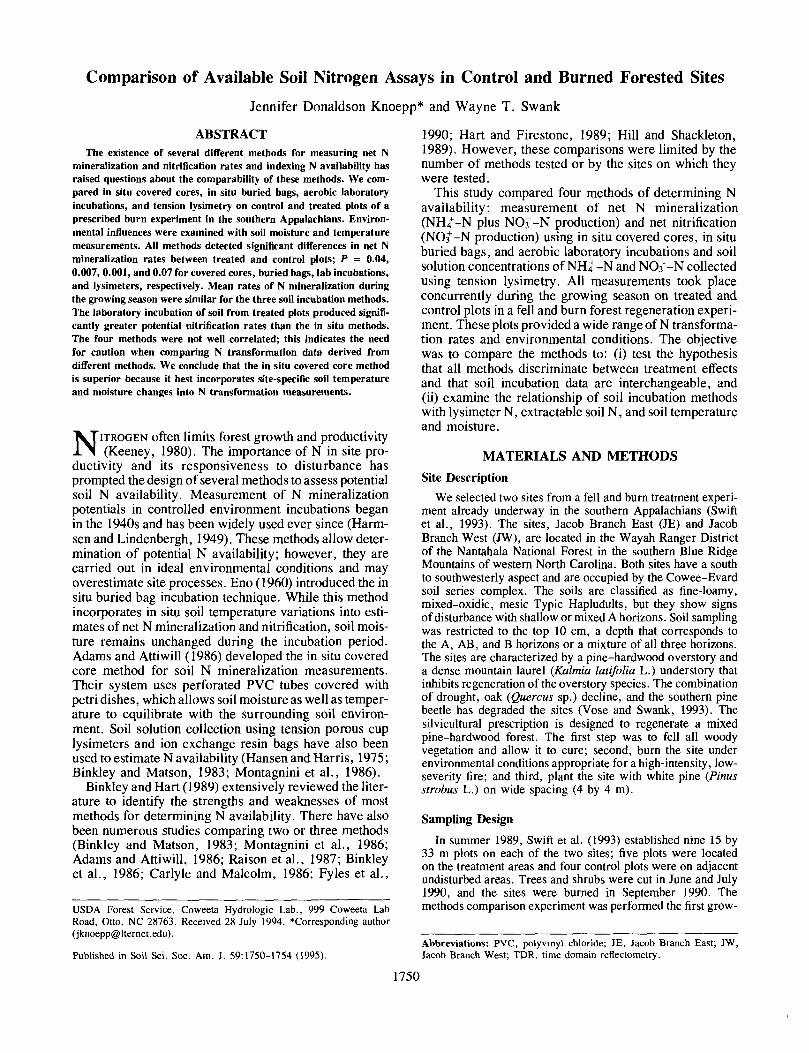
Comparison of Available Soil Nitrogen Assays in Control and Burned Forested SitesJennifer Donaldson Knoepp* and Wayne T. Swank
ABSTRACTThe existence of several different methods for measuring net N
mineralization and nitrification rates and indexing N availability hasraised questions about the comparability of these methods. We com-pared in situ covered cores, in situ buried bags, aerobic laboratoryincubations, and tension lysimetry on control and treated plots of aprescribed burn experiment in the southern Appalachians. Environ-mental influences were examined with soil moisture and temperaturemeasurements. AH methods detected significant differences in net Nmineralization rates between treated and control plots; P = 0.04,0.007, 0.001, and 0.07 for covered cores, buried bags, lab incubations,and lysimeters, respectively. Mean rates of N mineralization duringthe growing season were similar for the three soil incubation methods.The laboratory incubation of soil from treated plots produced signifi-cantly greater potential nitrification rates than the in situ methods.The four methods were not well correlated; this indicates the needfor caution when comparing N transformation data derived fromdifferent methods. We conclude that the in situ covered core methodis superior because it best incorporates site-specific soil temperatureand moisture changes into N transformation measurements.
NITROGEN often limits forest growth and productivity(Keeney, 1980). The importance of N in site pro-
ductivity and its responsiveness to disturbance hasprompted the design of several methods to assess potentialsoil N availability. Measurement of N mineralizationpotentials in controlled environment incubations beganin the 1940s and has been widely used ever since (Harm-sen and Lindenbergh, 1949). These methods allow deter-mination of potential N availability; however, they arecarried out in ideal environmental conditions and mayoverestimate site processes. Eno (1960) introduced the insitu buried bag incubation technique. While this methodincorporates in situ soil temperature variations into esti-mates of net N mineralization and nitrification, soil mois-ture remains unchanged during the incubation period.Adams and Attiwill (1986) developed the in situ coveredcore method for soil N mineralization measurements.Their system uses perforated PVC tubes covered withpetri dishes, which allows soil moisture as well as temper-ature to equilibrate with the surrounding soil environ-ment. Soil solution collection using tension porous cuplysimeters and ion exchange resin bags have also beenused to estimate N availability (Hansen and Harris, 1975;Binkley and Matson, 1983; Montagnini et al., 1986).
Binkley and Hart (1989) extensively reviewed the liter-ature to identify the strengths and weaknesses of mostmethods for determining N availability. There have alsobeen numerous studies comparing two or three methods(Binkley and Matson, 1983; Montagnini et al., 1986;Adams and Attiwill, 1986; Raison et al., 1987; Binkleyet al., 1986; Carlyle and Malcolm, 1986; Fyles et al.,
USDA Forest Service, Coweeta Hydrologic Lab., 999 Coweeta LabRoad, Otto, NC 28763. Received 28 July 1994. "Corresponding author([email protected]).
Published in Soil Sci. Soc. Am. J. 59:1750-1754 (1995).
1990; Hart and Firestone, 1989; Hill and Shackleton,1989). However, these comparisons were limited by thenumber of methods tested or by the sites on which theywere tested.
This study compared four methods of determining Navailability: measurement of net N mineralization(NH^-N plus NC>3~-N production) and net nitrification(NC>3+-N production) using in situ covered cores, in situburied bags, and aerobic laboratory incubations and soilsolution concentrations of NH/-N and NO3~~-N collectedusing tension lysimetry. All measurements took placeconcurrently during the growing season on treated andcontrol plots in a fell and burn forest regeneration experi-ment. These plots provided a wide range of N transforma-tion rates and environmental conditions. The objectivewas to compare the methods to: (i) test the hypothesisthat all methods discriminate between treatment effectsand that soil incubation data are interchangeable, and(ii) examine the relationship of soil incubation methodswith lysimeter N, extractable soil N, and soil temperatureand moisture.
MATERIALS AND METHODSSite Description
We selected two sites from a fell and burn treatment experi-ment already underway in the southern Appalachians (Swiftet al., 1993). The sites, Jacob Branch East (JE) and JacobBranch West (JW), are located in the Wayah Ranger Districtof the Nantahala National Forest in the southern Blue RidgeMountains of western North Carolina. Both sites have a southto southwesterly aspect and are occupied by the Cowee-Evardsoil series complex. The soils are classified as fine-loamy,mixed-oxidic, mesic Typic Hapludults, but they show signsof disturbance with shallow or mixed A horizons. Soil samplingwas restricted to the top 10 cm, a depth that corresponds tothe A, AB, and B horizons or a mixture of all three horizons.The sites are characterized by a pine-hardwood overstory anda dense mountain laurel (Kalmia latifolia L.) understory thatinhibits regeneration of the overstory species. The combinationof drought, oak (Quercus sp.) decline, and the southern pinebeetle has degraded the sites (Vose and Swank, 1993). Thesilvicultural prescription is designed to regenerate a mixedpine-hardwood forest. The first step was to fell all woodyvegetation and allow it to cure; second, burn the site underenvironmental conditions appropriate for a high-intensity, low-severity fire; and third, plant the site with white pine (Pinusstrobus L.) on wide spacing (4 by 4 m).
Sampling DesignIn summer 1989, Swift et al. (1993) established nine 15 by
33 m plots on each of the two sites; five plots were locatedon the treatment areas and four control plots were on adjacentundisturbed areas. Trees and shrubs were cut in June and July1990, and the sites were burned in September 1990. Themethods comparison experiment was performed the first grow-
Abbreviations: PVC, polyvinyl chloride; JE, Jacob Branch East; JW,Jacob Branch West; TDR, time domain reflectometry.
1750

KNOEPP & SWANK: COMPARISON OF AVAILABLE SOIL N ASSAYS 1751
ing season after site treatment (1991) during three concurrent28-d periods in May, July, and September.
On each plot (n = 18), two transects were established onthe 33-m plot axis that corresponded with the topographiccontour. Transects were 1 m apart and began at a randomlyselected plot corner. Paired in situ incubations were carriedout, one on each transect. All soil samples were collectedusing PVC cores 4.3 cm in diameter and 15 cm long. Coreswere driven into the soil to a depth of 10 cm, 25 cm apart.At t = 0, two cores of soil were collected, one from eachtransect. The soil was cooled, returned to the laboratory, andstored at 4°C until processed within 48 h. The two soil sampleswere composited by plot and sieved to <6 mm. Five gramsof fresh soil were shaken for 1 h in 2 M KC1 at a 1:4 soil/extractant ratio and then centrifuged at 3715 X g (6000 rpm)for 15 min. The NOf-N and NIU-N concentrations in KC1solutions were determined on an autoanalyzer (Technicon In-struments Corp.1, Tarryton, NY) using the hydrazine sulfatereduction (U.S. Environmental Protection Agency, 1983) andalkaline phenol (Technicon Instruments Corp., 1971) methods,respectively. The total weight of soil (<6 mm) in the two coreswas measured for bulk density determination. Soil N contentand rates of N transformation are reported on a 105 °C oven-dryweight basis. The t = 0 NO3~-N and NH4
+-N concentrationswere used for all soil incubation methods.
In Situ Covered Core IncubationWe used the covered core in situ incubation method of
Adams and Attiwill (1986) and Adams et al. (1989) modifiedby using unperforated PVC cores. At t = 0, two PVC soilcores, one on each transect, were capped with PVC pipe capsand left in the field. After 28 d, the cores were collected andprocessed as described above (t = 1). The modification wasintended to make the moisture content of the in situ coveredcore method more comparable with the in situ buried bagmethod as described by Matson and Vitousek (1981). In theburied bag technique, PVC cores were used to collect the soil.The soil was removed from the core with minimal disturbance,placed in a bag, and returned to the collection point. Buriedbags have a distinct disadvantage in that the soil moisturecontent remains unchanged during the incubation period. Theresult is often incubating soil that is extremely wet or dryunless one chooses sampling days when soil water content isoptimized. This makes the PVC cores more suitable for insitu measurements. We found that even without perforations,soil moisture content within the core changes during the incuba-tion period. Capillarity moves water into the cores, and sincethe cores were not tightly sealed, evaporation results in somewater loss. The resulting net soil moisture changes within thePVC cores, as measured gravimetrically at t = 0 and t = 1,were lower but positively correlated with net plot soil moisturechanges measured weekly with TDR during the same 28-dperiod (Topp et al., 1980). These measurements would notbe expected to correlate precisely since cores are 10 cm long,while the TDR readings are for the surface 30 cm of soil.The slope of this regression was 0.57 (P = 0.0001) with a1.7 intercept (r2 = 0.38, n = 249). Decreased net moisturechanges within the core were expected since the core preventedplant water uptake and inputs were limited to capillary watermovement. The correlation analysis used soil core gravimetricmoisture content converted to volumetric moisture contentusing bulk density measurements.
1 The use of trade or firm names in this publication is for readerinformation and does not imply endorsement by the U.S. Department ofAgriculture for any product or service.
In Situ Buried Bag IncubationBuried bag in situ incubations were carried out as described
by Matson and Vitousek (1981). Two intact 10-cm soil coreswere collected using the sampling procedure and PVC tubesdescribed above, one from each transect. Soil cores wereplunged from the PVC tube into 15 by 15 cm, 0.072-mm-thick,interlocking polyethylene bags. The bags were sealed andreturned to the hole, then collected after 28 d. Gordon et al.(1987) found that polyethylene bags with thickness rangingfrom 0.015 to 0.032 mm had no effect on N mineralization.While these bags are considerably thicker, rates of N mineral-ization in bags were comparable to covered core and laboratoryincubations, suggesting that gas permeability was adequate.
Aerobic Laboratory IncubationOne 50-g sample of each composite t = 0 soil (sieved <6
mm) was placed in a 0.95-L canning jar, and the moisturecontent was adjusted. The desired moisture content was 45 %for JW and 30% for JE, which is equivalent to -0.03 MPapressure measured on intact A horizon soil cores. Soil plusjars were covered tightly with 0.01-mm-thick plastic wrap, toallow gas exchange with minimal water loss, and weighed.Soils were incubated at 20°C for 28 d; this was approximatelyequal to the maximum 10-cm soil temperature. Water was addedweekly as necessary to maintain constant moisture content.
Tension LysimetersTwo porous-cup tension lysimeters were installed on each
of the four control and five treated plots, one at a depth of30 cm and one at 60 cm. Lysimeter placement was determinedusing the pedon description for the Cowee-Evard soil types(USDA Natural Resource Conservation Service, 1993). Lo-cated above the Bt horizon and within the rooting zone, the30-cm lysimeter was intended to estimate nutrients in soilsolution available to plants. The 60-cm lysimeter was locatedbelow the main rooting zone and Bt horizon to collect soilsolution potentially leaving the site. Solution samples werecollected weekly, at which time lysimeters were evacuated to-0.03 MPa. Analyses of soil solutions for NO3~ and NH4
+
were performed on volume-weighted monthly composite sam-ples using the autoanalyzer methods described above.
Environmental ParametersSoil temperature was measured weekly at 10 cm in each
plot with a digital meter and thermistor probe. Soil moisture,percentage by volume at 0 to 30 cm was measured weekly oneach plot using the TDR method (Topp et al., 1980). Dataused in correlation analyses were both t = 0 and mean monthlysoil temperature and moisture values.
Statistical AnalysisStatistical analysis of the data was conducted with several
objectives. The first objective was to determine the ability ofeach method to discriminate the effect of the burn treatmenton net N mineralization and nitrification or on the other Navailability indices. The f-test analysis was used on data foreach method using the Mest procedure of SAS (SAS Institute,1985). Variance homogeneity was tested with a folded F statis-tic. When variances were unequal, approximate Mest andSatterthwaite's approximation for computing degrees of free-dom were used (SAS Institute, 1985). The second objectivewas to compare the results of the three soil incubation methods.The SAS general linear models procedure was used to perform

1752 SOIL SCI. SOC. AM. J., VOL. 59, NOVEMBER-DECEMBER 1995
an analysis of variance that compared rates of net N mineraliza-tion and nitrification for the in situ buried bag, covered core,and laboratory incubations. The third objective was to examinethe relationship between the soil incubation methods and lysim-eter N, extractable soil N, and soil climate. Correlations wereconducted with data from both treated and control plots usingPearson standard and Spearman rank correlation analyses (SASInstitute, 1985).
RESULTS AND DISCUSSIONTreatment Effect Discrimination
All methods, soil incubations, extractable soil N, andsoil solution N, measured significantly greater (P < 0.1)net N mineralization rates, and NOf-N + NH^-N con-centrations in the prescribed burn plots compared withthe control plots (Fig. 1). This was also the case for netnitrification rates and NOf-N concentrations in soils andsoil solution (P < 0.1) with the exception of in situ buriedbags (P — 0.35; Fig. 1). Elevated N transformation ratesfollowing site disturbance are well documented (Burger
TJ
CO '
enZ -*
o> 1
0
[ [Control
BB CC Lob Nm,n SS30 SS6Q
co<N
a-C
-1BB CC Lab
MethodN03 SS30 SS60
0.05
0.04
0.03 '_,Z
0.02 enE
0.01
0.00
0.05
0.04
0.037
0.02 zen
0.01 E
0.00
-0.01
Fig. 1. Means for prescribed burn and control plots for (A) mineraliza-tion and (B) nitrification indices. Mineralization indices include insitu buried bag (BB), in situ covered core (CC), and laboratoryincubation (Lab) rates of net NH/-N plus NOj"-N production,/ = 0 NH4
+-N plus NOf-N (Nmin) concentration, and soil solutionconcentrations of NH4
+ - plus NO3" -N collected at 30 (SSM) and 60cm (SSM). Nitrification indices include in situ BB, in situ CC, andLab rates of net NOf -N production, t = 0 NO3" -N (NO3) concentra-tion, and soil solution concentrations of NO.f -N collected at SSjoand SSm. Values represent means of three dates for two sites onburn (n - 30) or control (n - 24) plots. *,*,* Significant differencebetween burn and control plot means at P < 0.1, 0.05, and 0.01,respectively. Soil incubation burn or control plot means with differ-ent letters indicate significant differences between methods (P <0.05).
and Pritchett, 1984; Knoepp and Swank, 1993). Signifi-cant site and treatment differences in N availability havebeen measured with laboratory incubations, in situ incu-bations (both buried bag and covered core), lysimeters,and various chemical methods (Adams and Attiwill,1986; Carlyle and Malcolm, 1986; Montagnini et al.,1986; Hart and Firestone, 1989; Binkley and Matson,1983).
The three soil incubation methods gave similar resultsfor mean net N mineralization rates on both the prescribedburn and control plots (Fig. 1). However, rates of netnitrification measured in burn-plot soils using laboratoryincubation were significantly greater than rates measuredwith in situ incubations.
Although mean rates of net N mineralization did notdiffer among soil incubation techniques, they were notwell correlated. Covered core and buried bag in situmeasurements of net N mineralization showed the onlysignificant correlation (r = 0.40; P = 0.002). Net nitrifi-cation rates measured using the three soil incubationmethods also showed no significant correlation (P <0.1). These results differ from earlier studies, whichshowed a better correlation for indexes of NOf availabil-ity than for indexes of NH/ availability (Hart and Fire-stone, 1989).
Soil incubation measurements of N transformationrates had some significant relationships with the othermeasurements of N availability. Soil solution concentra-tions of NO3~-N and NO3~-N plus NH^-N correlatedwell with all rates of N transformations, with the excep-tion of buried bag nitrification (Table 1). Previous re-search has also shown that soil solution collections aregood indicators of N availability and potential leachinglosses (Hansen and Harris, 1975; Montagnini et al.,1986; Hill and Shackleton, 1989). Net mineralizationmeasurements were also correlated with soil inorganicN content at the time of sampling, with r values rangingfrom 0.28 to 0.60 (Table 1). While this general relation-ship has been identified in other studies (Donaldson andHenderson, 1990; Knoepp, 1994, unpublished data), thedifference in controlling factors, makes extractable soilN concentration a poor predictor of N transformationrates.
Method Response to Soil ClimateSample date affected the three soil incubation measure-
ments of net N mineralization at P = 0.006 for coveredcore, 0.08 for buried bag, and 0.11 for laboratory incuba-tions. The date effect is probably related to observedvariations in soil temperature and moisture. Net N miner-alization rates were correlated with soil temperature at10 cm for all soil incubation methods (Table 1). Adamsand Attiwill (1986) measured net N mineralization insitu and in the laboratory for eight eucalypt forests in awide range of climates and soil types. Both methodsidentified site differences but only the in situ incubationsproduced seasonal patterns of mineralization. This resultwas attributed to field temperature fluctuations. Carlyleand Malcolm (1986) found greater rates of net N mineral-ization for laboratory-incubated soil samples than for in

KNOEPP & SWANK: COMPARISON OF AVAILABLE SOIL N ASSAYS 1753
Table 1. Correlation coefficients between buried bag (BB), covered core (CC), and laboratory (Lab) measurements of net N mineralization(Min) and nitrification (Nit) and soil solution N (ing N L~') from 30- and 60-cm lysimeters, initial soil NO.f and NH4
+ plus NO.fcontent, soil temperature, and soil moisture (values in parentheses represent probability of values greater than r).__________
Soil N transformation measurementsOther parameters
Lysimeter, 30 cmLysimeter, 60 cmNOf, k g N h a - 'NH4
+ + NO3-, m g N k g - 'Soil temperature at 10 cm, °CH20, g kg-', t = 0
BB-Min
0.28 (0.05)0.32$ (0.02)
na§0.49$ «0.01)0.52$ (<0.01)3.2 (0.02)
CC-Min
0.57 (<0.01)0.53 (<0.01)
na0.28 (0.04)0.37$ (<0.01)
ns
Lab-Min0.29 (0.03)0.39 (<0.01)
na0.60 (<0.01)0.36 (<0.01)
ns
BB-Nit
nstns
- 0.34$ (0.01)nsns
3.6 (<0.01)
CC-Nit
0.53 (<0.01)0.49 (<0.01)
nsns
0.32$ (0.02)ns
LabNit
0.24$ (0.08)0.50$ (<0.01)0.42 (<0.01)0.51$ (<0.01)0.55$ (<0.01)
ns
t ns = correlation coefficients where P > 0.1.t Indicates Spearman rank correlation coefficient; all others are Pearson correlation coefficient.§ na = correlations between those variables were not performed.
situ samples. They corrected the laboratory rates fortemperature by using a Qio of 2, thereby removing thedifference. All our measurements took place during thegrowing season when average monthly soil temperaturesat 10 cm ranged from 16 to 22°C (Swift et al., 1993).
Soil water content, t = 0, was positively correlatedwith net N mineralization and nitrification only for theburied bag in situ incubation (Table 1). This agrees withthe findings of Matson and Vitousek (1981); in theirlaboratory incubations, as soil moisture increased from15 to 35%, net mineralization also increased. Soil mois-ture content did not change in the buried bags, makingthe initial moisture levels important. Net mineralizationand nitrification rates measured using laboratory andin situ covered core incubations were not significantlycorrelated (P < 0.1) to initial soil moisture, since soilmoisture changed from t = 0 levels for both. Moisturecontent was adjusted and maintained at a constant, experi-mentally derived, optimal moisture content for labora-tory-incubated soil samples. The moisture content of soilwithin the in situ covered cores, as measured gravimetri-cally at t = 0 and t = I , varied with the moisture contentof the surrounding soil, as measured weekly for eachplot using TDR (r2 = 0.38; n = 249), although netchanges were less. Capillarity results in water movementinto the core from below when bulk soil moisture in-creases. The cores are not sealed, so water can be lostby evaporation (see Materials and Methods for furtherdiscussion).
All methods tested detected differences in rates of netN mineralization and nitrification between prescribedburn and control plots. The mean rates for the three soilincubation methods were not statistically different fromeach other (data not shown). However, a pattern emergedwhen we compared the mean of individual methods tooverall mean rates of net N mineralization and nitrifica-tion. For the control plots, all methods gave fairly uni-form results (Fig. 2). However, for the burn plots,laboratory incubation measurements of N transformationrates were consistently the greatest, while the in situcovered core method gave values below overall meanrates. Laboratory incubations are performed under near-optimal conditions of soil temperature and moisture,which may result in elevated N transformation rates. Incontrast, in situ incubations are conducted under ambientenvironmental conditions, which frequently are not ideal.
Our results show that all the methods examined areadequate for identifying treatment differences in indexesof N availability. However, their poor correlation indi-cates the need for caution when comparing N transforma-tion rates measured by different methods. We believethat N transformation rates measured using the coveredcore in situ incubation method best reflects site N trans-formation rates. Of the methods tested, this methodbest incorporates site-specific temperature and moisturevariations into net N mineralization and nitrification mea-surements.
1.0_ 0.827" 0.6> ~° 0.4O a,o> CM 0.2c 7 0.0E ° -0.2"g 2-0.4
* 5-°-83 -0.8
-1.0
2.0
= 1.5
S -̂o 1.0O co™ ^ 0.5
(BurnIControl L
BB CC Lab
c i0.0
-0.5
'-1.0
-1.5
rBB CC Lab
Fig. 2. Means for each soil-based method minus the overall mean forall soil incubation measurements of net (A) N mineralization and(B) nitrification. Methods include in situ buried bag (BB), in situcovered core (CC), and aerobic laboratory (Lab) incubations. Over-all means of all soil incubations are 3.5 and 0.8 kg N ha~' 28 d~'net N mineralization and 1.5 and 0.04 kg N ha'1 28 d~' netnitrification for prescribed burn and control plots, respectively.

1754 SOIL SCI. SOC. AM. J., VOL. 59, NOVEMBER-DECEMBER 1995
ACKNOWLEDGMENTSThe authors thank Jim Vose, Anthony Federer, and Bruce
Haines for helpful reviews of this manuscript; Lee Reynoldsand Elizabeth Lindsay for their field and laboratory assistance;and Patsy Clinton for collection and management of lysimeter,temperature, and moisture data.