Embed Size (px)
Citation preview

UEMK 2019 Proceedings Book
24/25 October 2019 Gaziantep University, TURKEY 462
COMPARISON OF CAPITAL COST FLOWS OF 1 MW SOLAR
POWER PLANT WITH AND WITHOUT SOLAR TRACKING
SYSTEM
Mert Gürtürk
Department of Energy Systems Engineering, Technology Faculty, Fırat University, 23119 Elazig, Turkey, [email protected]
ABSTRACT: In this study, the cost analysis is used to determine the capital cost flow of two different solar power plants. PV panels at one of these solar power plants are located at fixed collector angle, whereas the other one with the same operating conditions has a solar tracking system. Although both PV solar power plants operate under similar conditions, there are many differences in terms of economic parameters. These parameters can be used for the economic feasibility of solar power plant for investors. Some of these parameters are capital cost flow, operation and maintenance cost, total capital investment, present value factor, annual capital cost, salvage value. The results obtained from both economic analyzes were compared according to the parameters considered. Keywords: Economic analysis; solar power plant; renewable energy; solar energy INTRODUCTION
The investment costs of the solar power plant are very important for investors. However, studies about economic analysis of solar power plants are very rare and investments in solar power plants are increasing in many parts of the world. Generally, economic analysis about solar power plant based on the PV module is carried out by big organizations, councils and intuitions. One of those reports about economic analysis worldwide is published by The World Energy Council. That organization publishes very detail report on solar energy in every year. In that report, many parameters are considered such as solar energy, information about the sector, the latest economic data and so on (Khetarpal, 2016). In the same perspective, The European Union is also publishing a similar report. In that report, up-to-date information on the solar energy sector in the European Union member countries is shared. Also, evaluation of policies of the other countries on solar energy can be found in that report (Jäger-waldau, 2016). Reports of national institutes on the solar energy sector can be found in the literature. Those reports are handled mainly economic data and policies of investors, governments and producers. One of those national institutes is the National Renewable Energy

UEMK 2019 Proceedings Book
24/25 October 2019 Gaziantep University, TURKEY 463
Laboratory. That institute has shared the latest technological developments, studies about the solar cell, economic data and recent investments on a national basis (National Renewable Energy Laboratory, 2018). However, those institutions and councils are not considering specific economic data. For example, levelized cost analysis is used for determining capital cost flows of two different solar power plants. In the previous study, one of these solar power plants was designed as PV panels placed at fixed collector angle (Gürtürk, 2019). The other solar energy plant considered in this study is designed with a solar tracking system. In the literature, many studies about the solar tracking system can be found (Mousazadeh et al., 2009). Those studies are about novel solar tracking system design, tracking the sun at low error rates, advantages and disadvantages of solar tracking systems and so on. For example, researchers have studied on passive solar tracking (Clifford & Eastwood, 2004) and they said that azimuth-elevation and tilt-roll tracking mechanism method have been most used (Chong & Wong, 2009). As can be seen, any study about economic advantages and disadvantages of solar tracking systems cannot be found in the literature. However, very limited analysis which was about the economic benefits of solar tracking system has been carried out in the literature (Bhagat, 2016). MATERIAL AND METHODS
The levelized cost analysis considers many economic parameters. These parameters show capital cost flow, cost of operating and maintenance, total capital investment, present value factor, annual capital cost, salvage value. These parameters are calculated as follows, Z&is the capital cost flow (Bejan, Tsatsaronis, & Moran, 1996; Gürtürk, 2019; Gürtürk, Oztop, & Hepbasli, 2015). CI OMZ Z Z & & (1) where CIZ& is the hourly levelized cost of capital investment. OMZ& is the hourly levelized cost of operating and maintenance of the solar power plant.
CI ACZ
& (2)
Hourly levelized operating and maintenance cost ( OMZ& ) is calculated by using Eq. (3) (Bejan et al., 1996; Gürtürk, 2019; Gürtürk & Oztop, 2016; Gürtürk et al., 2015).
OM OMZ
& (3)
Many parameters are considered for the levelized cost analysis and these parameters are shown in Table 1 (Gürtürk, 2019). Table 1. Economical parameters of solar power plants with and without a solar tracking system for 1 MW power (US$) (Gürtürk, 2019)
Without a solar tracking system With a solar tracking system

UEMK 2019 Proceedings Book
24/25 October 2019 Gaziantep University, TURKEY 464
Parameters
PV modules (270 W) 594,000.00 594,000.00 Inverter
98,600.00
98,600.00
Other system components
237,726.00
237,726.00
Other costs
226,437.00 226,437.00
Solar tracking system
-
115,676.33
TOTAL COST
1,156,763.34
1,272,439.67
These costs parameters considered in the study may vary. For example, land structure, panel type used and transportation costs may affect initial investment costs. At the same time, the variability of global economic parameters should be considered. Especially when macroeconomic parameters are considered, their effects on costs may vary. In summary, it should be noted that the values in table 1 are not constant and depend on the reasons explained above. RESULTS AND DİSCUSSİON
In this study, a levelized cost analysis was carried out for determining capital cost flows of two different solar power plants which are designed as PV panels placed at fixed collector angle and with solar tracking system. Considering the data in Turkey, foreign currency loan interest rates for both system are taken into consideration as 6%. Results obtained from the economic analysis shows in Table 2. Table 2. Results obtained from the economic analysis (US$)
Parameters
Without a solar tracking system
With a solar tracking system
Present worth 1,130,855.909 1,272,439.67 Salvage value 115,676.344 127,243.96 Present value factor 2.28E-08 2.28E-08 Effective discount rate 6% 6% Annual capital cost 89,878.39 98,866.22 Capital recovery factor 0.079 0.079 Hourly levelized cost of capital investment
10.26 (US$/h)
11.28 (US$/h)
Hourly levelized cost of operating and maintenance
5.79 (US$/h)
7.84 (US$/h)
Capital cost flow 16.05 (US$/h) 19.13 (US$/h)

UEMK 2019 Proceedings Book
24/25 October 2019 Gaziantep University, TURKEY 465
It can be said that the initial investment cost is high for both systems. However, it is seen that the initial investment cost of a solar energy plant which has a solar tracking system, is higher. Many published reports indicate that prices are still high due to the need for raw materials in the production of photovoltaic panels. Although the initial investment cost of solar power plants is high, the cost of a power plant with a solar tracking system seems to be the most important barrier. Also, the costs of operating and maintenance of the solar tracking systems are high too. It is observed that the solar tracking systems increase the total power output at a rate between 20 - 40% (Samsamoddin Naghavi Chalehtori & M. Funde, 2015). When solar power plants are considered according to economic values, the most important parameter is the first investment cost. The investors want to decrease this parameter, and they chose solar power plants which are designed as PV panels placed at fixed collector angle. Results obtained from the analysis show that capital cost flow of the solar power plant which is designed as PV collectors placed at fixed collector angle is 16.05 (US$/h). The capital cost flow of the other system which is designed solar tracking system is 19.13 (US$/h). When costs of operating and maintenance of both systems are compared, cost of operating and maintenance of the solar power plant which is designed solar tracking system is higher. Costs of operating and maintenance of both systems were calculated as 5.79 (US$/h) for the fixed system (Gürtürk, 2019) and 7.84 (US$/h) with a solar tracking system. When present worthies of
both systems are compared, it was calculated as 1,130,855.909 (US$) for the fixed system and 1,272,439.67 (US$) with the solar tracking system. Actually, there is no significant difference between the two values. If a solar tracking system is used in the solar power plant, increasing 19% at capital cost flow of the system and increasing 35.4% at an hourly levelized cost of operating and maintenance occurs. More detailed analysis can be found in the literature. According to the cost situation, the level of investment feasibility was determined by using different methods. There is no significant difference between the systems where PV panels are fixed and combined with a single axis solar tracking system. However, dual-axis solar tracking systems cause significant differences (Honrubia-Escribano et al., 2018). The effect of these differences on initial investment cost and maintenance operating costs was clearly seen in this study. However, the investability of PV power plants integrated with fixed and dual-axis solar tracking systems varies depending on the capacity. The location where the power plant will be installed has a great impact on these parameters. When the installed capacity of the solar power plant increases, the investment viability of the solar tracking system increases. S If this factor is taken into consideration, preferring solar tracking system in solar power plants with an installed capacity of 1 MW will provide significant advantages. However, in developing countries, solar tracking systems are generally not preferred due to efforts to reduce initial investment costs and lack of incentives for solar tracking systems.

UEMK 2019 Proceedings Book
24/25 October 2019 Gaziantep University, TURKEY 466
CONCLUSIONS
In this study, levelized cost analysis is used for determining capital cost flows of two different solar power plants and conclusion obtained from this study are illustrated following, • Solar tracking system causes a significant increase at an hourly levelized cost of operating and maintenance. This increasing is 35.4%. • The capital cost flow of the solar power plant which is designed solar tracking system is calculated as 19.13 (US$/h). • The annual capital cost of the solar power plant which is designed solar tracking system is 98,866.22 (US$). • When present worthies of both systems are compared, there is no significant difference between the values. The solar power plant which is designed solar tracking system is 1,272,439.67 (US$). This study can be combined with any solar radiation forecasting methods for determining net profit and costs of both systems. REFERENCES Bejan, A., Tsatsaronis, G., & Moran, M. (1996). Thermal Desgn and Optimization. New York: John Wiley & Sons. Bhagat, A. K. (2016). An Analysis of Economic Benefits of Solar Tracking Systems, 3(07), 48–51. Chong, K. K., & Wong, C. W. (2009). General formula for on-axis sun-tracking system and its application in improving tracking accuracy of solar collector. Solar Energy, 83(3), 298–305. https://doi.org/10.1016/j.solener.2008.08.003 Clifford, M. J., & Eastwood, D. (2004). Design of a novel passive solar tracker, 77, 269–280. https://doi.org/10.1016/j.solener.2004.06.009 Gürtürk, M. (2019). Economic feasibility of solar power plants based on PV module with levelized cost analysis. Energy, 171, 866–878. https://doi.org/10.1016/j.energy.2019.01.090 Gürtürk, M., & Oztop, H. F. (2016). Exergoeconomic analysis of a rotary kiln used for plaster production as building materials. Applied Thermal Engineering, 104, 486–496. https://doi.org/10.1016/j.applthermaleng.2016.05.106 Gürtürk, M., Oztop, H. F., & Hepbasli, A. (2015). Comparison of exergoeconomic analysis of two different perlite expansion furnaces. Energy, 80, 589–598.
https://doi.org/10.1016/j.energy.2014.12.015 Honrubia-Escribano, A., Ramirez, F. J., Gómez-Lázaro, E., Garcia-Villaverde, P. M., Ruiz-Ortega, M. J., & Parra-Requena, G. (2018). Influence of solar technology in the economic performance of PV power plants in Europe. A comprehensive analysis. Renewable and

UEMK 2019 Proceedings Book
24/25 October 2019 Gaziantep University, TURKEY 467
Sustainable Energy Reviews, 82(July 2017), 488–501. https://doi.org/10.1016/j.rser.2017.09.061 Jäger-waldau, A. (2016). PV Status Report 2016. https://doi.org/10.2790/749737 Khetarpal, D. (2016). World Energy Resources: Solar 2016. World Energy Council, 78.
Retrieved from https://www.worldenergy.org/wp-content/uploads/2017/03/WEResources_Solar_2016.pdf Mousazadeh, H., Keyhani, A., Javadi, A., Mobli, H., Abrinia, K., & Sharifi, A. (2009). A review of principle and sun-tracking methods for maximizing solar systems output, 13,
1800–1818. https://doi.org/10.1016/j.rser.2009.01.022 National Renewable Energy Laboratory. (2018). efficiency-chart @ www.nrel.gov. Retrieved February 16, 2018, from https://www.nrel.gov/pv/assets/images/efficiency-chart.png Samsamoddin Naghavi Chalehtori, S., & M. Funde, A. (2015). Econometric analysis of solar tracker systems in India , a case study. International Jounrnal of Applied Engineering Research, 10(April), 31590–31593.
UEMK 2019 Proceedings Book
24/25 October 2019 Gaziantep University, TURKEY 468
ESTIMATION OF GREENHOUSE GAS EMISSION FROM A
DISSOLVED AIR FLOTATION TANK
Pelin YAPICIOĞLU Harran University [email protected]
ABSTRACT: Greenhouse gases emissions have been increased, in recent years. One of the greenhouse gases emission resources is the industrial wastewater treatment plants. Dissolved air flotation process is implemented for fats, oil and grease and organic material removal from industrial wastewater. Dissolved air flotation tank is one of the main greenhouse gas emitter units in a dairy industry wastewater treatment plant. In this study, the off-site greenhouse gas emissions of a DAF tank located in a dairy wastewater treatment plant were estimated. The off-site emission was estimated from chemical consumption and electricity consumption. This paper aims to determine the off-site
emissions for dissolved air flotation process in a dairy wastewater treatment plant. The results revealed that electricity consumption was the major source of the off-site greenhouse gas emission in the tank with the value of 3752.35 kg CO2e/d. The off-site emission due to the chemical use was 119.51 kg CO2e/d. Total off-site emission was 3871.86 kg CO2e/d. Key words: greenhouse gas, wastewater treatment plant, DAF, off-site emission. INTRODUCTION
Greenhouse gases emissions have been increasing in the atmosphere because of the industrial, domestic and anthropogenic activities in last decades (Kyung et al., 2015). Wastewater treatment plants have been regarded as one of the greenhouse gases emissions resources in recent year (Kyung et al., 2015; Corominas et al., 2012; Yerushalmi et al., 2013; Yapıcıoğlu, 2018). Carbon dioxide (CO2) and methane (CH4) and nitrous oxide (N2O) are the main greenhouse gases emitting from wastewater treatment plants due to the applying treatment process (biological, chemical or biochemical processes etc), sludge dewatering and stabilization process (incineration, anaerobic digestion, composting etc.), chemical use (added chemical materials for wastewater and sludge treatment process (coagulants, flocculants), for nitrification and denitrification (methanol, etc.), for alkalinity and pH adjustment), energy consumption (electricity consumption, air

UEMK 2019 Proceedings Book
24/25 October 2019 Gaziantep University, TURKEY 469
consumption, etc.), and maintenance and transport activities (Kyung et al., 2015; Metcalf and Eddy, 2014; Yapıcoğlu, 2018). Greenhouse gases emissions can be categorized as the on-site emissions and the off-site emissions (Parravicini et al., 2016; Yapıcıoğlu, 2018). The on-site emissions in the plants are the emitting emissions in the sewage collection system, the emissions in the result of the existing treatment processes and the emissions in the discharge point of the treated water. The off-site GHGs emissions are formed by the electricity consumption, air consumption, transportation, chemical use and sludge stabilization and disposal process (Parravicini et al., 2016; Yapıcıoğlu, 2018). In particular, the industrial wastewater plants emit the large amounts of greenhouse gas emissions because of highly organic wastewater content and applying treatment processes. The dairy industry is one of them. The dairy industry is one of the most pollutant plants due to the wastewater generated and discharging highly organic wastewaters (Ozturk et al., 2003; Demirel et al., 2005). Chemical oxygen demand (COD), fats, oil and grease (FOG) and total suspended solids (TSS) are the major pollution indicators of the dairy wastewaters. (Speece, 1996; Yapıcıoğlu &Filibeli, 2017). The dairy wastewater has a highly organic content and fats
oil and grease concentration. Dissolved Air flotation (DAF) is widely used for FOG removal from dairy wastewater. Falletti et al., 2014; Pereira et al., 2018). DAF process is applied before the secondary treatment which generally tends to be anaerobic treatment configurations (Castillo et al., 2017). Dissolved air flotation process is a type of flotation process that separates fats, oils and grease and other organic substances from wastewater (Behin & Bahrami, 2012; Chung et al., 2000). The most significant parameters in order to obtain high treatment efficiencies in DAF involve determining the volume of microbubbles occurring in the DAF tank and the coagulation and flocculation processes that depend on the pH of the media, the doses and the types of coagulants and flocculants (alum, ferric chloride etc.) used (Pereira et al., 2018; Edzwald, 2010). In this study, the off-site greenhouse gas emissions of a DAF tank located in a dairy wastewater treatment plant were estimated. The off-site emission was estimated from chemical consumption and electricity consumption. The main aim of this study is to estimate the off-site emissions for dissolved air flotation process in a dairy wastewater treatment plant. METHODS Description of the Dairy Industry

UEMK 2019 Proceedings Book
24/25 October 2019 Gaziantep University, TURKEY 470
The dairy industry is located in an organized industrial zone in Turkey. The main products are drinking milk, fruit juice, cream, milk powder, yoghurt and butter. The wastewater characterization of the dairy industry is given in Table 1. The wastewater analysis results were obtained using Standard Methods (APHA 1999). The wastewater treatment plant is a full-scale plant.
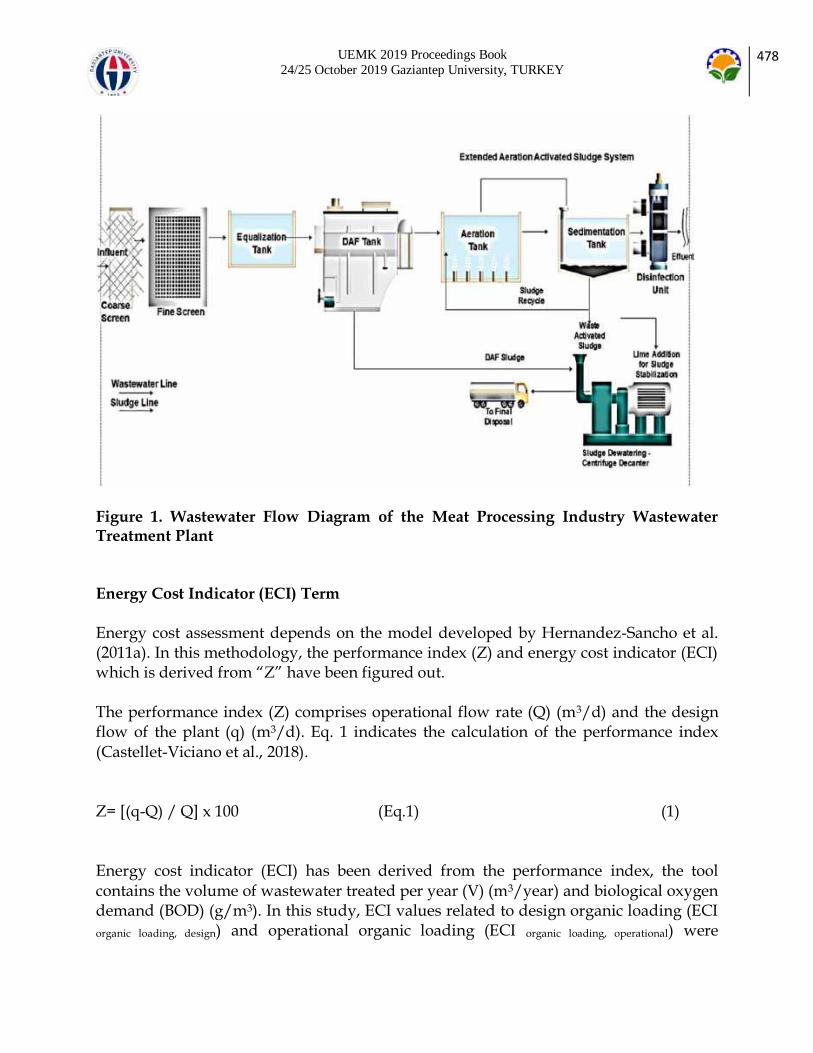
Figure 1 demonstrates the wastewater treatment process flow scheme in the plant. In DAF process, fats, oil, grease and suspended organic materials removal have been obtained. After wastewater is treated, then the effluent is discharged to the Organized Industrial Zone Central Sewage System. Table 1. Influent Dairy Wastewater Characterization
Parameter Value
COD (mg/L) 12000 FOG (mg/L) 350 TSS (mg/L) 350 pH Flow Rate (Q) (m3/d)
6 2100
Figure 1. Wastewater Flow Scheme of the Dairy Industry WWT Dissolved Air Flotation Process

UEMK 2019 Proceedings Book
24/25 October 2019 Gaziantep University, TURKEY 471
DAF systems are designed and planned to remove suspended solids, carbonaceous materials, and fats, oil and grease from a wastewater mass. Pollutant substances are treated with the use of dissolved air in a wastewater system generated by injecting air under high pressure into a recycle stream of clarified DAF effluent by a blower. This recycle stream is then mixed with the inlet in an internal contact tank where the dissolved air comes out in the form of the bubbles that attach to the pollutants (Metcalf & Eddy, 1991). The bubbles and organic materials rise to the tank surface and form a floating bed of material that is removed by a surface skimmer. The principles of dissolved air flotation (DAF) are bubble formation and size, bubble-particle interactions, measures of supplied air, and modeling of the reaction and clarification zones of the flotation tank (Edzwald, 2010). The feed wastewater of the DAF tank is often supported with a coagulant such as ferric chloride or aluminum sulfate, polyaluminum chloride (PAC) etc. to agglomerate the colloidal particles, and a flocculant (polyelectrolyte etc.) to conglomerate the particles into heavier flocks. In this study, a DAF tank was continually operated in a full-scale wastewater treatment plant under specific varying conditions to achieve the highest treatment efficiency. DAF unit is a type of cross-flow plate pack tank. In the DAF system, the ferric chloride was used as the coagulant. Table 2 shows the data used to estimate greenhouse gas emissions corresponded to the DAF tank. Table 2. Data Set of DAF Tank
Parameter
Value
Ferric chloride dose (D, mg/L) 21 Electricity consumption ( CE, kWh)
7550
Estimation of Off-site Greenhouse Gas Emissions
In this study, there are two components of off-site greenhouse gas emissions were considered. Electricity consumption for the operation of DAF tank in the WWTP was used to estimate the off-site GHG emissions. The other component is the emission from chemical use. The off-site emission corresponded to the electricity consumption was figured out by multiplying electricity consumption (CE) (kWh) of the DAF tank and the emission factor (EFelectricity) of the electricity consumption related to Turkey (kg CO2e/kWh). Electricity demand of the DAF tank was ensured from the electricity bills and the electricity meter

UEMK 2019 Proceedings Book
24/25 October 2019 Gaziantep University, TURKEY 472
in the plant. EFelectricity is 0.497 kg CO2e/kWh (IEA, 2016). The calculation model is given in Eq.1. Poff-site ,electricity= CE x EFelectricity (Eq. 1) (Kyung et al., 2015) The other off-site emission was resulted from chemical use in DAF tank. It can be estimated by means of daily chemical consumption (Mchemical) (kg/d) and the emission factor of chemical substance (EFchemical) (Kyung et al., 2015). The off-site emission can be ensured by multiplying chemical consumption and the emission factor. The emission factor of ferric chloride is 2.71 kgCO2e/kg ferric chloride (Ashrafi et al., 2013, Kyung et al., 2015, Yerushalmi et al., 2013). The off-site emission of the chemical use can be calculated via Eq.2 and Eq.3. Poff-site ,chemical= Mchemical x EFchemical (Eq. 2) (Kyung et al., 2015) Mchemical=Q x D (Eq.3) Total off-site emission is the sum of off-site emissions from electricity and chemical consumption. Eq.4 shows the calculation tool.
Poff-site= Poff-site ,electricity + Poff-site ,chemical RESULTS AND FINDINGS
The results reveled that off-site emission due to electricity consumption was higher than chemical use. It can be originated from using the blower to obtain air to operate the DAF tank. This process consumes huge amounts of electricity. The off-site emission corresponds to the electricity consumption is 96.9% of the total off-site emission.
UEMK 2019 Proceedings Book
24/25 October 2019 Gaziantep University, TURKEY 473
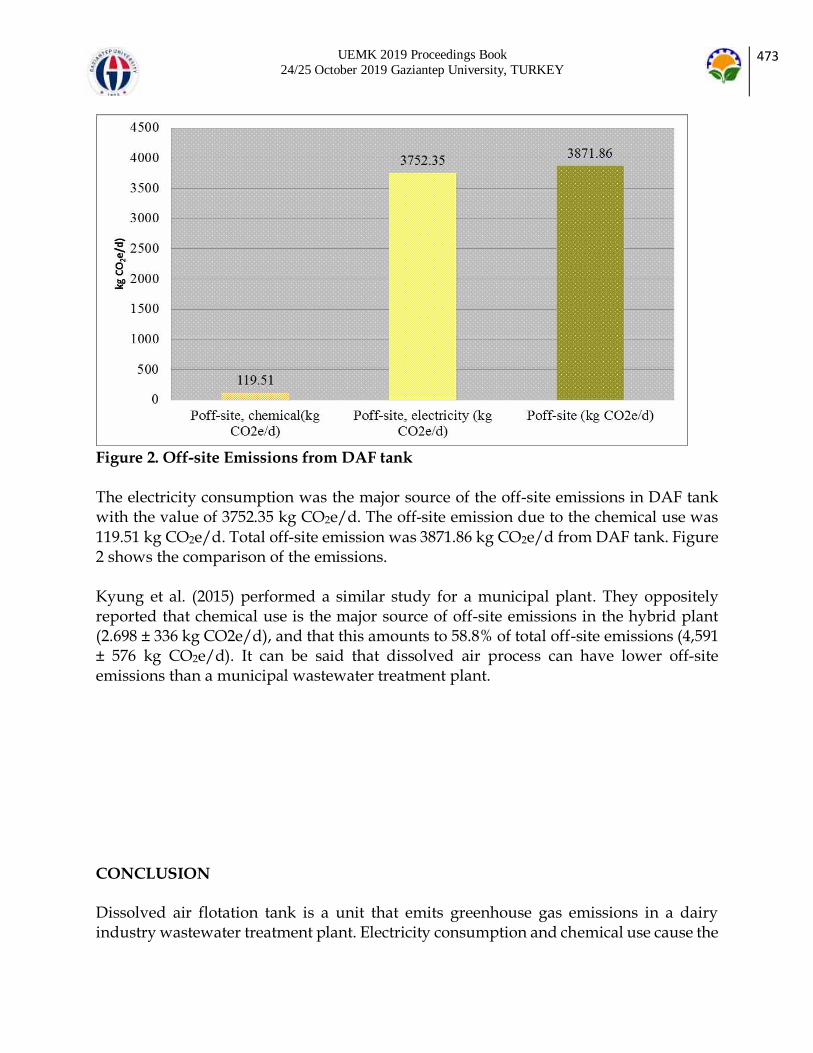
Figure 2. Off-site Emissions from DAF tank
The electricity consumption was the major source of the off-site emissions in DAF tank with the value of 3752.35 kg CO2e/d. The off-site emission due to the chemical use was 119.51 kg CO2e/d. Total off-site emission was 3871.86 kg CO2e/d from DAF tank. Figure 2 shows the comparison of the emissions. Kyung et al. (2015) performed a similar study for a municipal plant. They oppositely reported that chemical use is the major source of off-site emissions in the hybrid plant (2.698 ± 336 kg CO2e/d), and that this amounts to 58.8% of total off-site emissions (4,591 ± 576 kg CO2e/d). It can be said that dissolved air process can have lower off-site emissions than a municipal wastewater treatment plant.
CONCLUSION
Dissolved air flotation tank is a unit that emits greenhouse gas emissions in a dairy industry wastewater treatment plant. Electricity consumption and chemical use cause the
UEMK 2019 Proceedings Book
24/25 October 2019 Gaziantep University, TURKEY 474
off-site emissions in a DAF tank. Electricity consumption leads to the maximum off-site emissions with the value of 3752.35 kg CO2e/d .The off-site emission due to the chemical use was 119.51 kg CO2e/d. Total off-site emission was 3871.86 kg CO2e/d from DAF tank. Electricity consumption is the major resource of off-site emissions from DAF tank. It can be originated from using air blower in DAF tank. Electricity consumption should take under control to decrease the emissions from DAF tank. RECOMMENDATIONS
In the literature, the researches related to greenhouse gas emissions from dissolved air flotation process are limited. These researches on this topic should be increased. REFERENCES
American Public Health Association, American Water Works Association, (1999). Standard Methods for the Examination of Water and Wastewater, USA. Ashrafi, O., Yerushalmi, L. & Haghighat, F. (2013). Application of dynamic models to estimate greenhouse gas emission by wastewater treatment plants of the pulp and paper industry. Environmental Science and Pollution Research, 20(3), 1858–1869. Behin, J. & Bahrami, S. (2012). Modeling an industrial dissolved air flotation tank used for separating oil from wastewater. Chemical Engineering and Processing, 59, 1– 8. Castillo, A., Vall, P., Garrido-Baserba, M., Comas, J. & Poch, M. (2017). Selection of industrial (food, drink and milk sector) wastewater treatment technologies: a multi-criteria assessment. Journal of Cleaner Production, 143, 180-190. Chung, Y., Choi, Y.C., Choi, Y.H. & Kang, H.S. (2000). A demonstration scaling-up of the dissolved air flotation. Water Research, 34, 817–824. Corominas, L., Flores-Alsına, X., Snip, L. & Vanrolleghem, P.A. (2012). Comparison of different modeling approaches to better evaluate greenhouse gas emissions from whole wastewater treatment plants. Biotechnology and Bioengineering, 109(11), 2854–2863. Demirel, B., Yenigun, O., & Onay, T.T. (2005). Anaerobic treatment of dairy wastewaters: a review. Process Biochemistry, 40 (8), 2583–2595. Edzwald, J.K. (2010). Dissolved air flotation and me. Water Research, 44, 2077-2106. Falletti, L., Conte, L., Zaggia, A., Battistini, T. & Garosi, D. (2014). Food industry wastewater treatment plant based on flotation and MBBR. Modern Environment Science and Engineering, 1, 562-566.
Kyung, D., Kim, M., Chang, J. & Lee, W. (2015). Estimation of greenhouse gas emissions from a hybrid wastewater treatment plant. Journal of Cleaner Production, 95,117–123. Metcalf & Eddy, Inc. (1991) Wastewater Engineering: Treatment, Disposal, and Reuse. 3rd Ed., McGraw-Hill, New York.

UEMK 2019 Proceedings Book
24/25 October 2019 Gaziantep University, TURKEY 475
Metcalf & Eddy, (2014). Wastewater Engineering: Treatment and Resource Recovery 5th ed, Boston, USA, McGraw-Hill. Ozturk, I., Eroglu, V., Ubay, G. & Demir, I. (2003). Hybrid upflow anaerobic sludge blanket reactor (HUASBR) treatment of dairy effluents. Water Science and Technology, 28,
77–85. Parravicini, V., Svardal, K. and Krampe, J. (2016). Greenhouse gas emissions from wastewater treatment plants. Energy Procedia, 97, 246–253. Pereira, M.S., Borges, A.C., Heleno, F.F., Squillace, L.F.A. & Faroni, L.R.D. (2018). Treatment of synthetic milk industry wastewater using batch dissolved air flotation. Journal of Cleaner Production, 189, 729-737. Speece, R.E. (1996). Anaerobic biotechnology for industrial wastewaters, USA, Archae Press. Yapıcıoğlu, P., & Filibeli, A. (2017). Proceedings from IATS '17: The 8th International Advanced Technologies Symposiu. Elazığ, Turkey. Yapıcıoğlu, P. (2018). Greenhouse Gases Emissions Minimization of Wastewater Treatment, MSc thesis, Harran University Graduate School of Natural and Applied Sciences Department of Environmental Engineering, 96pp. Yerushalmi, L., Ashrafi, O. & Haghighat, F. (2013). Reductions in greenhouse gas (GHG) generation and energy consumption in wastewater treatment plants. Water Science and
Technology, 67( 5), 1159–1164.

UEMK 2019 Proceedings Book
24/25 October 2019 Gaziantep University, TURKEY 476
ENERGY COST ESTIMATION IN TERMS OF ORGANIC
LOADING FOR A MEAT PROCESSING INDUSTRY
WASTEWATER TREATMENT PLANT
Pelin YAPICIOĞLU Harran University [email protected]
ABSTRACT: Wastewater treatment plants are operated in order to minimize hazardous organic materials discharges to the receiving bodies. These plants can be considered as one of the major energy consumers by municipalities and authorities. Energy demand of a plant is based mainly on the treated wastewater volume and organic loading. In this study, the effects of organic loading on energy cost for a meat processing wastewater treatment plant were investigated. The aim of the study is to reveal the role of design parameters in terms of organic loading on energy management. Energy cost indicator has been calculated for the assessment. This indicator was figured out for both design organic loading and operational organic loading. The results revealed that energy cost indicator of operational organic loading was higher than the design one. Their values were 6.88 x 10⁻³ and 8.06x 10⁻⁶, respectively. If plants are operated in design parameters, energy cost of the plant can be minimized.
Key words: energy cost, meat processing wastewater, BOD, organic loading. INTRODUCTION
Wastewater treatment plants are operated in order to protect the water bodies from harmful wastewater discharges (Metcalf &Eddy, 1991; Metcalf & eddy, 2014). These facilities are regarded as one of the major energy consumers by the municipalities and authorities (Castellet-Viciano et al., 2018). Electricity consumption causes to the greenhouse gases emissions in the wastewater treatment plants (Kyung et al., 2015, Yapıcıoğlu, 2018a, Parravicini et al., 2016). Electricity and air consumption in a plant leads to the off-site greenhouse gases emissions therefor electricity consumption should take under control for the minimization of greenhouse gas emissions to the atmosphere (Kyung et al., 2015, Yapıcıoğlu, 2018a). Also, energy cost locates in the top of the wastewater treatment plant’s operations costs list.

UEMK 2019 Proceedings Book
24/25 October 2019 Gaziantep University, TURKEY 477
Energy demand mainly depends on the wastewater volume and organic loading in a wastewater treatment plant (Metcalf & Eddy, 1991). These two operational parameters detect the energy requirement and energy costs of a plant. Operational parameters of the wastewater treatment plants do not match with the design parameters for many times. It can be originated from production capacity variations for the industrial wastewater treatment plants. This mismatch has a negative effect on the performance of the plants and their energy costs. Organic loading varies due to the production capacity and amount and the variation of products types. Meat processing industry is the facilities that have high organic wastewater loadings (Yapıcıoğlu, 2018b). This paper aims to reveal the role of design parameters in terms of organic loading on energy management. The impact of design organic loading for a meat processing wastewater treatment plant on energy cost were researched and benchmarked with the operational organic loading. METHODS
Description of the Meat Processing Industry
The meat industry is located in an organized industrial zone in Turkey. The main products being processed are sujuk, sausage, meatball, raw meat, döner and jambon. The main wastewater generating points of the industry are the slaughterhouse, rendering unit, and intestinal washing process. The data set of this industry is given in Table 1. The wastewater analysis results were performed using Standard Methods (APHA 1998).
Figure 1 shows the existing wastewater treatment process in the plant. Biological treatment method is used as extended aeration activated sludge system to remove organic and suspended materials from the wastewater. Table 1. Data Set of Meat Processing Industry
Parameter Value
BOD, operational (g/m3) 2.554 BOD, design (g/m3) 3.025 Operational Flow Rate (Q) (m3/d)
2800
Design Flow Rate (q) (m3/d) 4000
UEMK 2019 Proceedings Book
24/25 October 2019 Gaziantep University, TURKEY 478
Figure 1. Wastewater Flow Diagram of the Meat Processing Industry Wastewater Treatment Plant Energy Cost Indicator (ECI) Term
Energy cost assessment depends on the model developed by Hernandez-Sancho et al. (2011a). In this methodology, the performance index (Z) and energy cost indicator (ECI) which is derived from “Z” have been figured out. The performance index (Z) comprises operational flow rate (Q) (m3/d) and the design flow of the plant (q) (m3/d). Eq. 1 indicates the calculation of the performance index (Castellet-Viciano et al., 2018). Z= [(q-Q) / Q] x 100 (Eq.1) (1) Energy cost indicator (ECI) has been derived from the performance index, the tool contains the volume of wastewater treated per year (V) (m3/year) and biological oxygen demand (BOD) (g/m3). In this study, ECI values related to design organic loading (ECI
organic loading, design) and operational organic loading (ECI organic loading, operational) were

UEMK 2019 Proceedings Book
24/25 October 2019 Gaziantep University, TURKEY 479
calculated and benchmarked. In this term, variable parameter is BOD that means to the required oxygen amount for the stabilization of organic materials in the wastewater. It also corresponds to the organic loading. In Eq. 2, the calculation model of ECI for small scale WWTPs was given (Castellet-Viciano et al., 2018; Hernandez-Sancho et al. , 2011a). ECI=1983.106 V 0.717 e (-14.327 BOD+0.660Z) (Eq.2) (2) RESULTS AND FINDINGS
The results showed that energy cost indicator of operational organic loading was higher than the design one whose values were 6.88 x 10⁻³ and 8.06x 10⁻⁶, respectively. Figure 2 demonstrates the comparison of the indicators.
Figure 2. Energy Cost Indicators of Meat Processing Industry
BOD is the meaning of biological oxygen demand for the stabilization of the organic materials. It is an indicator parameter of organic loading in a wastewater sample. According to the model, if organic loading is lower, the cost indicator is higher, oppositely. So if the plants are operated under the design parameters, energy cost indicator would be lower. There are many study corresponds to this topic. The use of cost functions has been applied in general in the literature. Most of developed models for the wastewater treatment process have been applied to estimate the operational and maintenance cost of the process. Hernandez-Sancho et al. (2011b) studied a cost modelling methodology using statistical information from a sample of 341 wastewater treatment plants in Spain. Castellet-Viciano et al. (2018) researched the effect of design flow as the design
parameters on energy costs for small, middle and large scale of WWTPs. They reported

UEMK 2019 Proceedings Book
24/25 October 2019 Gaziantep University, TURKEY 480
that Z was 0.20, 0.40, 0.60 and 0.80 for small-scale plants. Similarly, Z value was 0.428 for a small scale wastewater treatment plant, in this study. Molinos-Senante et al. (2013) applied a cost function model to estimate the cost of the sludge and waste management. Similarly, cost functions for extended aeration and activated sludge also contain the volume of wastewater treated and the biological oxygen demand removal efficiency in %. Plumlee et al. (2014) estimated the cost of the advanced treatment, and in near future Yumin et al. (2016) estimated the operational cost of WWTPs in rural areas. CONCLUSION
This study shows that energy cost indicator and the performance index can be used as an approach tool to evaluate the energy costs of a wastewater treatment plant. The results demonstrate that energy cost indicator of operational organic loading was higher than the design one. Their values were 6.88 x 10⁻³ and 8.06x 10⁻⁶, respectively. If organic loading that is closed with BOD parameter is lower, the energy cost indicator is higher, oppositely. So if the plants are operated under the design parameters, energy cost indicator would be lower. RECOMMENDATIONS
There are limited studies to this topic in the literature. The energy cost assessments of the meat processing industry wastewater treatment plants should be increased. REFERENCES
American Public Health Association, American Water Works Association, (1999). Standard Methods for the Examination of Water and Wastewater, USA.
Castellet-Viciano, L., Torregrossa, D. & Hernández-Sancho, F. (2018). The relevance of the design characteristics to the optimal operation of wastewater treatment plants: Energy cost assessment. Journal of Environmental Management, 222,275–283. Hernandez-Sancho, F., Molinos-Senante, M. & Sala-Garrido, R. (2011a). Cost modelling for wastewater treatment processes. Desalination, 268, 1–5. Hernández-Sancho, F., Molinos-Senante, M. & Sala-Garrido R. (2001b). Energy efficiency in Spanish wastewater treatment plants: a non-radial DEA approach. Science of Total Environment, 409,2693–2699.
Kyung, D., Kim, M., Chang, J. & Lee, W. (2015). Estimation of greenhouse gas emissions from a hybrid wastewater treatment plant. Journal of Cleaner Production, 95,117–123. Metcalf & Eddy, Inc. (1991) Wastewater Engineering: Treatment, Disposal, and Reuse. 3rd Ed., McGraw-Hill, New York.

UEMK 2019 Proceedings Book
24/25 October 2019 Gaziantep University, TURKEY 481
Metcalf & Eddy, (2014). Wastewater Engineering: Treatment and Resource Recovery 5th ed, Boston, USA, McGraw-Hill. Molinos-Senante, M., Hernandez-Sancho, F. & Sala-Garrido, R. (2013). Cost modeling for sludge and waste management from wastewater treatment plants: an empirical approach for Spain. Desalination and Water Treatment, 51, 5414–5420. Parravicini, V., Svardal, K. and Krampe, J. (2016). Greenhouse gas emissions from wastewater treatment plants. Energy Procedia, 97, 246–253. Plumlee, M.H., Stanford, B.D., Debroux, J., Hopkins, D.C. & Snyder, S.A. (2014). Costs of advanced treatment in water reclamation. Ozone Sci. Eng., 36, 485–495. Yapıcıoğlu, P. (2018a). Greenhouse Gases Emissions Minimization of Wastewater Treatment, MSc thesis, Harran University Graduate School of Natural and Applied Sciences Department of Environmental Engineering, 96pp. Yapıcıoğlu, P. (2018b). Environmental impact assessment for a meat processing industry in Turkey: wastewater treatment plant. Water Practice & Technology, 13(3), 692-704. Yumin,W., Lei, W. & Yanhong, F. (2016). Cost function for treating wastewater in rural regions. Desalination and Water Treatment, 57, 17241–17246.
UEMK 2019 Proceedings Book
24/25 October 2019 Gaziantep University, TURKEY 482
ESTIMATION OF GREENHOUSE GAS EMISSION FROM
EXTENDED AERATION ACTIVATED SLUDGE PROCESS
Pelin YAPICIOĞLU Harran University [email protected]
ABSTRACT: Greenhouse gases emissions have been increasing, in the recent times. One of the greenhouse gases emission resources is the meat processing industrial wastewater treatment plants. Extended aeration activated sludge process is applied for organic materials removal from industrial wastewater. Extended aeration activated sludge system consists of an aeration tank and a sedimentation tank. Aeration tank is the main greenhouse gas emitter units in a meat processing industry wastewater treatment plant. In this study, the off-site greenhouse gas emissions of extended aeration activated sludge process in a meat processing wastewater treatment plant were estimated. The off-site
emission was estimated from electricity consumption and chemical use. This paper aims to determine the off-site emissions for extended aeration process in a meat processing wastewater treatment plant. The results revealed that electricity consumption was the major source of the off-site greenhouse gas emission for this process with the value of 4014.77 kg CO2e/d. The off-site emission due to the chemical use was 100.87 kg CO2e/d. Total off-site emission was 4115.64 kg CO2e/d. Key words: greenhouse gas, meat processing industry, wastewater treatment plant, extended aeration process, off-site emission. INTRODUCTION
Greenhouse gas emissions have increased in the atmosphere due to the industrial, domestic and anthropogenic activities in last decades (Kyung et al., 2015). Wastewater treatment plants have been considered as one of the greenhouse gases emissions resources recently (Kyung et al., 2015; Corominas et al., 2012; Yerushalmi et al., 2013; Yapıcıoğlu, 2018). Carbon dioxide (CO2), methane (CH4) and nitrous oxide (N2O) are the main greenhouse gases which emits from wastewater treatment plants to the atmosphere due to applying treatment process (biological, chemical or biochemical processes etc), sludge dewatering and disposal process (anaerobic digestion, incineration etc.), chemical use (added chemical materials for wastewater and sludge treatment process (coagulants, flocculants), for nitrification and denitrification (methanol, etc.), for alkalinity and pH
UEMK 2019 Proceedings Book
24/25 October 2019 Gaziantep University, TURKEY 483
adjustment), energy consumption (electricity consumption, air consumption, etc.), and maintenance and transport (Kyung et al., 2015; Metcalf and Eddy, 2014; Yapıcoğlu, 2018). Greenhouse gases emissions can be classified as the on-site emissions and the off-site emissions (Parravicini et al., 2016; Yapıcıoğlu, 2018a). The on-site emissions in the plants are the emitting emissions in the wastewater collection system, the emissions originated from the existing treatment processes and the emissions in the discharge point of the treated water. The off-site GHGs emissions comprise from the electricity consumption, air consumption, transportation, chemical use and sludge stabilization and disposal process (Parravicini et al., 2016; Yapıcıoğlu, 2018a). Especially, the industrial wastewater plants emit the huge amounts of greenhouse gas emissions due to highly organic wastewater content and existing treatment processes. The meat processing industry is one of them. The meat processing industry discharges large volumes of wastewater in many countries that is in need of considerable treatment if its release to the environment is to be sustainable (Johns 1995, Yapıcıoğlu 2018b). The organic materials and total suspended
solids concentration is very high and has a highly contaminating effect in the meat processing wastewater (Ruiz et al. 1997; Yapıcıoğlu 2018b). The wastewater majorly includes organics, pathogenic and non-pathogenic viruses and bacteria, and detergents and disinfectants (Debik & Coskun 2009; Lecompte & Mehrvar 2014). There are several methods for the treatment of meat processing wastewater, with most focusing on biological processes such as activated sludge, stabilization ponds and aerobic reactors (Davarnejad & Nasiri 2017). The common treatment method is extended aeration activated sludge process for meat processing wastewater. In this process carbon and nitrogen removal can be ensured (Metcalf & Eddy, 2014). In this study, the off-site greenhouse gas emissions of aeration tank in extended aeration activated sludge process applied in meat processing wastewater treatment plant were estimated. The off-site emission was estimated from chemical consumption (added methanol for denitrification) and electricity consumption in the aeration tank. The main aim of this study is to estimate the off-site emissions for extended aeration tank in a meat processing industry wastewater treatment plant. METHODS
Description of the Meat Processing Industry
UEMK 2019 Proceedings Book
24/25 October 2019 Gaziantep University, TURKEY 484
The meat industry is located in an organized industrial zone in Turkey. The main products being processed are sujuk, sausage, meatball, raw meat, döner and jambon. The main wastewater generating points of the industry are the slaughterhouse, rendering unit, and intestinal washing process. The wastewater characterization of this plant is given in Table 1. The wastewater analysis results were performed using Standard Methods (APHA 1998).
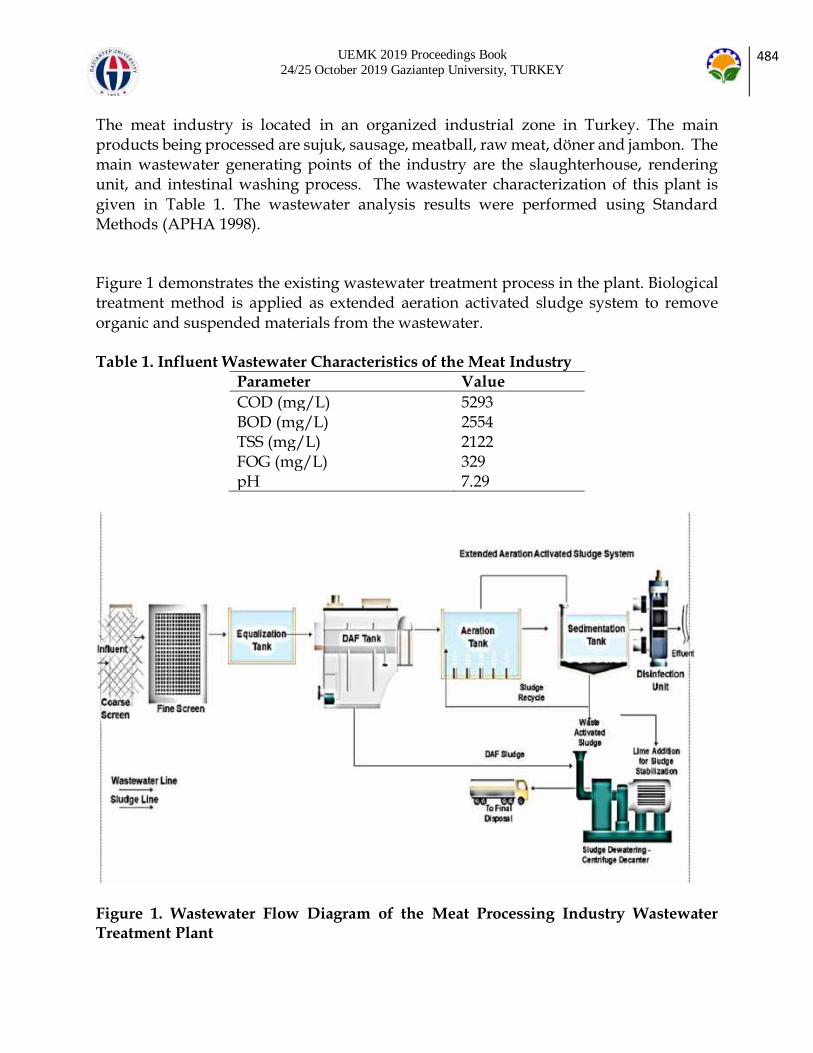
Figure 1 demonstrates the existing wastewater treatment process in the plant. Biological treatment method is applied as extended aeration activated sludge system to remove organic and suspended materials from the wastewater. Table 1. Influent Wastewater Characteristics of the Meat Industry
Parameter Value
COD (mg/L) 5293 BOD (mg/L) 2554 TSS (mg/L) 2122 FOG (mg/L) 329 pH 7.29
Figure 1. Wastewater Flow Diagram of the Meat Processing Industry Wastewater Treatment Plant
UEMK 2019 Proceedings Book
24/25 October 2019 Gaziantep University, TURKEY 485
Extended Aeration Activated Sludge Process
Extended aeration activated sludge process is a type of biological treatment. It consists of an aeration tank and sedimentation tank. The wastewater hydraulic retention time is in the range of 18-24 hours. Organic materials are removed with the help of microorganisms in the aeration tank. Air is pumped in to the aeration tank for the respiration of the microbial mass (Metcalf &Eddy, 1991).
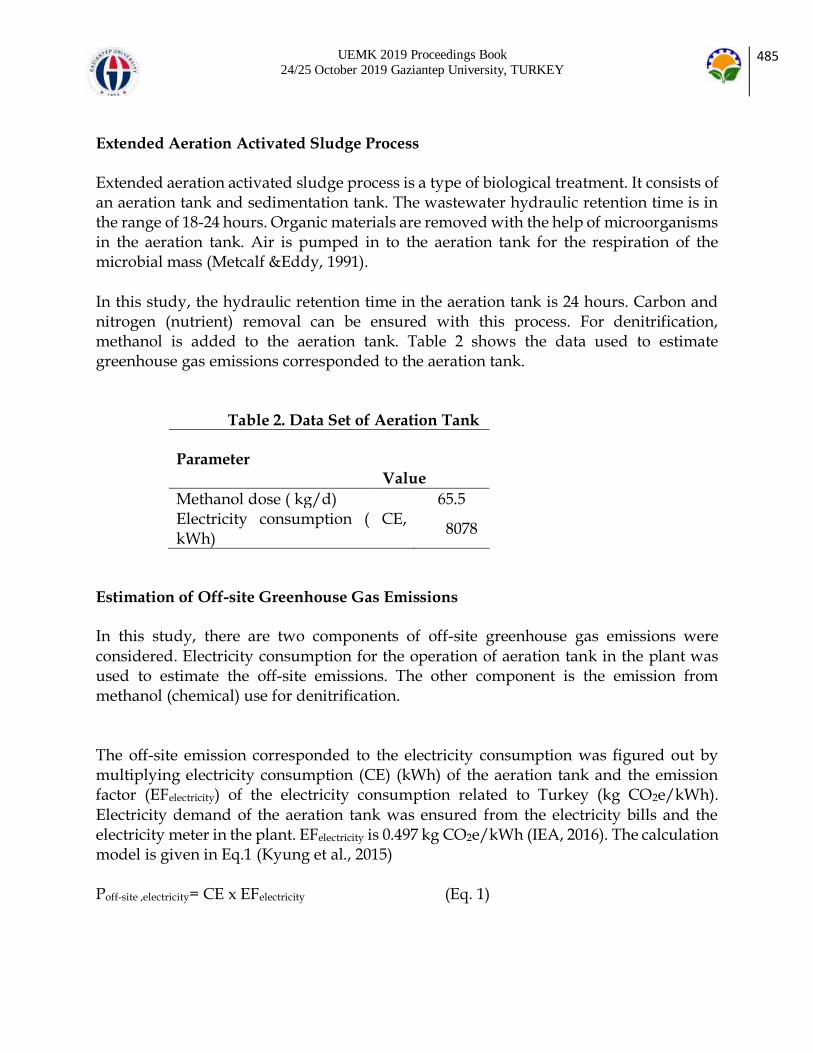
In this study, the hydraulic retention time in the aeration tank is 24 hours. Carbon and nitrogen (nutrient) removal can be ensured with this process. For denitrification, methanol is added to the aeration tank. Table 2 shows the data used to estimate greenhouse gas emissions corresponded to the aeration tank. Table 2. Data Set of Aeration Tank
Parameter
Value
Methanol dose ( kg/d) 65.5 Electricity consumption ( CE, kWh)
8078
Estimation of Off-site Greenhouse Gas Emissions
In this study, there are two components of off-site greenhouse gas emissions were considered. Electricity consumption for the operation of aeration tank in the plant was used to estimate the off-site emissions. The other component is the emission from methanol (chemical) use for denitrification. The off-site emission corresponded to the electricity consumption was figured out by multiplying electricity consumption (CE) (kWh) of the aeration tank and the emission factor (EFelectricity) of the electricity consumption related to Turkey (kg CO2e/kWh). Electricity demand of the aeration tank was ensured from the electricity bills and the electricity meter in the plant. EFelectricity is 0.497 kg CO2e/kWh (IEA, 2016). The calculation model is given in Eq.1 (Kyung et al., 2015) Poff-site ,electricity= CE x EFelectricity (Eq. 1)

UEMK 2019 Proceedings Book
24/25 October 2019 Gaziantep University, TURKEY 486
The other off-site emission was resulted from methanol use for denitrification to ensure nitrogen removal in aeration tank. It can be estimated by means of daily chemical consumption (Mchemical) (kg/d) and the emission factor of chemical substance (EFchemical) (Kyung et al., 2015). The off-site emission can be ensured by multiplying chemical consumption and the emission factor. The emission factor of methanol is 1,54 kgCO2e/kg methanol (Ashrafi et al., 2013, Kyung et al., 2015, Yerushalmi et al., 2013). The off-site emission of the chemical use can be calculated with the help of Eq.2 (Kyung et al., 2015). Poff-site ,chemical= Mchemical x EFchemical (Eq. 2) Total off-site emission is the sum of off-site emissions from electricity and chemical consumption. Eq.3 shows the calculation tool. Poff-site= Poff-site ,electricity + Poff-site ,chemical (Eq.3) RESULTS AND FINDINGS
The results show that the off-site emission due to electricity consumption was higher than chemical use. It can be originated from using blower to obtain air to operate the aeration tank. This process consumes huge amounts of electricity to ensure air for the respiration of microorganisms. The off-site emission corresponds to the electricity consumption is 97.5% of the total off-site emission.
UEMK 2019 Proceedings Book
24/25 October 2019 Gaziantep University, TURKEY 487
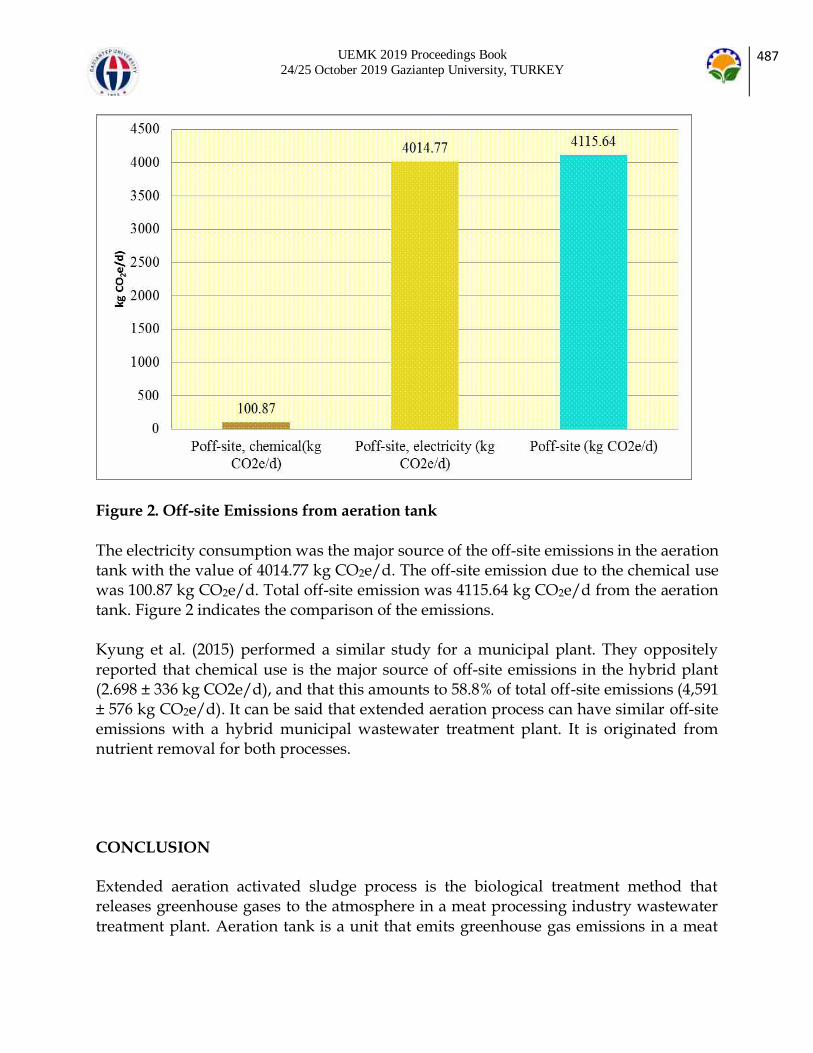
Figure 2. Off-site Emissions from aeration tank The electricity consumption was the major source of the off-site emissions in the aeration tank with the value of 4014.77 kg CO2e/d. The off-site emission due to the chemical use was 100.87 kg CO2e/d. Total off-site emission was 4115.64 kg CO2e/d from the aeration tank. Figure 2 indicates the comparison of the emissions. Kyung et al. (2015) performed a similar study for a municipal plant. They oppositely reported that chemical use is the major source of off-site emissions in the hybrid plant (2.698 ± 336 kg CO2e/d), and that this amounts to 58.8% of total off-site emissions (4,591 ± 576 kg CO2e/d). It can be said that extended aeration process can have similar off-site emissions with a hybrid municipal wastewater treatment plant. It is originated from nutrient removal for both processes. CONCLUSION
Extended aeration activated sludge process is the biological treatment method that releases greenhouse gases to the atmosphere in a meat processing industry wastewater treatment plant. Aeration tank is a unit that emits greenhouse gas emissions in a meat

UEMK 2019 Proceedings Book
24/25 October 2019 Gaziantep University, TURKEY 488
processing industry wastewater treatment plant. Electricity consumption and chemical use cause the off-site emissions in the aeration tank. Electricity consumption causes to the highest off-site emissions with the value of 4014.77 kg CO2e/d .The off-site emission due to the chemical use was 100.87 kg CO2e/d. Total off-site emission was 4115.64 kg CO2e/d from the aeration tank. Electricity consumption is the major source of the off-site emissions from the aeration tank. It can be originated from using air blower for the respiration of the microbial committee that is responsible for the stabilization of the organic materials. Electricity consumption should take under control to decrease the emissions from the aeration tank. RECOMMENDATIONS
In the literature, the studies related to greenhouse gases emissions from meat processing industry are limited. These researches on this topic should be increased. REFERENCES
American Public Health Association, American Water Works Association, (1999). Standard Methods for the Examination of Water and Wastewater, USA.
Ashrafi, O., Yerushalmi, L. & Haghighat, F. (2013). Application of dynamic models to estimate greenhouse gas emission by wastewater treatment plants of the pulp and paper industry. Environmental Science and Pollution Research, 20(3), 1858–1869. Corominas, L., Flores-Alsına, X., Snip, L. & Vanrolleghem, P.A. (2012). Comparison of different modeling approaches to better evaluate greenhouse gas emissions from whole wastewater treatment plants. Biotechnology and Bioengineering, 109(11), 2854–2863. Davarnejad, R. & Nasiri, S. (2017). Slaughterhouse wastewater treatment using an advanced oxidation process: optimization study. Environmental Pollution, 223, 1–10. Debik, E. & Coskun, T. (2009). Use of the Static Granular Bed Reactor (SGBR) with anaerobic sludge to treat poultry slaughterhouse wastewater and kinetic modeling. Bioresource Technology, 100(11), 2777–2782. IEA, 2016. World Energy Statistics 2016. Key world energy statistics http://www.iea.org/statistics/topics/energybalances/. Johns, M. R. (1995). Developments in wastewater treatment in the meat processing industry: a review. Bioresource Technology, 54(3), 203–216.
Kyung, D., Kim, M., Chang, J. & Lee, W. (2015). Estimation of greenhouse gas emissions from a hybrid wastewater treatment plant. Journal of Cleaner Production, 95,117–123.

UEMK 2019 Proceedings Book
24/25 October 2019 Gaziantep University, TURKEY 489
Lecompte, B. C. F. & Mehrvar, M., (2014). Cost-effectiveness analysis of TOC removal from slaughterhouse wastewater using combined anaerobiceaerobic and UV/H2O2 processes. Journal of Environmental Management,134, 145–152. Metcalf & Eddy, Inc. (1991) Wastewater Engineering: Treatment, Disposal, and Reuse. 3rd Ed.,
McGraw-Hill, New York. Metcalf & Eddy, (2014). Wastewater Engineering: Treatment and Resource Recovery 5th ed, Boston, USA, McGraw-Hill. Parravicini, V., Svardal, K. and Krampe, J. (2016). Greenhouse gas emissions from wastewater treatment plants. Energy Procedia, 97, 246–253. Ruiz, I., Veiga, M. C., Santiago, P. & Blazquez, R. (1997). Treatment of slaughterhouse wastewater in a UASB reactor and ananaerobic filter. Bioresource Technology, 60(3), 251–
258. Yapıcıoğlu, P. (2018a). Greenhouse Gases Emissions Minimization of Wastewater Treatment, MSc thesis, Harran University Graduate School of Natural and Applied Sciences Department of Environmental Engineering, 96pp. Yapıcıoğlu, P. (2018b). Environmental impact assessment for a meat processing industry in Turkey: wastewater treatment plant. Water Practice & Technology, 13(3), 692-704. Yerushalmi, L., Ashrafi, O. & Haghighat, F. (2013). Reductions in greenhouse gas (GHG) generation and energy consumption in wastewater treatment plants. Water Science and
Technology, 67( 5), 1159–1164.

UEMK 2019 Proceedings Book
24/25 October 2019 Gaziantep University, TURKEY 490
UNMANNED AERIAL VEHICLES IN THE CONSTRUCTION
INDUSTRY: APPLICATIONS AND IMPLICATIONS
Volkan ARSLAN Zonguldak Bulent Ecevit University, Department of Civil Engineering, Zonguldak, Turkey [email protected] Serdar ULUBEYLI Zonguldak Bulent Ecevit University, Department of Civil Engineering, Zonguldak,
Turkey [email protected] Aynur KAZAZ Akdeniz University, Department of Civil Engineering, Antalya, Turkey [email protected]
ABSTRACT: An unmanned aerial vehicle (UAV) is an aircraft system that is controlled autonomously or by a pilot on the ground. The use of UAVs has started in military operations and transferred to the commercial use in numerous industries. In these industries, UAVs were usually utilized in mapping applications, environmental change
monitoring, disaster prevention response, resource exploration, etc. Despite their many advantages, the construction industry incorporates with this technology slowly. However, the technological development of UAVs leads the construction industry to adapt these devices in order to provide time and cost savings during the execution process of construction activities. It was known that some civil engineering works, such as management of river facilities, monitoring for bridge degradation, and quality inspections, were conducted using UAVs. This is because UAVs simplify and improve the execution process in construction. Moreover, efficient monitoring and reviewing activities in construction projects may be beneficial to save time and money for contractors. Therefore, the aim of this study was to investigate UAVs and their related usage areas in the construction industry. For this purpose, a detailed literature review was presented and the existing UAV practices in the construction industry were examined. The obtained results may help both researchers and practitioners be aware of the current situation of UAVs and determine future expectations from UAVs in the construction industry. Key words: construction industry, unmanned aerial vehicle

UEMK 2019 Proceedings Book
24/25 October 2019 Gaziantep University, TURKEY 491
INTRODUCTION
An unmanned aerial vehicle (UAV) is an aircraft system that is controlled autonomously or by a pilot on the ground (Liu et al., 2014). This vehicle is also known as an unmanned aerial system, a remotely piloted vehicle, or a drone in the literature (Siebert & Teizer, 2014). The use of UAVs has started in military operations and transferred to the commercial use in numerous industries (Dupont, Chua, Tashrif, & Abbott, 2017). In these industries, UAVs were usually utilized in mapping applications, environmental change monitoring, disaster prevention response, resource exploration, etc. (Liu et al., 2014). The technological development of UAVs leads the construction industry to adapt these devices in order to provide time and cost savings during the execution process of construction activities (Herrmann, 2018). Despite their many advantages, the construction industry incorporates with this technology slowly (Holt, Benham, & Bigelow, 2015). It was known that some civil engineering works, such as management of river facilities, monitoring for bridge degradation, and quality inspections, were conducted using UAVs. This is because UAVs simplify and improve the execution process in construction. Moreover, efficient monitoring and reviewing activities in construction projects may be beneficial to save time and money for contractors. Therefore, the aim of this study was to investigate UAVs and their related usage areas in the
construction industry. For this purpose, a detailed literature review was presented and the existing UAV practices in the construction industry were examined. UAV SYSTEM AND DESIGN
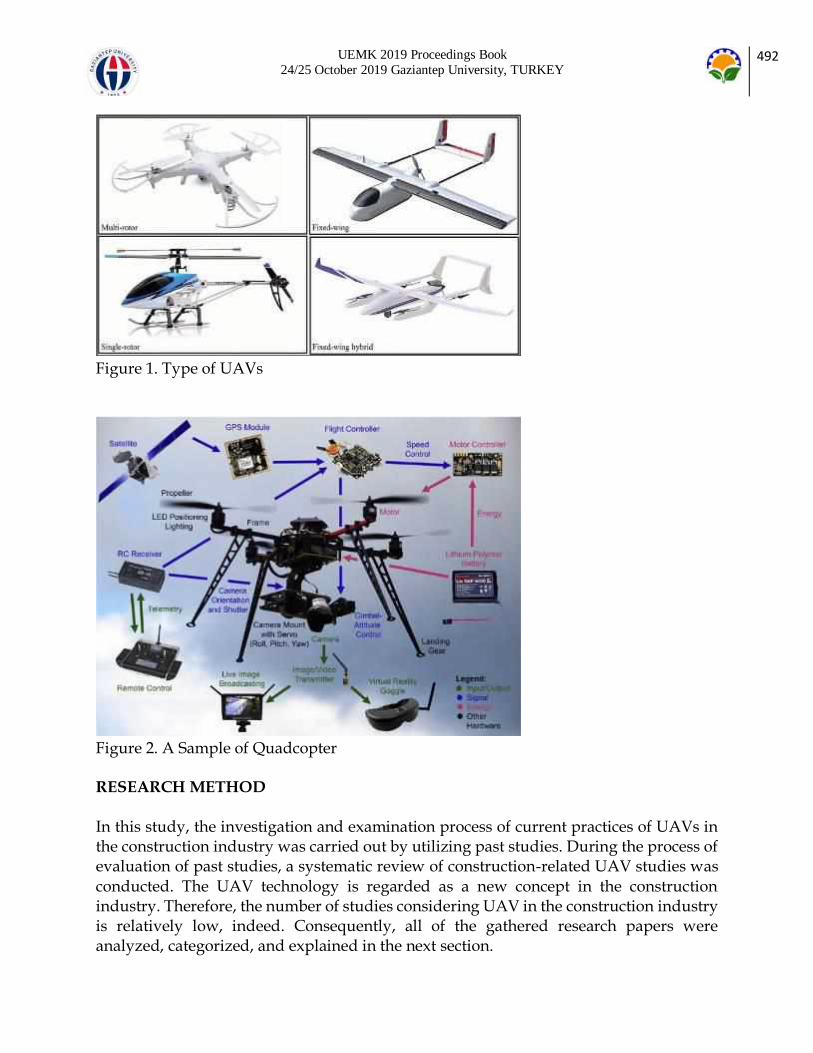
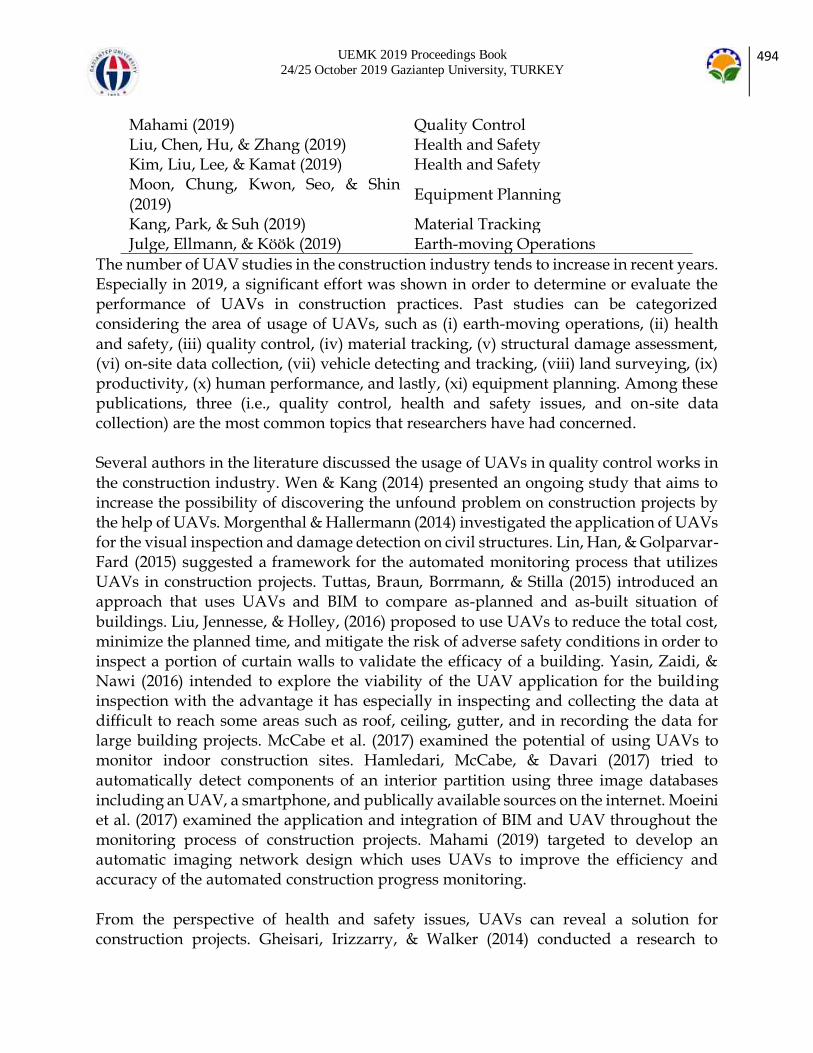
There are four different types of UAVs, namely, multirotor, fixed-wing, single-rotor, and fixed-wing hybrid (Figure 1). The application area of multirotor UAVs which have more than two rotors is larger than any other kinds. Especially quadcopters (Figure 2) have advantageous features such as robustness, high maneuverability, and low purchase and maintenance costs (Li & Liu, 2019). In addition, UAVs’ hardware and software components can be designed in accordance with their purpose of usage. In this context, their system design, system implementation, control mechanism, and software properties become crucial (Liu et al., 2014). However, the most significant disadvantages of UAVs are insufficient battery life and low wind resistance (Cajzek & Klanšek, 2016). Considering advantages, disadvantages, design condition, terms of use, and capabilities of UAVs, this technology may provide new opportunities for the construction industry.
UEMK 2019 Proceedings Book
24/25 October 2019 Gaziantep University, TURKEY 492
Figure 1. Type of UAVs
Figure 2. A Sample of Quadcopter
RESEARCH METHOD
In this study, the investigation and examination process of current practices of UAVs in the construction industry was carried out by utilizing past studies. During the process of evaluation of past studies, a systematic review of construction-related UAV studies was conducted. The UAV technology is regarded as a new concept in the construction industry. Therefore, the number of studies considering UAV in the construction industry is relatively low, indeed. Consequently, all of the gathered research papers were analyzed, categorized, and explained in the next section.

UEMK 2019 Proceedings Book
24/25 October 2019 Gaziantep University, TURKEY 493
LITERATURE REVIEW
The construction industry is known with its slower adaptation of the emerging technologies (Holt et al., 2015). From this perspective, research efforts on the UAV technology can be described as new. Table 1 presents past studies considering UAV applications in the construction industry. In Table 1, studies were categorized and listed in accordance with their authors, publication dates, and areas of usage of UAVs. Table 1. Past Studies on UAVs in the Construction Industry
Author and Date Area of Usage
Siebert & Teizer (2014) Earth-moving Operations
Gheisari, Irizzarry, & Walker (2014) Health and Safety
Wen & Kang (2014) Quality Control Morgenthal & Hallermann (2014) Quality Control Hubbard et al. (2015) Material Tracking
Lin, Han, & Golparvar-Fard (2015) Quality Control Tuttas, Braun, Borrmann, & Stilla (2015)
Quality Control
Fernandez Galarreta, Kerle, & Gerke (2015)
Structural Damage Assessment
Vacanas et al. (2016) On-site Data Collection
Wang, Chen, & Yin (2016) Vehicle Detecting and Tracking
Meouche et al. (2016) Land Surveying
Fang, Chen, Cho, & Zhang (2016) Material Tracking
Fleming et al. (2016) Earth-moving Operations
Yasin, Zaidi, & Nawi (2016) Quality Control Liu, Jennesse, & Holley, (2016) Quality Control Dupont et al. (2017) Productivity
Bang, Kim, & Kim (2017) On-site Data Collection
Hamledari, McCabe, & Davari (2017) Quality Control McCabe et al. (2017) Quality Control Moeini et al. (2017) Quality Control Howard, Murashov, & Branche (2018) Health and Safety
Kim & Irizarry (2019) Human Performance
Gheisari & Esmaeili (2019) Health and Safety
Kim, Park, Cho, & Kang (2019) On-site Data Collection
Ham & Kamari (2019) On-site Data Collection
Ficapal & Mutis (2019) Quality Control
UEMK 2019 Proceedings Book
24/25 October 2019 Gaziantep University, TURKEY 494
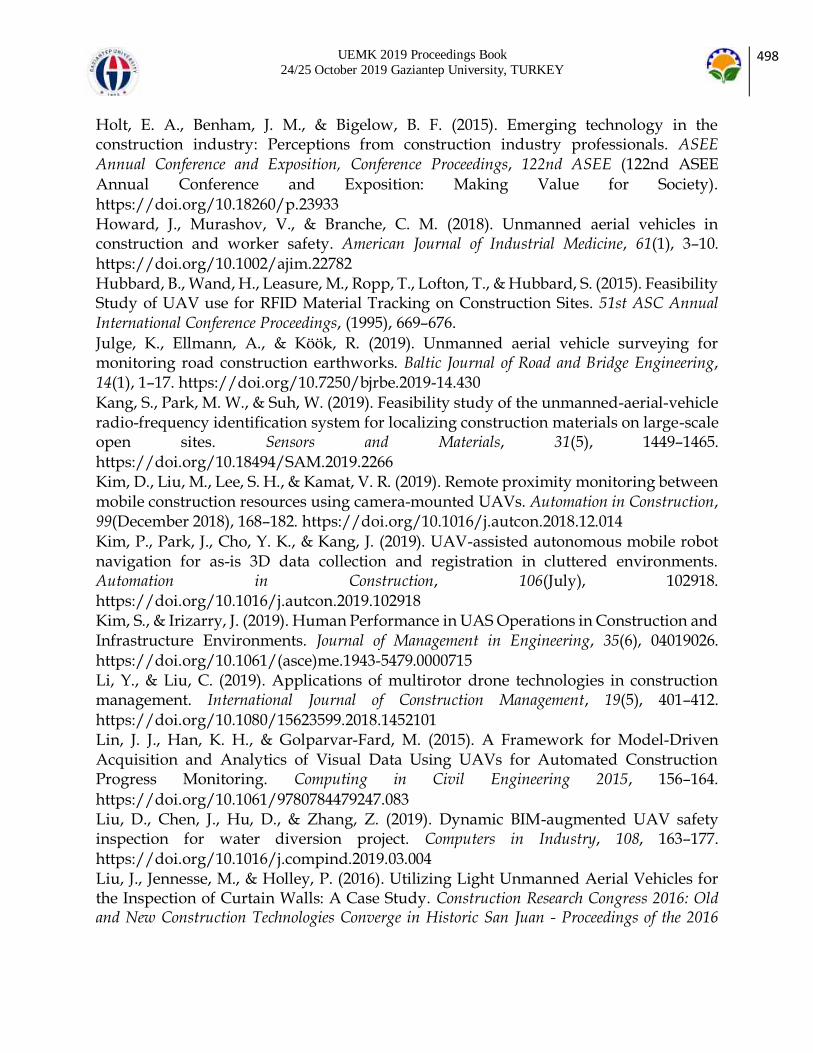
Mahami (2019) Quality Control Liu, Chen, Hu, & Zhang (2019) Health and Safety
Kim, Liu, Lee, & Kamat (2019) Health and Safety
Moon, Chung, Kwon, Seo, & Shin (2019)
Equipment Planning
Kang, Park, & Suh (2019) Material Tracking
Julge, Ellmann, & Köök (2019) Earth-moving Operations
The number of UAV studies in the construction industry tends to increase in recent years. Especially in 2019, a significant effort was shown in order to determine or evaluate the performance of UAVs in construction practices. Past studies can be categorized considering the area of usage of UAVs, such as (i) earth-moving operations, (ii) health and safety, (iii) quality control, (iv) material tracking, (v) structural damage assessment, (vi) on-site data collection, (vii) vehicle detecting and tracking, (viii) land surveying, (ix) productivity, (x) human performance, and lastly, (xi) equipment planning. Among these publications, three (i.e., quality control, health and safety issues, and on-site data collection) are the most common topics that researchers have had concerned. Several authors in the literature discussed the usage of UAVs in quality control works in the construction industry. Wen & Kang (2014) presented an ongoing study that aims to increase the possibility of discovering the unfound problem on construction projects by the help of UAVs. Morgenthal & Hallermann (2014) investigated the application of UAVs for the visual inspection and damage detection on civil structures. Lin, Han, & Golparvar-Fard (2015) suggested a framework for the automated monitoring process that utilizes UAVs in construction projects. Tuttas, Braun, Borrmann, & Stilla (2015) introduced an approach that uses UAVs and BIM to compare as-planned and as-built situation of
buildings. Liu, Jennesse, & Holley, (2016) proposed to use UAVs to reduce the total cost, minimize the planned time, and mitigate the risk of adverse safety conditions in order to inspect a portion of curtain walls to validate the efficacy of a building. Yasin, Zaidi, & Nawi (2016) intended to explore the viability of the UAV application for the building inspection with the advantage it has especially in inspecting and collecting the data at difficult to reach some areas such as roof, ceiling, gutter, and in recording the data for large building projects. McCabe et al. (2017) examined the potential of using UAVs to monitor indoor construction sites. Hamledari, McCabe, & Davari (2017) tried to automatically detect components of an interior partition using three image databases including an UAV, a smartphone, and publically available sources on the internet. Moeini et al. (2017) examined the application and integration of BIM and UAV throughout the monitoring process of construction projects. Mahami (2019) targeted to develop an automatic imaging network design which uses UAVs to improve the efficiency and accuracy of the automated construction progress monitoring. From the perspective of health and safety issues, UAVs can reveal a solution for construction projects. Gheisari, Irizzarry, & Walker (2014) conducted a research to

UEMK 2019 Proceedings Book
24/25 October 2019 Gaziantep University, TURKEY 495
determine (1) the effectiveness and frequency of using UAVs in improving safety operations or hazardous situations, (2) ideal UAV technical features, and (3) enablers and barriers for using UAVs to monitor and control on-site construction activities. Howard, Murashov, & Branche (2018) described UAVs according to their use in construction, potential risks for workers, the effect for the risk mitigation, and the impact on health and safety professionals. Liu, Chen, Hu, & Zhang (2019) introduced a safety inspection method that integrates UAV and BIM. Kim, Liu, Lee, & Kamat (2019) presented an UAV-assisted visual monitoring method to prevent struck-by accidents in construction projects. In order to have a good construction management performance, collecting data from a construction site may be considered as a vital aspect. Vacanas et al. (2016) explored the combined use of BIM and UAV technologies in order to achieve efficient and accurate as-built data from a construction site. Bang, Kim, & Kim (2017) proposed a method to generate a panorama of a construction site by using UAVs. Kim, Park, Cho, & Kang (2019) discussed enabling UAVs to gather data in a time-efficient manner in construction activities. Ham & Kamari (2019) aimed to use UAVs to create a new method which automatically retrieves photo-worthy frames containing construction-related contents in order to have the data from construction sites.
The earth-moving operations topic is a major issue in the construction industry. Siebert & Teizer (2014) evaluated the performance of UAV systems in large excavation and earth moving construction sites. Fleming et al. (2016) presented a novel imaging and software application that utilizes UAVs, and used this application in an excavation project in downtown San Francisco. Julge, Ellmann, & Köök (2019) carried out a study to develop a method to monitor road construction earthworks. In their work, UAVs were utilized as a surveying technique that enables generating point clouds, 3D surface models, and orthophoto mosaics. Land surveying is also a critical issue for construction excavation works. Meouche et al. (2016) aimed to extract a vectorized plan utilizing an UAV for a small site and to investigate the possibility of an official land surveyor exploiting and certificating it. Moreover, Moon, Chung, Kwon, Seo, & Shin (2019) indicate that inaccurate information regarding the terrain in construction projects represents a major challenge to the earthwork process. In this regard, they proposed a method for generating and merging hybrid point cloud data acquired from laser scanning and UAV-based image processing to conduct a better equipment management process in construction works. In terms of supply chain and total quality management in construction, material tracking emerges as a successful technology to provide the identification of materials. Hubbard et al. (2015) revealed findings of an initial feasibility study on combining RFID technologies with UAV technologies to improve supply chain management in construction. Fang, Chen, Cho, & Zhang (2016) introduced a point cloud-vision hybrid approach to track
mobile assets on construction sites. Kang, Park, & Suh (2019) proposed an UAV-based

UEMK 2019 Proceedings Book
24/25 October 2019 Gaziantep University, TURKEY 496
system that carries an RFID reader in the air for locating RFID tags attached to materials on the ground. Similarly, Wang, Chen, & Yin (2016) states that using UAVs as devices for the traffic data collection exhibits many advantages in collecting traffic information. From this point of view, they proposed a new vehicle detecting and tracking system based on image data collected by an UAV. A natural disaster can have a great impact on buildings. Therefore, a structural damage assessment is a critical process and should be handled carefully. Fernandez Galarreta, Kerle, & Gerke (2015) benefitted from UAVs to conduct a damage assessment based on multi-perspective, overlapping, and very high-resolution oblique images. Dupont et al. (2017) approached UAVs from a different perspective. In their study, the potential of UAVs in linking BIM to the real world to improve the productivity was explored. In addition, they presented a technical review of main challenges of using UAVs in the construction sector. Moreover, Kim & Irizarry (2019) evaluated UAV operators’ performance and identified the relationship between their performance and experience in the construction industry. DISCUSSION AND CONCLUSION
UAV technologies have undergone an exponential growth and have become much more affordable (Goessens, Mueller, & Latteur, 2018). With the increasing availability of camera-equipped devices of UAVs, large numbers of high-quality images or video footages are constantly collected to document as-is status of construction job sites (Ham & Kamari, 2019). Thus, the application of the UAV technology in the construction
industry tends to increase in recent years. However, there is still much to do to investigate, examine, and evaluate advantages and disadvantages of the application of UAVs in the construction industry. From this perspective, past studies concerning the UAV application in the construction industry were reviewed in this study through a detailed classification. According to aforementioned studies, researchers have tried to utilize UAVs in quality control works particularly. In addition, health and safety and on-site data collection are the other major issues for researchers. However, all of these research efforts have potential to be investigated in a detailed manner. This is because new technology concepts have always potential to improve the performance of construction firms. Consequently, the UAV technology has been found to be beneficial and useful in the construction industry. Therefore, it can easily be asserted that the number of construction-related UAV studies has a serious potential to increase in the near future. REFERENCES

UEMK 2019 Proceedings Book
24/25 October 2019 Gaziantep University, TURKEY 497
Bang, S., Kim, H., & Kim, H. (2017). UAV-based automatic generation of high-resolution panorama at a construction site with a focus on preprocessing for image stitching. Automation in Construction, 84(August), 70–80. https://doi.org/10.1016/j.autcon.2017.08.031 Cajzek, R., & Klanšek, U. (2016). An unmanned aerial vehicle for multi-purpose tasks in construction industry. Journal of Applied Engineering Science, 14(2), 314–327. https://doi.org/10.5937/jaes14-10918 Dupont, Q. F. M., Chua, D. K. H., Tashrif, A., & Abbott, E. L. S. (2017). Potential Applications of UAV along the Construction’s Value Chain. Procedia Engineering, 182(3), 165–173. https://doi.org/10.1016/j.proeng.2017.03.155 Fang, Y., Chen, J., Cho, Y. K., & Zhang, P. (2016). A point cloud-vision hybrid approach for 3D location tracking of mobile construction assets. ISARC 2016 - 33rd International Symposium on Automation and Robotics in Construction, (ISARC), 613–620.
https://doi.org/10.22260/isarc2016/0074 Fernandez Galarreta, J., Kerle, N., & Gerke, M. (2015). UAV-based urban structural damage assessment using object-based image analysis and semantic reasoning. Natural Hazards and Earth System Sciences, 15(6), 1087–1101. https://doi.org/10.5194/nhess-15-1087-2015 Ficapal, A., & Mutis, I. (2019). Framework for the Detection, Diagnosis, and Evaluation
of Thermal Bridges Using Infrared Thermography and Unmanned Aerial Vehicles. Buildings, 9(8), 179. https://doi.org/10.3390/buildings9080179 Fleming, K. L., Hashash, Y. M. A., McLandrich, S., O’Riordan, N., & Riemer, M. (2016). Novel Technologies for Deep-Excavation Digital Construction Records. Practice Periodical on Structural Design and Construction, 21(4), 1–10. https://doi.org/10.1061/(ASCE)SC.1943-5576.0000295 Gheisari, M., & Esmaeili, B. (2019). Applications and requirements of unmanned aerial systems (UASs) for construction safety. Safety Science, 118(May), 230–240. https://doi.org/10.1016/j.ssci.2019.05.015 Gheisari, M., Irizzarry, J., & Walker, B. (2014). UAS4SAFETY: The Potential of Unmanned Aerial Systems for Construction Safety Applications. Construction Research Congress 2014,
1801–1810. https://doi.org/10.1061/9780784413517.176 Goessens, S., Mueller, C., & Latteur, P. (2018). Feasibility study for drone-based masonry construction of real-scale structures. Automation in Construction, 94(August), 458–480. https://doi.org/10.1016/j.autcon.2018.06.015 Ham, Y., & Kamari, M. (2019). Automated content-based filtering for enhanced vision-based documentation in construction toward exploiting big visual data from drones. Automation in Construction, 105(May), 102831. https://doi.org/10.1016/j.autcon.2019.102831 Hamledari, H., McCabe, B., & Davari, S. (2017). Automated computer vision-based detection of components of under-construction indoor partitions. Automation in Construction, 74, 78–94. https://doi.org/10.1016/j.autcon.2016.11.009
UEMK 2019 Proceedings Book
24/25 October 2019 Gaziantep University, TURKEY 498
Holt, E. A., Benham, J. M., & Bigelow, B. F. (2015). Emerging technology in the construction industry: Perceptions from construction industry professionals. ASEE Annual Conference and Exposition, Conference Proceedings, 122nd ASEE (122nd ASEE Annual Conference and Exposition: Making Value for Society). https://doi.org/10.18260/p.23933 Howard, J., Murashov, V., & Branche, C. M. (2018). Unmanned aerial vehicles in construction and worker safety. American Journal of Industrial Medicine, 61(1), 3–10. https://doi.org/10.1002/ajim.22782 Hubbard, B., Wand, H., Leasure, M., Ropp, T., Lofton, T., & Hubbard, S. (2015). Feasibility Study of UAV use for RFID Material Tracking on Construction Sites. 51st ASC Annual International Conference Proceedings, (1995), 669–676.
Julge, K., Ellmann, A., & Köök, R. (2019). Unmanned aerial vehicle surveying for monitoring road construction earthworks. Baltic Journal of Road and Bridge Engineering, 14(1), 1–17. https://doi.org/10.7250/bjrbe.2019-14.430 Kang, S., Park, M. W., & Suh, W. (2019). Feasibility study of the unmanned-aerial-vehicle radio-frequency identification system for localizing construction materials on large-scale open sites. Sensors and Materials, 31(5), 1449–1465. https://doi.org/10.18494/SAM.2019.2266 Kim, D., Liu, M., Lee, S. H., & Kamat, V. R. (2019). Remote proximity monitoring between mobile construction resources using camera-mounted UAVs. Automation in Construction, 99(December 2018), 168–182. https://doi.org/10.1016/j.autcon.2018.12.014 Kim, P., Park, J., Cho, Y. K., & Kang, J. (2019). UAV-assisted autonomous mobile robot navigation for as-is 3D data collection and registration in cluttered environments. Automation in Construction, 106(July), 102918. https://doi.org/10.1016/j.autcon.2019.102918 Kim, S., & Irizarry, J. (2019). Human Performance in UAS Operations in Construction and Infrastructure Environments. Journal of Management in Engineering, 35(6), 04019026. https://doi.org/10.1061/(asce)me.1943-5479.0000715 Li, Y., & Liu, C. (2019). Applications of multirotor drone technologies in construction management. International Journal of Construction Management, 19(5), 401–412.
https://doi.org/10.1080/15623599.2018.1452101 Lin, J. J., Han, K. H., & Golparvar-Fard, M. (2015). A Framework for Model-Driven Acquisition and Analytics of Visual Data Using UAVs for Automated Construction Progress Monitoring. Computing in Civil Engineering 2015, 156–164.
https://doi.org/10.1061/9780784479247.083 Liu, D., Chen, J., Hu, D., & Zhang, Z. (2019). Dynamic BIM-augmented UAV safety inspection for water diversion project. Computers in Industry, 108, 163–177. https://doi.org/10.1016/j.compind.2019.03.004 Liu, J., Jennesse, M., & Holley, P. (2016). Utilizing Light Unmanned Aerial Vehicles for the Inspection of Curtain Walls: A Case Study. Construction Research Congress 2016: Old and New Construction Technologies Converge in Historic San Juan - Proceedings of the 2016

UEMK 2019 Proceedings Book
24/25 October 2019 Gaziantep University, TURKEY 499
Construction Research Congress, CRC 2016, 2651–2659. https://doi.org/10.1061/9780784479827.264 Liu, P., Chen, A. Y., Huang, Y. N., Han, J. Y., Lai, J. S., Kang, S. C., … Tsai, M. H. (2014). A review of rotorcraft unmanned aerial vehicle (UAV) developments and applications in civil engineering. Smart Structures and Systems, 13(6), 1065–1094. https://doi.org/10.12989/sss.2014.13.6.1065 Mahami, H., Nasirzadeh, F., Hosseininaveh Ahmadabadian, A., Esmaeili, F., & Nahavandi, S. (2019). Imaging network design to improve the automated construction progress monitoring process. Construction Innovation, 19(3), 386–404. https://doi.org/10.1108/CI-07-2018-0059 McCabe, B. Y., Hamledari, H., Shahi, A., Zangeneh, P., & Azar, E. R. (2017). Roles, Benefits, and Challenges of Using UAVs for Indoor Smart Construction Applications. Congress on Computing in Civil Engineering, Proceedings, 2017-June, 349–357.
https://doi.org/10.1061/9780784480830.043 Meouche, R., Hijazi, I., Poncet, P. A., Abunemeh, M., & Rezoug, M. (2016). UAV photogrammetry implementation to enhance land surveying, comparisons and possibilities. International Archives of the Photogrammetry, Remote Sensing and Spatial Information Sciences - ISPRS Archives, 42(2W2), 107–114. https://doi.org/10.5194/isprs-archives-XLII-2-W2-107-2016
Michele Herrmann, J. D. (2018). Regulation of unmanned aerial vehicles and a survey on their use in the construction industry. Construction Research Congress 2018: Construction Information Technology - Selected Papers from the Construction Research Congress 2018, 2018-April (Herrmann 2016), 758–764. https://doi.org/10.1061/9780784481264.074 Moeini, S., Oudjehane, A., Edition, S., Baker, T., & Hawkins, W. (2017). Application of an interrelated UAS -BIM system for construction progress monitoring, inspection and project management 1. PM World Journal, VI(VIII), 1–13. Retrieved from
www.pmworldjournal.net Moon, D., Chung, S., Kwon, S., Seo, J., & Shin, J. (2019). Comparison and utilization of point cloud generated from photogrammetry and laser scanning: 3D world model for smart heavy equipment planning. Automation in Construction, 98(June 2017), 322–331.
https://doi.org/10.1016/j.autcon.2018.07.020 Morgenthal, G., & Hallermann, N. (2014). Quality assessment of Unmanned Aerial Vehicle (UAV) based visual inspection of structures. Advances in Structural Engineering, 17(3), 289–302. https://doi.org/10.1260/1369-4332.17.3.289
Siebert, S., & Teizer, J. (2014). Mobile 3D mapping for surveying earthwork projects using an Unmanned Aerial Vehicle (UAV) system. Automation in Construction, 41, 1–14.
https://doi.org/10.1016/j.autcon.2014.01.004 Tuttas, S., Braun, A., Borrmann, A., & Stilla, U. (2015). Validation of BIM components by photogrammetric point clouds for construction site monitoring. ISPRS Annals of the Photogrammetry, Remote Sensing and Spatial Information Sciences, 2(3W4), 231–237. https://doi.org/10.5194/isprsannals-II-3-W4-231-2015

UEMK 2019 Proceedings Book
24/25 October 2019 Gaziantep University, TURKEY 500
Vacanas, Y., Themistocleous, K., Agapiou, A., & Hadjimitsis, D. (2016). The combined use of Building Information Modelling (BIM) and Unmanned Aerial Vehicle (UAV) technologies for the 3D illustration of the progress of works in infrastructure construction projects. Fourth International Conference on Remote Sensing and Geoinformation of the
Environment (RSCy2016), 9688(August 2016), 96881Z. https://doi.org/10.1117/12.2252605 Wang, L., Chen, F., & Yin, H. (2016). Detecting and tracking vehicles in traffic by unmanned aerial vehicles. Automation in Construction, 72, 294–308.
https://doi.org/10.1016/j.autcon.2016.05.008 Wen, M. C., & Kang, S. C. (2014). Augmented reality and unmanned aerial vehicle assist in construction management. Computing in Civil and Building Engineering - Proceedings of
the 2014 International Conference on Computing in Civil and Building Engineering, 1570–1577. https://doi.org/10.1061/9780784413616.195 Yasin, M. F. M., Zaidi, M. A., & Nawi, M. N. M. (2016). A review of Small Unmanned Aircraft System (UAS) advantages as a tool in condition survey works. MATEC Web of Conferences, 66. https://doi.org/10.1051/matecconf/20166600038.

UEMK 2019 Proceedings Book
24/25 October 2019 Gaziantep University, TURKEY 501
THE USE OF INTERNET OF THINGS IN THE
CONSTRUCTION INDUSTRY
Volkan ARSLAN Zonguldak Bulent Ecevit University, Department of Civil Engineering, Zonguldak, Turkey, [email protected] Serdar ULUBEYLI Zonguldak Bulent Ecevit University, Department of Civil Engineering, Zonguldak, Turkey, [email protected]
Aynur KAZAZ Akdeniz University, Department of Civil Engineering, Antalya, Turkey, [email protected]
ABSTRACT: In recent years, a new technology concept, Internet of Things (IoT), has drawn a great interest. This technology aims to share information across platforms enabling innovative applications. Moreover, it can be considered as a network of sensors, actuators, or machines to facilitate real-time communications between these items in the environment of computer applications. Several industries, such as telecommunication, automotive, healthcare, and logistics, have experienced its advantages and IoT is
nowadays beginning to attract attention of the construction industry. Studies on IoT in the construction industry are relatively new. However, there are a few examples of the IoT usage in the construction industry, such as the communication of machines for the optimization of construction works, the coordination of project partners to share information, risk management applications, smart cities, and so on. Therefore, the purpose of this research is to analyze the IoT technology and its practical implications in the construction industry. To this aim, a detailed literature review was conducted and current IoT applications were investigated in detail. Key words: construction industry, internet of things INTRODUCTION
The construction industry is known as one of the largest industries in the world. However, it can also be considered as one of the most conservative industry in terms of the adaptation of new methods or technologies. The developing technologies force the

UEMK 2019 Proceedings Book
24/25 October 2019 Gaziantep University, TURKEY 502
construction industry to utilize novel approaches to overcome cost and time overruns of construction projects (Louis & Dunston, 2018). Internet of Things (IoT), an example of these approaches, is one of the most recent technologies that has drawn a great interest in several industries, such as telecommunication, automotive, healthcare, and logistics, and is nowadays beginning to attract attention of the construction industry (Niu, Anumba, & Lu, 2019). IoT can be described as the interconnection of sensing and actuating devices providing the ability to share information across platforms through a unified framework, developing a common operating picture for enabling innovative applications (Gubbi, Buyya, Marusic, & Palaniswami, 2013). Moreover, it can be considered as a network of sensors, actuators, or machines to facilitate real-time communications between these items in the environment of computer applications (Shahinmoghadam & Motamedi, 2019). Scientific studies on IoT in the construction industry are relatively new. However, there are a few examples of the IoT usage in the construction industry, such as the communication of machines for the optimization of construction works, the coordination of project partners to share information, risk management applications, smart cities, and so on. Therefore, the purpose of this research is to analyze the IoT technology and its practical implications in the construction industry. To this aim, a detailed literature review was conducted and current IoT applications were investigated in detail.
IoT CONCEPT AND DEFINITION
IoT was first introduced by Kevin Ashton in 1998 and has gained increasingly more attention in the academia and industry (Santucci, 2009). The concept of IoT is the environment of things or objects which can interact with each other and corporate with
their neighbors via radio-frequency identification (RFID) tags, sensors, actuators, mobile phones, etc., for pre-determined objectives (Giusto, Iera, Morabito, & Atzori, 2010). There are numerous definitions for IoT in the literature, but from a broader perspective, it is a “world-wide network of interconnected objects uniquely addressable, based on standard communication protocols” (Bandyopadhyay & Sen, 2011). The IoT concept is the convergence of three different visions such as (i) things oriented vision, (ii) internet oriented vision, and (iii) semantic oriented vision (Atzori, Iera, & Morabito, 2010). The things oriented vision represents how to integrate generic objects into a common framework. From this perspective, IoT can be evaluated as a tool for autonomous data capture, event transfer, network connectivity and interoperability. The perspective of internet oriented vision directs a network-oriented definition, which enables to connect a large number of communicating devices. Lastly, the semantic oriented vision has a key role to overcome the problem of dealing with the huge information generated by IoT due to the extremely high number of items involved in the future internet (Bandyopadhyay & Sen, 2011). The general concept of the IoT technology that includes main concepts, technologies, and standards was presented in Figure 1, and more detailed information can be found in the study of Atzori et al. (2010).

UEMK 2019 Proceedings Book
24/25 October 2019 Gaziantep University, TURKEY 503
Figure 3. General Concept of IoT (Atzori et al., 2010) Application of IoT
The IoT technology has a great potential to affect and direct future perspectives of numerous industries. Up to date, some industries (i.e., aerospace and aviation, automotive, telecommunications, medical and healthcare, independent living, pharmaceutical, retail, logistics and supply chain management, manufacturing, environment monitoring, transportation, agriculture and breeding, media, entertainment, insurance, and recycling) have benefitted from IoT (Atzori et al., 2010, Bandyopadhyay & Sen, 2011). From the perspective of the construction industry, IoT is a relatively new and unknown concept. However, in the past decade, some research efforts were shown in terms of smart buildings, communities, cities, and infrastructures. Several researchers have also tried to utilize IoT to overcome health and safety problems in the construction industry. Moreover, many other researchers have paid significant attention on the IoT technology for a better project or construction management performance. In this respect, practical applications of IoT in the construction industry was investigated through a literature review in the following section. LITERATURE REVIEW
In this section, past studies regarding applications of IoT in the construction industry were reviewed and explained to reveal the current situation of IoT researches in the construction industry. For this purpose, academic databases were utilized to search

UEMK 2019 Proceedings Book
24/25 October 2019 Gaziantep University, TURKEY 504
relevant studies. After that, these researches were analyzed and then sorted chronologically. Kortuem et al. (2010) worked on an alternative architectural model for IoT as a system of smart objects or autonomous physical/digital objects augmented with sensing, processing, and network capabilities. From their point of views, there are three smart object types such as (i) activity-aware objects, (ii) policy-aware objects, and lastly, (iii) process-aware objects. They believe that these types represent fundamental design and architectural principles of smart objects and can be integrated into the IoT technology. As a result, they claimed that smart objects that were made into building blocks could cooperate with and form IoT. Ghimire et al. (2017) state that the interaction between internet and real world objects have a significant potential to become an issue of major importance in business. In this regard, they claim that the IoT technology can be utilized in order to optimize the systematic process of business. Therefore, a framework was provided to decrease the time for decision-making and thus to have a better project management performance in construction industry. In conclusion, the new generation of IoT-based situational-aware computing applications were found to be beneficial to solve communication problems in
dynamic site conditions. Park et al. (2017) studied to clarify the user experience and motivations of IoT technologies, considering a smart home environment. In this context, they proposed a research model in which there are five potential user factors and a technology acceptance model. For this purpose, a questionnaire survey was conducted with 40 smart home users. The findings reveal that users’ attitude toward IoT technologies is the greatest predictor of their intention to use. In addition, the perceived compatibility and cost showed notable impacts on the use intention. Teizer et al. (2017) presented the concept of the integration of IoT and environmental and localization data in a cloud-based BIM platform. They exhibited the usage of the IoT technology and a lean and injury-free construction management approach. In this task, it was aimed to facilitate higher quality, on-time project delivery, and safe value creation processes. Toward this aim, they conducted two case studies. In the first case study, a test of the developed IoT concept focused on tracking several trades in a building construction project was run. In the second one, the developed IoT concept focused on measuring the brightness level at work stations was tested. Finally, the possibility to collect and visualize actual project data in real-time and the potential for the implementation of connected, digital, and smart technologies in construction management were revealed.

UEMK 2019 Proceedings Book
24/25 October 2019 Gaziantep University, TURKEY 505
Zhou and Ding (2017) aimed to present an IoT-based safety barrier warning system for a better health and safety performance in underground construction projects. To this aim, they investigated hazard energies and their coupling mechanisms and analyzed scenarios for avoiding unsafe behaviors and unsafe status of construction equipment and workers’ environment. The proposed system was implemented in a metro tunnel construction in China and the obtained results showed that the safety performance was improved and that the occurrence of accidents caused by the hazard energy on site could be prevented. Zhong et al. (2017) introduced a multi-dimensional IoT-enabled Building Information Modelling (BIM) platform (MITBIMP) to achieve real-time visibility and traceability in the prefabricated construction. BIM is a powerful tool for the digital presentation and currently supports the planning, design, construction, operation, and maintenance of most physical infrastructures. Therefore it is very useful in the prefabrication-based construction (Azhar, 2011). However, they identified several challenges (i.e., incomplete, inaccurate, and inadequate data, confined data sharing, poor visibility and traceability of the construction process) when using BIM in Hong Kong. To overcome these challenges, they implemented the IoT technology to BIM applications and presented MITBMIP. The results have some significant contributions. First of all, smart construction objects which can collaborate with IoT to ease operations were presented. Second, a multi-dimensional
BIM platform was created in order to provide opportunities to stakeholders to share information. Third, through the proposed platform, a better monitoring process was provided for end users. Lastly, traditional 3D BIM applications were extended by utilizing IoT in the process of prefabrication. Ding et al. (2018) discussed to use BIM and IoT together in order to deal with the uncontrollability and inefficiency problem of the construction progress, quality, and cost in traditional steel bridge construction projects. They state that the collaboration and information sharing among designer, fabricator, constructor, and maintainer is in a dynamic manner during the lifecycle of steel bridges. Therefore, better information and communication technologies should be implemented to overcome the existing problems. To do so, they decided to utilize BIM and IoT together during steel bridge lifecycle activities. A steel construction in which IoT and BIM technology was utilized together is called as the smart steel bridge construction. The smart steel bridge construction was considered in three smart components, namely, smart steel bridge, smart construction site, and smart construction process. These components and participating parties of the smart steel bridge construction conduct a comprehensive process in order to build a smart environment using several instruments. Thus, an opportunity for an efficient digital collaboration throughout the construction lifecycle of a steel bridge was provided. Kanan et al. (2018) aimed to design an autonomous system based on IoT that monitors, localizes, and warns site laborers who avail within danger zones. For a better health and
safety performance, the proposed design considers (i) the real-time alerting of potential

UEMK 2019 Proceedings Book
24/25 October 2019 Gaziantep University, TURKEY 506
hazards, (ii) indexing of potential hazards for analysis and for the overall improvement of site safety, (iii) the seamless integration of heterogeneous sensors in a middleware IoT platform, and (iv) the introduction of a reliable low-cost and low-power energy harvesting scheme. Then, two IoT-based autonomous, power saving, and real-time sensing systems were determined. These were (i) the back over accidents prevention system (ii) the smart alerting system for potential hazard avoidance. Consequently, it was revealed that the proposed design has a potential to reduce the risk of construction site accidents with low capital and operational costs. Louis and Dunston (2018) intended to build a framework using the IoT technology to assist the real-time decision-making on the construction site. A practical and sensor-agnostic implementation of operation-level decision-making by utilizing IoT networks was then introduced. From their perspective, the developed framework has potential to improve the operation performance for earthmoving operations in construction. This is because the framework utilizes the IoT infrastructure to first determine equipment state of entities that perform the construction process and to communicate with the same to a discrete-event model of the operation. Consequently, it was stated that the provided framework may help decision makers in the process of decision-making and can increase scientific planning and control methods in the domain of construction project
management. Xu et al. (2018) proposed an integrated cloud-based IoT platform for prefabricated construction works through exploiting the concept of cloud asset. This platform was designed to operate to enable small and medium enterprises to adopt IoT technologies economically and flexibly. For this purpose, they explained the working principle of the cloud-based IoT system firstly. They then adopted the model in a real time prefabricated construction project in Hong Kong. In conclusion, it is believed that the proposed compatible and scalable cloud-based IoT platform may improve the current information and automation level in the construction industry. Reja and Varghese (2019) targeted to identify the potential usage of the IoT technology for various construction projects and to discuss the potential of 5G technology in order to improve the performance of the IoT technology in terms of construction management issues. In accordance with this target, they carried out a comparative study of current IoT applications in the construction industry and analyzed advantages and shortcoming of IoT in construction. They concluded that the effective use of IoT in the construction environment is not an easy task and that the continuous improvement of IoT is needed in the near future for better applications. Park et al. (2019) implemented an IoT-based system to prevent the dangerous situation of construction works on job sites. This system works in accordance with sensors and a
deep learning system in order to solve the falling problems of construction workers. From

UEMK 2019 Proceedings Book
24/25 October 2019 Gaziantep University, TURKEY 507
their point of views, this system is suitable for construction sites with various radio interference factors. Based on the findings, they believe that an objective safety guideline could be established for workers at the construction site using the IoT technology. Table 1. Past Studies on IoT in the Construction Industry
Author and Date Approach
Kortuem et al. (2010) Smart Objects
Ghimire et al. (2017) Decision-making
Park et al. (2017) Smart Home
Teizer et al. (2017) BIM Integration
Zhou and Ding (2017) Health and Safety
Zhong et al. (2017) BIM Integration
Ding et al. (2018) BIM Integration
Kanan et al. (2018) Health and Safety
Louis and Dunston (2018)
Decision-making
Xu et al. (2018) Prefabricated Construction
Reja and Varghese (2019)
5G Integration
Park et al. (2019) Health and Safety
Mehata et al. (2019) Health and Safety
Mehata et al. (2019) utilized smart wearable devices using the IoT technology in detecting the fall of workers and in sending the notification in case of a need for an immediate aid. To do so, they developed a system which monitors the hearth rate and temperatures of workers and thereby warns regarding abnormal health conditions. They tested their system in two different cases, namely, (i) heart beat and temperature sensor and (ii) fall detection. As a result, the proposed system ensures the good health monitoring and fall detection for construction workers. According to these thirteen past studies concerning the use of IoT in the construction industry, the number and extent of studies seem to be scarce. In Table 1, these studies were categorized in accordance with their approaches of the IoT technology chronologically. DISCUSSION AND CONCLUSION
The IoT technology has a huge application area when it is used in other technologies such as sensing, identification and recognition, hardware, software and cloud platforms, communication and networks, software and algorithms, positioning, data processing solutions, power and energy storage, security mechanisms, etc. (Čolaković & Hadžialić,

UEMK 2019 Proceedings Book
24/25 October 2019 Gaziantep University, TURKEY 508
2018). This technology utilizes advantages of intelligent devices, smart mobile devices, single board computers, and different types of sensors and actuators (Dehury & Sahoo, 2016). From this perspective, the awareness about benefits of IoT is rapidly increasing due to the current technology trend in the construction industry (Kanan et al., 2018). Therefore, the IoT technology has a great potential to become more popular in the future. Aforementioned past studies reveal that IoT has a potential to be utilized in order to solve decision-making and health and safety problems in the construction industry. For this purpose, especially sensors and monitoring systems can be used or developed by construction companies. Considering the poor health and safety performance of construction firms, minimizing or eliminating construction incidents may be possible by using such a new technology in construction sites. In this respect, the help of IoT applications may decrease the number of occupational accidents caused by construction machines. Similarly, using IoT-based technologies may improve the monitoring activities for construction workers in construction sites. In addition to decision-making and health and safety problems, the IoT technology can also be used to improve the construction management performance. In this context, it was shown that IoT has a potential to provide time and money savings and better quality
in construction works. The application of BIM in construction projects has had a great impact on construction management practices. Furthermore, the integration of IoT and BIM may increase the positive effect of technologic developments in the construction industry. Similarly, the IoT technology enabled the emergence of smart objects and smart homes. Thus, construction firms have a chance to enhance their performance in terms of economic, sustainable, and environmentally-friendly practices. Lastly, the 5G technology, which is expected to arise in the near future, may be integrated with the IoT technology in order to expand application opportunities of this technology. Consequently, IoT is a novel technology and has a potential to be used in the construction industry to improve several issues under the construction management topic. By applying the IoT technology, the construction industry may benefit from its application practices in a positive manner. The system of IoT can be integrated with different applications which are already in use in construction. For future studies, additional research efforts can be carried out in order to improve the performance of smart or intelligent building, smart objects, health and safety precautions, monitoring systems, quality control, etc. REFERENCES
Atzori, L., Iera, A., & Morabito, G. (2010). The Internet of Things: A survey. Computer Networks, 54(15), 2787–2805. https://doi.org/10.1016/j.comnet.2010.05.010

UEMK 2019 Proceedings Book
24/25 October 2019 Gaziantep University, TURKEY 509
Azhar, S. (2011). Building information modeling (BIM): Trends, benefits, risks, and challenges for the AEC industry. Leadership and Management in Engineering, 11(3), 241–
252. https://doi.org/10.1061/(ASCE)LM.1943-5630.0000127 Bandyopadhyay, D., & Sen, J. (2011). Internet of things: Applications and challenges in technology and standardization. Wireless Personal Communications, 58(1), 49–69. https://doi.org/10.1007/s11277-011-0288-5 Čolaković, A., & Hadžialić, M. (2018). Internet of Things (IoT): A review of enabling technologies, challenges, and open research issues. Computer Networks, 144, 17–39.
https://doi.org/10.1016/j.comnet.2018.07.017 Dehury, C. K., & Sahoo, P. K. (2016). Design and implementation of a novel service management framework for IoT devices in cloud. Journal of Systems and Software, 119, 149–
161. https://doi.org/10.1016/j.jss.2016.06.059 Ding, K., Shi, H., Hui, J., Liu, Y., Zhu, B., Zhang, F., & Cao, W. (2018). Smart steel bridge construction enabled by BIM and Internet of Things in industry 4.0: A framework. ICNSC 2018 - 15th IEEE International Conference on Networking, Sensing and Control, 1–5. https://doi.org/10.1109/ICNSC.2018.8361339 Ghimire, S., Luis-Ferreira, F., Nodehi, T., & Jardim-Goncalves, R. (2017). IoT based situational awareness framework for real-time project management. International Journal of Computer Integrated Manufacturing, 30(1), 74–83.
https://doi.org/10.1080/0951192X.2015.1130242 Giusto, D., Iera, A., Morabito, G., & Atzori, L. (2010). The Internet of Things. Springer. Gubbi, J., Buyya, R., Marusic, S., & Palaniswami, M. (2013). Internet of Things (IoT): A vision, architectural elements, and future directions. Future Generation Computer Systems, 29(7), 1645–1660. https://doi.org/10.1016/j.future.2013.01.010 Kanan, R., Elhassan, O., & Bensalem, R. (2018). An IoT-based autonomous system for workers’ safety in construction sites with real-time alarming, monitoring, and positioning strategies. Automation in Construction, 88(December 2017), 73–86. https://doi.org/10.1016/j.autcon.2017.12.033 Kortuem, G., Kawasar, F., Fitton, D., & Sundramoorthy, V. (2010). Smart Objects as Building Blocks for the Internet of Things. Internet Computing, 14(1), 44–51.
Louis, J., & Dunston, P. S. (2018). Integrating IoT into operational workflows for real-time and automated decision-making in repetitive construction operations. Automation in Construction, 94(August 2017), 317–327. https://doi.org/10.1016/j.autcon.2018.07.005 Mehata, K. M., Shankar, S. K., Karthikeyan, N., Nandhinee, K., & Robin, H. P. (2019). IoT Based Safety and Health Monitoring for Construction Workers. In 1st International Conference on Innovations in Information and Communication Technology (ICIICT). IEEE.
https://doi.org/10.1007/bf00677603 Niu, Y., Anumba, C., & Lu, W. (2019). Taxonomy and Deployment Framework for Emerging Pervasive Technologies in Construction Projects. Journal of Construction Engineering and Management, 145(5), 1–13. https://doi.org/10.1061/(ASCE)CO.1943-7862.0001653

UEMK 2019 Proceedings Book
24/25 October 2019 Gaziantep University, TURKEY 510
Park, E., Cho, Y., Han, J., & Kwon, S. J. (2017). Comprehensive Approaches to User Acceptance of Internet of Things in a Smart Home Environment. IEEE Internet of Things Journal, 4(6), 2342–2350. https://doi.org/10.1109/JIOT.2017.2750765 Park, M., Park, S., Song, M., & Park, S. (2019). IoT-based Safety Recognition Service for Construction Site. 2019 Eleventh International Conference on Ubiquitous and Future Networks (ICUFN), 738–741. https://doi.org/10.1109/icufn.2019.8806080 Reja, V. K., & Varghese, K. (2019). Impact of 5G Technology on IoT Applications in Construction Project Management? Proceedings of the 36th International Symposium on Automation and Robotics in Construction (ISARC), (ISARC). https://doi.org/10.22260/isarc2019/0029 Santucci, G. (2009). From internet to data to internet of things. In Proceedings of the
International Conference on Future Trends of the Internet. Luxembourg. Shahinmoghadam, M., & Motamedi, A. (2019). Review of BIM-centered IoT deployment: State of the Art, Opportunities, and Challenges. Proceedings of the 36th International Symposium on Automation and Robotics in Construction (ISARC), (ISARC), 1268–1275. https://doi.org/10.22260/isarc2019/0170 Teizer, J., Wolf, M., Golovina, O., Perschewski, M., Propach, M., Neges, M., & König, M. (2017). Internet of Things (IoT) for integrating environmental and localization data in Building Information Modeling (BIM). ISARC 2017 - Proceedings of the 34th International
Symposium on Automation and Robotics in Construction, (ISARC), 603–609. Xu, G., Li, M., Chen, C. H., & Wei, Y. (2018). Cloud asset-enabled integrated IoT platform for lean prefabricated construction. Automation in Construction, 93(September 2017), 123–134. https://doi.org/10.1016/j.autcon.2018.05.012 Zhong, R. Y., Peng, Y., Xue, F., Fang, J., Zou, W., Luo, H., … Huang, G. Q. (2017). Prefabricated construction enabled by the Internet-of-Things. Automation in Construction, 76, 59–70. https://doi.org/10.1016/j.autcon.2017.01.006
Zhou, C., & Ding, L. Y. (2017). Safety barrier warning system for underground construction sites using Internet-of-Things technologies. Automation in Construction, 83(May), 372–389. https://doi.org/10.1016/j.autcon.2017.07.005.

UEMK 2019 Proceedings Book
24/25 October 2019 Gaziantep University, TURKEY 511
CO-HYDROTHERMAL TREATMENT OF LIGNITE AND
WOOD SAWDUST
Sibel BAŞAKÇILARDAN KABAKCI Yalova University, Energy Systems Engineering Department, Engineering Faculty [email protected] Medya Hatun TANIŞ Yalova University, Department of Energy Systems Engineering, Institute of Science [email protected]
ABSTRACT: While energy directly affects the growth of a country's economy, it also contributes to the social and cultural development of societies. In order to revive and grow the economy, local resources should be included in energy production and cleaner energy production methods should be preferred. In this way, it is possible to produce
energy by using processes that have less impact on the environment by using local resources. High humidity, high ash content and low calorific value are the major disadvantages of using the low-grade coal without any pre-treatment. Particularly, high moisture and high volatile content make it disadvantageous to use the biomass resources. Hydrothermal treatment which is an effective thermochemical pre-treatment method, which can be applied to fuels to enhance their fuel properties. This study mainly investigates the production of coal-biomass hydrochars and discusses the benefits of applying hydrothermal treatment to lignite, biomass and their blend. In the experimental study Soma lignite, wood sawdust (obtained from poplar tree) and their blend (50%, wt.%) were hydrothermally treated at 230 °C for 90 min. Fuel properties of Soma lignite, poplar sawdust and their blend and their corresponding hydrochars were evaluated in terms of heating value, ultimate analysis, proximate analysis and combustion properties. It was observed that hydrothermal process caused changes in moisture, fixed carbon and ash contents of both the blend. As fuels, all hydrochars had higher fixed carbon content and higher heating values compared to their original samples. When coal-biomass blend was compared with its hydrochar, it was observed that fixed carbon content increased by 85% and heating value increased by 12%. Ignition temperatures and burnout temperatures of all hydrochars showed higher values when compared their raw samples, except the coal-biomass blend. The hydrochar of the blend showed lower ignition temperature (293.6 °C) and lower burnout temperature (707.7 °C) when compared to raw blend (315.4 °C and 715.4 °C respectively).
Key words: hydrothermal treatment, coal-biomass blends, hydrochar, fuel properties.

UEMK 2019 Proceedings Book
24/25 October 2019 Gaziantep University, TURKEY 512

UEMK 2019 Proceedings Book
24/25 October 2019 Gaziantep University, TURKEY 513
DETERMINATION OF EPILEPTIC EEG SİGNALS USING
MULTIWAVELET TRANSFORM AND RECURRENCE
QUANTIFICATION ANALYSIS METHODS
Andaç İMAK Elektrik-Elektronik Mühendisliği Munzur Üniversitesi Tunceli, Türkiye [email protected] Ömer Faruk ALÇİN Elektrik-Elektronik Mühendisliği Bingöl Üniversitesi Bingöl, Türkiye [email protected] Melih Cevdet İNCE Elektrik-Elektronik Mühendisliği Fırat Üniversitesi Elazığ, Türkiye [email protected]
ABSTRACT: Epilepsy is a neurological disease characterized by recurrent seizures. Electroencephalogram (EEG) is an indispensable tool in the diagnosis of epilepsy because it contains valuable information about different physiological conditions of the brain. The resulting detect these signals are integrated with epilepsy models are made to the local health system aims to develop a lot of work. Proposed in this study, the effects of the features obtained by using Multisignal Wavelet Packet and Recurrence Quantification
Analysis methods in the differentiation of epileptic EEG signals were observed. Attributes obtained from the methods were classified with Extreme Learning Machine, Support Vector Machines, K-Nearest Neighbors algorithm and Decision Trees. In addition, for the system with the best performance results, the Receiver Operating Characteristic curve which is commonly used in the classification assessment in medical diagnostic tests was analysed and the performance of the classifier was made. Finally, it was compared with the studies using the same data set in the literature. Key words: Multisignal Wavelet Packet, Recurrence Quantification Analysis, Electroencephalogram (EEG) signals, Epilepsy

UEMK 2019 Proceedings Book
24/25 October 2019 Gaziantep University, TURKEY 514
ÇOKLU DALGACIK DÖNÜŞÜMÜ VE TEKRARLILIK ÖLÇÜM ANALİZİ YÖNTEMLERİ KULLANILARAK EPİLEPTİK EEG SİNYALLERİNİN SAPTANMASI
ÖZET: Epilepsi tekrarlayan nöbetlerle karakterize edilen bir nörolojik hastalıktır. Elektroensefalogram (EEG) beynin farklı fizyolojik durumlar ile ilgili değerli bilgiler içermesinden dolayı epilepsi tanısında vazgeçilmez bir araçtır. Bundan dolayı epilepsi tespitinde yerel sağlık sistemlerine entegre modeller geliştirmeyi amaçlayan çalışmalar yapılmaktadır. Önerilen bu çalışmada Çoklu Dalgacık Dönüşümü (CDD) ve Tekrarlılık Ölçüm Analizi (TÖA) yöntemleri kullanılarak elde edilen özniteliklerin epileptik EEG sinyallerinin ayırt edilmesindeki etkileri, performansları gözlemlenmiştir. Yöntemlerden elde edilen öznitelikler Aşırı Öğrenme Makinesi (AÖM), Destek Vektör Makinesi (DVM), En Yakın K-Komşu Algoritması (KNN) ve Karar Ağaçları (KA) ile sınıflandırılmıştır. Ayrıca en iyi başarım sonuçları elde edilen sistem için tıpta tanı testlerinde sınıflandırma değerlendirmesinde yaygın olarak kullanılan Alıcı İşlem Karakteristikleri (ROC) eğrisi ile analizleri yapılarak sınıflandırıcının performans değerlendirmesi yapılmıştır. Son olarak da literatürdeki aynı veri seti kullanılarak yapılan çalışmalar ile karşılaştırılmıştır.
Anahtar sözcükler: Çoklu Dalgacık Dönüşümü (CDD), Tekrarlılık Ölçüm Analizi (TÖA), Elektroensefalogram (EEG) sinyali, Epilepsi GİRİŞ Küresel hastalık yükünün %0.6’sını oluşturan epilepsi, beyindeki binlerce veya milyonlarca nöronun ani elektrik boşalması sonucu oluşan nörolojik bir bozukluktur. Bu rahatsızlık kısa süreli istemsiz hareketlerin oluşturduğu tekrarlayan nöbetlerle karakterize edilmektedir. Dünya Sağlık Örgütünün (WHO) yaptığı analizlere göre düşük ve orta gelirli ülkelerde her 1000 kişide 7 ile 14 arasında epilepsi hastası olduğu tespit edilmiştir [1].
Elektroensefalogram (EEG), klinik ortamda beyin hastalıklarını teşhis etmek ve elektriksel aktivitesini incelemek için non-invaziv, düşük maliyetli ve etkili bir tekniktir [2]. Uzmanlar tarafından EEG cihazı yardımıyla beyindeki elektriksel faaliyetlerin izlenmesi genellikle 24 saat gibi uzun süreli bir zamana ihtiyaç duyulmaktadır. Ancak sinyallerin içerisinde bulunan gözlem noktalarının tümü karar verme konusunda katkı sağlamamaktadır [3]. Özellikle çok sayıda hasta göz önünde bulundurularak uzmanlar için epilepsi tespiti hem zaman alıcı hem de yanıltıcı bir süreç oluşturabilmektedir [4]. Aynı zamanda EEG sinyallerinin görsel analizi çok objektif bir işlem değildir. Aynı EEG sinyalleri için farklı uzmanlar çelişkili teşhisler verebilmektedir. Yapılan son bir araştırmada dört eğitimli uzmanlar arası duyarlılığın yalnızca % 92’sinin elde edildiğini göstermiştir [5]. Bu nedenle, epilepsinin otomatik tespiti için büyük bir talep vardır ve bu durum teşhis için gereken zamanı büyük ölçüde azaltabilir.

UEMK 2019 Proceedings Book
24/25 October 2019 Gaziantep University, TURKEY 515
Otomatik tanı tespit sistemlerine ihtiyaç doğrultusunda bilimsel araştırmalar 1970 yılının başlarında EEG ve Beyin Bilgisayar Arayüz (BBA) sistemleri ile insanın yaşam kalitesini etkileyen epilepsi hastalığının tespiti üzerine de çalışmalar başlamıştır. Epileptik nöbetleri saptamak amacıyla birçok EEG sinyal analizi ve işleme tekniği ortaya çıkmıştır. Genel olarak bu yöntemler temelde sınıflandırılma aşaması için öznitelik çıkarma yöntemleri ile sinyalin çeşitli özelliklerine odaklanılır. Literatürde bu sorunu ele alan çeşitli yöntemler sunulmuştur. Yapılan çalışmaların büyük bir çoğunluğunda Kaliforniya Bonn Üniversitesi Epileptoloji Bölümünde erişime açık EEG epileptik veri seti kullanılmıştır. Andrzejak ve ark. deterministik kaos teorisi ile lineer olmayanlığın, karmaşık zamansal davranışa yol açtığı basit deterministik dinamikleri ele almaktadır. Epileptojenik bölgelerden gelen EEG sinyallerinin diğer bölgelerdeki EEG sinyallere oranla lineer olmayan analizlerin faydalı nöbet tespit bilgisini sağlayabileceğini gösteren lineer stokastik dinamiklere dikkat çekmiştir [6]. Acharya ve ark. normal, iktal ve preiktal EEG sinyallerini sınıflandırmak için Hurst üssü, en büyük Lyapunov üssü, fraktal boyut ve yaklaşık entropi gibi kaotik özellikleri kullanmışlardır. Sınıflandırma algoritması olarak DVM ve Gaussian Karma Modeli (GKM) algoritmalarının kullanıldığı bu çalışmada GKM ile daha iyi sonuçlar elde edildiği tespit edilmiştir [7]. Srinivasan ve ark. EEG sinyallerinden özelliklerin çıkarılmasında, zaman ve frekansa dayalı beş öznitelik kullanmışlardır. Elman tekrarlayan sinir ağlarının sınıflayıcı olarak kullanıldığı sistemde
yüksek doğruluk oranları elde edilmiştir [8]. Kannathal ve ark. farklı entropi değerleri ve uyarlanabilir bir nöro-bulanık çıkarım algoritması tabanlı bir çalışma gerçekleştirmiştir [9]. Polat ve Güneş KA algoritmaları ve hızlı bir Fourier dönüşüm tabanı içeren bir hibrit model önerdiler [10]. Chua ve ark. normal, iktal ve preiktal EEG sinyallerini ayırt etmek için çeşitli daha yüksek dereceli spektral özellikler kullandılar ve ayrıca yüksek konsantrasyon seviyesine sahip çeşitli sınıflar için çıkarılan özniteliklerin ayırt edici aralıklar olduğunu gösterdiler [11]. Tzallas ve ark. epilepsi tanısı için yapay sinir ağları ile birlikte zaman-frekans dönüşüm özelliklerine sahip Wigner-Ville dönüşümünü önermişlerdir [12]. Acharya ve arkadaşları TÖA yönteminin sinyal hakkında doğru bilgi edinileceği üzerine dikkat çekmiştir. TÖA ile elde edilen öznitelikler normal ve iktal EEG sinyallerinin ayırt edilmesi üzerine DVM tabanlı bir sistem önermişlerdir [13]. Onay ve arkadaşı epileptik EEG sinyallerinin tespitinde Hilbert-Huang dönüşümü ile elde edilen fonksiyonlarının tekrarlılık grafiğinden faydalanmıştır. Elde edilen özniteliklerin DVM ile sınıflandırılması üzerine bir çalışma gerçekleştirmişlerdir [14]. Orhan ve arkadaşları Ayrık Dalgacık Dönüşümü (ADD) ile elde ettikleri öznitelikleri KNN algoritması ile kümeleyerek çok katmanlı sinir ağı giriş olarak kullanıp daha iyi sonuçlar elde etmeye çalışmışlardır [15]. Liang ve arkadaşları epileptik EEG sinyallerinin sınıflandırılması için yaklaşık entropi özniteliklerini kullanmışlardır. Ayrıca hızlı bir Fourier Dönüşümü kullanılarak hesaplanan EEG güç spektrumları eklenerek performansın arttırılması amaçlanmıştır. Elde edilen bu öznitelikler Temel Bileşen Analizi ile en iyi özellikler seçilerek çeşitli doğrusal ve doğrusal olmayan yöntemler tarafından sınıflandırılmıştır [16].

UEMK 2019 Proceedings Book
24/25 October 2019 Gaziantep University, TURKEY 516
Literatürdeki çalışmalarda öznitelik çıkarımı aşamasında ayarlanabilir pencere yapısından dolayı düşük ve yüksek frekanslı bileşenler açısından iyi bir frekans çözünürlük sağlandığı için dalgacık dönüşümü temelli birçok çalışmada mevcuttur. Subaşı normal ve epileptik EEG sinyallerini tespit etmek amacıyla ADD kullanılarak frekans alt bantlarına ayrıştırıldı. Daha sonra bu alt-bant frekanslarının mutlak değerlerinin ortalaması, ortalama gücü, standart sapma ve bitişik alt bandın mutlak değer otalamalarından oluşan 4 adet öznitelik elde edilmiş olup hibrit bir sistem ile sınıflandırılmıştır [17]. Swami ve ark. ADD kullanarak shanon entropy ve standart sapmalarının hesaplanması ile elde edilen öznitelikler DVM ile sınıflandırılması üzerine bir çalışma gerçekleştirmişlerdir [18]. Wang ve ark. epileptik nöbet tespiti için üç aşamalı hiyerarşik bir elektroensefalogram (EEG) sınıflandırma sistemi önerilmiştir. En iyi bazlı dalgacık paket entropisi yöntemini kullanarak elde edilen öznitelikler ikinci aşamada KNN sınıflandırıcı ile hiyerarşik bilgi tabanına yönelik eğitim aşaması gerçekleştirmişlerdir. Son olarak sınıflandırıcının en üst düzey ayrımcı kuralları kullanarak sınıflandırma aşaması test edilmiştir [19]. Guo ve ark. EEG sinyallerinden ADD ile düşük ve orta frekans göreceli bir dalgacık enerjisi algoritması ile iki adet öznitelik elde etmişlerdir. Daha sonrasında elde edilen bu özniteliklerin üç katmanlı ileri beslemeli bir sinir ağı mimarisi ile sınıflandırılması üzerine bir sistem önerdiler [20]. Bir başka çalışmada ise Guo ve ark. CDD yöntemine dikkat çekmiştir. CDD kullanarak elde
edilen frekans alt bantlarının yaklaşık entropi özniteliklerini kullanarak yapay sinir ağları ile sınıflandırmışlardır [21]. Peker ve arkadaşları çalışmalarında karmaşık sınıflandırıcılara dayanan EEG sinyallerinden epilepsi tanısı için yeni bir yöntem önermektedir. Çift ağaçlı karmaşık dalgacık dönüşümü kullanılarak elde edilen EEG frekans alt bantlarından istatistiksel ölçümlere dayanarak maksimum, minimum, aritmetik ortalama, standart sapma, ortanca değer olmak üzere beş öznitelik elde etmişlerdir. Son olarak bu öznitelikler karmaşık değerli sinir ağlarına girdi boyutu olarak sunulmuştur [24]. Bu çalışmada, literatürde bahsedilen çalışmalarla benzer olarak Kaliforniya Bonn Üniversitesi Epileptoloji Bölümünde erişime açık EEG epileptik veri seti kullanılmıştır. CDD ve TÖA temelli bir yaklaşım önerilmiştir. CDD kullanılarak EEG sinyallerinin sadece yakınsama katsayılarını değil, aynı zamanda detay katsayılarını da ayrıştırmak amaçlanmıştır. Önerilen yönteme ek olarak daha yüksek bir performans sağlaması için kısa ve durağan olmayan verileri analiz etmek için uygun TÖA yöntemi kullanılmıştır. Önerilen iki yaklaşımdan elde edilen öznitelikler ayrı ayrı ve birlikte AÖM, DVM, KNN, KA ile sınıflandırılmıştır. En iyi başarım elde edilen sistemin literatürdeki çalışmalar ile karşılaştırılması yapılmıştır. Ayrıca tıpta tanı testlerinde sınıflandırma değerlendirmesinde yaygın olarak kullanılan ROC eğrisi ile yapılan çalışmalarda en iyi başarım sonuçları elde edilen sistemin sınıflandırma performansı gösterilmiştir. Çalışmanın ikinci bölümünde uygulama adımları, veri seti ve teorik bilgiler anlatılmıştır. Üçüncü bölümde deneysel sonuçlar analiz edilerek literatürdeki çalışmalar ile karşılaştırılması sunulmuştur. Son bölümde ise çalışmanın sonuç kısmına yer verilmiştir.

UEMK 2019 Proceedings Book
24/25 October 2019 Gaziantep University, TURKEY 517
YÖNTEM Önerilen çalışma öznitelik çıkarma ve sınıflandırma olmak üzere iki ana aşamadan oluşmaktadır. İlk aşamada TÖA ve CDD metotları kullanılarak EEG sinyallerini temsil eden öznitelikler elde edilmiştir. Öznitelik çıkarma aşaması bir sinyalin karakteristik özelliklerini ortaya çıkarma açısından en önemli adımlardan bir tanesidir. İkinci aşamada ise sinyallerden oluşturulan ikili gruplarda özniteliklerin makine öğrenmesi yöntemleri üzerindeki başarımları irdelenmiştir. Sonuç olarak en iyi başarım sonucu elde edilen sınıflandırıcının ayrıca ROC analizi ile performansı gözlemlenmiştir. Şekil 1’de önerilen metodun kısa bir diyagramı gösterilmiştir.
Şekil 1. Önerilen Metot Diyagramı
Veri Seti
Bu çalışmada veri kümesi olarak kullanılan EEG sinyalleri, Bonn Üniversitesi Epileptoloji Bölümü veritabanından elde edilmiştir. Tüm veriler A, B, C, D ve E olarak adlandırılan 23.6 sn tek kanallı beş kümeden oluşmakla birlikte her bir küme 100 adet sinyal içermektedir. Tasarımlar, 12 bitlik bir analog dijital dönüştürücü ile dönüştürüldükten sonra 173.61-Hz örnekleme frekansıyla (toplam 4097 örnek) bir dijital ortama aktarılmıştır. A ve B kümeleri, sırasıyla sağlıklı gönüllülerden alınan ve sırasıyla gözler açık ve kapalı olan EEG kayıtlarından oluşmaktadır. C kümesi nöbetten önce beynin hipokampal karşıt hemisferinden elde edilen EEG kayıtlarından oluşur. D kümesi nöbet öncesi epileptojenik bölgeden elde edilen ve E kümesi ise hasta nöbet anındayken elde edilen EEG kayıtlarından oluşmaktadır [25]. Çoklu Dalgacık Dönüşümü
A Coifman ve arkadaşları çoğullaştırma yaklaşımları ve dalgacık arasındaki bağlantıyı genelleştirerek Çok Boyutlu Dalgacık Dönüşümü (CDD) olarak adlandırılan bir yöntem
önermişlerdir [26]. CDD, 1-D dalgacık ayrışmasının genelleştirilmesini temsil etmektedir.
EEG Sinyali Çoklu Dalgacık
Dönüşümü (db5)
+
Tekrarlılık Ölçüm
Analizi
Sınıflandırma
(KNN, KA, DVM, AÖM)Sonuç
En iyi başarım elde edilen
sınıflandırıcının ROC analizi

UEMK 2019 Proceedings Book
24/25 October 2019 Gaziantep University, TURKEY 518
Orijinal sinyal uzayı Ω0,0 yani ağacın kökünü temsil ettiğini varsayarsak, CDD bir alt uzay dal olarak düşünülebilir. Genel bir gösterimde düğüm Ω𝑗,𝑘 olarak ifade edildiğinde
buradaki j ölçeği ve k ölçek içindeki alt bant endeksini ifade etmektedir. Dalgacık
dönüşümü ile yaklaşım uzayı Ω𝑗,𝑘 → Ω𝑗+1,2𝑘 , Φj+1(t-2j+1k
kЄZve ayrıntı uzayı Ω𝑗,𝑘 →
Ω𝑗+1,2𝑘+1, ψj+1(t-2j+1k
kЄZ olmak üzere iki ortogonal alt uzayı olarak ayrıştırılır.
Denklem (1)’de yaklaşım uzayı, Denklem (2)’de de ayrıntı uzayı matematiksel olarak şu şekilde ifade edilmektedir:
𝛷𝑗,𝑘(𝑡) =1
√|2𝑗|
𝛷 (𝑡−2𝑗𝑘
2𝑗) (1)
𝜓𝑗,𝑘(𝑡) =1
√|2𝑗|
𝜓(𝑡−2𝑗𝑘
2𝑗) (2)
Burada 𝛷𝑗,𝑘(𝑡), 𝜓𝑗,𝑘(𝑡) dalgacık ve ölçeklendirme fonksiyonları, j ölçeği, k alt bant
endeksini ve 2𝑗 ise ölçekleme parametresi olarak bilinmektedir [27]. A CDD’nün, dalgacık dönüşümü arasındaki fark sonraki ayrıklaştırma seviyeleri için CDD sadece yakınsama katsayılarını değil, aynı zamanda detay katsayılarını da ayrıştırmaktadır. Bu işlem J kere tekrarlamaktadır. Bu tekrarlanma N adet orijinal
sinyaldeki örnek sayısında 𝐽 ≤ 𝑙𝑜𝑔2𝑁 olacak şekilde şartı sağlaması gerekmektedir. Tekrarlama işleminin sonucunda JxN boyutunda bir katsayı matrisi elde edilir. Böylece j = 1, 2,… , J çözünürlük seviyesinde N adet örnek sayısına sahip bir sinyalden
katsayılar 2j’lik bir ölçeklendirme ile bloklara bölünmüştür. Bu tekrarlamalı süreç, bir ikili dalgacık paket dönüşümü benzeri bir yapı oluşturmaktadır. Ağacın düğümleri farklı frekans özelliklerine sahip alt uzayları temsil etmektedir [27]. CDD’ne örnek Şekil 2’de üç ayrışma seviyesi ile şematik olarak gösterilmiştir.

UEMK 2019 Proceedings Book
24/25 October 2019 Gaziantep University, TURKEY 519
Şekil 2. j=3 İçin Alt Uzaylara Ayrışma Şeması
Tekrarlılık Ölçüm Analizi
Zaman serisi dinamiğinin temsili faz uzayının yeniden oluşturulmasını sağlar. Tekrarlılık durumlarının zamana bağlı davranışını göstermek için Tekrarlılık Noktalarının (TN) oluşturduğu NxN’lik grafiğin temel adımları şu şekildedir; 𝑅𝑖,𝑗 = ( − (||𝑋𝑖 − 𝑋𝑗||) i,j=1,…,N
(3) Burada; : Önceden tanımlanmış bir kesme mesafesi, || ⋅ ||: Öklid formu, N: Toplamda bulunan nokta sayısı,
: Bir yoğunluk fonksiyonudur. 𝑋𝑖’ninci nokta 𝑋𝑗’ninci nokta arasındaki uzaklık bir eşik değerinin altına ise 𝑅𝑖,𝑗=1 yani
nokta olan 𝑋𝑖 merkezli bir küre tanımlanır. Aksi takdirde 𝑅𝑖,𝑗=0 olur.
Tekrarlılık Ölçüm Analizi (TÖA) tekniği, tekrarlılık grafiğinin karakteristik yapılarının niceliksel analizine izin veren yöntemdir. Elde edilen tekrarlılık grafiklerinden aşağıdaki karakteristik parametreleri dikkate alınmıştır [28]: Tekrarlılık Noktoları (RR)
Tekrarlılık grafiğinde tekrarlama noktalarını karakterize eden genel göstergedir. Tekrarlama noktalarının yoğunluğunu gösterir [29]. Belirlilik (DET)
Köşegen çizgiler üzerinde konumlanmış tekrar noktalarının yüzdesidir. Bu çizgiler, sistemin durumlarının benzer evrim zamanlarını temsil etmektedir [30]. Ortalama köşegen çizgi uzunluğu (L)
Bu parametre, sistemin farklılaşmasının ortalama öngörme süresini veya tersini belirtir [30]. Entropi (ENTR)
Çapraz hatların uzaklıklarının olasılıksal dağılım değerleridir [30]. Kullanılan niceliksel parametrelerin denklemleri Tablo 1’de gösterilmiştir. Tablo 1. TÖA Parametreleri

UEMK 2019 Proceedings Book
24/25 October 2019 Gaziantep University, TURKEY 520
Parametre Denklemi
RR 1
𝑁2∑ 𝑅𝑖,𝑗
𝑁
𝑖,𝑗=0
(4)
DET ∑ 𝑙𝑃(𝑙)𝑁𝑖=𝑙𝑚𝑖𝑛
∑ 𝑅𝑖,𝑗𝑁𝑖,𝑗
(5)
L ∑ 𝑙𝑃(𝑙)𝑁𝑖=𝑙𝑚𝑖𝑛
∑ 𝑃𝑙𝑁𝑖,𝑗
(6)
ENTR − ∑ 𝑃(𝑙)𝑙𝑛𝑃(𝑙)
𝑁
𝑙=𝑙𝑚𝑖𝑛
(7)
Tablodaki denklemlerde bulunan 𝑙𝑚𝑖𝑛 minimum köşegen çizgi uzunluğu, P(𝑙) 𝑙 uzunluklu köşegen çizgilerin histogramını temsil etmektedir. Aşırı Öğrenme Makinesi
Aşırı Öğrenme Makinesi (AÖM), sinir ağı yapıları arasında basit bir mimariye sahip model olan Tek Gizli Katmanlı İleri Beslemeli TGKİB ağ yapısı için basit bir öğrenme yöntemidir [31]. Gradyan temelli geri yayılımlı algoritmalarda öğrenme sürecinde iteratif işlemler ile ağırlıklar ve eşik değerlerinin en uygun değerini buluncaya kadar değişmektedir [32]. AÖM ise uygulama sürecinde rastgele oluşturulmuş girdi ağırlıklarını ve eşik değerlerini kullanarak çıktı ağırlıklarını en küçük kareler yöntemi ile hesaplayarak eğitimini tamamlamış olur. Bu sayede AÖM hızlı bir öğrenme ve genelleme performansı avantajlarıyla benzersiz bir optimal çözüm üretir [33]. Girişler Xi = [X1, X2, … XN]
T€ RN vektörü ve karşılık gelen istenen çıkışlar ise Yi =[Y1, Y2, … YN]
T€ RN vektörü ile gösterilmiştir. Gizli katmanda M adet nörona ve g(x)
aktivasyon fonksiyonuna sahip TGKİB ağ için matematiksel gösterim aşağıdaki gibi ifade
edilmektedir.
∑ 𝛽𝑖𝑔(𝑊𝑖𝑋𝑗 + 𝑏𝑖) = 𝑄𝑗𝑀𝑖=1 , j=1,2,…,N (8)
N adet nöron sayısına sahip TGKİB ağ yapısında wi = [wi1, wi2, … , wim]T gizli nöron ile
giriş nöronları birbirine bağlayan giriş ağırlık vektörü, βi = [βi1, βi2, … , βim]T gizli nöron
ile çıkış nöronlarını birbirine bağlayan çıkış ağırlık vektörü, 𝑏𝑖 eklenen eşik değerini ve Qj = [Q1, Q2, … , Qj]
T ise beklenen çıkışı ifade etmektedir. TGKİB ağ yapısında 𝑄𝑗 ve 𝑌𝑗
arasındaki hatayı en aza indirmeyi hedeflemektedir. Beklenen çıkış ile olması istenilen çıkış ilişkisi arasında; ∑ ||𝑄𝑗 − 𝑌𝑗|| = 0𝑁𝑗=1 (9)
Şeklinde matematiksel olarak ifade edilmektedir. Hatanın sıfıra yaklaştığı varsayılırsa TGKİB ağ yapısı için matematiksel gösterim de olması istenilen çıkış eşitliği ile mevcut βi, 𝑤𝑖 ve 𝑏𝑖 için (8) eşitliği;

UEMK 2019 Proceedings Book
24/25 October 2019 Gaziantep University, TURKEY 521
∑ 𝛽𝑖𝑔(𝑊𝑖𝑋𝑗 + 𝑏𝑖) = 𝑌𝑗𝑀𝑖=1 , j=1,2,…,N (10)
Şeklinde tanımlanabilir. Burada tüm parametrelerinin ayarlanması gerektiğine dair geleneksel sinir ağı yapılarından farklı olarak öğrenme aşamasında giriş ağırlıkları ve gizli katman eşik değeri rastgele seçilerek H gizli katman çıkış matrisi elde edilmektedir.
H=[𝑔(𝑊1𝑋1 + 𝑏1) ⋯ 𝑔(𝑊𝑀𝑋1 + 𝑏𝑀)
⋮ ⋱ ⋮𝑔(𝑊1𝑋𝑁 + 𝑏1) ⋯ 𝑔(𝑊𝑀𝑋𝑁 + 𝑏𝑀)
]
𝑁𝑥𝑀
(11)
Şeklinde yazılabilir [34, 35]. Eşitlik (10)’daki matematiksel ifadeden yola çıkılarak N adet denklemin daha sade bir halde gösterimi; Hβ=Y (12) Eşitlik (12)’deki doğrusal bir denklemi tek seferde çözümleyip 𝛽 çıkış ağırlıklarının elde edilerek eğitimini tamamlaması için;
𝛽 = 𝐻†Y (13)
H NxN’lik bir kare matris ise tersi alınabilir ve 𝐻† = 𝐻−1 eşitliği yazılabilmektedir. Fakat genellikle gizli nöron sayısı M, farklı eğitim örnek sayısı N’den (M<<N ) çok daha azdır. Bu yüzden H matrisi kare matris olmayabilir. 𝛽 değerini elde etmek için H matrisinin Moore-Penrose Genelleştirilmiş Tersi yöntemi kullanılmaktadır. En küçük kareler yöntemlerinden biri kullanılarak önerilen öğrenme algoritması sadece en küçük eğitim
hatasını değil, aynı zamanda en küçük ağırlık seviyesine ulaşma eğilimindedir. Çünkü ağırlıklar ne kadar küçük olursa ağın genel performansı da doğru orantılı olarak iyi olmaktadır [36]. Destek Vektör Makineleri
Destek vektör makineleri (DVM) ilk olarak 1995'te Cortes ve Vapnik tarafından
sınıflandırma ve regresyon için kullanılan, danışmanlı öğrenme yaklaşımıyla çalışan bir öğrenme algoritması olarak önerilmiştir. Genel olarak DVM’nin çalışma prensibi sınıf etiketleri bilinen iki sınıfa ait örneklerin, eğitim ve test verileri olmak üzere iki gruba ayrılıp; eğitim verisi sonucu elde edilen bir karar fonksiyonu sayesinde test verilerinin sınıflandırılması işlemidir [37]. Karar Ağaçları
Bir şartın kendisinden başka bir şarta bağlı olduğu sezgisel bir yöntem olarak önerilmiştir. Tümevarım yöntemi ile benzer örüntüleri bulmak için kullanılabilecek bir denetimli öğrenme algoritmasıdır. Doğru tahmin elde etmek için pek çok if-then yapısına tabi tutarak en iyi sırayı bulmaya çalışır [38]. En Yakın K-Komşu Algoritması
Sınıf etiketleri belirli olan bir eğitim örneği kümesine dahil edilecek yeni bir örneğin hangi sınıfa ait olacağını mesafeye dayalı olarak sınıflandırma yapan denetimli bir

UEMK 2019 Proceedings Book
24/25 October 2019 Gaziantep University, TURKEY 522
öğrenme algoritmasıdır. Söz konusu bu yöntemin çalışma prensibi dahil edilecek örneğin, belirlenen bir k değerinde eğitim örnekleri arasındaki uzaklıkları hesaplanmaktadır. Genel olarak baskın sınıfa dahil olmaktadır. Denetimli bir öğrenme olduğundan dolayı gürültü parametrelerin varlığında sorun yaratabilmektedir [39]. Alıcı İşlem Karakteristikleri (ROC) Eğrisi
Tespit sistemlerinin bilimsel araştırma alanında önemli bir hale gelmesinden dolayı performans değerlendirmesinde ROC analizinin kullanımı giderek yaygınlaşmaktadır. Doğru pozitiflerin yanlış pozitiflere olan kesri olarak ifade edilebilir. Bir ROC eğrisi, farklı eşik değerleri için dikey eksen üzerinde doğru pozitifler (duyarlılık) ve yatay eksen üzerinde yanlış pozitiflerin (1-özgüllük) oranlarının yer aldığı bir eğridir [40]. ROC uzayı grafiği Şekil 3’te gösterilmiştir.
Şekil 3. ROC Uzay Grafiği
ROC eğrisi altında kalan alan ise sistemin doğruluğunu belirtmektedir. ROC uzayı grafiğinde iyi bir performansta sırasıyla (0.0), (0.1) ve (1.1) noktalarından geçen bir eğri oluşturmaktadır. BULGULAR Deneysel çalışma EEG veri seti epilepsi krizi var veya yok olacak şekilde 7 farklı durumun sınıflandırma problemine yönelik yapılmıştır. Önerilen yöntemde, çoklu dalgacık dönüşümü ve tekrarlılık ölçüm analizi yöntemi kullanılarak öznitelikler çıkarılmıştır. Elde edilen bu öznitelik çıkarma yöntemlerinin etkisi ayrı ayrı ve birlikte 7 farklı durumda test edilmesi için AÖM, KA, DVM ve KNN makine öğrenmesi yöntemleri kullanılmıştır. Çalışmada ilk olarak CDD’nde j=5 alınarak her bir sinyale ait 5x63 lük bir öznitelik matrisi elde edildi. Her bir özelliğe ait 5 adet parametrenin ortalaması alınarak bir sinyale ait 1x63 adet öznitelik çıkarılmıştır. Elde edilen öznitelikler KA, DVM, KNN ve AÖM
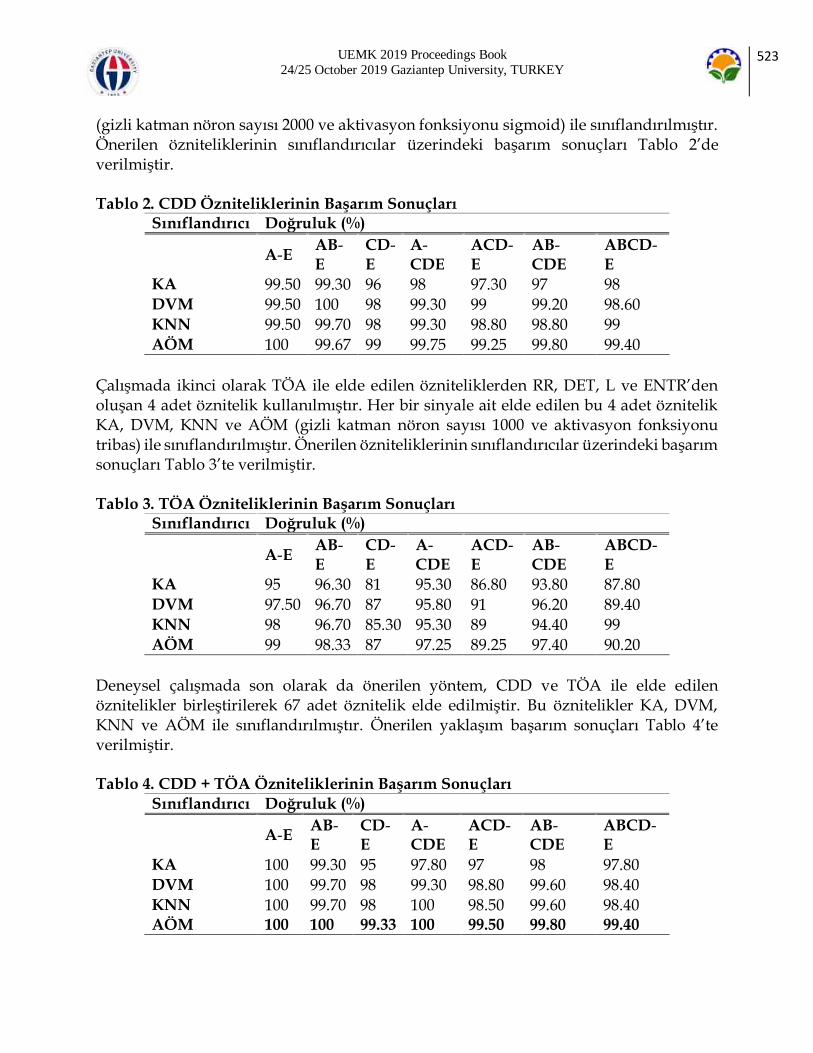
UEMK 2019 Proceedings Book
24/25 October 2019 Gaziantep University, TURKEY 523
(gizli katman nöron sayısı 2000 ve aktivasyon fonksiyonu sigmoid) ile sınıflandırılmıştır. Önerilen özniteliklerinin sınıflandırıcılar üzerindeki başarım sonuçları Tablo 2’de verilmiştir. Tablo 2. CDD Özniteliklerinin Başarım Sonuçları
Sınıflandırıcı Doğruluk (%)
A-E AB-E
CD-E
A-CDE
ACD-E
AB-CDE
ABCD-E
KA 99.50 99.30 96 98 97.30 97 98 DVM 99.50 100 98 99.30 99 99.20 98.60 KNN 99.50 99.70 98 99.30 98.80 98.80 99 AÖM 100 99.67 99 99.75 99.25 99.80 99.40
Çalışmada ikinci olarak TÖA ile elde edilen özniteliklerden RR, DET, L ve ENTR’den oluşan 4 adet öznitelik kullanılmıştır. Her bir sinyale ait elde edilen bu 4 adet öznitelik KA, DVM, KNN ve AÖM (gizli katman nöron sayısı 1000 ve aktivasyon fonksiyonu tribas) ile sınıflandırılmıştır. Önerilen özniteliklerinin sınıflandırıcılar üzerindeki başarım sonuçları Tablo 3’te verilmiştir. Tablo 3. TÖA Özniteliklerinin Başarım Sonuçları
Sınıflandırıcı Doğruluk (%)
A-E AB-E
CD-E
A-CDE
ACD-E
AB-CDE
ABCD-E
KA 95 96.30 81 95.30 86.80 93.80 87.80 DVM 97.50 96.70 87 95.80 91 96.20 89.40 KNN 98 96.70 85.30 95.30 89 94.40 99 AÖM 99 98.33 87 97.25 89.25 97.40 90.20
Deneysel çalışmada son olarak da önerilen yöntem, CDD ve TÖA ile elde edilen öznitelikler birleştirilerek 67 adet öznitelik elde edilmiştir. Bu öznitelikler KA, DVM, KNN ve AÖM ile sınıflandırılmıştır. Önerilen yaklaşım başarım sonuçları Tablo 4’te verilmiştir. Tablo 4. CDD + TÖA Özniteliklerinin Başarım Sonuçları
Sınıflandırıcı Doğruluk (%)
A-E AB-E
CD-E
A-CDE
ACD-E
AB-CDE
ABCD-E
KA 100 99.30 95 97.80 97 98 97.80 DVM 100 99.70 98 99.30 98.80 99.60 98.40 KNN 100 99.70 98 100 98.50 99.60 98.40 AÖM 100 100 99.33 100 99.50 99.80 99.40

UEMK 2019 Proceedings Book
24/25 October 2019 Gaziantep University, TURKEY 524
Öznitelik çıkarma yöntemlerinin ayrı ayrı ve birlikte kullanılarak elde edilen başarım oranları karşılaştırma yapıldığında, CDD ve TÖA birlikte kullanılması ile daha iyi sonuçlar elde edilmiştir. Ayrıca CDD ve TÖA yöntemleri birlikte kullanılarak elde edilen özniteliklerin Tablo 4’e bakıldığında AÖM diğer sınıflandırıcılara kıyasla daha iyi bir performans yakaladığı kaydedilen başarım sonuçlarından gözlemlenmektedir. Önerilen yaklaşımda CDD ve TÖA tabanlı EEG sinyallerinin AÖM ile sınıflandırılmasında, sınıflandırıcının gizli katman nöron sayısı 2000 ve gizli katmanda sigmoid aktivasyon fonksiyonu ampirik yöntemlerle seçilmiştir. Oluşturulan 7 durumda da yapılan testin hatasını daha iyi tahmin edebilmek için 10 kat çaprazlama kullanılarak doğruluk, duyarlılık ve özgüllük oranı Tablo 5’te gösterilmiştir. Tablo 5. Önerilen (CDD+TÖA) Özniteliklerin AÖM Üzerindeki Başarım Sonuçları
Durum Doğruluk (%) Duyarlılık (%) Özgüllük (%)
A-E 100 100 100
AB-E 100 100 100
CD-E 99.33 99.05 100
A-CDE 100 100 100
ACD-E 99.50 99.34 100
AB-CDE 99.80 99.51 100
ABCD-E 99.40 99.26 100
Tablo 5’e bakıldığında en yüksek başarım oranı A-E, AB-E, A-CDE durumları için %100 ve en düşük başarım oranı ise %99.33 olarak CD-E durumunda elde edilmiştir. AÖM’nin
tüm durumlar için ROC eğrileri sırasıyla Tablo 6’da verilmiştir. Tablo 6. Önerilen Yöntemin 7 Durum İçin ROC Eğrisi
|A|-|E|
|AB|-|E|

UEMK 2019 Proceedings Book
24/25 October 2019 Gaziantep University, TURKEY 525
|CD|-|E|
|A|-|CDE|
|ACD|-|E|
|AB|-|CDE|
|ABCD|-|E|
ROC eğrilerinde sınıflandırıcının iyi bir performans göstermesi için koordinat olarak sırasıyla (0.0), (0.1) ve (1,1) noktasına yakın geçmesi istenmektedir. Tablo 6’da analiz sonuçları incelendiğinde sınıflandırıcının önerilen öznitelik çıkarma yöntemleri ile ikili grupları iyi bir şekilde ayır ettiği gözlemlenmektedir. Ayrıca deneysel çalışmadan elde edilen sonuçlar literatürde aynı veri setini ve aynı durumları dikkate alan çalışmalarla da karşılaştırılmıştır. Karşılaştırmalı sonuçlar ABCD-E ve A-E durumları için sırasıyla Tablo 7’de verilmiştir.

UEMK 2019 Proceedings Book
24/25 October 2019 Gaziantep University, TURKEY 526
Tablo 7. ABCD-E ve A-E Durumları İçin Karşılaştırma Tablosu
Yazar Yöntem Durum
Veri Seçimi
Doğruluk
Tzallas ve ark. [12] Wigner-Ville Dönüşümü+ Yapay Sinir Ağı
ABCD-E
%50 eğitim, %50 test
%97.73
Orhan ve ark. [15] ADD+ Çok Katmanlı Sinir Ağı ABCD-E
%50 eğitim, %50 test
%99.60
Liang ve ark. [16] ADD-Yaklaşık Entropi+ Doğrusal veya Doğrusal Olmayan Sınıflandırıcı
ABCD-E
%60 eğitim, %40 test
%98.51
Guo ve ark. [21] CDD–Yaklaşık Entropi+ Çok katmanlı Sinir Ağı
ABCD-E
%50 eğitim, %50 test
%98.27
Peker ve ark. [24] Çift Ağaçlı Karmaşık Dalgacık Dönüşümü +Karmaşık Değerli Sinir Ağı
ABCD-E
10 kat çaprazlama
%99.15
Önerilen Sistem TÖA- CDD+ AÖM ABCD-E
10 kat çaprazlama
%99.40
Srinivasan ve ark. [8]
Zaman-Frekans Domeni Özellikleri+ Tekrarlayan Sinir Ağı
A-E %60 eğitim, %40 test
%99.60
Kannathal ve ark. [9]
Entropi+ Uyarlamalı Sinirsel Bulanık Çıkarım Sistemi
A-E %60 eğitim, %40 test
%92.22
Polat ve Güneş [10]
Hızlı Fourier Dönüşümü+ KA A-E 10 kat çaprazlama
%98.72
Tzallas ve ark. [12] Wigner-Ville Dönüşümü+ Yapay Sinir Ağı
A-E %50 eğitim, %50 test
%100
Subaşı [17] ADD+ Hibrit Sistem A-E %60 eğitim, %40 test
%94.50
Swami ve ark. [18] ADD+ DVM A-E 10 kat çaprazlama
%99.53

UEMK 2019 Proceedings Book
24/25 October 2019 Gaziantep University, TURKEY 527
Wang ve ark. [19] ADD+ Hiyerarşik Sınıflandırma Sistemi
A-E 10 kat çaprazlama
%99.44
Guo ve ark. [20] ADD+ Çok Katmanlı Sinir Ağı A-E 10 kat çaprazlama
%95.20
Guo ve ark. [21] CDD–Yaklaşık Entropi+ Çok katmanlı Sinir Ağı
A-E %50 eğitim, %50 test
%99.85
Önerilen Sistem TÖA- CDD+ AÖM A-E 10 kat çaprazlama
%100
Literatürde aynı veri seti, farklı sinyal işleme ve makine öğrenmesi yöntemi kullanılarak önerilen çalışmalarla birlikte Guo ve ark. [21] önerdiği CDD ve yaklaşık entropi özniteliklerinin çok katmanlı bir sinir ağı yapısı kullanılarak yapılan sınıflandırma çalışması ile karşılaştırma yapılmıştır. Önerilen sistemde 10 kat çaprazlama yapılarak rastgele ayırma yaklaşımının farklı sonuçlar üretme ihtimalini ortadan kaldırarak sistemin güvenilirliğinin arttırılması hedeflenmiştir. Yapılan bu karşılaştırma sonucunda genel olarak hem veri seçimi hem de başarım sonucu olarak önerilen yöntemin epilepsi ve normal EEG sinyallerinin sınıflandırılmasında yararlı bir parametre olarak sunulabileceği geçerliliğini göstermektedir. SONUÇ Gelişen teknolojiyle birlikte her alanda olduğu gibi biyomedikal alanda da önemli gelişmeler gerçekleştirilmektedir. Dünyadaki en yaygın nörolojik hastalıklarından biri olarak görülen epilepsi hastalığının tespitindeki zorluklardan dolayı bu alandaki bilimsel araştırmalar nöbetlerin saptanması üzerine yoğunlaşmıştır. Böylece nöbet tespitinde nörofizyologlara yardımcı olmakla birlikte hastanın nöbet başlangıcında süreci uyarılarak ciddi yaralanmaların önlenebilmesi ile yaşam kalitesini yükseltmeyi hedefleyen bir tanı aracı amaçlanmıştır. Önerilen öznitelik çıkarma yöntemleri ve ikinci aşamasında KA, DVM, KNN ve AÖM ile sınıflandırılarak iyi bir başarım ve kısa sürede sonuçlanması hedeflenmiştir. Genel olarak
en yüksek %100 (A-E, AB-E, A-CDE) ve en düşük %99.33 (CD-E) ile iyi sonuçlar AÖM ile kaydedilmiştir. Kullanılan öznitelik çıkarma yöntemleri ve AÖM ile tanı kararının çok kısa sürede, iyi başarım oranı vermesi sağlanmıştır. Yöntemin literatürde aynı veri seti kullanılarak yapılan çalışmalarla kıyasla iyi bir başarım göstermesi ile birlikte tek gizli katmanlı ileri beslemeli ağ mimarisine sahip AÖM’ nin medikal tanı sistemlerinde iyi bir

UEMK 2019 Proceedings Book
24/25 October 2019 Gaziantep University, TURKEY 528
genelleme performansı elde etmek için öğrenme algoritması olarak kullanılabileceğini göstermiştir. KAYNAKLAR [1] World Health Organization (2019). Retrieved September 22, 2019 from https://www.who.int/en/news-room/fact-sheets/detail/epilepsy [2] Stam, C. J., Pijn, J. P. M., Suffczynski, P., & Da Silva, F. L. (1999). Dynamics of the human alpha rhythm: evidence for non-linearity?. Clinical Neurophysiology, 110, 1801-
1813. [3] Gotman, J. (1999). Automatic detection of seizures and spikes. Journal of Clinical Neurophysiology, 16, 130-140. [4] Tzimourta, K. D., Astrakas, L. G., Tsipouras, M. G., Giannakeas, N., Tzallas, A. T., & Konitsiotis, S. (2017, June). Wavelet based classification of epileptic seizures in EEG signals. In 2017 IEEE 30th International Symposium on Computer-Based Medical Systems (CBMS) (pp. 35-39). IEEE. [5] Wilson, S. B., Scheuer, M. L., Plummer, C., Young, B., & Pacia, S. (2003). Seizure detection: correlation of human experts. Clinical Neurophysiology, 114, 2156-2164. [6] Andrzejak, R. G., Widman, G., Lehnertz, K., Rieke, C., David, P., & Elger, C. E. (2001). The epileptic process as nonlinear deterministic dynamics in a stochastic environment: an evaluation on mesial temporal lobe epilepsy. Epilepsy research, 44, 129-140. [7] Acharya, U. R., Chua, C. K., Lim, T. C., Dorithy, & Suri, J. S. (2009). Automatic identification of epileptic EEG signals using nonlinear parameters. Journal of Mechanics in Medicine and Biology, 9, 539-553.
[8] Srinivasan, V., Eswaran, C., & Sriraam, A. N. (2005). Artificial neural network based epileptic detection using time-domain and frequency-domain features. Journal of Medical Systems, 29, 647-660. [9] Kannathal, N., Choo, M. L., Acharya, U. R., & Sadasivan, P. K. (2005). Entropies for detection of epilepsy in EEG. Computer Methods and Programs in Biomedicine, 80, 187-194. [10] Polat, K., & Güneş, S. (2007). Classification of epileptiform EEG using a hybrid system based on decision tree classifier and fast Fourier transform. Applied Mathematics and Computation, 187, 1017-1026.
[11] Chandran, V., Acharya, R., & Lim, C. M. (2007, August). Higher order spectral (HOS) analysis of epileptic EEG signals. In 2007 29th Annual International Conference of the IEEE Engineering in Medicine and Biology Society (pp. 6495-6498). IEEE. [12] Tzallas, A. T., Tsipouras, M. G., & Fotiadis, D. I. (2007). Automatic seizure detection based on time-frequency analysis and artificial neural networks. Computational Intelligence and Neuroscience, 2007.
UEMK 2019 Proceedings Book
24/25 October 2019 Gaziantep University, TURKEY 529
[13] Acharya, U. R., Sree, S. V., Chattopadhyay, S., Yu, W., & Ang, P. C. A. (2011). Application of recurrence quantification analysis for the automated identification of epileptic EEG signals. International journal of neural systems, 21, 199-211. [14] Onay, F. K. & Cemal, K. (2014, November). İçsel Mod Fonksiyonlarının Tekrarlılık Grafiği Kullanılarak EEG Sinyallerinde Epileptik Nöbetin Algılanması. In 2014 27th Bilgisayar ve Biyomedikal Mühendisliği Sempozyumu (pp. 613-617). [15] Orhan, U., Hekim, M., & Ozer, M. (2011). EEG signals classification using the K-means clustering and a multilayer perceptron neural network model. Expert Systems with Applications, 38, 13475-13481. [16] Liang, S. F., Wang, H. C., & Chang, W. L. (2010). Combination of EEG complexity and spectral analysis for epilepsy diagnosis and seizure detection. EURASIP journal on
advances in signal processing, 2010, 853434. [17] Subasi, A. (2007). EEG signal classification using wavelet feature extraction and a mixture of expert model. Expert Systems with Applications, 32, 1084-1093. [18] Swami, P., Godiyal, A. K., Santhosh, J., Panigrahi, B. K., Bhatia, M., & Anand, S. (2014, December). Robust expert system design for automated detection of epileptic seizures using SVM classifier. In 2014 International Conference on Parallel, Distributed and Grid Computing (pp. 219-222). IEEE. [19] Wang, D., Miao, D., & Xie, C. (2011). Best basis-based wavelet packet entropy feature extraction and hierarchical EEG classification for epileptic detection. Expert Systems with Applications, 38, 14314-14320. [20] Guo, L., Rivero, D., Seoane, J. A., & Pazos, A. (2009, June). Classification of EEG signals using relative wavelet energy and artificial neural networks. In Proceedings of the first ACM/SIGEVO Summit on Genetic and Evolutionary Computation (pp. 177-184). ACM. [21] Guo, L., Rivero, D., & Pazos, A. (2010). Epileptic seizure detection using multiwavelet transform based approximate entropy and artificial neural networks. Journal of
neuroscience methods, 193, 156-163. [24] Peker, M., Sen, B., & Delen, D. (2015). A novel method for automated diagnosis of epilepsy using complex-valued classifiers. IEEE journal of biomedical and health informatics, 20, 108-118. [25] Andrzejak, R. G., Widman, G., Lehnertz, K., Rieke, C., David, P., & Elger, C. E. (2001). The epileptic process as nonlinear deterministic dynamics in a stochastic environment: an evaluation on mesial temporal lobe epilepsy. Epilepsy research, 44, 129-140. [26]Coifman, R. R., Meyer, Y., & Wickerhauser, V. (1992). Wavelet analysis and signal processing. In In Wavelets and Their Applications, Jones and Barlett, pp. 153-178. [27] Mallat, S. (2008). A wavelet tour of signal processing: The sparse way, third edition. Academic Press, pp. 386-387. [28] Stangalini, M., Ermolli, I., Consolini, G., & Giorgi, F. (2017). Recurrence quantification analysis of two solar cycle indices. Journal of Space Weather and Space Climate, 7 (A5), 1-13. [29] Eckmann, J. P., Kamphorst, S.O. & Ruelle, D. (1987). Recurrence plots of dynamical systems. EPL (Europhysics Letters), 4, 973-977.

UEMK 2019 Proceedings Book
24/25 October 2019 Gaziantep University, TURKEY 530
[31] Huang, G. B., Zhu, Q. Y. & Siew, C. K. (2006). Extreme learning machine: theory and applications. Neurocomputing, 70, 489-501
[32] Ertuğrul, Ö. F., & Kaya, Y. (2014). A detailed analysis on extreme learning machine and novel approaches based on ELM. American Journal of computer science and engineering,
1, 43-50. [33] Alcin, O. F., Sengur, A., Ghofrani, S. & Ince, M.C. (2014). GA-SELM: Greedy algorithms for sparse extreme learning machine. Measurement, 55, 126-132. [34] Huang, G. B., Zhu, Q. Y. & Siew, C. K. (2004). Extreme learning machine: a new learning scheme of feedforward neural networks. IEEE International Joint Conference on Neural Networks, Budapest, 25-29 July, 2, 985-990. [35] Alçin, Ö.F., Şengür, A., & İnce, M.C. (2015). İleri-geri takip algoritmasi tabanli seyrek aşiri öğrenme makinesi. Gazi Üniversitesi Mühendislik-Mimarlık Fakültesi Dergisi, 30, 111-117. [36] Huang, G. B., Zhu, Q. Y. & Siew, C. K. (2006). Extreme learning machine: theory and applications. Neurocomputing, 70, 489-501. [37] Varady, P., Micsik, T., Benedek, S. & Benyo, Z. (2002). A novel method for the detection of apnea and hypopnea events in respiration signals. IEEE Trans. Biomed. Eng., 49, 936–942. [38] Emel, G.G. & Taşkın, Ç. (2005). Veri madenciliğinde karar ağaçları ve bir satış analizi uygulaması. Eskişehir Osmangazi Üniversitesi Sosyal Bilimler Dergisi, 6, 221-239. [39] Desai, U. (2017, May). Automated detection of cardiac health condition using linear techniques. In 2017 2nd IEEE International Conference on Recent Trends in Electronics, Information & Communication Technology (RTEICT) (pp. 890-894). IEEE. [40] Spackman, K.A. (1989). Signal detection theory: Valuable tools for evaluating inductive learning. In Proceedings of the sixth international workshop on Machine learning, pp.
160-163.

UEMK 2019 Proceedings Book
24/25 October 2019 Gaziantep University, TURKEY 531
CRASHWORTHINESS OF BASALT FIBER REINFORCED
COMPOSITE PIPES SUBJECTED TO QUASI-STATIC
LATERAL COMPRESSION
Özkan ÖZBEK Gaziantep University, Mechanical Engineering Department, 27310, Gaziantep, Turkey [email protected] Ömer Yavuz BOZKURT Gaziantep University, Mechanical Engineering Department, 27310, Gaziantep, Turkey [email protected] Ahmet ERKLİĞ Gaziantep University, Mechanical Engineering Department, 27310, Gaziantep, Turkey [email protected]
ABSTRACT: This paper aimed to explore the failure modes and crashworthiness characteristics of basalt fiber reinforced pipes (BFRP) subjected to quasi-static lateral compression. Experimental investigations were performed on various fiber orientation angles (±40°, ±55°, and ±70°) of the basalt FRP fabricated by filament winding technique. Fracture mechanisms of pipe samples were discussed to understand failure modes. The increase in fiber orientation resulted with increase in energy absorption capability and load carrying capacity. The pipe sample with ±70° fiber orientation angle showed the maximum specific energy absorption of 3.07 J/g. Maximum values of initial peak load and mean crushing loads were also obtained from the sample with ±70° fiber orientation angle. This is attributed to fiber closer position against to direction of application loading. In addition, failure modes and crack propagation were investigated on crushing history at different stroke values of load-displacement curves. For all samples, mid-surface of samples were observed as damage region beginning with a buckling behavior of the vertical walls. In conclusion, fiber orientation angle had a significant influences on the crashworthiness characteristics of filament wound BFRP. Key words: crashworthiness, basal fiber, fiber orientation angle, filament winding INTRODUCTION
UEMK 2019 Proceedings Book
24/25 October 2019 Gaziantep University, TURKEY 532
In recent years, polymer based composites have been an interesting class of materials used in applications due to their excellent mechanical characteristics such as higher specific strength and stiffness, better damping, longer service life which are the limitations of classical engineering materials. Furthermore, they may offer the higher specific energy absorption with lightweight structures in a crash event. While metallic crash absorber materials show the phenomenon of plastic deformation, progressive collapse in a brittle manner [1] is forming for composite materials. The use of thin-walled tubular composites decreasing the size and mass of the material or reducing negative inertial effects have been a creative way to achieve higher ability to absorb energy in crushing applications. At present, a considerable amount of scientific papers devoted to energy absorption capabilities of thin walled composites are seen in the literature [2-4]. Mahdi et al. [5] investigated the effects of fiber orientation angle on the crashworthiness characteristics of E-glass/epoxy reinforced composite pipes. The six different fiber orientation angles were considered as 0°, 15°, 30°, 45°, 60° and 75°. 15°/-75° and 75°/-15° were being recommended for better load carrying and energy absorption capability. Sebaey and Mahdi [6] examined the crashworthiness behaviors of glass/epoxy composite tubes fabricated by filament winding. The samples were compressed after impacted by Charpy impact tester. Various places such as side, top, down were exposed to impact energy with
more than one time. They explained that top impacted samples had less sensitivity to impact damage compared to side impacted ones. Kim et al. [7] researched the crushing behaviors of composite tubes. Carbon/epoxy, kevlar/epoxy and interply carbon-kevlar/epoxy composite tubes were utilized to obtain specific energy absorption, maximum peak load, mean crushing load. According to results, carbon/epoxy provided to the best energy absorption capability with the value of 81.7%. Also, kevlar /epoxy gave the worst specific absorption in their studies. The main emphasis of this paper is the effects of the fiber orientation angle on the crashworthiness characteristics of basalt fiber reinforced composite pipes fabricated by filament winding technique. The samples having different fiber orientation angles (±(40°), ±(55°), ±(70°)) has been subjected to quasi-static lateral compression loadings and compared with each configurations based on the load carrying capacity, energy absorption capability. MATERIALS AND METHODS Sample Preparation The basalt roving fiber with 2.4K linear density (tex), shown in Figure 1, are used as reinforcement and are procured from Tila Kompozit company, Turkey. The mechanical properties of the basalt fiber reinforcement are given in Table 1.

UEMK 2019 Proceedings Book
24/25 October 2019 Gaziantep University, TURKEY 533
Figure 1. Basalt roving fiber
Table 1. Mechanical properties of basalt fiber reinforcement
Tensile strength (MPa)
Tensile modulus (GPa)
Elongation at break (%)
Filament diameter (μm)
Specific density (g/cm3)
3200 90 3.1 13 2.78
For the matrix component of pipes, the epoxy (EPIKOTE MGS LR160 resin) and hardener (EPIKURE Curing Agent MGS LH260S), which are supplied from Dost Kimya A.Ş., Turkey, are mixed with a stoichiometric weight ratio of 100:35, respectively.
The filament winding technique, shown in Figure 2, is used to produce all considered pipe samples. The fabrication process of fiber reinforced composite pipes can be categorized into three distinct steps as preliminary preparations, process conducting and post processing. As preliminary preparations, release wax is applied on the mandrel and release agent film is wrapped at first. Afterwards, release wax is again implemented to pull out the mandrel from the pipe at the end of the winding process. The glass wool is exerted to obtain smooth surface inside the samples. Fiber reinforcement is placed with helping of resin bath and rollers. By using epoxy and hardener, resin mixture is prepared and deposited into the resin bath tank. Then the process at desired parameters is begun by loading the motion codes to machine, as seen in Figure 3.
Figure 2. Filament winding technique
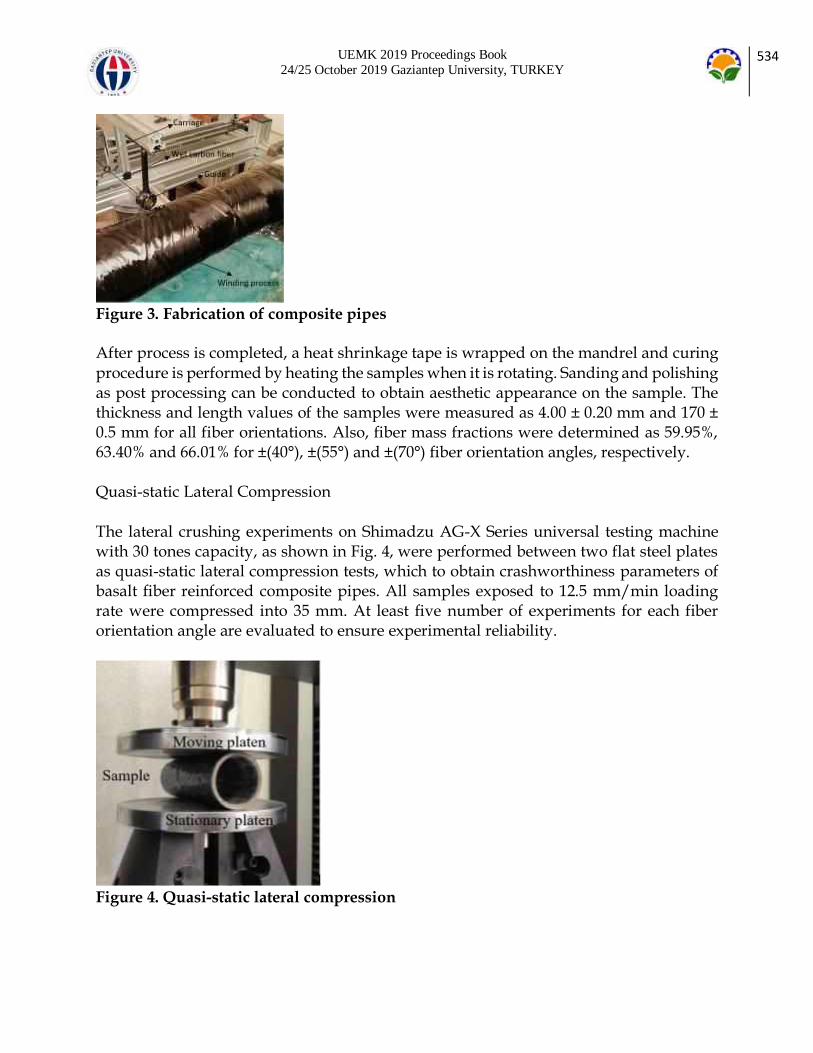
UEMK 2019 Proceedings Book
24/25 October 2019 Gaziantep University, TURKEY 534
Figure 3. Fabrication of composite pipes
After process is completed, a heat shrinkage tape is wrapped on the mandrel and curing procedure is performed by heating the samples when it is rotating. Sanding and polishing as post processing can be conducted to obtain aesthetic appearance on the sample. The thickness and length values of the samples were measured as 4.00 ± 0.20 mm and 170 ± 0.5 mm for all fiber orientations. Also, fiber mass fractions were determined as 59.95%, 63.40% and 66.01% for ±(40°), ±(55°) and ±(70°) fiber orientation angles, respectively. Quasi-static Lateral Compression The lateral crushing experiments on Shimadzu AG-X Series universal testing machine with 30 tones capacity, as shown in Fig. 4, were performed between two flat steel plates as quasi-static lateral compression tests, which to obtain crashworthiness parameters of basalt fiber reinforced composite pipes. All samples exposed to 12.5 mm/min loading rate were compressed into 35 mm. At least five number of experiments for each fiber orientation angle are evaluated to ensure experimental reliability.
Figure 4. Quasi-static lateral compression

UEMK 2019 Proceedings Book
24/25 October 2019 Gaziantep University, TURKEY 535
Three distinctive stages, shown in Figure 5, are considered in crushing process [8]. The material behaves elastically in pre-crushing stage and initial peak load is noted. After that, post-crushing presents the propagation of crushing in progressive or catastrophic manner. This stage is the crucial to measure crashworthiness parameters except initial peak load and to understand failure mechanisms. Lastly, when load increases suddenly which means densification phase, crushing process is finished.
Figure 5. Typical load-displacement curve of crushing process
The crashworthiness parameters of the samples are calculated by considering load-displacement curves obtained from experiments. Total energy absorption, E is the area under load-displacement curve between crush distances, which is shown in Figure 5, and calculated by integration of load, P as seen Eqn. (1);
𝐸 = ∫ 𝑃(𝑠)
𝑆𝑓
𝑆𝑖
𝑑𝑠 (1)
where Si and Sf represents the initial and final stroke values in compression after the first initial peak load. Also, mean load is found from the integration of each load value depending on stroke, P(s) in crushing propagation stage as in Eqn. (2);
𝑃𝑚 =∫ 𝑃(𝑠)𝑆𝑓𝑆𝑖
𝑑𝑠
𝑆𝑓 (2)
Crushing load efficiency, ηf, which is the percentage ratio of mean load and initial peak load. It is obtained from Eqn. (3);
𝑓 = 100(𝑃𝑚/𝑃𝑖) (3)
where the peak load (Pi), is the initial peak load in the load-displacement curve. Specific energy absorption, Es is the absorbed energy per unit mass of crushing sample and calculated with Eq. (4);
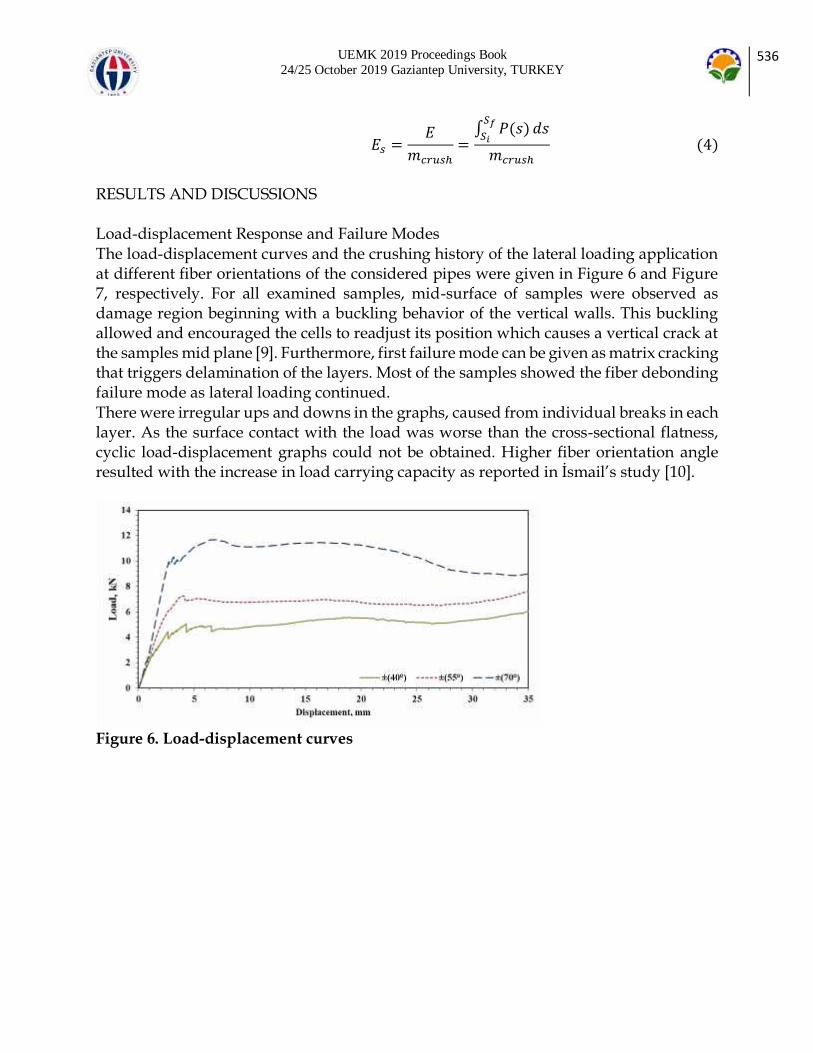
UEMK 2019 Proceedings Book
24/25 October 2019 Gaziantep University, TURKEY 536
𝐸𝑠 =𝐸
𝑚𝑐𝑟𝑢𝑠ℎ=∫ 𝑃(𝑠)𝑆𝑓𝑆𝑖
𝑑𝑠
𝑚𝑐𝑟𝑢𝑠ℎ (4)
RESULTS AND DISCUSSIONS Load-displacement Response and Failure Modes The load-displacement curves and the crushing history of the lateral loading application at different fiber orientations of the considered pipes were given in Figure 6 and Figure 7, respectively. For all examined samples, mid-surface of samples were observed as damage region beginning with a buckling behavior of the vertical walls. This buckling allowed and encouraged the cells to readjust its position which causes a vertical crack at the samples mid plane [9]. Furthermore, first failure mode can be given as matrix cracking that triggers delamination of the layers. Most of the samples showed the fiber debonding failure mode as lateral loading continued. There were irregular ups and downs in the graphs, caused from individual breaks in each layer. As the surface contact with the load was worse than the cross-sectional flatness, cyclic load-displacement graphs could not be obtained. Higher fiber orientation angle resulted with the increase in load carrying capacity as reported in İsmail’s study [10].
Figure 6. Load-displacement curves

UEMK 2019 Proceedings Book
24/25 October 2019 Gaziantep University, TURKEY 537
Figure 7. Crushing history
After crushing application, the samples returned back an amount because of spring back effect. But, they did not take the original circular characteristics shapes due to plastic deformation and failure inside the samples. The last appearances of the samples with respect to fiber orientation angle were given in Figure 8 as top and side view. The failure process was initiated with the matrix cracking and proceeding of delamination. Buckling of the samples, which caused the vertical cracks in mid plane, had the crucial role for fiber breakage. Fiber breakage failures, especially for ±(55°) and ±(70°) were achieved as longitudinal cracks that happened a left and right sides of the samples. Lastly, the combination of fiber debonding, matrix cracking, delamination and fiber breakage of failures were observed in all samples as seen on crushed samples.

UEMK 2019 Proceedings Book
24/25 October 2019 Gaziantep University, TURKEY 538
Figure 8. Fracture shapes and failure modes of crushed samples
Crushing Load Efficiency The initial peak load and the mean crushing load, which are references for the spring back values and the crush load stability, were shown in Figure 9. BFRP at ±(70°) fiber orientation exhibited the maximum initial peak and mean crushing load values as 10.33 kN and 10.55 kN due to fiber approaching to loading direction. The lateral crushing load efficiency values for samples of ±(40°), ±(55°) and ±(70°) fiber orientations were presented
in Figure 10. In general cases of the lateral crushing application, mean load was greater than the initial peak load values. Consequently, more than 100% load efficiency, especially in ±(40°) and ±(70°) samples, took place on the results. It can be said that higher fiber orientation angle resulted in decrease for crushing load efficiency.
Figure 9. Initial peak and mean crushing loads
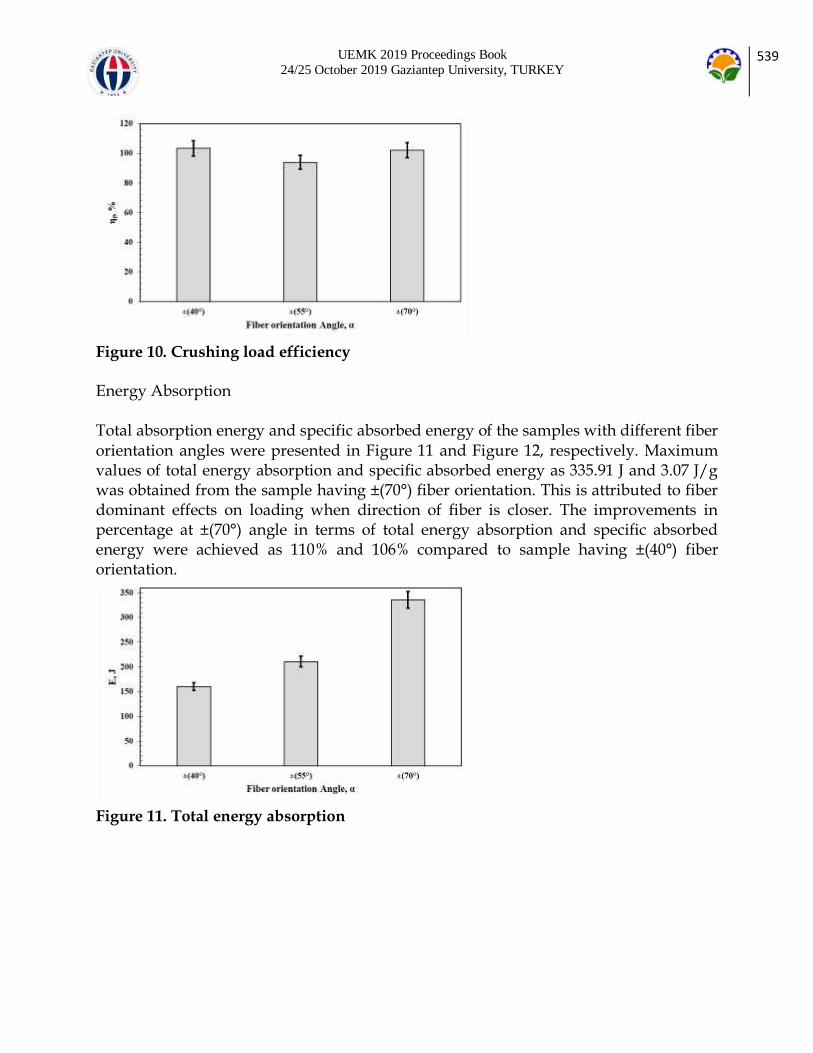
UEMK 2019 Proceedings Book
24/25 October 2019 Gaziantep University, TURKEY 539
Figure 10. Crushing load efficiency
Energy Absorption Total absorption energy and specific absorbed energy of the samples with different fiber orientation angles were presented in Figure 11 and Figure 12, respectively. Maximum values of total energy absorption and specific absorbed energy as 335.91 J and 3.07 J/g was obtained from the sample having ±(70°) fiber orientation. This is attributed to fiber dominant effects on loading when direction of fiber is closer. The improvements in percentage at ±(70°) angle in terms of total energy absorption and specific absorbed energy were achieved as 110% and 106% compared to sample having ±(40°) fiber orientation.
Figure 11. Total energy absorption
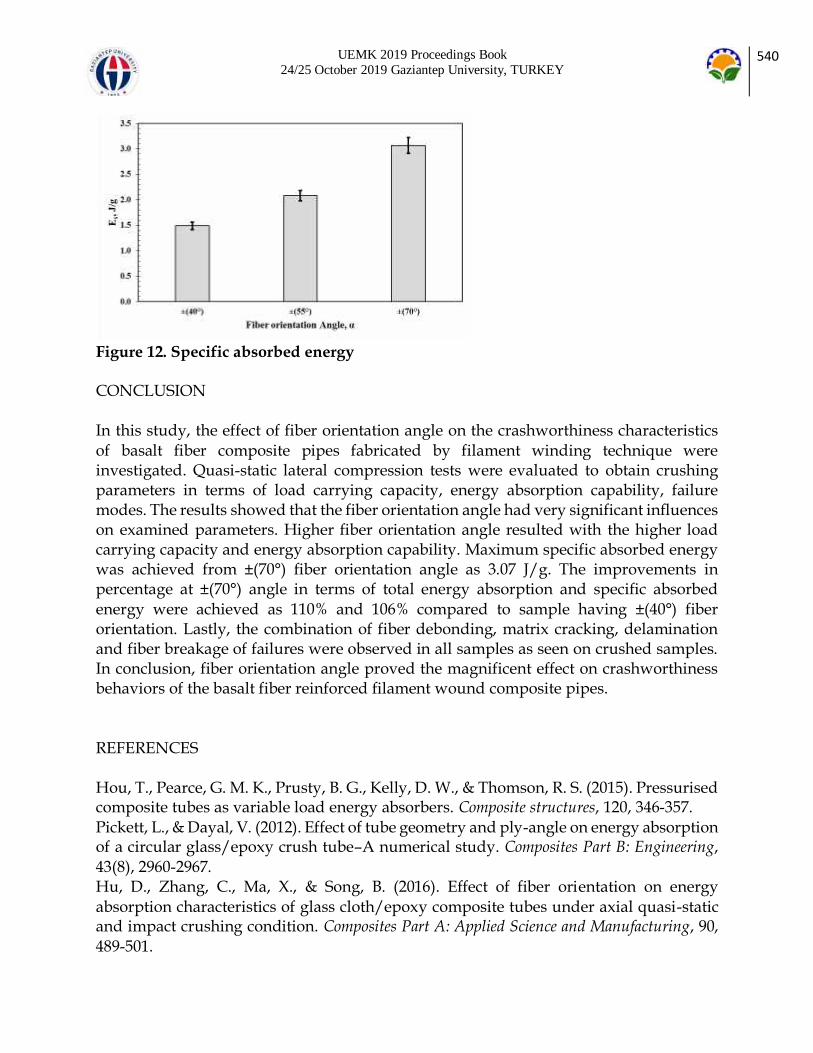
UEMK 2019 Proceedings Book
24/25 October 2019 Gaziantep University, TURKEY 540
Figure 12. Specific absorbed energy
CONCLUSION In this study, the effect of fiber orientation angle on the crashworthiness characteristics of basalt fiber composite pipes fabricated by filament winding technique were investigated. Quasi-static lateral compression tests were evaluated to obtain crushing parameters in terms of load carrying capacity, energy absorption capability, failure modes. The results showed that the fiber orientation angle had very significant influences on examined parameters. Higher fiber orientation angle resulted with the higher load carrying capacity and energy absorption capability. Maximum specific absorbed energy was achieved from ±(70°) fiber orientation angle as 3.07 J/g. The improvements in percentage at ±(70°) angle in terms of total energy absorption and specific absorbed
energy were achieved as 110% and 106% compared to sample having ±(40°) fiber orientation. Lastly, the combination of fiber debonding, matrix cracking, delamination and fiber breakage of failures were observed in all samples as seen on crushed samples. In conclusion, fiber orientation angle proved the magnificent effect on crashworthiness behaviors of the basalt fiber reinforced filament wound composite pipes. REFERENCES Hou, T., Pearce, G. M. K., Prusty, B. G., Kelly, D. W., & Thomson, R. S. (2015). Pressurised composite tubes as variable load energy absorbers. Composite structures, 120, 346-357.
Pickett, L., & Dayal, V. (2012). Effect of tube geometry and ply-angle on energy absorption of a circular glass/epoxy crush tube–A numerical study. Composites Part B: Engineering, 43(8), 2960-2967. Hu, D., Zhang, C., Ma, X., & Song, B. (2016). Effect of fiber orientation on energy absorption characteristics of glass cloth/epoxy composite tubes under axial quasi-static and impact crushing condition. Composites Part A: Applied Science and Manufacturing, 90,
489-501.

UEMK 2019 Proceedings Book
24/25 October 2019 Gaziantep University, TURKEY 541
Alkbir, M. F. M., Sapuan, S. M., Nuraini, A. A., & Ishak, M. R. (2014). Effect of geometry on crashworthiness parameters of natural kenaf fibre reinforced composite hexagonal tubes. Materials & Design, 60, 85-93. Mahdi, E., Hamouda, A. A., & Sebaey, T. A. (2014). The effect of fiber orientation on the energy absorption capability of axially crushed composite tubes. Materials & Design (1980-2015), 56, 923-928. Sebaey, T. A., & Mahdi, E. (2016). Crashworthiness of pre-impacted glass/epoxy composite tubes. International Journal of Impact Engineering, 92, 18-25.
Kim, J. S., Yoon, H. J., & Shin, K. B. (2011). A study on crushing behaviors of composite circular tubes with different reinforcing fibers. International Journal of Impact Engineering, 38(4), 198-207. Roslan, M. N., Yahya, M. Y., Ahmad, Z., Rashid, A., Hani, A., & Wang, W. X. (2018). Energy Absorption Capacity of Basalt Sandwich Composite Cylinder Subjected to Axial Compression Loadings. In Materials Science Forum (Vol. 917, pp. 7-11). Trans Tech Publications. Mahdi, E., & Sebaey, T. A. (2014). Crushing behavior of hybrid hexagonal/octagonal cellular composite system: Aramid/carbon hybrid composite. Materials & Design, 63, 6-13. Ismail, A. E., & Sahrom, M. F. (2015). Lateral crushing energy absorption of cylindrical
kenaf fiber reinforced composites. International Journal of Applied Engineering Research, 10(8), 19277-19288.

UEMK 2019 Proceedings Book
24/25 October 2019 Gaziantep University, TURKEY 542
DEVELOPMENT OF MULTIFERROIC MATERIALS FOR
SPINTRONICS APPLICATIONS
Ramazan TOPKAYA Department of Electrical Electronics Engineering, Iğdır University, Iğdır, Turkey [email protected] Adem KOÇYİĞİT Department of Electrical Electronics Engineering,
Iğdır University, Iğdır, Turkey [email protected] ABSTRACT: The multiferroic materials having both ferromagnetic and ferroelectric properties have drawn a great interest because of the potential device applications in magnetoelectronics, optoelectronics and spintronics (Baek, 2017; Basu, 2008). Some of the applications: non-volatile memory elements, sensors, spin wave generators, spintronic devices whose spins are controlled with electric field, solar cells (Wang, 2004; Wolf, 2001). It should be developed the perfect multiferroic materials and structures for these applications. Due to the fact that these materials can be controlled both electric and magnetic fields, a lot of nanoscale devices can be easily fabricated. In this study, the multiferroic BiFeO3 powders were synthesized by using sol-gel method. Structural, morphological and magnetic properties of these materials were characterized. Magnetization measurements revealed that undoped and Ni doped BiFeO3 powders have ferromagnetic behaviour. It has been realized that BiFeO3 powders annealed in air atmosphere can be useful for spintronic applications. Key words: Multiferroic, Ferromagnetic, Ferroelectric, Spintronics REFERENCES
Baek, S. H., Choi, S., Kim, T. L., & Jang, H. W. (2017). Domain engineering in BiFeO3 thin films. Current Applied Physics, 17(5), 688-703. Basu, S. R., Martin, L. W., Chu, Y. H., Gajek, M., Ramesh, R., Rai, R. C., Musfeldt, J. L. (2008). Photoconductivity in BiFeO3 thin films. Applied Physics Letters, 92(9), 091905. Wang, J., Zheng, H., Ma, Z., Prasertchoung, S., Wuttig, M., Droopad, R., Ramesh, R. (2004). Epitaxial BiFeO3 thin films on Si. Applied Physics Letters, 85(13), 2574-2576.

UEMK 2019 Proceedings Book
24/25 October 2019 Gaziantep University, TURKEY 543
Wolf, S. A., Awschalom, D. D., Buhrman, R. A., Daughton, J. M., von Molnár, S., Roukes, M. L., Treger, D. M. (2001). Spintronics: A Spin-Based Electronics Vision for the Future. Science, 294(5546), 1488-1495.

UEMK 2019 Proceedings Book
24/25 October 2019 Gaziantep University, TURKEY 544
OPTICAL TWEEZING POTENTIAL OF INTEGRATED
VORTEX BEAM EMITTER
Kenan ÇİÇEK
Iğdır Üniversitesi [email protected] Adem KOÇYİĞİT Iğdır Üniversitesi
ABSTRACT: The angular momentum of light consists of two distinct components, namely orbital angular momentum (OAM) and spin angular momentum (SAM). SAM is related to the polarization of light and OAM, however, depends on the field spatial distribution and can be associated with a light beam that has helical wavefront. OAM is another degree of freedom of light that can be utilized in so many applications ranging
from communication to biomedical. However, for the last decade optical tweezers employing OAM beams become more and more relevant in research. Many techniques have been used to generate OAM beams in laboratory since 1992 in which its existence was confirmed. Most of these techniques are large, bulky and laboratory base that are unpractical for optical manipulation applications. However, with the features of compactness and the combability of current CMOS technology, integrated vortex beam emitter seems more suitable for daily life optical tweezers. Thus, in this study, we address the possibility of using integrated vortex beam emitter as the source of an optical tweezer. We perform a set of simulation via Lumerical-FDTD tools and analyzed the output force related to the emitted power. As the result of the study, we realize that, the integrated vortex beam emitter needs improvement in terms of power output to perform a proper optical manipulation. Key words: Orbital angular momentum of light, vortex beam emitter, optical tweezers.

UEMK 2019 Proceedings Book
24/25 October 2019 Gaziantep University, TURKEY 545
TEMPERATURE STABILITY OF PVA-Borax GEL
ELECTROLYTE FOR SUPERCAPACITORS
Serkan DEMİREL Igdir University, Electric and Energy Department, 76002 Igdir, Turkey [email protected]
ABSTRACT: In this study, the capacitive performance and temperature stability properties have been investigated of PVA-Borax gel as electrolyte for supercapacitors. In the experimental studies, identical graphite rods were used as electrodes to create a capacitor. The cyclic-voltammetry (cv) measurements have been showed that permanent current plateaus and rectangular shapes at different scanning speeds. That plateaus and rectangular shapes are show the production of supercapacitor via PVA-Borax electrolyte. The capacitance has been calculated as 0.23 F/g at room temperature. Temperature stability measurements have been made between 20-80 oC and it was observed that the
capacity value decreased to about 0,15 F/g at 80 oC. According to charge-discharge cycles measurements, the PVA-Borax electrolyte also showed rechargeable electrolyte property. Key words: PVA-Borax, Electrolyte, Supercapacitor.

UEMK 2019 Proceedings Book
24/25 October 2019 Gaziantep University, TURKEY 546
BEHAVIOR OF SULFATE-REDUCING BACTERIA IN SINGLE-STAGE
ANAEROBIC DIGESTERS PRETREATED WITH OZONE
Sera TUNCAY, Environmental Engineering Department, Middle East Technical University, [email protected] Merve AKCAKAYA, Environmental Engineering Department, Middle East Technical University, [email protected] Bulent ICGEN, Environmental Engineering Department, Middle East Technical University, [email protected]
ABSTRACT: Anaerobic digestion is a solid stabilization process commonly used at both municipal and industrial wastewater and sludge treatment. Anaerobic digesters convert the microbiological cells and other solids generated during the treatment process to a stable end product and also produce methane-rich biogas as an energy source through the degradation of organic matter. Microbial population dynamics involved in anaerobic digestion are not well-studied yet due to the requirement of an extensive investigation of microorganisms, their mechanisms and their relations to each other. There are four
successive stages of anaerobic digestion as hydrolysis, acidogenesis, acetogenesis and methanogenesis which are governed by hydrolytic microorganisms, acidogens, acetogens and methanogens. Ozone pretreatment to anaerobic digestion promotes the hydrolysis stage by enhancing methane production ability of methanogens. In anaerobic digestion, sulfates and other sulfur oxides are easily reduced to sulfides especially to hydrogen sulfide (H2S) by sulfate-reducing bacteria (SRB). In the presence of sulfate at considerable levels, this sulfate reduction process dominates over methanogenesis since sulfate reducers and methanogens compete for the similar substrates. Besides, H2S as the end-product of the process, has an inhibitory effect to methanogens and other microbial communities because of its toxicity. In this study, 0.03, 0.06 and 0.09 g O3/g TSS ozone doses were applied to single-stage mesophilic anaerobic digesters in order to observe the improvement in methane production. The effects of these ozone doses on SRB and their role in methane production were examined. Community analysis for the sulfate reducers were performed with Fluorescence in situ Hybridization (FISH) method. As a result of
the study, sulfate reducers dominated for the digester pretreated with 0.03 g O3/g TSS ozone dose day by day, while sulfate reducers in the other digesters remained same and did not show a significant change during the operation. Keywords: Ozone pretreatment, single-stage mesophilic anaerobic digester, sulfate-reducing bacteria, FISH Acknowledgement: This work was supported by The Scientific and Technological
Research Council of Turkey (TUBITAK) through the project number 116Y181.

UEMK 2019 Proceedings Book
24/25 October 2019 Gaziantep University, TURKEY 547

UEMK 2019 Proceedings Book
24/25 October 2019 Gaziantep University, TURKEY 548
COMPOSITES USED AS DENTAL BIOMATERIALS IN HUMAN BODY; A REVIEW
Efe Çetin YILMAZ Kilis 7 Aralık University, Engineering Faculty, Department of Mechanical Engineering, Kilis, TURKEY, [email protected]
ABSTRACT: In recent years, composite materials have become an increasingly popular type of material in many fields such as aerospace, healthcare, defense industry. Thanks to the improvements in the matrix structure of the composite materials, it has been provided to have superior biocompatibility, mechanical and aesthetic properties. It has become a highly preferred material group in the field of dentistry, especially in the
treatment of restoration. The bio-composite materials used in the human body exhibit different mechanical and aesthetic behaviors on the living tissue depending on the chemical composition and filler structure they contain. However, because the experiments on living tissue were too long, costly and ethical problems arose, they directed the researchers to in vitro test methods to determine the mechanical and aesthetic behavior of these materials. The human body has a complex and continuous structure. Therefore, it has been quite difficult to simulate a material placed in the human mouth in the oral environment. In this area, various chewing test test methods have been developed which can model human oral environment. The aim of this study is to evaluate the development of composite materials used in the mouth and the effects of the filling material on the mechanical and aesthetic behaviors of the composite material. Key words: bio-composite, restorative material, in vitro, simulation İNSAN VÜCUDUNDA DİŞ BİYOMALZEMESİ OLARAK KULLANILAN KOMPOZİTLER; BİR İNCELEME
ÖZET: Son yıllarda kompozit malzemeler havacılık, sağlık, savunma sanayi gibi birçok alanda giderek kullanımı artan bir malzeme türü olmuştur. Kompozit malzemelerin matris yapısındaki gelişmeler ile üstün biyo-uyumluluk, mekanik ve estetik özelliklere sahip olması sağlanmıştır. Diş hekimliği alanında da özellikle restorasyon tedavisinde çokça tercih edilen bir malzeme grubu olmuştur. İnsan vücudunda kullanılan biyo-kompozit malzemeler içerdikleri kimyasal birleşimi ve doldurucu yapısına bağlı olarak canlı doku üzerinde farklı mekanik ve estetik davranışlar sergilemektedir. Ancak, canlı doku üzerindeki deneylerin çok uzun zaman alması, maliyetli olması ve etik sorunların ortaya çıkması nedeniyle araştırmacıları bu malzemelerin mekanik ve estetik
davranışlarını belirlemede laboratuvar ortamı (in vitro) test yöntemlerine yöneltmiştir.
UEMK 2019 Proceedings Book
24/25 October 2019 Gaziantep University, TURKEY 549
İnsan vücudu karmaşık ve sürekli bir yapıya sahiptir. Bu nedenle insan ağız içerisine yerleştirilen bir malzemenin ağız ortamında simüle edilmesi oldukça zor bir durum olmuştur. Bu alanda, insan ağız ortamını modelleyebilen çeşitli çiğneme test deney yöntemleri geliştirilmiştir. Bu çalışmanın amacı, ağız içerisinde kullanılan kompozit malzemelerin gelişimi ve kompozit malzemenin doldurucu yapısının mekanik ve estetik davranışları üzerindeki etkilerinin değerlendirilmesidir. Anahtar sözcükler: biyo-kompozit, restoratif malzeme, in vitro, simülasyon GİRİŞ Işıkla sertleşen diş kompozit malzemelerinin, doğal diş yapısına benzemesi, kolay işlenebilir olması ve gelişmiş mekanik kabiliyetlerinden dolayı kesici ve öğütücü dişlerin eski haline getirilmesinde yaygın olarak kullanılmaktadır (Alsharif, Akil, Abd El-Aziz, & Bin Ahmad, 2014; Angeletaki, Gkogkos, Papazoglou, & Kloukos, 2016; Rodriguez, Kriven, & Casanova, 2019). Kompozit malzemeler diş hekimliği alanında 1960 yılından bu yana sürekli bir gelişim göstererek giderek kullanımı artmıştır (Fugolin & Pfeifer, 2017). Doğrudan diş restorasyonları (direct tooth restorations) için kompozitlerin
piyasaya sürülmesinden bu yana önemli evrimi, endikasyonlarının klasik olarak yalnızca amalgamlarla restore edilmiş daha büyük posterior restorasyonlara genişlemesini sağlamıştır (Fugolin & Pfeifer, 2017). Bu alanda gelişimlerin büyük bir kısmı kompozitlerin mekanik özelliklerinin (özellikler aşınma dirençleri ) iyileşmesiyle daha geniş alanda dolgu sistemlerinin elde edilmesiyle gerçekleşmiştir (Ferracane, 2011). Kompozit malzemelerin aşınma davranışının belirlenmesi amacıyla literatürde birçok in vitro (labaratuvar) ortam deneyleri geliştirilmiştir (Injeti et al., 2019; E. Yilmaz & R. Sadeler, 2018; E. C. Yilmaz, 2019; E. C. Yilmaz & R. Sadeler, 2018a; E. Ç. Yilmaz, 2019). Kompozit malzemelerin mekanik ve kimyasal özellikleri sürekli bir gelişim gösterse de canlı doku üzerinde yeterli oranda 10 yıl kullanım ömrü olduğu rapor edilmiştir (Demarco, Correa, Cenci, Moraes, & Opdam, 2012). Kompozit malzemelerin gelişim periyoduna bakıldığında; 2000'li yılların başında, bugüne kadar sadece metakrilat kimyasına, daha özel olarak BisGMA (bisfenol A glisidil dimetakrilat), TEGDMA (trietilen glikol dimetakrilat), BisEMA (etoksile bisfenol) esaslı olan organik matrisin daha da geliştirilmesi üzerinde duruldu (Fugolin & Pfeifer, 2017). Bununla birlikte kompozit malzemelerde polimerizasyon büzülmesinin ve gerilmenin azaltılması ortak amacı ile alternatif monomerler geliştirilmeye başlanmıştır (Fugolin & Pfeifer, 2017). Bu alandaki gelişimlerin temel amacı kompozit malzemelerin matris yapısındaki gerilmeleri en aza indirgemek olmuştur. Ağız içerisine yerleştirilen bir kompozit malzemenin çiğneme hareketi sırasında karmaşık ve sürekli olarak mekanik yüklemelere maruz kaldığı görülecektir. Bu mekanik yüklemelerin kompozit
malzemenin matris yapısındaki istenmeyen gerilmelerin azaltılması ve karşı malzeme

UEMK 2019 Proceedings Book
24/25 October 2019 Gaziantep University, TURKEY 550
(insan dişi) benzer elastik davranış göstermesi üzerine odaklanmıştır. Kompozit malzemenin matris yapısında bu gelişimler ile elde edilen yeni monomerler ya halka açıcı polimerleştirilebilir kısımlara (siloran kimyasına dayanan yalnızca ticari örnek olan Filtek LS'dir) ya da molar büzülme katsayısını azaltmada başarılı olduklarını kanıtlayan daha yüksek moleküler ağırlıklı moleküller elde edilebiliyordu (Fugolin & Pfeifer, 2017). Şekil 1 bu monomer yapılarının örnek kimyasal yapılarını göstermektedir.
Şekil 1. Üst Kutucuk : Bisgma (Bisfenol A Glisidil Dimetakrilat) (Solda) Ve TEGDMA (Trietilen Glikol Dimetakrilat) (Sağda) Moleküler Yapıları. Alt: Halen Ticari Ürünlerde Kullanılan Alternatif Monomerlerin Moleküler Yapısı. (A) Oxirane (Filtek LS; 3M-ESPE), (B) TCD-Üretan (Venus Diamond; Heraeus Kulzer), (C) Dimerasit Dimetakrilat (N'Durance; Confidental-Septodont) Ve (D) Dupont DX-511 (Kalore; GC America (Fugolin & Pfeifer, 2017)
Son zamanlarda, kompozit malzemelerin matris ve arayüz yapılarında, reçine geliştirmedeki odak, metakrilatlarda bulunan ester bağlarının tükürük ve bakteri enzimleri tarafından mevcut hidrolizinin yanı sıra, tükürük ve bakteri enzimleriyle metakrilatlarda mevcut olan hidroliz de dahil olmak üzere, oral ortamdaki restorasyonun genel direncini arttırmaya yönelmiştir (Wu, Weir, Melo, & Xu, 2015). Ayrıca, bulk-fill dolgu ve kendinden yapışkanlı kompozitler gibi daha az uygulama basamağı gerektirmesi nedeniyle kullanımı daha kolay materyaller geliştirmek için çok çaba sarf edilmiştir (Fugolin & Pfeifer, 2017).

UEMK 2019 Proceedings Book
24/25 October 2019 Gaziantep University, TURKEY 551
Bulk-fill reçine kompozitleri piyasaya, hem akıcı hem de konvansiyonel / şekillendirilebilir viskozitelerde şeklinde sürülmüştür (Fugolin & Pfeifer, 2017). Bu kompozit malzemeler daha büyük ve derin restorasyonlarda tercih edilmiştir (E. C. Yilmaz & R. Sadeler, 2018b). Bu yapılarda elde edilen klinik başarılar, sistemin optimizasyonunu (yeni foto başlatıcılar veya daha fazla geleneksel foto başlatıcı konsantrasyonu), doldurma sisteminin modifikasyonlarını (daha büyük doldurucular veya daha fazla saydam doldurucular) veya farklı kimyasalların dahil edilmesini içeren farklı yollarla elde edilmiştir (Miletic, Pongprueksa, De Munck, Brooks, & Meerbeek, 2017). Akışkan bulk-fill kompozit dolgu malzemeleri genellikle, şekillendirilebilir malzemelerden daha düşük dolgu yüküne sahiptir ve okluzal katmanın oklüzal yükleme altında daha güçlü ve aşınmaya karşı daha dayanıklı olması beklenen daha yüksek oranda doldurulmuş bir kompozitin bir "kapağı" (cap) ile doldurulmasını gerektirir (Fugolin & Pfeifer, 2017). Literatürden bir örnek vermek gerekirse, SureFil (Dentsply) kompozit malzemesi üreticiye göre, bu ürün, daha düşük dolgu maddesi içeriğine ek olarak, büzülmeyi azaltmaya yardımcı olan yüksek molekül ağırlıklı (849 g / mol) yeni bir UDMA bazlı monomer içerir (Fugolin & Pfeifer, 2017). Üreticinin “polimerizasyon modülatörü” olarak adlandırdığı monomerin yeni kısmı, bir oligomerik türün omurgasına gömülü fotoaktif gruplardan oluşur (Fugolin & Pfeifer, 2017).
Kompozit malzemelerde gerilmeyi azaltan dolgu maddeleri, diş restoratif malzeme arayüzünde boşluk oluşumunu önlemedeki faydalarından dolayı araştırmaların odağı olmaya devam etmektedir. Bununla birlikte, büzülme azaltma üzerine yoğunlaşmak yerine, mevcut stratejilerin çoğu, polimer ağında gerilmeyi aynı anda azaltabilen ve mekanik özellikleri ve monomer dönüşümünü koruyan ya da arttıran bir tür modifikasyon önerir (Bacchi & Pfeifer, 2016). Bu moleküller, hafif koşullar altında bir tıklama reaksiyonu ile sentezlenir ve sekonder vinil monomer matrisi ile zincir transfer reaksiyonlarına katılmak için mevcut olan kolye tiyol fonksiyonelliklerine sahiptir (Fugolin & Pfeifer, 2017). Bu anlamda, tiyoüretanlar, klasik thiol-ene reaksiyonlarında görüldüğü gibi gecikmiş jelasyon / vitrifikasyona yol açan stres azaltma mekanizmasına dayanır (Boulden et al., 2011). Aynı zamanda, sert thio-carbamate bağlarının ağa dahil edilmesinden kaynaklanan ağ takviyesi sağlarlar (Lowe, Hoyle, & Bowman, 2010). Yüksek oranda doldurulmuş kompozitlerde kullanıldığında, tiyoüretanların polimerizasyon stresini% 50'ye kadar düşürdüğü ve kırılma tokluğunun 2 kat arttığı gösterilmiştir (Bacchi, Nelson, & Pfeifer, 2016) . Diğer nano-boyutlu ön-polimerleştirilmiş parçacıklar da önemli bir büzülme / gerilme azaltma göstermiştir ve malzeme modifikasyonu için oldukça kuyruklu bir platform temsil etmektedir (Moraes et al., 2011) Kompozit malzemenin içerdiği çok işlevli monomerler, daha sonra ağa bir çapraz bağ olarak dahil edilen bir “allyl disulfide moiety” (diğer olası örnekler arasında) içerir. Şekil 2 bu açıklamayı özetlemiştir. Sonuç olarak, Net çapraz bağlanma yoğunluğu esasen değişmeden kalırken, bu alil bağı, gerilmenin yayılmasıyla kırılabilir ve yeniden düzenlenebilir (Fugolin & Pfeifer, 2017). Nihayetinde, polimerizasyon gerilimi,

UEMK 2019 Proceedings Book
24/25 October 2019 Gaziantep University, TURKEY 552
geleneksel camsı ağlarla karşılaştırılabilir mekanik özellikler korunarak yerleştirilebilir ve sonuçta azaltılabilir (Park, Kloxin, Abuelyaman, Oxman, & Bowman, 2012).
Şekil 2. Tiyoüretan oligomerleri (thiourethane oligomers) (A) ilave parçalanma zinciri transferi (B) oluşturulan kovalent adapte edilebilir ağların kullanımıyla stresin azalmasına yol açan ağ modifikasyonları için diyagramın gösterimi (Fugolin & Pfeifer, 2017) SONUÇ
Literatürde yapılana araştırmalara göre kompozit malzemelerin üstün mekanik ve kimyasal davranışları nedeniyle biyo-malzeme olarak canlı vücudunda kullanımı önümüzdeki yıllarda giderek artacaktır. Ancak geliştirilen yeni kompozit malzemelerin canlı doku testleri öncesinde laboratuvar testlerinin yapılması büyük önem arz etmektedir. Bu nedenle, araştırmacıların insan vücudunu modelleyebilen yeni test mekanizmaları geliştirmeleri önemli olacaktır.

UEMK 2019 Proceedings Book
24/25 October 2019 Gaziantep University, TURKEY 553
KAYNAKLAR
Alsharif, S. O., Akil, H. B., Abd El-Aziz, N. A., & Bin Ahmad, Z. A. (2014). Effect of alumina particles loading on the mechanical properties of light-cured dental resin composites. Materials & Design, 54, 430-435. doi:10.1016/j.matdes.2013.07.069 Angeletaki, F., Gkogkos, A., Papazoglou, E., & Kloukos, D. (2016). Direct versus indirect inlay/onlay composite restorations in posterior teeth. A systematic review and meta-analysis. Journal of Dentistry, 53, 12-21. doi:10.1016/j.jdent.2016.07.011
Bacchi, A., Nelson, M., & Pfeifer, C. S. (2016). Characterization of methacrylate-based composites containing thio-urethane oligomers. Dental Materials, 32(2), 233-239.
doi:10.1016/j.dental.2015.11.022 Bacchi, A., & Pfeifer, C. S. (2016). Rheological and mechanical properties and interfacial stress development of composite cements modified with thio-urethane oligomers. Dental Materials, 32(8), 978-986. doi:10.1016/j.dental.2016.05.003 Boulden, J. E., Cramer, N. B., Schreck, K. M., Couch, C. L., Bracho-Troconis, C., Stansbury, J. W., & Bowman, C. N. (2011). Thiol-ene-methacrylate composites as dental restorative materials. Dental Materials, 27(3), 267-272. doi:10.1016/j.dental.2010.11.001 Demarco, F. F., Correa, M. B., Cenci, M. S., Moraes, R. R., & Opdam, N. J. M. (2012). Longevity of posterior composite restorations: Not only a matter of materials. Dental Materials, 28(1), 87-101. doi:10.1016/j.dental.2011.09.003 Ferracane, J. L. (2011). Resin composite-State of the art. Dental Materials, 27(1), 29-38. doi:10.1016/j.dental.2010.10.020 Fugolin, A. P. P., & Pfeifer, C. S. (2017). New Resins for Dental Composites. Journal of Dental Research, 96(10), 1085-1091. doi:10.1177/0022034517720658 Injeti, V. S. Y., Nune, K. C., Reyes, E., Yue, G., Li, S. J., & Misra, R. D. K. (2019). A
comparative study on the tribological behavior of Ti-6Al-4V and Ti-24Nb-4Zr-8Sn alloys in simulated body fluid. Materials Technology, 34(5), 270-284. doi:10.1080/10667857.2018.1550138 Lowe, A. B., Hoyle, C. E., & Bowman, C. N. (2010). Thiol-yne click chemistry: A powerful and versatile methodology for materials synthesis. Journal of Materials Chemistry, 20(23),
4745-4750. doi:10.1039/b917102a Miletic, V., Pongprueksa, P., De Munck, J., Brooks, N. R., & Meerbeek, B. (2017). Curing characteristics of flowable and sculptable bulk-fill composites. Clinical Oral Investigations, 21(4), 1201-1212. doi:10.1007/s00784-016-1894-0 Moraes, R. R., Garcia, J. W., Barros, M. D., Lewis, S. H., Pfeifer, C. S., Liu, J. C., & Stansbury, J. W. (2011). Control of polymerization shrinkage and stress in nanogel-modified monomer and composite materials. Dental Materials, 27(6), 509-519. doi:10.1016/j.dental.2011.01.006 Park, H. Y., Kloxin, C. J., Abuelyaman, A. S., Oxman, J. D., & Bowman, C. N. (2012). Novel dental restorative materials having low polymerization shrinkage stress via stress relaxation by addition-fragmentation chain transfer. Dental Materials, 28(11), 3-9.
doi:10.1016/j.dental.2012.06.012

UEMK 2019 Proceedings Book
24/25 October 2019 Gaziantep University, TURKEY 554
Rodriguez, H. A., Kriven, W. M., & Casanova, H. (2019). Development of mechanical properties in dental resin composite: Effect of filler size and filler aggregation state. Materials Science & Engineering C-Materials for Biological Applications, 101, 274-282. doi:10.1016/j.msec.2019.03.090 Wu, J. L., Weir, M. D., Melo, M. A. S., & Xu, H. H. K. (2015). Development of novel self-healing and antibacterial dental composite containing calcium phosphate nanoparticles. Journal of Dentistry, 43(3), 317-326. doi:10.1016/j.jdent.2015.01.009 Yilmaz, E., & Sadeler, R. (2018). Effect of artificial aging environment and time on mechanical properties of composite materials. Journal of Dental Research and Review, 5(4), 111-115. doi:10.4103/jdrr.jdrr_50_18 Yilmaz, E. C. (2019). Effects of thermal change and third-body media particle on wear behaviour of dental restorative composite materials. Materials Technology. doi:10.1080/10667857.2019.1611201 Yilmaz, E. C., & Sadeler, R. (2018a). Investigation of three-body wear of dental materials under different chewing cycles. Science and Engineering of Composite Materials, 25(4), 781-787. doi:10.1515/secm-2016-0385 Yilmaz, E. C., & Sadeler, R. (2018b). Investigation of Two- and Three-Body Wear Resistance on Flowable Bulk-Fill and Resin-Based Composites. Mechanics of Composite Materials, 54(3), 395-402. doi:10.1007/s11029-018-9750-8
Yilmaz, E. Ç. (2019). Effect of Sliding Movement Mechanism on Contact Wear Behavior of Composite Materials in Simulation of Oral Environment. Journal of Bio- and Tribo-Corrosion, 5(3), 63. doi:10.1007/s40735-019-0258-0.

UEMK 2019 Proceedings Book
24/25 October 2019 Gaziantep University, TURKEY 555
EFFECT OF TEMPERATURE CHANGE AND DWELL TIME ON SURFACE
ROUGHNESS OF COMPOSITE MATERIAL IN ARTIFICIAL SALIVA MEDIUM
Efe Çetin YILMAZ Kilis 7 Aralık University, Engineering Faculty, Department of Mechanical Engineering, Kilis, TURKEY, [email protected]
ABSTRACT: The aim of this study was to investigate the effect of different thermal cycle and dwell time tests on the surface roughness of two different composite materials in artificial saliva medium. Estelite Flow Quick and Charisma Opal composite materials were produced under the conditions recommended by the manufacturer. Composite test samples were divided into 3 groups as control, 1200 thermal and 3000 thermal cycle test procedures for 10 seconds and 30 seconds dwell time respectively. The surface roughness values of the composite materials were measured after each test procedure with using non-contact profilometer. In addition, surface roughness behavior of composite materials was analyzed at the micro and macro level. As a result of this study, with the increase in the number of thermal cycles and dwell time, an increase in surface roughness was observed in both materials. However, there was no linear relationship between the number of thermal cycles and surface roughness values. In this study scope, it is possible to say that the organic matrix structure of the composite material affects the surface roughness behavior. Keywords: composite biomaterial, surface roughness, thermal cycle, dwell time INTRODUCTION
Composite materials have been used as dental biomaterials since the mid-1960s (Cao, Zhao, Gong, & Zhao, 2013). There are many different composite materials for direct dental restorations, including classic hybrid and nano-filled composite materials, silicones and compomers. However, differences in the monomer system, filler composition and matrix filler chemistry between these materials can lead to different mechanical performances and may also take into account the differences in the resistance of the materials to chemical and mechanical degradation (Hahnel, Henrich, Burgers, Handel, & Rosentritt, 2010; Manhart, Kunzelmann, Chen, & Hickel, 2000). It has been reported that the damage to the composite materials may be caused by the deterioration of the matrix and fillers, or by mechanical and environmental loads, interfacial bones dissolution, micro-cracking or filling material. particle fracture which can reduce the
possibility of in vivo survival of composite restorations (Drummond, 2008).

UEMK 2019 Proceedings Book
24/25 October 2019 Gaziantep University, TURKEY 556
The superior mechanical and aesthetic properties of the composite materials increase the use of biomaterials. However, it has been reported that composite materials still have insufficient wear resistance in clinical studies (Hickel & Manhart, 2001). The term wear can generally be defined as loss of volume of a material. The wear mechanism in the intra-tribological process may be due to many factors such as composite material mechanic behavior, antagonist material, lubrication medium, chewing parameter. As long as the composite materials used as biomaterials remain within the body, changes in their mechanical properties are inevitable. Because the body contains a complex and continuous structure. This structure can affect the hardness and surface roughness behavior of the composite material. The change of the surface roughness behavior of the composite material will affect the wear mechanism. Surface roughness in restorative materials is an important parameter affecting wear. If the surface roughness of the composite material has a value of 0.2erem and above, it is clinically a risk (Bollen, Lambrechts, & Quirynen, 1997; Marghalani, 2010; Yilmaz & Sadeler, 2017). Finishing and polishing are carried out after filling into these materials in order to minimize surface roughness. In this way, the sensitivity of the composite restorative material to the wear mechanism will be reduced. Another parameter affecting the mechanical properties of composite resins has been found to be caused by hydrolytic disturbances. In this process, the durability of the composite material is evaluated by exposing the composite material
to thermal cycles and artificial oral fluid for a long time in vivo treatment process (Cho, Yi, & Heo, 2002; Yilmaz & Sadeler, 2017) The aim of this study was to investigate the effect of different thermal cycle and dwell time tests on the surface roughness of two different composite materials in artificial saliva medium. MATERIAL AND METHOD In this study, detailed information about the tested composite materials is summarized in Table 1. Three groups (control, 12000 thermal cycles and 3000 thermal cycles) of specimens of 2 mm X 6 mm (height X diameter) were produced from each composite material. Composite samples were hardened in laboratory conditions with the blue light polarization technique and under the conditions recommended by the manufacturer. After this process, the surface roughness of all samples was minimized by finishing and polishing technique. The chemical components of artificial saliva used in thermal cycling and dwell time tests are shown in Table 2 (Sutiman, Mareci, Nechita, Iordache, & Rosca, 2007). The pH of this solution was measured to be about 5.7 (Yilmaz & Sadeler, 2017). This ratio is within the range of artificial oral conditions (in vitro). The surface roughness of the tested samples was determined using a three-dimensional non- contact profilometer (Bruker-Contour GT 3D). The wear area of the composite samples was scanned with dimensions of 4 mm x 4 mm, with a step of 12 μm along the x-axis, 12 μm along with the y-axis and measurement speed of 1000 μm / s. The
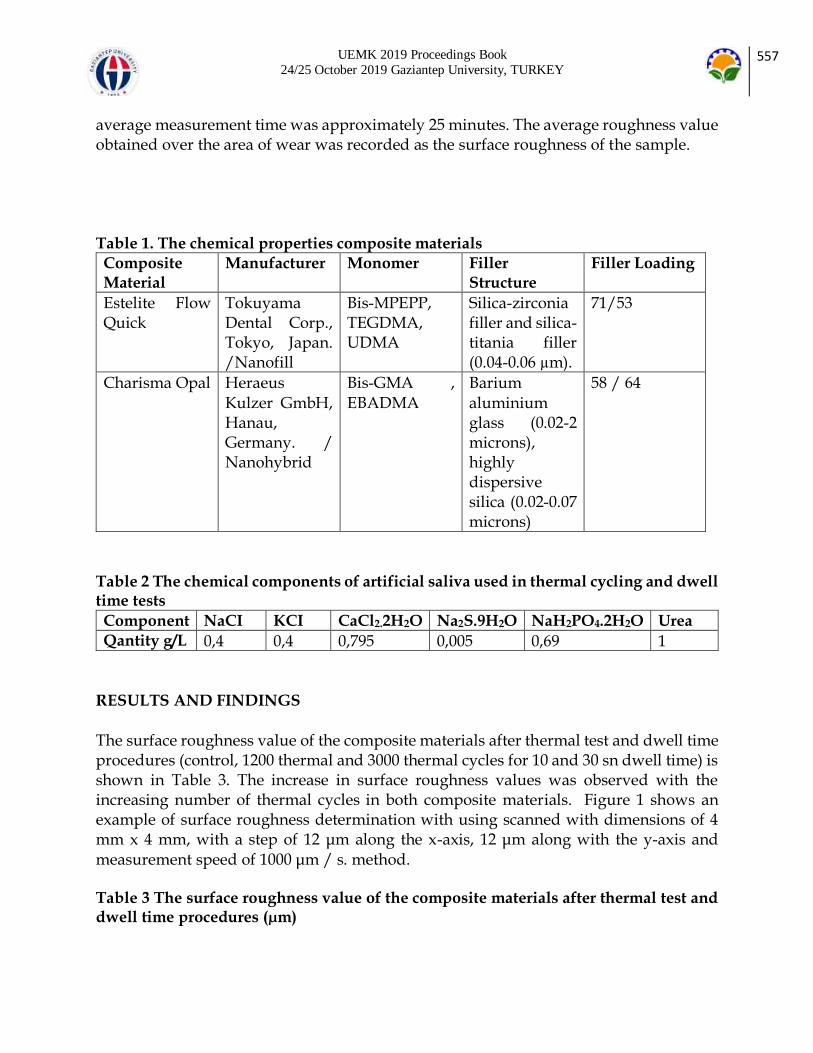
UEMK 2019 Proceedings Book
24/25 October 2019 Gaziantep University, TURKEY 557
average measurement time was approximately 25 minutes. The average roughness value obtained over the area of wear was recorded as the surface roughness of the sample. Table 1. The chemical properties composite materials
Composite Material
Manufacturer Monomer Filler Structure
Filler Loading
Estelite Flow Quick
Tokuyama Dental Corp., Tokyo, Japan. /Nanofill
Bis-MPEPP, TEGDMA, UDMA
Silica-zirconia filler and silica-titania filler (0.04-0.06 µm).
71/53
Charisma Opal Heraeus Kulzer GmbH, Hanau, Germany. / Nanohybrid
Bis-GMA , EBADMA
Barium aluminium glass (0.02-2 microns), highly dispersive silica (0.02-0.07 microns)
58 / 64
Table 2 The chemical components of artificial saliva used in thermal cycling and dwell time tests
Component NaCI KCI CaCl2.2H2O Na2S.9H2O NaH2PO4.2H2O Urea
Qantity g/L 0,4 0,4 0,795 0,005 0,69 1
RESULTS AND FINDINGS
The surface roughness value of the composite materials after thermal test and dwell time procedures (control, 1200 thermal and 3000 thermal cycles for 10 and 30 sn dwell time) is shown in Table 3. The increase in surface roughness values was observed with the increasing number of thermal cycles in both composite materials. Figure 1 shows an example of surface roughness determination with using scanned with dimensions of 4 mm x 4 mm, with a step of 12 μm along the x-axis, 12 μm along with the y-axis and measurement speed of 1000 μm / s. method. Table 3 The surface roughness value of the composite materials after thermal test and dwell time procedures (µm)

UEMK 2019 Proceedings Book
24/25 October 2019 Gaziantep University, TURKEY 558
Composite Material / Test Procedure
Estelite Flow Charisma Opal
Control Group 0.11 0.09 Dwell time procedure
1200 thermal cycles 0.15 0.12 10 seconds
0.17 0.13 30 seconds
3000 thermal cycles 0.21 0.17 10 seconds
0.26 0.18 30 seconds
Figure 1. Example of surface roughness determination of composite material

UEMK 2019 Proceedings Book
24/25 October 2019 Gaziantep University, TURKEY 559
Figure 2 Example of microstructure analysis of composite material
Figure 3 and figure 4 shows the microstructure of the Estelite Flow and Charisma Opal composite material after 3000 thermal cycles and 30 seconds dwell time test procedure. In previous studies, it has been seen that thermal cycling experiments have significantly affected the surface roughness and chemical internal structure of composite resin materials (Dos Santos et al., 2015) It has been observed that the thermal structure of the
composite materials subjected to thermal cycling experiments caused microcracks in the matrix structure due to thermal expansion and these cracks caused damage to the filling matrix interface (Ozcan et al., 2013)
Figure 3. The microstructure of the Estelite Flow composite material after 3000 thermal cycles and 30 seconds dwell time test procedure. ( left figure 5kV, 1600x mag. 50µm, right figure: 5kV, 6000x mag. 10 µm reference line)

UEMK 2019 Proceedings Book
24/25 October 2019 Gaziantep University, TURKEY 560
Figure 4. The microstructure of the Charisma Opal composite material after 3000 thermal cycles and 30 seconds dwell time test procedure ( left figure 5kV, 6000x mag. 50 µm, right figure: 5kV, 12000x mag. 4 µm reference line). CONCLUSION
The following evaluations were made with the findings obtained in this study. The increase in the number of thermal cycles and dwell time resulted in an increase in surface roughness in both composite materials. However, the Estelite Flow composite material showed better surface roughness resistance when comparing the two composite materials after thermal and dwell time test procedures. It has been observed that the composite material containing TEGDMA or TEGMA component is more sensitive to thermal cycling and dwell time test procedures. Therefore, it can be concluded that the wear properties of composite materials having this structure are affected when it is considered as a mechanism to increase wear in the intra-oral tribology. REFERENCES
Bollen, C. M. L., Lambrechts, P., & Quirynen, M. (1997). Comparison of surface roughness of oral hard materials to the threshold surface roughness for bacterial plaque retention: A review of the literature. Dental Materials, 13(4), 258-269. doi:Doi 10.1016/S0109-5641(97)80038-3 Cao, L. Q., Zhao, X. Y., Gong, X., & Zhao, S. L. (2013). An in vitro investigation of wear resistance and hardness of composite resins. International Journal of Clinical and
Experimental Medicine, 6(6), 423-430. Cho, L. R., Yi, Y. J., & Heo, S. J. (2002). Effect of tooth brushing and thermal cycling on a surface change of ceromers finished with different methods. Journal of Oral Rehabilitation, 29(9), 816-822. doi:DOI 10.1046/j.1365-2842.2002.00877.x

UEMK 2019 Proceedings Book
24/25 October 2019 Gaziantep University, TURKEY 561
Dos Santos, P. H., Catelan, A., Guedes, A. P. A., Suzuki, T. Y. U., Godas, A. G. D., Briso, A. L. F., & Bedran-Russo, A. K. (2015). Effect of thermocycling on roughness of nanofill, microfill and microhybrid composites. Acta Odontologica Scandinavica, 73(3), 176-181. doi:10.3109/00016357.2014.971868 Drummond, J. L. (2008). Degradation, fatigue, and failure of resin dental composite materials. Journal of Dental Research, 87(8), 710-719. doi:Doi 10.1177/154405910808700802 Hahnel, S., Henrich, A., Burgers, R., Handel, G., & Rosentritt, M. (2010). Investigation of Mechanical Properties of Modern Dental Composites After Artificial Aging for One Year. Operative Dentistry, 35(4), 412-419. doi:10.2341/09-337-L Hickel, R., & Manhart, J. (2001). Longevity of restorations in posterior teeth and reasons for failure. J Adhes Dent, 3(1), 45-64.
Manhart, J., Kunzelmann, K. H., Chen, H. Y., & Hickel, R. (2000). Mechanical properties of new composite restorative materials. Journal of Biomedical Materials Research, 53(4), 353-
361. doi:Doi 10.1002/1097-4636(2000)53:4<353::Aid-Jbm9>3.0.Co;2-B Marghalani, H. Y. (2010). Effect of Finishing/Polishing Systems on the Surface Roughness of Novel Posterior Composites. Journal of Esthetic and Restorative Dentistry, 22(2), 127-138. doi:10.1111/j.1708-8240.2010.00324.x Ozcan, M., Valandro, L. F., Pereira, S. M. B., Amaral, R., Bottino, M. A., & Pekkan, G. (2013). Effect of Surface Conditioning Modalities on the Repair Bond Strength of Resin Composite to the Zirconia Core / Veneering Ceramic Complex. Journal of Adhesive Dentistry, 15(3), 207-210. doi:10.3290/j.jad.a29717 Sutiman, D. M., Mareci, D., Nechita, T. M., Iordache, I., & Rosca, J. C. M. (2007). The electrochemical behaviour of some unnoble alloys in fusayama artificial saliva. Macedonian Journal of Chemistry and Chemical Engineering, 26(1), 57-63. Yilmaz, E., & Sadeler, R. (2017). Yapay Ağız Sıvısında Termal Çevrimin Kompozit Restoratif Malzemelerinin Yüzey Pürüzlülüğü Üzerindeki Etkisi. Technological Applied
Sciences, 12(2), 38-42.

UEMK 2019 Proceedings Book
24/25 October 2019 Gaziantep University, TURKEY 562
WEAR MECHANISMS OF INTRA-ORAL TRIBOLOGY; REVIEW
Efe Çetin YILMAZ Kilis 7 Aralık University, Engineering Faculty, Department of Mechanical Engineering, Kilis, TURKEY, [email protected]
ABSTRACT: The term wear can generally be defined as the loss of material that occurs after the interaction of at least two materials. Tooth wear is a complex and continuous physiological process that results from various tribological interactions within the oral cavity. In this process, biomaterials placed in the mouth can be exposed to several wear
mechanisms simultaneously. These wear mechanisms significantly affect the mechanical, aesthetic and biological behavior of biomaterials. Predicting the mechanical and biological behavior of biomaterials in the oral tribological process before the treatment process will contribute to the formation of a more satisfactory treatment process. For this reason, in vitro test mechanisms have been developed in order to simulate the oral tribological process. The aim of this study was to investigate and evaluate the wear mechanisms in the oral tribological process during chewing cycle motion. Key words: wear, biomaterial, chewing simulation AĞIZ-İÇİ TRİBOLOJİDE AŞINMA MEKANİZMALARI; BİR İNCELEME
ÖZET: Aşınma terimi genel olarak en az iki malzemenin etkileşimi sonrasında meydana gelen malzeme kaybı olarak tanımlanabilir. Diş aşınması, ağız boşluğu içindeki çeşitli tribolojik etkileşimler sonucu oluşan karmaşık ve sürekli bir fizyolojik süreçtir. Bu süreçte ağız içerisine yerleştirilen biyomalzemeler eş zamanlı olarak birçok aşınma mekanizmasına maruz kalabilirler. Bu aşınma mekanizmaları biyomalzemelerin mekanik, estetik ve biyolojik davranışlarını önemli derecede etkilemektedir. Tedavi sürecinden önce biyomalzemelerin ağız içi tribolojik süreçte mekanik ve biyolojik davranışlarını tahmin edebilmek daha tatminkâr tedavi sürecinin oluşmasına katkı sağlayacaktır. Bu sebeple ağız içi tribolojik süreci simüle edebilmek amacıyla birçok laboratuvar ortam (in vitro) test mekanizmaları geliştirilmiştir. Bu çalışmanın amacı çiğneme hareketi sırasında ağız içi tribolojik süreçte meydana gelen aşınma mekanizmalarını araştırmak ve değerlendirmektir.
Anahtar sözcükler: aşınma, biyomalzeme, çiğneme test simülasyonu

UEMK 2019 Proceedings Book
24/25 October 2019 Gaziantep University, TURKEY 563
GİRİŞ
Vücut içerisine yerleştirilen biyomalzemeler karmaşık ve sürekli bir yapı içerisinde çeşitli aşınma ve yorulma mekanizmalarına maruz kalırlar. Bu yorulma ve aşınma mekanizmaları biyomalzemelerin vücut içerisindeki fonksiyonlarını önemli derecede etkileyebilmektedir. Biyomalzemelerin aşınması karmaşık ve tahmin edilemeyen bir süreçtir. Ağız içi tribolojide genel anlamda dört temel aşınma mekanizmasının meydana geldiğinin söylemek mümkündür (Heintze, 2006; E. C. Yilmaz & Sadeler, 2018a, 2018b). Bu aşınma mekanizmaları diş ve biyomalzemenin direkt teması ile gerçekleşen two-body aşınma mekanizması, arada yemek parçacıklarının varlığı ile three-body aşınma mekanizması, korozif etki nedeniyle korozyonlu aşınma ve tekrarlı yüklemelerin neden olduğu yorulmalı aşınma mekanizması olarak adlandırılabilir. Bu aşınma mekanizmaları çiğneme hareketi boyunca sürekli ve karmaşık bir yapıda bulunabilir (E. Yilmaz et al., 2018; E. Ç. Yilmaz, 2019). Çiğneme hareketi aşınmayı belirleyen temel iki aşınma sürecini içerir. Bu aşınma süreçleri biyomalzeme ve karşı malzemenin (genellikle diş malzemesi) direkt teması ile gerçekleşir ve bu süreçte malzemeler arası geçiş olabilir veya yüzey aşınmaları meydana gelebilir. Diğer süreçte ise çiğneme hareketi işlemi sırasına biyomalzeme ve karşı (antagonist) olarak adlandırılan malzeme arasına üçüncü aşındırıcı parçacıklar (genellikle yemek parçacıkları) dahil olur. Bu işlem sürecinde bu parçacıklardan ortaya
çıkan asidik etki ve aşındırıcı özellikler nedeniyle korozif etki ve aşınma bölgeleri oluşmaya başlar. Bu süreç çiğneme hareketi sürecinde sürekli yeninden tek başına veya bir arada tekrar edebilir. Dolayısıyla ağız içerisine yerleştirilmiş bir biyomalzeme karmaşık ve sürekli bir yapı içerisinde yorulma ve aşınma mekanizmalarına maruz kalabilmektedir. Çiğneme hareketi sırasında karşı malzeme ağız içeresindeki yiyecek tabakasını hapseder ve dişler birbirinden geçerken öğütme işlemi başlar. Bu öğütme işlemi sırasında karşılıklı iki malzeme arasında aşınma ve yorulma mekanizmaları meydana gelmeye başlar. Şekil 1 de bu işlem süreci özetlenmiştir. Çiğneme döngüsü hazırlık, ezme ve kayma hareketi olarak üç bölüme ayrılabilir (DeLong, 2006). Hazırlık aşamasında, çene yemek parçacıkları ile temas edecek şekilde konumlandırılmıştır. Çene açma hareketi ile başlar ve dişler gıda parçacıkları ile temas edene kadar kapanma hareketi boyunca devam eder. Normalde, bu aşamada hiçbir oklüzal kuvvet dahil değildir (yapışkan yiyecekler bir istisnadır) (DeLong, 2006). Ezme aşaması hazırlık aşamasını takip eder ve dişlerin gıda parçacıkları ile üç gövdeli bir etkileşimini temsil eder. Bu aşamada gıda parçacıklarından ortaya çıkan korozif etki malzemelerin aşınma yüzeyini etkiler. Dişler ilk önce gıda

UEMK 2019 Proceedings Book
24/25 October 2019 Gaziantep University, TURKEY 564
parçacıkları temas ettiğinde başlar ve diş-diş teması olana kadar veya çene açılmaya başlayana kadar (hazırlık aşamasının başlangıcı) devam eder. İlk temasta, kuvvet gıda parçacıkları boyunca dağıtılır. Dişlerin yaşadığı kuvvetin büyüklüğü, yiyecek parçacıklarının sertliğine bağlıdır. Yiyecek parçacıkları sıkıştırıldıkça, çiğneme kuvveti, gıda parçacıkları yüzeyinden kesici dişler ve öğütücü dişler üzerinde dağıtılmaya başlanır (DeLong, 2006). Mühendislik açısından temas yüzeyi arttıkça, birim alandaki kuvvet azalacağı bir gerçektir. Her zaman çiğneme sırasında meydana gelmeyen kayma aşaması dişe dişle temasla başlar (eğer varsa yiyecek parçacıklarının tam penetrasyonu) ve çene açılmaya başlayana kadar (hazırlık aşamasının başlangıcı) devam eder (DeLong, 2006). Temas halinde, çiğneme kuvveti okluzal temas bölgesinde yoğunlaşmaktadır. Diş-diş teması ve besin parçacıklarının varlığı nedeniyle, hem iki hem de üç vücut aşınma mekanizması meydana gelmektedir.
Şekil 1. Çiğneme hareketi sırasında meydana gelen aşınma mekanizmalarının gösterimi (DeLong, 2006) 2. Direkt-Temas Aşınma Mekanizması (Two-Body Wear Mechanism)
Bu aşınma mekanizmasının in vitro test düzeneği genel olarak canlı doku / yapay tükürük veya su gibi sıvı kayganlaştırıcılar olmadan yapılır. Birleşme yüzeyleri temas yükü madde kaybı altında kaydığından reçine matrisinin zıt yüzeyinin sert özellikleri ve yorulma aşınması nedeniyle aşınması nedeniyle oluşabilir (Iwasaki et al., 2014; Kruzic, Arsecularatne, Tanaka, Hoffman, & Cesar, 2018) Farklı doldurucu tipine sahip kompozit malzemelerin mikro yapıları şekil 2 de gösterilmiştir (Koottathape, Takahashi, Iwasaki, Kanehira, & Finger, 2012). Bir kompozit içine daha yüksek bir dolgu maddesi doldurulması, reçine matrisinin aşınmasını azaltabilir (Heintze, 2007). Bu süreçte daha yüksek bir kırılma tokluğu, yorulmayı azaltabilen mikroyapıda çatlak ilerlemesini

UEMK 2019 Proceedings Book
24/25 October 2019 Gaziantep University, TURKEY 565
geciktirebilir (Kruzic et al., 2018). Genel olarak, bir diş kompozitinin iki gövdeli aşınması, dolgu maddesi oranı ve kırılma tokluğu ile doğrudan ilişkilidir (Heintze, 2007). İki cisim aşınmasına ilişkin önemli eğilimler aşağıdaki gibi özetlenmiştir. Matrise yeterli dolgu maddesi yapışması aşınma direnci için esastır; aslında, arayüz bağlanma destekli çatlak başlatma / çoğaltma işleminin yol açtığı yorulma aşınması mekanizması nedeniyle zayıf ara yüz bağlaması olan kompozitler daha yüksek oranda aşınmaktadır (Kruzic et al., 2018; Shinkai, Taira, Suzuki, & Suzuki, 2016). Buna karşılık, yeterli arayüz bağ kuvveti ile, yeraltı çatlak ilerlemesi yavaştır ve sığ ve yorulma aşınma mekanizmaları yüksek aşınma kaybına neden olmaz (Kruzic et al., 2018).
Şekil 2. Farklı tip kompozit malzemelerin 10.000 direkt-temas (two-body) çiğneme testi sonrasındaki mikro yapılarının gösterimi (Koottathape et al., 2012) 3. Aşındırıcı Ortam Mekanizması (Three-Body Wear Mechanism)
Laboratuvar ortamında three-body aşınma mekanizmasını simüle etmek amacıyla kompozit numune ve karşı malzeme arasında gıda parçacıklarını simüle eden üçüncü bir vücut ortamı ile yük altında kayan temas halindedir (Lambrechts, Debels, Van Landuyt, Peumans, & Van Meerbeek, 2006). Genel olarak üçüncü vücut ortamı olarak aşağıda belirtilen sulu süspansiyonlar
kullanılmaktadır. *öğütülmüş pirinç / darı / haşhaş tohumu; *polimetil metakrilat (PMMA) veya cam boncuklar; *alümina parçacıkları (Benetti, Larsen, Dowling, & Fleming, 2016)

UEMK 2019 Proceedings Book
24/25 October 2019 Gaziantep University, TURKEY 566
Literatürdeki çalışmalardan elde edilen sonuçlar kapsamında aşağıdaki değerlendirmeler yapılmıştır. Daha büyük dolgu maddesi yüklü kompozitler, daha yumuşak matrisin aşınması nedeniyle daha az üç gövde aşınması gösterir (Kruzic et al., 2018; Lambrechts et al., 2006). Bunun nedeni dolgu maddesi partikülleri arasındaki büyük boşlukların matrisi aşınmaya (dolgu maddesinin dökülmesine ve dolayısıyla daha fazla aşınmaya maruz bırakmasıdır (Shinkai et al., 2016). Nispeten daha büyük dolgu maddelerine sahip (örneğin, mikro dolgu veya hibrit malzemeler) olan kompozelerle karşılaştırıldığında, nano dolgu maddelerine sahip olanlar (örneğin, nano dolgu maddesi) üstün üç-gövde aşınma direnci gösterir (Kruzic et al., 2018) Yukarıdaki eğilimler, iki vücut aşınmasına göre üç vücut aşınmasını anlamak için biraz daha basit bir resim çiziyor gibi gözükse de, yine de belirli mekanizmalar ve test koşullarıyla ilgili komplikasyonlar vardır. Örneğin, aşınma hızları mutlaka sabit değildir ve aşınma döngüleri ile artabilir veya bunun tersine ilk aşamada daha büyük aşınma olabilir ve bunu takiben sabit aşınma oranına sahip bir faz (De Souza, Goutianos, Skovgaard, & Sorensen, 2011; Kruzic et al., 2018). İkinci durumda, ilk aşamadaki yüksek
aşınma (~ 100.000 devire kadar) mekanik olarak, daha sonra sabit bir durum durumuna ulaşan numune hazırlama sırasında kullanılan taşlama / cilalama işlemleri nedeniyle başlangıçtaki yüzey hasarına bağlanır. KAYNAKÇA
Benetti, A. R., Larsen, L., Dowling, A. H., & Fleming, G. J. P. (2016). Assessment of wear facets produced by the ACTA wear machine. Journal of Dentistry, 45, 19-25. doi:10.1016/j.jdent.2015.12.003 De Souza, J. A., Goutianos, S., Skovgaard, M., & Sorensen, B. F. (2011). Fracture resistance curves and toughening mechanisms in polymer based dental composites. Journal of the Mechanical Behavior of Biomedical Materials, 4(4), 558-571. doi:10.1016/j.jmbbm.2011.01.003
DeLong, R. (2006). Intra-oral restorative materials wear: Rethinking the current approaches: How to measure wear. Dental Materials, 22(8), 702-711. doi:10.1016/j.dental.2006.02.003 Heintze, S. D. (2006). How to qualify and validate wear simulation devices and methods. Dental Materials, 22(8), 712-734. doi:10.1016/j.dental.2006.02.002 Heintze, S. D. (2007). Systematic reviews: I. The correlation between laboratory tests on marginal quality and bond strength. II. The correlation between marginal quality and clinical outcome. Journal of Adhesive Dentistry, 9, 77-106.
UEMK 2019 Proceedings Book
24/25 October 2019 Gaziantep University, TURKEY 567
Iwasaki, N., Takahashi, H., Koottathape, N., Kanehira, M., Finger, W. J., & Sasaki, K. (2014). Texture of composite resins exposed to two- and three-body wear in vitro. J Contemp Dent Pract, 15(2), 232-241. Koottathape, N., Takahashi, H., Iwasaki, N., Kanehira, M., & Finger, W. J. (2012). Two- and three-body wear of composite resins. Dental Materials, 28(12), 1261-1270. doi:10.1016/j.dental.2012.09.008 Kruzic, J. J., Arsecularatne, J. A., Tanaka, C. B., Hoffman, M. J., & Cesar, P. F. (2018). Recent advances in understanding the fatigue and wear behavior of dental composites and ceramics. Journal of the Mechanical Behavior of Biomedical Materials, 88, 504-533. doi:10.1016/j.jmbbm.2018.08.008 Lambrechts, P., Debels, E., Van Landuyt, K., Peumans, M., & Van Meerbeek, B. (2006). How to simulate wear? Overview of existing methods. Dental Materials, 22(8), 693-701. doi:10.1016/j.dental.2006.02.004 Shinkai, K., Taira, Y., Suzuki, S., & Suzuki, M. (2016). In vitro wear of flowable resin composite for posterior restorations. Dental Materials Journal, 35(1), 37-44. doi:10.4012/dmj.2015-080 Yilmaz, E., Sadeler, R., Duymu, #351, , Z., #214, . . . an, A. (2018). Effect of ambient pH and different chewing cycle of contact wear on dental composite material. Dentistry and Medical Research, 6(2), 46-50. doi:10.4103/dmr.dmr_26_18
Yilmaz, E. C., & Sadeler, R. (2018a). Investigation of three-body wear of dental materials under different chewing cycles. Science and Engineering of Composite Materials, 25(4), 781-787. doi:10.1515/secm-2016-0385 Yilmaz, E. C., & Sadeler, R. (2018b). Investigation of Two- and Three-Body Wear Resistance on Flowable Bulk-Fill and Resin-Based Composites. Mechanics of Composite Materials, 54(3), 395-402. doi:10.1007/s11029-018-9750-8
Yilmaz, E. Ç. (2019). Effect of Sliding Movement Mechanism on Contact Wear Behavior of Composite Materials in Simulation of Oral Environment. Journal of Bio- and Tribo-Corrosion, 5(3), 63. doi:10.1007/s40735-019-0258-0.

UEMK 2019 Proceedings Book
24/25 October 2019 Gaziantep University, TURKEY 568
INVESTIGATION OF THE EFFECT OF ARTIFICIAL AGING ENVIRONMENT
TEMPERATURE ON MECHANICAL BEHAVIOR OF BIO-COMPOSITE MATERIAL
WITH NANO FILLER
Efe Çetin YILMAZ Kilis 7 Aralık University, Engineering Faculty, Department of Mechanical Engineering, Kilis, TURKEY, [email protected] Recep SADELER Atatürk University, Engineering Faculty, Department of Mechanical Engineering, Erzurum, TURKEY, [email protected]
ABSTRACT: The aim of this study was to investigate the effect of artificial aging ambient temperature on the mechanical behavior of nano filler Supreme bio composite material used as restoration material in oral tribological environment as biomaterial. In this study, 2 mm wide X 13 mm diameter cylindrical test specimens were prepared in nano-filled Supreme composite material. Test specimens are artificial saliva (0.4 NaCl + 0.4 KCl + 0.795 CaCl2.2H2O + 0.005 Na2S.9H2O + 0.69 NaH2PO4.2H2O + 1 Urea (grams / liter) at 5 , 37 and 55 ambient temperatures After the artificial aging test procedure, surface roughness values of the test specimens were determined by 2D profilometer After the test procedures, it was obtained that the Supreme bio-composite material with nano filler showed higher surface roughness behavior with increasing temperature. It was concluded that temperature increase has an effect on increasing the hydraulic degradation mechanism of bio-composite material in artificial aging environment. Key words: Bio-composite, Artificial aging, Surface roughness YAPAY YAŞLANDIRMA ORTAM SICAKLIĞININ NANO DOLDURUCULU BIO-KOMPOZİT MALZEMESİNİN MEKANİK DAVRANIŞI ÜZERİNDEKİ ETKİSİNİN İNCELENMESİ
ÖZET: Bu çalışmanın amacı, yapay yaşlandırma ortam sıcaklığının biyomalzeme olarak ağız içi tribolojik ortamda restorasyon malzemesi olarak kullanılan nano dolduruculu Supreme biyo-kompozit malzemesinin mekanik davranışı üzerindeki etkisinin incelenmesidir. Bu çalışma kapsamında nano-dolduruculu Supreme kompozit malzemesinde 2 mm genişliğinde X 13 mm çapında silindirik biçimde test numuneleri hazırlanmıştır. Test numuneleri yapay tükürük (0,4 NaCI + 0,4 KCI + 0,795 CaCl2.2H2O

UEMK 2019 Proceedings Book
24/25 October 2019 Gaziantep University, TURKEY 569
+ 0,005 Na2S.9H2O + 0,69 NaH2PO4.2H2O + 1 Urea (gram/litre) ortamında 5 , 37 ve 55 ortam sıcaklıklarında 7 gün süresince yapay yaşlandırma işlemine maruz bırakılmıştır. Yapay yaşlandırma test prosedürü sonrasında test numunelerini yüzey pürüzlülük değerleri 2D profilometre ile belirlenmiştir. Test prosedürleri sonrasında nano dolduruculu Supreme bio-kompozit malzemesinin sıcaklık artışı ile daha yüksek yüzey pürüzlülüğü davranışı gösterdiği elde edilmiştir. Bu çalışma sonrasında elde edilen veriler ile sıcaklık artışının yapay yaşlandırma ortamında biyo-kompozit malzemesinin hidrolik bozunma mekanizmasını artırıcı bir etki oluşturduğu sonucuna varılmıştır.
Anahtar sözcükler: Bio-kompozit, Yapay yaşlandırma, Yüzey pürüzlülüğü
GİRİŞ Son yıllarda mavi ışık teknolojisi ile polorisazyon olabilme kabiliyetine sahip farklı doldurucu yapılarında kompozit malzemelerin kullanımı giderek artmaktadır (Kurachi, Tuboy, Magalhaes, & Bagnato, 2001). Diş kompozit malzemeleri, genellikle reçine matrisi, inorganik dolgu maddeleri ve bir silan birleştirme maddesi olan heterojen malzemelerdir (Yilmaz et al., 2018). Kompozit malzeme reçine matrisine dahil edilen dolgu maddesi parçacıklarının miktarı ve büyüklüğü, her bir kompozit tipini ve sonuçta en avantajlı klinik uygulamasını belirleyebilir. Canlı doku üzerinde kompozit malzemelerde meydana gelene hasarın, matris ve dolgu maddelerinin bozulmasından kaynaklanabileceği veya kompozit restorasyonların in vivo hayatta kalma olasılığını azaltabilecek mekanik ve çevresel yükler, ara yüzey bağlanma, mikro çatlama veya dolgu partikülü kırılmasından kaynaklanabileceği bildirilmiştir (Hahnel, Henrich, Burgers, Handel, & Rosentritt, 2010a). Literatürde bazı kaynaklarda kompozit sınıflandırmaları, kompozit malzemenin viskozitesini ve kararlılığını tanımlayan özelliklere odaklanırken (örneğin, flowable or packable), diğer kaynaklarda diş kompozitlerinin mekanik özelliklerini göz önünde bulundurarak, mikro yapı sınıflandırmalarını dikkate alınmaktadır (Kruzic, Arsecularatne, Tanaka, Hoffman, & Cesar, 2018) Mikro doldurulmuş kompozitler. Silika parçacıkları içerir (0.01 ila 0.04 µm) ve küçük parçacık büyüklüğü nedeniyle yüksek derecede cilalanabilir. Düşük mukavemetlerinden dolayı ön veya servikal restorasyonlarda kullanılırlar (Kruzic et al., 2018). Hibrit kompozitler. Bu kompozitlere dolgu maddesi yüklemesi ağırlıkça% 75'tir ve iki tür parçacık içerir: buzlu cam (1.0 ila 10 um) ve kolloidal silika. Kolloidal silika, toplam

UEMK 2019 Proceedings Book
24/25 October 2019 Gaziantep University, TURKEY 570
dolgu yükünün% 20'si kadardır. Bu kompozitler, piyasada daha yeni mikro- / nano-hibrit ve nano-doldurulmuş kompozitler ile değiştirilmektedir(Kruzic et al., 2018). Mikro / nano hibrit kompozitler. Bunlar evrensel (ön ve arka) malzemelerdir. Posterior restorasyonlar için gerekli güç ve aşınma direncine ve ayrıca anterior restorasyonlar için gerekli cilalanabilirlik ve estetiğe sahiptirler. Bu malzemeler, mikro ölçekli ve nano ölçekli (~ 20 nm) parçacıkların bir kombinasyonudur. Tipik bir dolgu maddesi doldurma yüklemesi, ağırlıkça% 78, mikro-hibrit dolgu için 1 ila 3.5 um ve nano hibrid için 0.4 ila 1 um aralığındadır(Kruzic et al., 2018). Nano doldurulmuş kompozitler. Bunlar ayrıca, tek tek ya da reçine matrisinde topak halinde dağılmış nano dolgulu üniversal restoratörlerdir. Nano doldurucular, 5 ila 20 nm arasındadır ve kümeler, 0.6 ila 1.4 um arasında değişmektedir. Son kompozitlerin bazıları,% 92'ye kadar çok yüksek dolgu yüküne sahiptir(Kruzic et al., 2018).
Şekil 1. Çeşitli reçine bazlı dental kompozitler sınıfları arasındaki mikroyapısal farklılıkları gösteren şematik yapı (a) Mikro doldurma; (b) Hibrit; (c) Mikro / nano hibrid; (d) Nano doldurulmuş; (e) Kısa elyaf takviyeli (Kruzic et al., 2018). MATERYAL VE YÖNTEM Supreme biyo-kompozit malzemesinin mekanik davranışı üzerindeki etkisinin incelenmesidir. Bu çalışma kapsamında nano-dolduruculu Supreme kompozit
malzemesinde 2 mm genişliğinde X 13 mm çapında silindirik biçimde test numuneleri hazırlanmıştır. Yapay yaşlandırma testleri için tablo 2 de belirtilen yapay tükürük kimyasal bileşenleri kullanılmıştır. (Sutiman, Mareci, Nechita, Iordache, & Rosca, 2007). Bu çözeltinin pH oranı yaklaşık 5,7 olarak ölçülmüştür. Bu oran yapay ağız ortam (in vitro) çalışma şartları aralığındadır. Bu çalışmada test edilen nano dolduruculu Supreme kompozit malzemesinin mekanik ve kimyasal özelliklleri Tablo 2 de gösterilmiştir. Tablo 1. Yapay yaşlandırma ortamının kimyasal bileşenlerinin gösterimi
Bileşen NaCI KCI CaCl2.2H2O Na2S.9H2O NaH2PO4.2H2O Urea

UEMK 2019 Proceedings Book
24/25 October 2019 Gaziantep University, TURKEY 571
Tablo 2. Nano dolduruculu Supreme kompozit malzemesinin mekanik ve kimyasal özelliklerinin gösterimi
Materials Manufacturer
Composition
Monomer Filler /Filler average size Filler
Weight%/Vol%
Filtek Supreme XT/ FIL
3M ESPE,St. Paul, MN,USA Nanofilled
Bis-GMA, UDMA, BisEMA, TEGDMA
Nanosilica Zirconia/silica Nanoclusters (nanoparticle size) (5-20nm)
78 / 60
SONUÇ VE TARTIŞMA Bu çalışmada test edilen nano dolduruculu Supreme kompozit malzemesinin yapay yaşlandırma testlerinden sonra yüzey pürüzlülük değerleri 5 de 0.11(0.03) µm, 37 için 0.13 (0.02) µm ve 55 de 0.16 (0.05) µm olarak elde edilmiştir. Şekil 2 nano dolduruculu Supreme kompozit malzemesinin yapay yaşlandırma testlerinden sonra yüzey pürüzlülük değerinin 2D profilometre örneğini göstermektedir. Şekil 3 yapay yaşlandırma ortam sıcaklığının 55 olduğu testlerden sonra nano dolduruculu Supreme kompozit malzemesinin yüzeyinden alınan mikro yapı analizini göstermektedir.
Şekil 2. Nano dolduruculu Supreme kompozit malzemesinin yapay yaşlandırma testlerinden sonra yüzey pürüzlülük değerinin 2D profilometre örneğini gösterimi
Miktar g/L
0,4 0,4 0,795 0,005 0,69 1

UEMK 2019 Proceedings Book
24/25 October 2019 Gaziantep University, TURKEY 572
Şekil 3. 3 yapay yaşlandırma ortam sıcaklığının 55 olduğu testlerden sonra nano dolduruculu Supreme kompozit malzemesinin yüzeyinden alınan mikro yapı analizinin gösterimi Kompozit malzemelerin farklı monomer yapısına, farklı doldurucu oranlarına ve iç yapıdaki farklı kimyasal bağlara sahip olmaları bu malzemelerin birbirinden farklı mekanik özelliklere sahip olmalarını sağlamıştır. Ayrıca bu yapılardaki farklılıklar bu malzemelerin farklı mekanik bozunma mekanizmalarına duyarlılık gösterdiği gözlemlenmiştir. Daha önceki çalışmalarda kompozit malzemenin matriks yapında meydana gelen bozulmalardan dolayı in vivo tedavi sürecinde kompozit malzemenin yapı bütünlüğünde önemli derecede hasar aldığı rapor edilmiştir.(Hahnel, Henrich, Burgers, Handel, & Rosentritt, 2010b) Kompozit malzemenin rezin matriks yapısının kimyasal bağ çiftlerinde ve doldurucu parçacıkların karakteristikleri rezin kompozitin yüzey pürüzlüğünü doğrudan etkileyen parametrelerdir.(Marghalani, 2010a) Restoratif malzemelerde yüzey pürüzlüğü aşınmayı etkileyen önemli bir parametredir.
Eğer kompozit malzemenin yüzey pürüzlülüğü 0,2µm ve üzerinde bir değere sahipse klinik olarak bir risk oluşturmaktadır.(Bollen, Lambrechts, & Quirynen, 1997) Yüzey pürüzlülüğünün en aza indirgemek için bu malzemelere doldurma işlemi sonrasında bitirme ve cilalama işlemi uygulanmaktadır.(Marghalani, 2010b) Böylelikle bu işlem ile kompozit restoratif mazlemenin aşınma mekanizmasına karşı duyarlılığı azaltılmış olacaktır. Kompozit rezinlerin mekanik özelliklerini etkileyen bir diğer parameter hidrolitik bozulmalardan kaynaklı olduğu görülmüştür. Bu durumun in vivo tedavi sürecinde kompozit malzemenin uzun sürelerde termal çevrimlere ve ortamdaki yapay ağız sıvısına maruz bırakılarak kompozit malzemenin dayanıklılığı test edilerek yorumlanmaktadır.(Dos Santos et al., 2015)Bu durumlara ek olarak termal çevrim ortamında diş fırça mekanizmaları da kullanılarak kompozit rezinlerin dayanıklıları test edilerek yorumlanamaya çalışılmıştır (Cho, Yi, & Heo, 2002). DEĞERLENDİRME

UEMK 2019 Proceedings Book
24/25 October 2019 Gaziantep University, TURKEY 573
Bu çalışma sonucunda elde edilen in vitro deney verileri kapsamında, Supreme bio-kompozit malzemesinin sıcaklık artışı ile daha yüksek yüzey pürüzlülüğü davranışı gösterdiği elde edilmiştir. Ayrıca, sıcaklık artışının yapay yaşlandırma ortamında biyo-kompozit malzemesinin hidrolik bozunma mekanizmasını artırıcı bir etki oluşturduğu sonucuna varılmıştır. KAYNAKÇA
Bollen, C. M. L., Lambrechts, P., & Quirynen, M. (1997). Comparison of surface roughness of oral hard materials to the threshold surface roughness for bacterial plaque retention: A review of the literature. Dental Materials, 13(4), 258-269. doi:Doi 10.1016/S0109-5641(97)80038-3 Cho, L. R., Yi, Y. J., & Heo, S. J. (2002). Effect of tooth brushing and thermal cycling on a surface change of ceromers finished with different methods. Journal of Oral Rehabilitation, 29(9), 816-822. doi:DOI 10.1046/j.1365-2842.2002.00877.x Dos Santos, P. H., Catelan, A., Guedes, A. P. A., Suzuki, T. Y. U., Godas, A. G. D., Briso, A. L. F., & Bedran-Russo, A. K. (2015). Effect of thermocycling on roughness of nanofill, microfill and microhybrid composites. Acta Odontologica Scandinavica, 73(3), 176-181.
doi:10.3109/00016357.2014.971868 Hahnel, S., Henrich, A., Burgers, R., Handel, G., & Rosentritt, M. (2010a). Investigation of mechanical properties of modern dental composites after artificial aging for one year. Oper Dent, 35(4), 412-419. doi:10.2341/09-337-L Hahnel, S., Henrich, A., Burgers, R., Handel, G., & Rosentritt, M. (2010b). Investigation of Mechanical Properties of Modern Dental Composites After Artificial Aging for One Year. Operative Dentistry, 35(4), 412-419. doi:10.2341/09-337-L Kruzic, J. J., Arsecularatne, J. A., Tanaka, C. B., Hoffman, M. J., & Cesar, P. F. (2018). Recent advances in understanding the fatigue and wear behavior of dental composites and ceramics. J Mech Behav Biomed Mater, 88, 504-533. doi:10.1016/j.jmbbm.2018.08.008 Kurachi, C., Tuboy, A. M., Magalhaes, D. V., & Bagnato, V. S. (2001). Hardness evaluation of a dental composite polymerized with experimental LED-based devices. Dental Materials, 17(4), 309-315. doi:Doi 10.1016/S0109-5641(00)00088-9
Marghalani, H. Y. (2010a). Effect of filler particles on surface roughness of experimental composite series. Journal of Applied Oral Science, 18(1), 59-67. doi:Doi 10.1590/S1678-77572010000100011 Marghalani, H. Y. (2010b). Effect of Finishing/Polishing Systems on the Surface Roughness of Novel Posterior Composites. Journal of Esthetic and Restorative Dentistry, 22(2), 127-138. doi:10.1111/j.1708-8240.2010.00324.x Sutiman, D. M., Mareci, D., Nechita, T. M., Iordache, I., & Rosca, J. C. M. (2007). The electrochemical behaviour of some unnoble alloys in fusayama artificial saliva. Macedonian Journal of Chemistry and Chemical Engineering, 26(1), 57-63.

UEMK 2019 Proceedings Book
24/25 October 2019 Gaziantep University, TURKEY 574
Yilmaz, E., Sadeler, R., Duymu, #351, , Z., #214, . . . an, A. (2018). Effect of ambient pH and different chewing cycle of contact wear on dental composite material. Dentistry and Medical Research, 6(2), 46-50. doi:10.4103/dmr.dmr_26_18.

UEMK 2019 Proceedings Book
24/25 October 2019 Gaziantep University, TURKEY 575
SOLAR ENERGY TECHNOLOGY IN RENEWABLE ENERGY
Fatma AVLİ FIRIŞ AKEDAŞ Elektrik Dağıtım A.Ş. [email protected] Sabri Murat KISAKÜREK AKEDAŞ Elektrik Dağıtım A.Ş. murat.kisakurek@ akedasdagitim.com.tr
ABSTRACT: The concept of energy and the supply, security, accessibility and sustainability of energy resources have been one of the most important issues in the world. Due to traditional fossil fuels used to meet the increasing energy demand by gaining momentum all over the world and the economic and political problems associated with being dependent on the source countries constitute the perception that the existing energy resources should be changed. Energy sources developed as an alternative to these traditional fuels are called renewable energy sources; hydraulic, wind, solar, geothermal, biomass-waste and wave. Also, the studies related to the use of renewable energy sources are accelerating in our country and important developments are experienced in this field. Our country has a very high potential in terms of solar energy which is among the renewable energy sources. In this study, the current potential of solar energy in our country and photovoltaic solar energy technologies that convert solar energy into electrical energy are discussed. One of the results obtained in the study; In order to evaluate the solar energy potential of our country, investments in this area should be accelerated and another result is the increase in the installed power in the field of photovoltaic solar energy, the generation of electricity and the capture of grid parity of the photovoltaic electricity, and the formation of the market in the domestic photovoltaic module. In addition, it is predicted that photovoltaic module costs will be decreased and their efficiency will be increased in the light of R & D studies and technological developments. Key words: Renewable energy, solar energy, photovoltaic technology.
YENİLENEBİLİR ENERJİDE GÜNEŞ ENERJİSİ TEKNOLOJİSİ
ÖZET: Enerji kavramı ve enerji kaynaklarının temini, güvenliği, erişilebilirliği ve sürdürülebilirliği konuları, geçmişten günümüze kadar dünyada en önemli meselelerden

UEMK 2019 Proceedings Book
24/25 October 2019 Gaziantep University, TURKEY 576
biri olmuştur. Dünya üzerinde ivme kazanarak artan enerji ihtiyacının karşılanmasında kullanılan geleneksel fosil kökenli yakıtların sınırlı oluşları ve kaynak ülkelere bağımlı olmanın beraberinde getirdiği ekonomik ve siyasi sorunlar, mevcuttaki enerji kaynaklarında değişiklik yoluna gidilmesi gerektiği algısını oluşturmaktadır. Bu geleneksel yakıtlara alternatif olarak geliştirilen enerji kaynakları, yenilenebilir enerji kaynakları olarak isimlendirilen; hidrolik, rüzgâr, güneş, jeotermal, biokütle-atık ve dalga olarak sıralanabilen kaynaklardır. Bunlara paralel olarak ülkemizde de yenilenebilir enerji kaynaklarının kullanımı ile ilgili çalışmalar hızlanarak devam etmekte ve bu alanda önemli gelişmeler yaşanmaktadır. Ülkemiz, yenilenebilir enerji kaynakları içerisinde yer alan güneş enerjisi açısından oldukça yüksek bir potansiyele sahiptir. Bu çalışmada güneş enerjisinin ülkemizdeki mevcut potansiyeli ve güneş enerjisini elektrik enerjisine dönüştüren fotovoltaik güneş enerjisi teknolojileri ele alınmıştır. Çalışmada elde edilen sonuçlardan biri; ülkemizin güneş enerjisi potansiyelinin değerlendirilmesi adına bu alandaki yatırımların hızlandırılması gerektiği olup bir diğer sonuç ise fotovoltaik güneş enerjisi alanında kurulu güç artışı, elektrik üretimi ve fotovoltaik elektriğinin şebeke paritesini yakalamasıyla bu alanda pazar oluşacağı, pazar oluşumunun yerli fotovoltaik modül üretiminin başlamasını sağlayacağıdır. Ayrıca Ar-Ge çalışmalarının ve teknolojik gelişmelerin ışığında fotovoltaik modül maliyetlerinin azalıp verimliliklerinde artış sağlanacağı
öngörülmüştür. Anahtar sözcükler: Yenilenebilir enerji, güneş enerjisi, fotovoltaik teknolojisi.

UEMK 2019 Proceedings Book
24/25 October 2019 Gaziantep University, TURKEY 577
FREQUENCY DEPENDENT CHARACTERIZATION OF THE AL/CRN/N-SI
DEVICE
Murat YILDIRM Selcuk University, Faculty of Science, Department of Biotechnology, 42130 Konya, Turkey, [email protected]
Adem KOCYIGIT Igdir University, Engineering Faculty, Department of Electrical Electronic Engineering, 76000 Igdir, Turkey, [email protected] ABSTRACT: The Al/n-Si metal semiconductor heterojunction with coronene (CRN) interfacial layer was fabricated by physical vapor deposition (PVD) technique and characterized by C-V measurements depending on various frequency measurements from 10 kHz to 1 MHz at room temperature. Furthermore, the photocapacitance measurements were performed on the device under various illumination intensities from 20 mW to 100 mW by 20 mW steps. While the capacitance values decreased with increasing frequency, the conductance values increased. Thus, the C-V and G-V characteristics of the Al/CRN/n-Si device showed that the capacitance and conductance values are strong function of the frequency and voltage. In addition, various electrical parameters of the Al/CRN/n-Si device were extracted from C-2–V plots and discussed in
the details. The device exhibited excellent photocapacitance behavior under light illumination. The Al/CRN/n-Si device can be employed photocapacitance applications.
Keywords: Coronene film, Al/CRN/n-Si device, C-V characteristics, photocapacitance INTRODUCTION
Coronene is an organic semiconductor material with six benzene rings (Barış, Karadeniz, & Erdal, 2017). It has light emitting capabilities and suitable transport mechanism for organic electronics applications (Petrushenko & Petrushenko, 2019; Zhang, Zheng, & Shen, 1999). Therefore, the coronene can be used as interfacial interlayer between the metal and semiconductor to obtain optoelectronic devices such as photodiodes and light emitting diodes. Metal semiconductor contacts have been investigated due to their importance in the semiconductor technology (Bilgili, Güzel, & Özer, 2019; A. Kocyigit, Orak, Çaldıran, & Turut, 2017; Adem Kocyigit, Yılmaz, Aydoğan, & İncekara, 2019). Sometimes interfacial

UEMK 2019 Proceedings Book
24/25 October 2019 Gaziantep University, TURKEY 578
layers such as insulator, semiconductor polymer or metal oxide are inserted between the metal and semiconductor to the electrical properties of the contacts (Gökçen, Altuntaş, Altındal, & Özçelik, 2012; Yildiz, Altindal, & Kanbur, 2008). Among this interfacial layers, organic semiconductors are very popular depending on their adjustable conductivity and environmentally friendly structure (Chandrakala, Ramaraj, Shivakumaraiah, Madhu, & Siddaramaiah, 2012; Jiang et al., 2017). The coronene also can be used as interfacial control layer between the metal and semiconductor. Pakma et al. (Pakma, Çavdar, Koralay, Tuğluoğlu, & Faruk Yüksel, 2017) used coronene as interfacial layer for Al metal and n-
Si semiconductor device. The coronene layer was obtained by spin coating technique. The device was characterized by I-V measurements under dark and various illumination conditions at room temperature and C-V measurements for 1 MHz frequency. They
concluded that the coronene can used for optoelectronic and solar cell applications. Xiao et al. (Xiao et al., 2011) were fabricated coronene nanowires by reprecipitation method
and characterized them by various instruments. They prepared thin film of the coronene nanowires on rGO/SiO2/Si electrode and obtained a strong photoresponse. Furthermore, the quartz/ITO/p-coronene/n-SiC/Ti (10 nm)/Au device was obtained, and it exhibited strong electroluminescence emission better than inorganic layers through of the coronene nanowires.
In this study, coronene interfacial organic layer were deposited by physical vapor deposition on the n-Si substrate to obtain metal semiconductor Al/CRN/n-Si device. The Al/CRN/n-Si device was characterized by C-V measurements for various frequencies from the 10 kHz to 1 MHz at room temperature. Furthermore, photocapacitance behavior of the Al/CRN/n-Si device was investigated under various illumination intensities. METHODS To fabrication of the Al/CRN/n-Si device was firstly started with cutting and cleaning of the Si wafer (n-type) semiconductor and substrate. The wafer has (100) direction and 7.3 x 1015 cm-3 carrier concentration according to producer. The wafer obtained as 1.5 cm x 1.0 cm piece and then cleaned with acetone, water and propanol according to RCA cleaning procedures. For removing native oxide layer and impurities on the surface of the Si wafer, the pieces were submerged into HF:H2O (1:1) solution for just 30 seconds. Aluminum was sputtered back surface of the piece as ohmic contact, and they were annealed in N2 atmosphere for 5 minutes at 500 °C. For preparing coronene layer on Si substrate the PVD technique were employed. Then another Al layer was sputtered on the coronene layer and, the Al/CRN/n-Si device was obtained. The schematic illustration of the fabricated device has been given in Fig. 1.
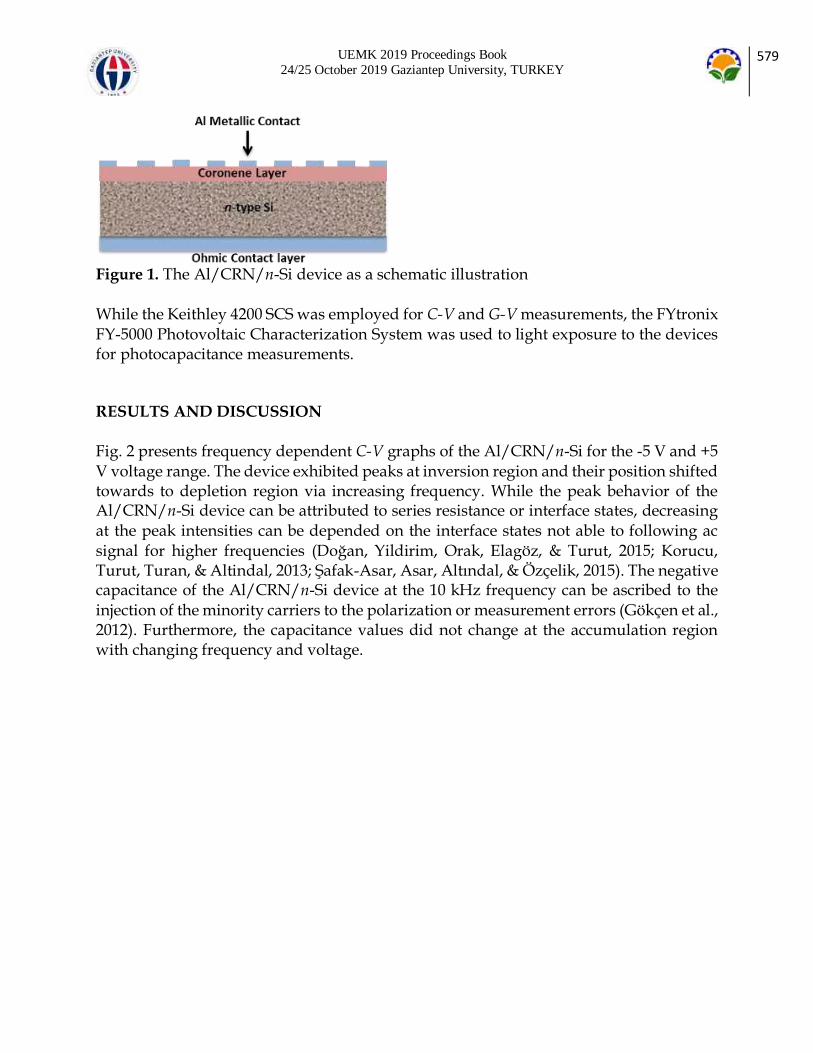
UEMK 2019 Proceedings Book
24/25 October 2019 Gaziantep University, TURKEY 579
Figure 1. The Al/CRN/n-Si device as a schematic illustration While the Keithley 4200 SCS was employed for C-V and G-V measurements, the FYtronix FY-5000 Photovoltaic Characterization System was used to light exposure to the devices for photocapacitance measurements. RESULTS AND DISCUSSION
Fig. 2 presents frequency dependent C-V graphs of the Al/CRN/n-Si for the -5 V and +5 V voltage range. The device exhibited peaks at inversion region and their position shifted towards to depletion region via increasing frequency. While the peak behavior of the Al/CRN/n-Si device can be attributed to series resistance or interface states, decreasing at the peak intensities can be depended on the interface states not able to following ac signal for higher frequencies (Doğan, Yildirim, Orak, Elagöz, & Turut, 2015; Korucu, Turut, Turan, & Altindal, 2013; Şafak-Asar, Asar, Altındal, & Özçelik, 2015). The negative capacitance of the Al/CRN/n-Si device at the 10 kHz frequency can be ascribed to the
injection of the minority carriers to the polarization or measurement errors (Gökçen et al., 2012). Furthermore, the capacitance values did not change at the accumulation region with changing frequency and voltage.

UEMK 2019 Proceedings Book
24/25 October 2019 Gaziantep University, TURKEY 580
Figure 2. The C–V plots of the Al/CRN/n-Si device as a function of frequency The G-V graphs of Al/CRN/n-Si device have been displayed in Fig. 3 for changing frequency in the range of 10 kHz and 1 MHz. The conductance values increased with increasing frequency at inversion region and suddenly decreased at depletion region. There is no change at accumulation region for the Al/CRN/n-Si device with changing frequency and voltage. The increase at the conductance values via increasing frequency at the same voltage values can be attributed to existence interface states (Al Orainy & Hendi, 2014). On the other hand, the device exhibited linearly decreasing profile for the 10 kHz, 50 kHz and 100 kHz frequencies from -5 V to -1 V or from inversion to depletion region. However, the conductance values of the device stayed constant and decreased suddenly towards to depletion region for higher frequencies than 100 kHz.
-4 -2 0 2 4
0.0
0.3
0.6
0.9
1.2
1.5 10 kHz
50 kHz
100 kHz
200 kHz
300 kHz
400 kHz
500 kHz
600 kHz
700 kHz
800 kHz
900 kHz
1 MHz
Cap
acit
an
ce (
nF
)
Voltage (V)
-4 -2 0 2 4
0.0
0.5
1.0
1.5
2.0
2.5
3.0
3.5
Co
nd
uc
tan
ce (
mF
/s)
Voltage (V)
10 kHz
50 kHz
100 kHz
200 kHz
300 kHz
400 kHz
500 kHz
600 kHz
700 kHz
800 kHz
900 kHz
1 MHz

UEMK 2019 Proceedings Book
24/25 October 2019 Gaziantep University, TURKEY 581
Figure 3. The G–V plots of the Al/CRN/n-Si device as a function of frequency 𝑅𝑖–V graphs of the Al/CRN/n-Si device have been indicated in Fig. 4 for various frequencies from 10 kHz to 1 MHz. The 𝑅𝑖 values are higher for 10 kHz and effective at inversion, depletion and accumulation regions, but they decreased with increasing frequency. Furthermore, 𝑅𝑖 values showed peaks (inset of Fig. 4) at around depletion regions due to interface states effects (Baraz, Yücedağ, Azizian-Kalandaragh, & Altındal, n.d.). The resistances values decreased with increasing frequency because charges cannot follow ac signal towards to high frequencies (Orak, Kocyigit, & Alindal, 2017).
Figure 4. The Ri–V plots of the Al/CRN/n-Si device as a function of frequency
Fig. 5 indicates the C-2-V graphs of the Al/CRN/n-Si device for various frequencies. The C-2-V plots illustrated almost straight lines for wide range voltages from 5 V to 1 V. The deviations from the linearity can be attributed to interfacial layer effect (R. H., 2014). The x- intercept and slope of the C-2-V plots are used to calculate doping concentration of the donor atoms (Nd), Fermi energy level (EF), width of the depletion region (Wd), maximum electric field (Em) and barrier heights (𝑏). (Sze, 1981). These parameters provide to understand the Al/CRN/n-Si device properties and listed in Table 1 for various
frequencies. The barrier heights are calculated by the next equation from the C-2–V plots:
𝑏(𝐶 − 𝑉) = (𝑉𝑑 + 𝐸𝐹) − (1)
where Vd and show diffusion potential (Vd = Vi + kT/q) which is determined by the sum of the x-intercept of the C-2–V plot and kT/q, and image force barrier lowering, respectively. The values are neglected for intermediated interfacial layers.
-4 -2 0 2 40
5
10
15
20
25
30
-4 -2 0 2 40
1
2
3
Ri (k
)
Voltage (V)
10 kHz
50 kHz
100 kHz
200 kHz
300 kHz
400 kHz
600 kHz
500 kHz
700 kHz
800 kHz
900 kHz
1 MHz
Ri
(k
)
Voltage (V)

UEMK 2019 Proceedings Book
24/25 October 2019 Gaziantep University, TURKEY 582
Figure 5. The C-2–V plots of the Al/CRN/n-Si device as a function of frequency The EF is calculated by the following equation:
𝐸𝐹 =𝐾𝑇
𝑞𝐿𝑛 (
𝑁𝑣𝑁𝑑) (2)
where 𝑁𝑣 is given by:
𝑁𝑣 = 4.82 x 10¹⁵𝑇3 2⁄ (𝑚𝑒∗
𝑚0)3 2⁄
(3)
where m0 and me are mass and efficient mass of the electron, respectively. The 𝑏 and 𝑁𝑑 values were discussed in below for changing frequency via Figs. The EF values stayed almost same and increased up to 500 kHz frequency and then decreased with increasing frequency. The Em and Wd values generally increased by increasing
frequency according to Table 1.
Table 1. Some electrical parameters of the Al/CRN/n-Si device for various frequencies f (kHz)
𝑵𝒅 (1015 cm-3)
Rs (Ω)
𝜱𝒃 (eV) EF
(eV)
Em
(104 V/cm)
Wd
(10-4 cm) 𝑵𝒔𝒔 (1010 eV-1 cm-2)
10 1.051 364.58 0.684 0.196 1.23 0.79 7.61
50 1.088 357.63 0.812 0.195 1.41 0.87 6.01
100 1.108 348.92 0.884 0.195 1.51 0.91 6.34
200 1.111 326.03 0.959 0.195 1.59 0.96 7.02
300 1.112 307.33 1.087 0.195 1.73 1.04 7.19
400 1.045 288.13 1.000 0.196 1.58 1.01 8.23
500 9.893 283.12 0.918 0.198 1.46 0.99 9.44
600 1.420 276.77 1.442 0.189 2.32 1.09 11.58
700 1.349 270.16 1.358 0.190 2.18 1.07 12.60
0 1 2 3 4 50
2
4
6
8
10
10 kHz 50 kHz
100 kHz 200 kHz
300 kHz 400 kHz
500 kHz 600 kHz
700 kHz 800 kHz
900 kHz
1 MHz
1/C
2(F
-2)
Voltage (V)

UEMK 2019 Proceedings Book
24/25 October 2019 Gaziantep University, TURKEY 583
800 1.313 265.39 1.332 0.191 2.13 1.08 13.32
900 1.297 262.12 1.319 0.191 2.10 1.08 14.04
1000 1.296 264.89 1.363 0.191 2.14 1.10 13.67
Series resistance (Rs) and interface states (𝑁𝑠𝑠) are other important parameters to understand the electrical properties of the metal semiconductor devices. Series resistance (Rs) is obtained by Nicollian and Brews method and given via below formula at strong
accumulation region (Nicollian & Brews, 2003):
𝑅𝑠 =𝐺𝑚𝑎
𝐺𝑚𝑎2 + (𝜔𝐶𝑚𝑎)2 (4)
To explain the interaction between the frequency and 𝑁𝑠𝑠, Hill-Coleman method is used. The 𝑁𝑠𝑠 is addressed by below equation depending on measured capacitance (Cm) and conductance (Gm) (Hill & Coleman, 1980):
𝑁𝑠𝑠 =2
𝑞𝐴
(𝐺𝑚 𝜔⁄ )𝑚𝑎𝑥((𝐺𝑚 𝜔⁄ )max /𝐶0𝑥)2 + (1 − 𝐶𝑚 𝐶0𝑥⁄ )2
(5)
where and A are angular frequency and contact area, respectively. The 𝐶0𝑥 represent
the interface capacitance and given for strong accumulation region by below equation:
𝐶0𝑥 = 𝐶𝑚𝑎 [1 + 𝐺𝑚𝑎2
(𝜔𝐶𝑚𝑎)2] (6)
The 𝑁𝑠𝑠 and 𝑅𝑠 values were calculated and tabulated at Table 1 for various frequencies. While the Fig. 6a shows frequency dependent profile of the 𝑏 and 𝑁𝑑 values, Fig. 6b exhibits changing of the 𝑁𝑠𝑠 and 𝑅𝑠 values with changing frequency. The 𝑏 and 𝑁𝑑 values have almost same profile for changing frequency, but the 𝑁𝑠𝑠 and 𝑅𝑠 values have almost reverse profile. While the effect of 𝑁𝑠𝑠 is more important at lower frequencies, 𝑅𝑠 values are more effective at higher frequencies (Bilkan, Altındal, & Azizian-Kalandaragh, 2017). The 𝑅𝑠 values also decreased with increasing frequency due to reordering of the interface states under applied bias voltages (Zeyrek, Acaroğlu, Altındal, Birdoğan, & Bülbül, 2013).
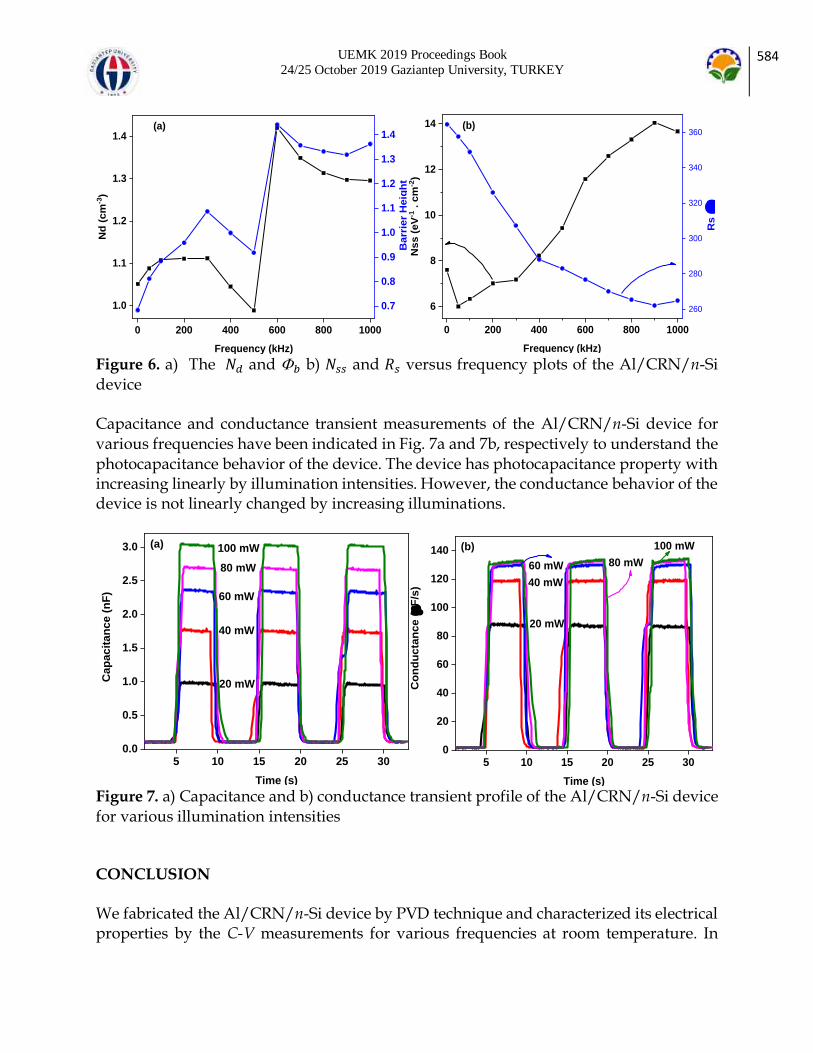
UEMK 2019 Proceedings Book
24/25 October 2019 Gaziantep University, TURKEY 584
Figure 6. a) The 𝑁𝑑 and 𝑏 b) 𝑁𝑠𝑠 and 𝑅𝑠 versus frequency plots of the Al/CRN/n-Si
device Capacitance and conductance transient measurements of the Al/CRN/n-Si device for various frequencies have been indicated in Fig. 7a and 7b, respectively to understand the photocapacitance behavior of the device. The device has photocapacitance property with increasing linearly by illumination intensities. However, the conductance behavior of the device is not linearly changed by increasing illuminations.
Figure 7. a) Capacitance and b) conductance transient profile of the Al/CRN/n-Si device for various illumination intensities CONCLUSION
We fabricated the Al/CRN/n-Si device by PVD technique and characterized its electrical properties by the C-V measurements for various frequencies at room temperature. In
0 200 400 600 800 1000
1.0
1.1
1.2
1.3
1.4
Nd
Barrier Height
Frequency (kHz)
Nd
(cm
-3)
(a)
0.7
0.8
0.9
1.0
1.1
1.2
1.3
1.4
Barr
ier
Heig
ht
0 200 400 600 800 1000
6
8
10
12
14 (b)
Frequency (kHz)
Nss (
eV
-1 . c
m-2
)
260
280
300
320
340
360
Rs (
)
5 10 15 20 25 300.0
0.5
1.0
1.5
2.0
2.5
3.0
Ca
pac
ita
nc
e (
nF
)
Time (s)
100 mW
80 mW
60 mW
40 mW
20 mW
(a)
5 10 15 20 25 300
20
40
60
80
100
120
140 (b)
Co
nd
ucta
nce (
F/s
)
Time (s)
100 mW
80 mW60 mW
40 mW
20 mW
UEMK 2019 Proceedings Book
24/25 October 2019 Gaziantep University, TURKEY 585
addition, we studied photocapacitance behaviors of the Al/CRN/n-Si device by capacitance transient measurements for various illumination intensities. The device exhibit capacitance and conductance properties at inversion region depending on the series resistance and interface states. While the capacitance values decreased with increasing frequency, the conductance values increased. The resistance values of the device are effective at lower frequency. The C-2-V plots provide to calculate various electrical parameters such as doping concentration of the donor atoms (Nd), Fermi energy level (EF), width of the depletion region (Wd), maximum electric field (Em) and barrier
heights (𝑏) and discussed in details depending on the frequency changes. The electrical parameters as well as capacitance, conductance and resistance values affected from the frequency changes. Furthermore, the device has linearly photocapacitance behavior and can be employed for capacitor and optoelectronic applications. REFERENCES
Al Orainy, R. H., & Hendi, A. A. (2014). Fabrication and electrical characterization of CdO/p-Si photosensors. Microelectronic Engineering, 127, 14–20. https://doi.org/10.1016/j.mee.2014.02.014 Baraz, N., Yücedağ, İ., Azizian-Kalandaragh, Y., & Altındal, Ş. (n.d.). Determining electrical and dielectric parameters of dependence as function of frequencies in Al/ZnS-PVA/p-Si (MPS) structures. Journal of Materials Science: Materials in Electronics, 28(2). https://doi.org/10.1007/s10854-016-5662-3 Barış, B., Karadeniz, S., & Erdal, M. O. (2017). Preparation of coronene nanowires and its properties. Materials Letters, 205, 70–74. https://doi.org/10.1016/j.matlet.2017.05.137
Bilgili, A. K., Güzel, T., & Özer, M. (2019). Current-voltage characteristics of Ag/TiO2/n-InP/Au Schottky barrier diodes. Journal of Applied Physics, 125(3), 035704. https://doi.org/10.1063/1.5064637 Bilkan, Ç., Altındal, Ş., & Azizian-Kalandaragh, Y. (2017). Investigation of frequency and voltage dependence surface states and series resistance profiles using admittance measurements in Al/p-Si with Co3O4-PVA interlayer structures. Physica B: Condensed
Matter, 515, 28–33. https://doi.org/10.1016/J.PHYSB.2017.04.002 Chandrakala, H. N., Ramaraj, B., Shivakumaraiah, Madhu, G. M., & Siddaramaiah. (2012). The influence of zinc oxide-cerium oxide nanoparticles on the structural characteristics and electrical properties of polyvinyl alcohol films. Journal of Materials Science, 47(23), 8076–8084. https://doi.org/10.1007/s10853-012-6701-y
Doğan, H., Yildirim, N., Orak, I., Elagöz, S., & Turut, A. (2015). Capacitance-conductance-frequency characteristics of Au/Ni/n-GaN/undoped GaN Structures. Physica B: Condensed Matter, 457, 48–53. https://doi.org/10.1016/j.physb.2014.09.033
Gökçen, M., Altuntaş, H., Altındal, Ş., & Özçelik, S. (2012). Frequency and voltage dependence of negative capacitance in Au/SiO2/n-GaAs structures. Materials Science in Semiconductor Processing, 15(1), 41–46. https://doi.org/10.1016/j.mssp.2011.08.001

UEMK 2019 Proceedings Book
24/25 October 2019 Gaziantep University, TURKEY 586
Hill, W. A., & Coleman, C. C. (1980). A single-frequency approximation for interface-state density determination. Solid-State Electronics, 23(9), 987–993.
https://doi.org/10.1016/0038-1101(80)90064-7 Jiang, X., Wang, Z., Han, W., Liu, Q., Lu, S., Wen, Y., … Cao, G. (2017). High performance silicon–organic hybrid solar cells via improving conductivity of PEDOT:PSS with reduced graphene oxide. Applied Surface Science, 407, 398–404. https://doi.org/10.1016/j.apsusc.2017.02.193 Kocyigit, A., Orak, I., Çaldıran, Z., & Turut, A. (2017). Current–voltage characteristics of Au/ZnO/n-Si device in a wide range temperature. Journal of Materials Science: Materials in Electronics. https://doi.org/10.1007/s10854-017-7646-3 Kocyigit, Adem, Yılmaz, M., Aydoğan, Ş., & İncekara, Ü. (2019). The effect of measurements and layer coating homogeneity of AB on the Al/AB/p-Si devices. Journal of Alloys and Compounds, 790, 388–396. https://doi.org/10.1016/J.JALLCOM.2019.03.179
Korucu, D., Turut, A., Turan, R., & Altindal, Ş. (2013). Origin of forward bias capacitance peak and intersection behavior of C and G/w of Ag/p-InP Schottky barrier diodes. Materials Science in Semiconductor Processing, 16(2), 344–351. https://doi.org/10.1016/j.mssp.2012.09.015 Nicollian, E. H., & Brews, J. R. (2003). MOS (metal oxide semiconductor) physics and technology. Wiley-Interscience.
Orak, I., Kocyigit, A., & Alindal, S. (2017). Electrical and dielectric characterization of Au/ZnO/n-Si device depending frequency and voltage. Chinese Physics B, 26(2), 028102-028102–028107. https://doi.org/10.1088/1674-1056/26/2/028102 Pakma, O., Çavdar, Ş., Koralay, H., Tuğluoğlu, N., & Faruk Yüksel, Ö. (2017). Improvement of diode parameters in Al/n-Si Schottky diodes with Coronene interlayer using variation of the illumination intensity. Physica B: Condensed Matter, 527, 1–6.
https://doi.org/10.1016/J.PHYSB.2017.09.101 Petrushenko, I. K., & Petrushenko, K. B. (2019). Optical properties of bilayer quantum dot models based on coronene and its BN analogues with a BODIPY dye: Theoretical TD-CAM-B3LYP-D3 investigation. Spectrochimica Acta - Part A: Molecular and Biomolecular Spectroscopy, 206, 498–505. https://doi.org/10.1016/j.saa.2018.08.033
R. H., A. O. (2014). Electrical characterization of a Schottky diode based on organic semiconductor film. Journal of Optoelectronics and Advanced Materials, 16(7–8), 793–797. Retrieved from http://apps.webofknowledge.com/full_record.do?product=WOS&search_mode=GeneralSearch&qid=1&SID=E5YCEgA2NPDBaCXk2pV&page=1&doc=2 Şafak-Asar, Y., Asar, T., Altındal, Ş., & Özçelik, S. (2015). Investigation of dielectric relaxation and ac electrical conductivity using impedance spectroscopy method in (AuZn)/TiO2/p-GaAs(110) schottky barrier diodes. Journal of Alloys and Compounds, 628, 442–449. https://doi.org/10.1016/j.jallcom.2014.12.170 Sze, S. M. (1981). Physics of Semiconductor Devices (2. edition). Newyork: Wiley. Xiao, J., Yang, H., Yin, Z., Guo, J., Boey, F., Zhang, H., & Zhang, Q. (2011). Preparation, characterization, and photoswitching/light-emitting behaviors of coronene nanowires. J.

UEMK 2019 Proceedings Book
24/25 October 2019 Gaziantep University, TURKEY 587
Mater. Chem., 21(5), 1423–1427. https://doi.org/10.1039/C0JM02350G Yildiz, D. E., Altindal, Ş., & Kanbur, H. (2008). Gaussian distribution of inhomogeneous barrier height in Al/ SiO2/p-Si Schottky diodes. Journal of Applied Physics, 103(12), 124502. https://doi.org/10.1063/1.2936963 Zeyrek, S., Acaroğlu, E., Altındal, Ş., Birdoğan, S., & Bülbül, M. M. (2013). The effect of series resistance and interface states on the frequency dependent C–V and G/w–V characteristics of Al/perylene/p-Si MPS type Schottky barrier diodes. Current Applied Physics, 13(7), 1225–1230. https://doi.org/10.1016/j.cap.2013.03.014
Zhang, R., Zheng, H., & Shen, J. (1999). Blue light-emitting diodes based on coronene-doped polymers. Synthetic Metals, 105(1), 49–53. https://doi.org/10.1016/S0379-6779(99)00056-9.

UEMK 2019 Proceedings Book
24/25 October 2019 Gaziantep University, TURKEY 588
TEMPERATURE DEPENDENT DIELECTRIC CHARACTERISTICS OF THE
AL/CU:TIO2/N-SI DEVICE
Adem KOCYIGIT Igdir University, Engineering Faculty, Department of Electrical Electronic Engineering, 76000 Igdir, Turkey [email protected] Murat YILDIRM Selcuk University, Faculty of Science, Department of Biotechnology, 42130 Konya, Turkey [email protected] ABSTRACT: In this study, Cu doped (10%) TiO2 thin film was deposited on the n-Si by spin coating technique to use the film as interfacial layer for metal semiconductor heterojunction. Thus, Al/Cu:TiO2/n-Si device was fabricated and its dielectric properties
was investigated by impedance spectroscopy technique for wide range temperature from 80 K to 400 K by 40 K intervals and ±5 voltages. Temperature dependent dielectric constant ( ′), dielectric loss ( ′′), loss tangent (tan δ), the real and imaginary parts of electric modulus (𝑀′and 𝑀′′) and ac electrical conductivity (𝜎) were extracted from the C-V measurements and discussed in the details for a wide range temperatures. The
results highlighted that all dielectric parameters was not so changed from the measurement temperatures, and the device can be employed for a wide range temperatures. Keywords: Dielectric properties, Al/Cu:TiO2/n-Si heterojunction, Cu doped TiO2 thin
film INTRODUCTION
Schottky devices or heterojunctions are obtained with contacting of the metal and semiconductor (Bilgili, Güzel, & Özer, 2019; Dahlan et al., 2015; Zeyrek, Acaroğlu, Altındal, Birdoğan, & Bülbül, 2013). The rectifiers, diodes and inverters are some of the technological applications of the Schottky devices (Cifci, Bakir, Meyer, & Kocyigit, 2018; Koo et al., 2017). To control the electrical properties or current transport mechanism of these devices an oxide or insulator layers are deposited between the semiconductor and metal (Kumar, Mondal, Kumar, & Koteswara Rao, 2015; Tataroğlu, Yücedağ, & Altindal,
2008). This insulator or oxide interfacial layer provide to increase of the dielectric

UEMK 2019 Proceedings Book
24/25 October 2019 Gaziantep University, TURKEY 589
properties of these devices (Ahmet Kaya, Altındal, Asar, & Sönmez, 2013). For that reason, the Schottky devices can be investigated by the dielectric characterization to understand the polarization and conduction mechanism of the Schottky devices according to ionic, electronic, surface and dipolar polarization (Orak, Kocyigit, & Alindal, 2017). The surface and dipolar polarization are shown up lower frequencies below 1 MHz (Ahmet Kaya et al., 2013). As an oxide layer, TiO2 has high electrochemical activity, wide band gap and low cost can used as interfacial layer Schottky devices due to its good properties (Rawat et al., 2016). The temperature dependent electrical characterization of the Schottky devices is really important to determine the device stability for various temperatures (Kocyigit, Orak, & Turut, 2018). The device properties should be investigated depending on temperature for that reason. We deposited Cu doped TiO2 thin film as interfacial layer for Schottky device and fabricated Al/Cu:TiO2/n-Si device. The impedance spectroscopy was operated to obtain dielectric properties of the Al/Cu:TiO2/n-Si device for wide range temperature and voltages. The dielectric constant, dielectric loss, loss tangent, real and imaginary parts of the electric modulus and ac electric conductivity was determined and discussed in the details as a function of the temperature and voltage. METHODS
Titanium (IV) isopropoxide was used as host material for Cu doped TiO2 thin film. It was solved in mixed of 1 mL acetylacetone and 35 mL alcohol solvents as precursor solution. The copper (II) nitrate was employed as Cu source and dissolved in 10 mL alcohol in a different vessel to achieve 10% Cu doping. The solutions were stirred 30 minutes and
mixed in a vessel and stirred again 30 minutes. For stabilization, 2 mL glacial acetic acid (CH3CO2H, Sigma-Aldrich), 2 mL deionized water and 20 mL alcohol was dropped in the mixed solution and stirred 5 hours. Meanwhile, the n-type Si wafer was cut and cleaned in acetone and propanol by ultrasonic cleaner and immersed in HF:H2O (1:1) solution to remove oxide layer and impurities for 30 seconds. Al layer was vaporized the
back surface of the wafer pieces and annealed in N2 atmosphere for 5 minutes at 450 C. The obtained solution was deposited on front surface of the Si wafer pieces by spin coater at 3000 rpm as three layers. An Al layer were evaporated on Cu doped TiO2 thin film surface as 100 nm thicknesses by thermal evaporator as rectifying contact via hole array mask. The impedance spectroscopy technique was employed by a computer Keithley 4200 SCS instrument in a temperature controlled cryostat from 80 K to 400 K by 40 K intervals at 500 kHz frequency. RESULTS AND DISCUSSION To understand the polarization and conduction mechanism of the Al/Cu:TiO2/n-Si device, we extracted the real dielectric constant ( ′), imaginary dielectric constant ( ′′)
UEMK 2019 Proceedings Book
24/25 October 2019 Gaziantep University, TURKEY 590
and ac electric conductivity (𝜎) from the C-V measurements for wide range temperature from 80 K to 400 K and voltage range of ±5 voltages. While the imaginary dielectric constant reveals absorbed energy because of the frictional dampening, the real dielectric constant exhibits strength of the dipole against to applied electric field and stored energy (Karataş, 2008). The real and imaginary dielectric constants are obtained as parts of complex dielectric constant or complex permittivity. The Equation (1) shows complex permittivity formula depending on the real and imaginary dielectric constants (Shiwakoti, Bobby, Antony, & Asokan, 2016):
∗= ′ − 𝑗 ′′ =𝐶
𝐶0− 𝑗
𝐺
𝜔𝐶0
(1)
where the C0 and j are capacitance of free capacitor and imaginary root, respectively. The C and G represent the measured capacitance and conductance. We can type the formula
of the ′ and ′′ by the following equations (Demirezen, 2013):
′ =𝐶
𝐶0=𝐶𝑑𝑖
0𝐴
(2)
′′ =𝐺
𝜔𝐶0=
𝐺𝑑𝑖
0𝜔𝐴
(3)
where 0 is permittivity of the vacuum, the di is thickness of the interfacial layer, and A
shows contact area At enough high forward biases for the maximum capacitance value is called to interlayer capacitance and given by 𝐶𝑎𝑐 = 𝐶𝑖 = ′ 0𝐴/𝑑𝑖 formula. The ratio of the real and imaginary dielectric constant is named as loss tangent (tan δ) and addressed by next equations:
tan 𝛿 =′
′′=𝐺
𝜔𝐶
(4)
The temperature dependent dielectric constant profile of the Al/Cu:TiO2/n-Si device has been shown in Fig. 1 for the voltage range of the -5 V and +5 V. The ′ values increased up to around 1.7 and exhibited peaks at inversion region. The peak intensities at the ′ values decreased towards to inversion region with increasing temperature depending on the interface states (Yahia, Fadel, Sakr, Shenouda, & Yakuphanoglu, 2012). The presence of the peaks can be attributed to surface polarization and particular density distribution of 𝑁𝑠𝑠 or series resistance effect (𝑅𝑠) (Kocyigit et al., 2018). Furthermore, the ′ values stayed almost 0.9 – 1.1 at depletion and accumulation regions for various temperatures. The dispersion of the ′ values with changing temperature can be attributed to that Maxwell–Wagner type interfacial polarization (Yang, Chao, Liang, Wei, & Yang, 2015). In fact, the charge carriers accumulated at boundaries and caused to increase interfacial and surface charge polarization (Kyritsis, Pissis, & Grammatikakis, 1995).

UEMK 2019 Proceedings Book
24/25 October 2019 Gaziantep University, TURKEY 591
Figure 1. The dielectric constant versus voltage plot of the Al/Cu:TiO2/n-Si device for various temperature Fig. 2 displays temperature dependent ′′ profile of the Al/Cu:TiO2/n-Si device for inversion, depletion and accumulation regions or -5 and +5 voltage ranges. The ′′ values decreased linearly from 22.0 to 0 in the inversion regions and then stayed constant at depletion and accumulation regions. The temperature changes almost did not affect the ′′ values for the given temperature range. This results confirmed that the Al/Cu:TiO2/n-
Si device is stable for temperature changes and can be used for a wide range temperature without losing energy (Karataş & Kara, 2011).
Figure 2. The dielectric loss versus voltage plot of the Al/Cu:TiO2/n-Si device for various temperature
-4 -2 0 2 4
0.3
0.6
0.9
1.2
1.5
Die
lec
tric
Co
ns
tan
t (
')
Voltage (V)
80 K 120 K
160 K 200 K
240 K 280 K
320 K 360 K
400 K
-4 -2 0 2 4
0
5
10
15
20 80 K
120 K
160 K
200 K
240 K
280 K
320 K
360 K
400 K
Die
lec
tric
Lo
ss ('
')
Voltage (V)

UEMK 2019 Proceedings Book
24/25 October 2019 Gaziantep University, TURKEY 592
The tan δ versus voltage plots of the Al/Cu:TiO2/n-Si device have been shown in Fig. 3 for various temperature. The tan δ values decreased exponentially from 87.0 to 0 by the
changing biases from inversion to depletion regions. The temperature changes slightly affected the tan δ values at inversion region, and the tan δ values exhibited peaks at with increasing temperature (inset of Fig. 3). The changes at the tan δ values can be attributed to decreasing series resistance and polarizations (Demirezen, 2013; Ahmet Kaya et al., 2013).
Figure 3. The tangent loss versus voltage plot of the Al/Cu:TiO2/n-Si device for various temperature The inverse of the complex permittivity gives the complex electric modulus depending on the relation of the ε*=1/M*. The Complex electric modulus is addressed by the following equation depending on the ′and ′′ values as below (Demirezen, 2013):
𝑀∗ =1∗=
′
′2 + ′′2+ 𝑗
′′
′2 + ′′2= 𝑀′ + 𝑗𝑀′′
(5)
The temperature dependent real electric modulus (𝑀′) profile of the Al/Cu:TiO2/n-Si device has been given in Fig. 4 for the wide range voltages from -5 V to +5 V. The 𝑀′ values remained almost 0 up to -2 V voltages or strong inversion region and then suddenly increased to around 1.0 value and then stayed constant towards to accumulation region. When the 𝑀′ values did not change at the inversion with changing temperature, they slightly increased at the depletion and accumulation regions for various temperatures.
-4 -2 0 2 4
0
10
20
30
40
50
60
70
-4.0 -3.5 -3.0 -2.5 -2.0 -1.5
4
6
8
10
12
14 80 K
120 K
160 K
200 K
240 K
280 K
320 K
360 K
400 KTan
(d)
Voltage (V)
Ta
n (d)
Voltage (V)

UEMK 2019 Proceedings Book
24/25 October 2019 Gaziantep University, TURKEY 593
Figure 4. The real electric modulus versus voltage plot of Al/Cu:TiO2/n-Si device for various temperature Fig. 5 displays 𝑀′′-V plots of the Al/Cu:TiO2/n-Si device for various temperature. The 𝑀′′ values increased exponentially from -5 V to -1.7 V and showed peaks at low inversion region. The The 𝑀′′ values stayed constant at depletion and accumulation regions at zero. The exhibiting peaks at the 𝑀′′ values can be attributed to that particular distribution of the charges at surface states or relaxation time (A. Kaya et al., 2016).
Figure 5. The imaginary part of electric modulus versus voltage plot of the Al/Cu:TiO2/n-Si device for various temperature The 𝜎 is given by next equation depending on the imaginary parts of the dielectric constant, 0 and ω:
-4 -2 0 2 4
0.0
0.2
0.4
0.6
0.8
1.0
1.2 80 K
120 K
160 K
200 K
240 K
280 K
320 K
360 K
400 K
Re
al E
lectr
ic M
od
ulu
s (
M')
Voltage (V)
-4 -2 0 2 4
0.0
0.1
0.2
0.3
0.4
0.5
80 K
120 K
160 K
200 K
240 K
280 K
320 K
360 K
400 K
Ima
gin
ary
Ele
ctr
ic M
od
ulu
s (
M'')
Voltage (V)

UEMK 2019 Proceedings Book
24/25 October 2019 Gaziantep University, TURKEY 594
𝜎 = (𝑑
𝐴)𝜔𝐶tan δ = ε′′ω 0
(6)
Fig. 6 indicates the 𝜎-V graph of the Al/Cu:TiO2/n-Si device for various temperatures. The 𝜎 values decreased almost linearly from inversion to depletion region and stayed at zero at depletion and accumulation regions. They slightly increased with increasing temperature at the inversion region (inset of the Fig. 6). The slightly increase at 𝜎 values by the increasing temperature in depletion region can be depended on the increasing eddy current (Nezhadesm-Kohardafchahi et al., 2018).
Figure 6. The ac electric conductivity versus voltage plot of the Al/Cu:TiO2/n-Si device
for various temperature CONCLUSION
The TiO2 thin film with the Cu dopant were deposited on the Si wafer to fabricate Al/Cu:TiO2/n-Si device by spin coating technique. The dielectric properties of the Al/Cu:TiO2/n-Si device was studied by impedance spectroscopy technique in the temperature range of 80 K and 400 K by 40 K steps at 500 kHz frequency. The C-V and G-
V data were employed to extract the dielectric parameters of the Al/Cu:TiO2/n-Si device. The ′′ values did not affect from the temperature changes, but the ′ and tan δ values increased at inversion region by changing temperature. However, the voltage changes at the depletion and accumulation regions did not change the ′, ′′ and tan δ values. The 𝑀′′ values exhibited peaks at inversion region and the peaks intensities slightly increased by the increasing temperature and shifted towards to depletion region. The 𝜎 values decreased from inversion to depletion region down to zero and stayed constant at the depletion and accumulation regions. The results revealed that the Al/Cu:TiO2/n-Si
device can be employed in the wide range temperatures for switching applications.
-4 -2 0 2 40
1
2
3
4
5
6
-5 -4 -3 -2
20
30
40
50
60 80 K
120 K
160 K
200 K
240 K
280 K
320 K
360 K
400 K
ac e
lectr
ical C
on
du
cti
vit
iy (s
) x 1
0-6
Voltage (V)
Voltage (V)

UEMK 2019 Proceedings Book
24/25 October 2019 Gaziantep University, TURKEY 595
REFERENCES
Bilgili, A. K., Güzel, T., & Özer, M. (2019). Current-voltage characteristics of Ag/TiO2/n-InP/Au Schottky barrier diodes. Journal of Applied Physics, 125(3), 035704. https://doi.org/10.1063/1.5064637 Cifci, O. S., Bakir, M., Meyer, J. L., & Kocyigit, A. (2018). Morphological and electrical properties of ATSP/p-Si photodiode. Materials Science in Semiconductor Processing, 74, 175–182. https://doi.org/10.1016/J.MSSP.2017.10.039 Dahlan, A. S., Tataroʇlu, A., Al-Ghamdi, A. A., Al-Ghamdi, A. A., Bin-Omran, S., Al-Turki, Y., … Yakuphanoglu, F. (2015). Photodiode and photocapacitor properties of Au/CdTe/p-Si/Al device. Journal of Alloys and Compounds, 646, 1151–1156. https://doi.org/10.1016/j.jallcom.2015.06.068 Demirezen, S. (2013). Frequency- and voltage-dependent dielectric properties and electrical conductivity of Au/PVA (Bi-doped)/n-Si Schottky barrier diodes at room temperature. Applied Physics A, 112(4), 827–833. https://doi.org/10.1007/s00339-013-7605-7 Karataş, Ş. (2008). Studies on electrical and the dielectric properties in MS structures. Journal of Non-Crystalline Solids, 354(30), 3606–3611. https://doi.org/10.1016/J.JNONCRYSOL.2008.03.028 Karataş, Ş., & Kara, Z. (2011). Temperature dependent electrical and dielectric properties of Sn/p-Si metal–semiconductor (MS) structures. Microelectronics Reliability, 51(12), 2205–2209. https://doi.org/10.1016/J.MICROREL.2011.03.041 Kaya, A., Alialy, S., Demirezen, S., Balbaşı, M., Yerişkin, S. A., & Aytimur, A. (2016). The investigation of dielectric properties and ac conductivity of Au/GO-doped PrBaCoO nanoceramic/n-Si capacitors using impedance spectroscopy method. Ceramics International, 42(2), 3322–3329. https://doi.org/10.1016/j.ceramint.2015.10.126 Kaya, Ahmet, Altındal, Ş., Asar, Y. Ş., & Sönmez, Z. (2013). On the Voltage and Frequency Distribution of Dielectric Properties and ac Electrical Conductivity in Al/SiO 2 /p-Si (MOS) Capacitors. Chinese Physics Letters, 30(1), 017301. https://doi.org/10.1088/0256-307X/30/1/017301 Kocyigit, A., Orak, İ., & Turut, A. (2018). Temperature dependent dielectric properties of Au/ZnO/ n -Si heterojuntion. Materials Research Express. https://doi.org/10.1088/2053-1591/aab2e3 Koo, J. H., Jeong, S., Shim, H. J., Son, D., Kim, J., Kim, D. C., … Kim, D.-H. (2017). Wearable Electrocardiogram Monitor Using Carbon Nanotube Electronics and Color-Tunable Organic Light-Emitting Diodes. ACS Nano, 11(10), 10032–10041.
https://doi.org/10.1021/acsnano.7b04292 Kumar, A., Mondal, S., Kumar, S. G., & Koteswara Rao, K. S. R. (2015). High performance sol–gel spin-coated titanium dioxide dielectric based MOS structures. Materials Science in
Semiconductor Processing, 40, 77–83. https://doi.org/10.1016/j.mssp.2015.06.073 Kyritsis, A., Pissis, P., & Grammatikakis, J. (1995). Dielectric relaxation spectroscopy in poly(hydroxyethyl acrylates)/water hydrogels. Journal of Polymer Science Part B: Polymer

UEMK 2019 Proceedings Book
24/25 October 2019 Gaziantep University, TURKEY 596
Physics, 33(12), 1737–1750. https://doi.org/10.1002/polb.1995.090331205 Nezhadesm-Kohardafchahi, S., Farjami-Shayesteh, S., Badali, Y., Altındal, Jamshidi-Ghozlu, M. A., & Azizian-Kalandaragh, Y. (2018). Formation of ZnO nanopowders by the simple ultrasound-assisted method: Exploring the dielectric and electric properties of the Au/(ZnO-PVA)/n-Si structure. Materials Science in Semiconductor Processing, 86, 173–180. https://doi.org/10.1016/j.mssp.2018.06.030 Orak, I., Kocyigit, A., & Alindal, S. (2017). Electrical and dielectric characterization of Au/ZnO/n-Si device depending frequency and voltage. Chinese Physics B, 26(2), 028102-
028102–028107. https://doi.org/10.1088/1674-1056/26/2/028102 Rawat, G., Somvanshi, D., Kumar, H., Kumar, Y., Kumar, C., & Jit, S. (2016). Ultraviolet Detection Properties of p-Si/n-TiO2 Heterojunction Photodiodes Grown by Electron-Beam Evaporation and Sol–Gel Methods: A Comparative Study. IEEE Transactions on Nanotechnology, 15(2), 193–200. https://doi.org/10.1109/TNANO.2015.2512565
Shiwakoti, N., Bobby, A., Antony, B., & Asokan, K. (2016). Interface state density and dielectric properties of Au/n-GaP Schottky diode. Journal of Vacuum Science & Technology B, Nanotechnology and Microelectronics: Materials, Processing, Measurement, and Phenomena, 34(5), 051206. https://doi.org/10.1116/1.4961907 Tataroğlu, A., Yücedağ, İ., & Altindal, Ş. (2008). Dielectric properties and ac electrical conductivity studies of MIS type Schottky diodes at high temperatures. Microelectronic
Engineering, 85(7), 1518–1523. https://doi.org/10.1016/j.mee.2008.02.005 Yahia, I. S., Fadel, M., Sakr, G. B., Shenouda, S. S., & Yakuphanoglu, F. (2012). Effect of the frequency and temperature on the complex impedance spectroscopy (C–V and G–V) of p-ZnGa2Se4/n-Si nanostructure heterojunction diode. Journal of Materials Science, 47(4), 1719–1728. https://doi.org/10.1007/s10853-011-5951-4 Yang, L., Chao, X., Liang, P., Wei, L., & Yang, Z. (2015). Electrical properties and high-temperature dielectric relaxation behaviors of NaxBi(2−x)/3Cu3Ti4O12 ceramics. Materials Research Bulletin, 64, 216–222. https://doi.org/10.1016/j.materresbull.2014.12.060 Zeyrek, S., Acaroğlu, E., Altındal, Ş., Birdoğan, S., & Bülbül, M. M. (2013). The effect of series resistance and interface states on the frequency dependent C–V and G/w–V characteristics of Al/perylene/p-Si MPS type Schottky barrier diodes. Current Applied Physics, 13(7), 1225–1230. https://doi.org/10.1016/j.cap.2013.03.014.

UEMK 2019 Proceedings Book
24/25 October 2019 Gaziantep University, TURKEY 597
PRODUCTION OF COBALT-NICKEL ALLOY THIN FILMS BY ORGANIC
COUMARIN INVESTIGATION OF THE STRUCTURAL AND THE MAGNETIC
PROPERTIES
Rasim ÖZDEMİR Kilis 7 Aralık University, Department of Electricity and Energy [email protected] ABSTRACT: Cobalt-nickel (CoNi) alloy thin films were successfully produced by the electrodeposition method, using organic coumarin (C9H6O2) additive. Cobalt sulphate, nickel sulphate, nickel chloride, boric acid contents in bath composition were taken constant. The parameters affecting the production such as current, voltage, ambient temperature, pH, were kept constant. The organic coumarin was varied from 0.07 Mol.Lt-
1 to 0.022 Mol.Lt-1. The structural and magnetic properties of the produced thin films were examined. For this purpose; The chemical properties (Cyclic Voltammetry, CV), morphological properties (Scanning Electron Microscope, SEM), crystal structures (X-Ray Diffractometer, XRD), the amount of substance content (Inductive Coupled Plasma, ICP) and magnetic properties (Vibrating Sample Magnetometer, VSM) of the film were investigated. It was seen that, in the production of the CoNi alloy, the coumarin has a significant effect on the amount of substance deposited in the film and on the crystal structure properties. As the amount of coumarin was increased, the cobalt content in the thin film decreased and the nickel content increased. When the amount of coumarin in the bath composition was increased, it was seen that the crystalline structure (Face Centered Cubic, FCC) formed in thin films convert to amorphous structure. Magnetization measurements were performed in the range of +75000 Oe and -75000 Oe and hysteresis loops were obtained. Coercivity, saturation magnetization and permanent magnetism values were found from the hysteresis loops. When the amount of coumarin in the bath composition increased, the coercivity value (147-228 Oe) increased but the saturation magnetization (79-15 emu/g) and permanent magnetization (31-1.4 emu/g) value decreased. It was seen that coumarin exchange had a great effect on the magnetic properties and crystal structure of the CoNi thin film. Key words: electrodeposition, coumarin, additive, cobalt-nickel, magnetization.
UEMK 2019 Proceedings Book
24/25 October 2019 Gaziantep University, TURKEY 598
KOBALT-NİKEL ALAŞIM İNCE FİLMLERİN ORGANİK KUMARİNLE ÜRETİMİ YAPISAL VE MANYETİK ÖZELLİKLERİNİN İNCELENMESİ
ÖZET: Kobalt-nikel (CoNi) alaşım ince filmler elektrodepolama yöntemiyle organik kumarin (C9H6O2) ek katkı maddesi kullanılarak başarıyla üretildi. Banyo kompozisyonu içerisindeki kobalt sülfat, nikel sülfat, nikel klorür, borik asit miktarı sabit alındı. Üretime etki eden akım, gerilim, ortam sıcaklığı, pH, gibi parametreler sabit tutuldu. Organik kumarin 0.07 Mol.Lt-1 ile 0.022 Mol.Lt-1 aralığında değiştirildi. Üretilen ince filmlerin yapısal ve manyetik özellikleri incelendi. Bu amaçla; kaplama banyosu kimyasal özellikleri (Dönüşümlü Voltametri, CV), morfolojik özellikleri (Taramalı Elektron Mikroskopu, SEM), kristal yapıları (X ışını difraktometresi, XRD), filmin içeriğindeki madde miktarı oranı (İndüktif Eşleşmiş Plazma, ICP) ve manyetik özellikleri (Titreşimli Örnek Manyetometre, VSM) araştırıldı. Kumarin maddesinin, CoNi alaşımın üretiminde, filmde depolanan madde miktarı ve kristal yapı özellikleri üzerine büyük etki ettiği görüldü. Kumarin miktarı arttıkça ince film içerisindeki kobalt madde miktarı azaldı nikel madde miktarı ise arttı. Banyo kompozisyonu içerisindeki kumarin madde miktarı arttırıldığında, ince filmlerde oluşan kristal yapının (Yüzey Merkezli Kübik, FCC) amorf yapıya dönüşmesine neden olduğu görüldü. Manyetizasyon ölçümleri, +75000 Oe ve -75000 Oe aralığında gerçekleştirildi ve histerezis eğrileri elde edildi. Histerezis eğrilerinden koersivite, doyum manyetizasyonu ve kalıcı mıknatıslık değerleri bulundu. Banyo kompozisyonu içerisindeki kumarin miktarı arttığında koersivite değeri (147-228 Oe) arttı, ancak doyum manyetizasyonu (79-15 emu/g) ve kalıcı mıknatıslık değeri (31-1.4 emu/g) azaldı. Kumarin değişiminin CoNi ince filmin manyetik özellikleri ve kristal yapısı üzerinde büyük etkiye sahip olduğu görüldü. Anahtar sözcükler: elektrodepolama, kumarin, ek katkı, kobalt-nikel, manyetizasyon.

UEMK 2019 Proceedings Book
24/25 October 2019 Gaziantep University, TURKEY 599
CONTRIBUTION OF THE INVESTIGATION OF SMALL WIND AND SOLAR
ENERGY SYSTEMS TO TURKEYS ENERGY PRODUCTION
Hüseyin ÖZDEN Ege University [email protected] ABSTRACT: Almost all of the fossil-based energy source is imported and used in electrical power generation in Turkey. Increases in expected energy consumption in the near future, environmental pollution and a decrease in fossil energy reserves are increasing the importance of wind and solar energy. Today, Mega and Giga Watt wind power machines, power plants technology, its installation and maintenance is imported and costs are very high. In order to contribute to the search for alternative solutions to such problems, low power wind and solar power generation systems that are simple and economical to construct and install were investigated. In the project study, residential, farm type low energy wind turbines were designed. The expected contribution of low energy generation systems to the country's total electricity generation system is presented for discussion. In our country where the production is simple and economical, the installation of low-energy wind turbines and photovoltaic panels that can be produced easily even in a workshop will meet most of the electrical energy needs of the houses. The contribution of low-energy wind and solar generation systems to the country's total energy production should not be underestimated. It is proposed to encourage the construction of domestic energy production systems in our country. Project work; The aim of the study is to contribute to scientific studies on energy production and energy supplementation of residential and farm type low energy wind turbines and photovoltaic panels. KEYWORDS: Energy, Renewable Energy, Wind Turbine Design, Low Power, Research DÜŞÜK GÜÇLÜ RÜZGÂR VE GÜNEŞ ENERJİSİ SİSTEMLERİNİN TÜRKİYENİN ENERJİ ÜRETİMİNE KATKISININ ARAŞTIRILMASI
ÖZET: Fosil bazlı enerji kaynaklarının tamamına yakını Türkiyede ithal edilmektedir ve elektrik enerji üretim santrallerinde kullanılmaktadır. Yakın gelecekte beklenen enerji tüketiminde artışlar, çevre kirliliği ve fosil enerji rezervlerindeki azalma, rüzgâr ve güneş enerjilerin önemi artırıyor. Günümüzde Mega ve Giga Watt gücündeki rüzgâr enerji makinaların, santrallerin teknolojisi kurulumu ve bakımları ithal olup maliyetleri çok

UEMK 2019 Proceedings Book
24/25 October 2019 Gaziantep University, TURKEY 600
yüksektir. Bu gibi sorunlara alternatif çözüm arayışlarına katkı sağlamak amacıyla, yapımı ve kurulumu basit ve ekonomik olan düşük güçlü rüzgâr ve güneş enerji üretim sistemleri araştırılmıştır. Proje çalışmasında konut, çiftlik tipi düşük enerjili rüzgâr türbinleri tasarlanmıştır. Ülkenin toplam elektrik enerji üretim sisteminde düşük enerji üretim sistemlerin beklenen katkıları tartışmağa sunulmaktadır. Yapımların basit ve ekonomik olan ülkemizde bir atölyede dahi rahatlıkla üretilebilecek düşük enerjili rüzgâr türbinlerin ve fotovoltaik panellerin konutlarda monte edilmesi ile konutların elektrik enerji ihtiyacının büyük kısmını karşılayacaktır. Düşük enerjili rüzgâr ve güneş üretim sistemlerinin ülkenin toplam enerji üretimine olan katkısı küçümsenmemelidir. Ülkemizde yerli enerji üretim sistemlerin yapımları teşvik edilmesi önerilmiştir. Proje çalışması; konut ve çiftlik tipi düşük enerjili rüzgâr türbinlerin ve fotovoltaik panellerin enerji üretimi ile enerji takviyesi konulu bilimsel çalışmalara katkı sağlaması amaçlıdır. Anahtar Sözcükler: Enerji, Yenilenebilir Enerji, Rüzgâr Türbin Tasarımı, Düşük Güçlü, Araştırma

UEMK 2019 Proceedings Book
24/25 October 2019 Gaziantep University, TURKEY 601
BUCKLING OF NANOBEAMS USING ADOMIAN DECOMPOSITION METHOD
Safa Bozkurt COŞKUN
Kocaeli University
Servet MERT KUTSAL
Kocaeli University
servet.mert@ kocaeli.edu.tr
ABSTRACT: In this study, Adomian Decomposition Method (ADM) is applied to investigate the stability of
nanobeams based on non-local Euler-Bernoulli beam theory. ADM is an analytical approximation technique that has
been successfully applied in recent years to important problems of mathematics, physics and engineering. The method
is very straightforward and the results by using ADM in the studies available in the literature has shown its efficiency.
ADM solutions in this study are compared with other available results in the literature and a very good agreement is
observed. Presented technique is very effective in the stability analysis of nanobeams.
Key words: nonlocal Euler-Bernoulli beam theory, Adomian decomposition method, buckling; nano beam
INTRODUCTION
The nano-sized structures such as nano-beams, nanoplates and nano-shells are commonly used as components in
NEMS (nanoelectromechanical systems) devices that play a significant role in nanotechnology. These structures have
thus received great attention in scientific community and the interest to the field has been accelerating due to
outstanding physical and mechanical properties of nanomaterials. Both experimental and theoretical simulation studies
have shown that the size effect has a major role on mechanical properties when the dimensions of structural elements
become very small. Hence, nonlocal elasticity concept (Eringen, 1972) has been widely applied to take small length
scale effect into account.
Peddieson et al. (2003) performed a pioneering work on the application of non-local elasticity theory to investigate
bending, buckling and vibration of nano sized beams. Wang et al. (2006) considered elastic buckling analysis of
micro- and nano-rods/tubes based on Eringen’s nonlocal elasticity theory and the Timoshenko beam theory. Reddy (2007) reformulated various beam theories using the nonlocal differential constitutive relations of Eringen. Pradhan
and Phadikar (2009) conducted structural analysis of nonhomogeneous nanotubes has been carried out using nonlocal
elasticity theory. Akgöz and Civalek (2011) proposed higher-order continuum theories for the buckling analysis of
single walled carbon nanotubes. Ghannadpour et al. (2013) studied the bending, buckling and vibration analyzes of
nonlocal Euler beams. Tuna and Kırca (2016) examined the buckling and vibration characteristics of nonlocal Euler–
Bernoulli beams analytically. Tuna and Kırca (2017) developed finite element formulations for static bending, linear
buckling and free vibration analysis of nanobeam structures by utilizing the integral form of Eringen nonlocal model.
Zhu et al. (2017) adopted Eringen’s two-phase nonlocal integral model to obtain analytical solutions for the buckling
problem of Euler-Bernoulli beams. Chakraverty and Behera (2017) provided theoretical information on bending,
buckling and vibration of nanobeams and nanoplates. Ghannadpour (2018) investigated bending, buckling and
vibration behaviors of nonlocal Timoshenko beams using a variational approach.
In this study elastic stability of nanobeams is investigated using nonlocal Euler-Bernoulli beam theory via ADM
(Adomian, 1994). Nondimensional buckling load parameters are computed for the beams with various boundary
conditions and the influence of scaling effect parameter is discussed.
NONLOCAL EULER BEAM THEORY FOR STABILITY
Euler-Bernoulli beam theory (EBT) is based on following displacement field Reddy (2007), Chakraverty and Behera
(2017).

UEMK 2019 Proceedings Book
24/25 October 2019 Gaziantep University, TURKEY 602
(1)
where (u1, u2, u3) are the displacements along x-, y-, and z-coordinates, respectively, and w is the transverse
displacement of the point (x, 0) on the mid-plane (z = 0) of the beam. The only non-zero strain of EBT is
(2)
Governing equation of Euler-Bernoulli nanobeam may be written neglecting transverse force as
(3)
where N is axial compressive force, and . According to Eringen’s nonlocal
theory (Eringen 1987), the constitutive relation for Euler–Bernoulli nanobeam is given by (Reddy 2007)
(4)
where E is Young’s modulus and I is the second moment of area about y-axis. It may be noted here that µ = (e0a)2 is
the nonlocal parameter, where e0 and a denote material constant and internal characteristic length, respectively. Using
Eqs. (3) and (4), the nonlocal form of M may be written as
(5)
Governing equation in terms of displacement is rewritten as
(6)
If we ignore the dynamic effects, Eq.(6) becomes
(7)
Constant axial compressive force lead to the following form for governing equation.
(8)
Introducing the nondimensional terms , , and dimensionless
governing equation is obtained as follows:
(9)
where is nondimensional buckling load parameter and is scaling effect parameter.
ADOMIAN DECOMPOSITION METHOD (ADM)
ADM calculates an analytical approximate solution as a series summation with a rapid convergence. We consider the
following differential equation for the application of the method.
(10
)
1 2 3 0 ( , )w
u z u u w x tx
2
2xx
wz
x
2 2 2
02 2 2
M w wN m
x x t
xxA
M z dAs 0A
m dA A
2 2
2 2
M wM EI
x x
2 2 2
02 2 2
w w wM EI N m
x x t
4 2 2 2 2 2
0 04 2 2 2 2 2
w w w w wEI N m N m
x x x t x t
4 2 2 2
4 2 2 2
w w wEI N N
x x x x
4 2 2
4 2 2
w wEI N w
x x x
X x L W W L 2N NL EI 0e A L
4 2 22
4 2 2
d W d d WN W
dX dX dX
N
Lu Ru Nu g x

UEMK 2019 Proceedings Book
24/25 October 2019 Gaziantep University, TURKEY 603
where L is the linear operator which is highest order derivative, N is the nonlinear operator, R is remainder of linear
operator including derivatives of less order than L, u represents the unknown variable and g(x) is the source function.
The solution for Eq.(10) is
(11)
where L-1 is the inverse operator for the linear operator L. f(x) is the summation of integral of the source term and the
terms arising from given conditions of the problem. ADM approximates the solution as the summation of an infinite
series as
(12)
The nonlinear operation Nu is represented by Adomian polynomials, Ai, for the specific nonlinearity.
(13)
The relation for the calculation of Adomian polynomials is given as follows.
(14)
Application of the method lead to following recursive algorithm for the components of solution. (15)
(16)
SOLUTION PROCEDURE
After the application of ADM to Eq.(9), following successive approximations are obtained
(17)
(18)
Nth order ADM solution to the problem is
(19)
For the stability problems, three different beams are considered. The beam with both ends pinned (PP), the beam with
both ends clamped (CC) and the beam with one end pinned and other end clamped (CP). According to type of the
support at the beam’s end we use the displacement function and apply it to the specific boundary conditions at both
ends of the beam, hence, four equations in four unknowns are obtained. These equations can be represented in matrix
form as
(20)
where . For a nontrivial solution, determinant of coefficient matrix
must be zero. Determinant of coefficient matrix yields a characteristic equation in terms of nondimensional buckling
load parameter . Positive real roots of this equation are the nondimensional buckling loads for the case considered.
NUMERICAL RESULTS
Below nondimesional buckling loads for PP, CP and CC nanobeams are compared with the available results in
literature (Wang et al., 2006; Pradhan and Padikar, 2009; Ghannadpour et al., 2013; Tuna and Kırca, 2016; Tuna and
1 1u f x L Ru L Nu
0
( ) ( )n
n
u x u x
0 1
0
, , ,n n
n
Nu A u u u
0
1, 0
!
nk
n knn
dA N u n
n d
0u x f x
1
1 , 0n n nu x L Ru A n
2 3
0 0 ' 0 '' 0 ''' 02 6
X XW W W X W W
221 2 1
12 2 , 1n
n n
d WdW L N W n
dX dX
0
( ) ( )N
n
n
W X W X
0M N
(0) '(0) ''(0) '''(0)T
W W W W
N

UEMK 2019 Proceedings Book
24/25 October 2019 Gaziantep University, TURKEY 604
Kırca, 2017; Zhu et al., 2017) for = 0.05 and = 0.2. Numerical work revealed that tenth order solution is adequate
for computing the critical buckling load for PP beam when = 0.05, while the required number of terms are doubled
for the same beam when = 1. For CC and CP beams required order of solutions is triple the order of solution for PP
beam. Buckling load parameters decreases with the increasing scale parameter. Table 1, Table 2 and Table 3
summarize the comparisons for PP, CP and CC nanobeams respectively. For all the cases is assumed.
Table 1. Nondimensional buckling load parameter for PP beam with various scaling effects
ADM Wang et al.
(2006)
Pradhan and
Padikar
(2009)
Ghannadpour
et al. (2013)
Tuna and
Kırca
(2016)
Tuna and
Kırca
(2017)
Zhu et al.
(2017)
0.05 9.63195 9.6319 - - 9.6319 9.6319 9.6261
0.2 7.07608 7.0760 - 7.0760 7.0761 7.0776 -
1 0.90780 - 0.9080 0.9080 - - -
Table 2. Nondimensional buckling load parameter for CC beam with various scaling effects
ADM Wang et al.
(2006)
Pradhan and
Padikar
(2009)
Ghannadpour
et al. (2013)
Zhu et al.
(2017)
0.05 35.93206 35.9321 - - 30.5311
0.2 15.30679 15.3068 - 15.3068 -
1 0.97310 - 0.9753 0.9753 -
Table 3. Nondimensional buckling load parameter for CP beam with various scaling effects
ADM Wang et al.
(2006)
Pradhan and
Padikar
(2009)
Ghannadpour
et al. (2013)
Tuna and
Kırca
(2016)
Tuna and
Kırca
(2017)
Zhu et al.
(2017)
0.05 19.22054 19.2205 - - 17.537 17.547 17.5333
0.2 11.16973 11.1699 - 11.1697 9.2784 9.2899 -
1 0.95262 - 0.9528 0.9528 - - -
CONCLUSION
In this study elastic stability of nanobeams is studied using nonlocal Euler-Bernoulli beam theory. ADM is employed
in the analysis and solutions are computed for the nondimensional buckling load parameters. The results obtained
using ADM is in very good agreement with the various solutions available in the literature. It is demonstrated that
ADM is an effective technique to apply on elastic stability problems of nano beams.
REFERENCES
Adomian, G. (1994). Solving Frontier Problems of Physics: The Decomposition Method. Springer Netherlands.
Akgöz, B. & Civalek, Ö. (2011). Buckling Analysis Of Cantilever Carbon Nanotubes Using The Strain Gradient
Elasticity And Modified Couple Stress Theories. Journal of Computational and Theoretical Nanoscience, 8(9), 1821-
1827.
Chakraverty, S. & Behera, L. (2017). Static and Dynamic problems of nanobeams and nanoplates. World Scientific
Publishing Co., Singapore.
Eringen, A. C. (1972). Nonlocal polar elastic continua. International Journal of Engineering Science, 10, 1-16.
Eringen, A. C. (1987). Theory of nonlocal elasticity and some applications. Res. Mech., 21, 313-342.
Ghannadpour, S. A. M., Mohammadi, B. & Fazilati, J. (2013). Bending, buckling and vibration problems of nonlocal
Euler beams using Ritz method. Composite Structures, 96, 584-589.
/ 10L d
N
N
N

UEMK 2019 Proceedings Book
24/25 October 2019 Gaziantep University, TURKEY 605
Ghannadpour, S. A. M. (2018). Ritz Method Application to Bending, Buckling and Vibration Analyses of Timoshenko
Beams via Nonlocal Elasticity. Journal of Applied and Computational Mechanics, 4(1), 16-26.
Peddieson, J., Buchanan, G. R. & McNitt, R. P. (2003). Application of nonlocal continuum models to nanotechnology.
International Journal of Engineering Science, 41, 305-312.
Pradhan, S. C. & Phadikar, J. K. (2009). Bending, buckling and vibration analyses of nonhomogenous nanotubes using
GDQ and nonlocal elasticity theory. Structural Engineering and Mechanics, 33 , 193–213.
Reddy, J. N. (2007). Nonlocal theories for bending, buckling and vibration of beams. International Journal of
Engineering Science, 45, 288-307.
Tuna, M. & Kırca, M. (2016). Exact solution of Eringen’s nonlocal integral model for vibration and buckling of Euler–
Bernoulli beam. International Journal of Engineering Science, 107, 54-67.
Tuna, M. & Kırca, M. (2017). Bending, buckling and free vibration analysis of Euler-Bernoulli nanobeams using
Eringen’s nonlocal integral model via finite element method. Composite Structures, 179(1), 269-284.
Wang, C. M., Zhang, Y. Y., Ramesh, S. S. & Kitipornchai, S. (2006). Buckling analysis of micro- and nano-rods/tubes
based on nonlocal Timoshenko beam theory. Journal of Physics D: Applied Physics, 39(17), 3904-3909.
Zhu, X., Wang, Y. & Dai, H. H. (2017). Buckling analysis of Euler–Bernoulli beams using Eringen’s two-phase
nonlocal model. International Journal of Engineering Science, 116, 130-140.

UEMK 2019 Proceedings Book
24/25 October 2019 Gaziantep University, TURKEY 606
VIBRATION OF NANOBEAMS USING ADOMIAN DECOMPOSITION METHOD
Safa Bozkurt COŞKUN Kocaeli University [email protected] Servet MERT KUTSAL Kocaeli University servet.mert@ kocaeli.edu.tr ABSTRACT: In this study, a semi analytical technique called Adomian Decomposition Method (ADM) is applied to investigate free vibration of nanobeams based on non-local Euler-Bernoulli beam theory. ADM has been successfully used in linear/nonlinear variable coefficient solutions of ordinary/partial differential equations. All the steps of the ADM are very straightforward and the boundary conditions can be implemented in the computed analytical solution easily. ADM solutions are compared with other available results and perfect agreement is observed. Presented technique is very effective in the vibration analysis of nanobeams. Key words: nonlocal Euler-Bernoulli beam theory, Adomian decomposition method, vibration; nano beam INTRODUCTION
In recent years, nanomaterials has been widely used in engineering and nanotechnology. Among these materials beam type structures play a significant role in nanotechnology. Beam type structural elements are broadly utilized in civil, mechanical and aerospace engineering and recently beams have also been used in nanoelectromechanical systems. Since vibration is an important issue, dynamic analysis of beam structures has been carried out by numerous researchers. Hence, mechanical behavior of nanobeams for accurate investigation of vibration characteristics has drawn great attention to researchers worldwide. In the study of mechanical behavior atomistic, semi-continuum and continuum models are used. Experimental and atomistic simulation works revealed that at nanoscale, the small length scale effect may be considered. Hence, nonlocal elasticity theory by Eringen (1972) has been widely applied to take small length scale effect into account. A pioneering work conducted by Peddieson et al. (2003) on the application of non-local elasticity theory to analyze bending, buckling and vibration of nanobeams. Xu (2006) used the integral equation approach and the non-local elasticity theory to investigate the

UEMK 2019 Proceedings Book
24/25 October 2019 Gaziantep University, TURKEY 607
free transverse vibrations of nano-to-micron scale beams. Reddy (2007) reformulated various beam theories using the nonlocal differential constitutive relations of Eringen. Wang et al. (2007) considered the free vibration problem for micro/nano beams using Eringen’s nonlocal elasticity theory. Murmu and Pradhan (2009) vibration response of nanocantilever is investigated using differential quadrature method. Murmu and Adhikari (2010) considered vibration analysis of double-nanobeam-systems. Roque et al. (2011) employed meshless methods to study bending, buckling and free vibration of Timoshenko nanobeams. Behera and Chakraverty (2015) applied differential quadrature method to investigate free vibration of nanobeams based on different beam theories. Chakraverty and Behera (2017) provided theoretical information on bending, buckling and vibration of nanobeams and nanoplates. Jena and Chakreverty (2018) studied free vibration of nanobeams based on non-local Euler–Bernoulli beam theory via differential transformation method. Akgöz and Civalek (2018) considered thermo-elastic vibrational behavior of thick microbeams embedded in a two-parameter elastic foundation. In this study free vibration of nanobeams is investigated using nonlocal Euler-Bernoulli beam theory. ADM (Adomian, 1994) is used in the solution process of governing equation. First five free vibration frequencies are computed and the influence of scaling effect parameter is discussed.
NONLOCAL EULER-BERNOULLI BEAM THEORY FOR FREE VIBRATION
Euler-Bernoulli beam theory (EBT) is based on following displacement field Reddy (2007), Chakraverty and Behera (2017).
1 2 3 0 ( , )w
u z u u w x tx
(1)
where (u1, u2, u3) are the displacements along x-, y-, and z-coordinates, respectively, and w is the transverse displacement of the point (x, 0) on the mid-plane (z = 0) of the beam. The only non-zero strain of EBT is
2
2xx
wz
x
(2)
In the absence of transverse force and axial compressive force, governing equation of Euler-Bernoulli nanobeam may be written as
2 2
02 2
M wm
x t
(3)
where xxA
M z dAs and 0A
m dA A . According to Eringen’s nonlocal theory
(Eringen 1987), the constitutive relation for Euler–Bernoulli nanobeam is given by (Reddy 2007)
2 2
2 2
M wM EI
x x
(4)

UEMK 2019 Proceedings Book
24/25 October 2019 Gaziantep University, TURKEY 608
where E is Young’s modulus and I is the second moment of area about y-axis. It may be noted here that µ = (e0a)2 is the nonlocal parameter, where e0 and a denote material
constant and internal characteristic length, respectively. Using Eqs. (3) and (4), the nonlocal form of M may be written as
2 2
02 2
w wM EI m
x t
(5)
Governing equation in terms of displacement is rewritten as 4 4 2
0 04 2 2 2
w w wEI m m
x x t t
(6)
If we assume the generalized displacements as
( , ) ( ) i tw x t W x e (7)
Eq.(6) becomes 4 2
2 2
0 04 2
W WEI m m W
x x
(8)
Introducing the nondimensional terms X x L , W W L , 2 2 4A L EI and
0e A L dimensionless governing equation is obtained as follows: 4 2
2 2 2
4 2
W WW
X X
(9)
where 2 is frequency parameter and is scaling effect parameter. ADOMIAN DECOMPOSITION METHOD (ADM)
ADM applied successfully to a number of problem in physics (Adomian, 1994). The method provides an analytical approximate solution as a series summation approaching the exact solution rapidly. Consider a differential equation of the following form.
Lu Ru Nu g x (10)
where L is the linear operator which is highest order derivative, N is the nonlinear operator, R is remainder of linear operator including derivatives of less order than L, u represents the unknown variable and g(x) is the source function. The solution for Eq.(10) is
1 1u f x L Ru L Nu (11)
where L-1 is the inverse operator for the linear operator L. f(x) is the summation of integral of the source term and the terms arising from given conditions of the problem. The solution is produced as an infinite series as
0
( ) ( )n
n
u x u x
(12)
The nonlinear Nu is represented by an infinite series of specially generated Adomian polynomials, Ai, for the specific nonlinearity.

UEMK 2019 Proceedings Book
24/25 October 2019 Gaziantep University, TURKEY 609
0 1
0
, , ,n n
n
Nu A u u u
(13)
Adomian polynomials can be calculated by means of following expression.
0
1, 0
!
nk
n knn
dA N u n
n d
(14)
The components of solution can be generated with the following algorithm recursively.
0u x f x (15)
1
1 , 0n n nu x L Ru A n
(16)
SOLUTION PROCEDURE
After the application of ADM to Eq.(9), following successive approximations are obtained
2 3
0 0 ' 0 '' 0 ''' 02 6
X XW W W X W W (17)
21 2 2 21
12 , 1n
n n
d WW L W n
dX
(18)
Nth order ADM solution to the problem is
0
( ) ( )N
n
n
W X W X
(19)
Three different beams are considered in this study. The beam with both ends pinned (PP), the beam with both ends clamped (CC) and the beam with one end pinned and other end clamped (CP). After the application of boundary conditions, four equations in four unknowns may be written with respect to the boundary conditions of the problem. These equations can be represented in matrix form as
0M (20)
where (0) '(0) ''(0) '''(0)T
W W W W . For a nontrivial solution, determinant of
coefficient matrix must be zero. Determinant of coefficient matrix yields a characteristic equation in terms of . Positive real roots of this equation are the frequency parameters of free vibration for the case considered. NUMERICAL RESULTS
Below first five frequency parameters of PP, CP and CC nanobeams are compared with the analytical solutions available in literature (Wang et al., 2007). Although, a third order
solution is enough for first and twentieth order solution is required for fifth frequency parameters for = 0.1, by the choose of = 0.7 the convergence for the first frequency parameter is satisfied with the fifth order solution while the twenty-fifth order solution is required for the convergence for fifth mode of vibration. Frequency parameters decreases with the increasing scale parameter. Table 1, Table 2 and Table 3 summarize

UEMK 2019 Proceedings Book
24/25 October 2019 Gaziantep University, TURKEY 610
the comparisons for PP, CP and CC nanobeams respectively. For all the cases / 10L d is assumed as given in Wang et al. (2007).
CONCLUSION
In this study free vibration of nanobeams is investigated using nonlocal Euler-Bernoulli beam theory. To this aim ADM is employed and twenty-fifth order solutions computed for the first five vibration frequency parameters of free vibration. The results obtained using ADM is excellent agreement with the analytical solutions available in the literature. It is shown that ADM is an effective technique to apply on vibration problems of nano beams. Another great advantage of the technique is that it provides the frequencies in successive orders. It is not that easy in analytical solutions even for constant coefficient governing differential equations. REFERENCES
UEMK 2019 Proceedings Book
24/25 October 2019 Gaziantep University, TURKEY 611
Adomian, G. (1994). Solving Frontier Problems of Physics: The Decomposition Method.
Springer Netherlands. Akgöz, B. & Civalek, Ö. (2018). Vibrational characteristics of embedded microbeams lying on a two-parameter elastic foundation in thermal environment. Composites Part B: Engineering, 150, 38-77. Behera, L. & Chakraverty, S. (2015). Application of Differential Quadrature method in free vibration analysis of nanobeams based on various nonlocal theories. Computers and Mathematics with Applications, 69(12), 1444-1462. Chakraverty, S. & Behera, L. (2017). Static and Dynamic problems of nanobeams and nanoplates. World Scientific Publishing Co., Singapore. Eringen, A. C. (1972). Nonlocal polar elastic continua. International Journal of Engineering Science, 10, 1-16. Eringen, A. C. (1987). Theory of nonlocal elasticity and some applications. Res. Mech., 21, 313-342. Jena, S. K. & Chakraverty, S. (2018). Free vibration analysis of Euler–Bernoulli nanobeam using differential transform method. International Journal of Computational Materials Science and Engineering, 07(03), 1850020. Murmu, T. & Adhikari, S. (2010). Nonlocal transverse vibration of double-nanobeam-systems. Journal of Applied Physics, 108, 083514. Murmu, T. & Pradhan, S. (2009). Small-scale effect on the vibration of nonuniform nanocantilever based on nonlocal elasticity theory. Physica E, 41(8), 1451-1456. Peddieson, J., Buchanan, G. R. & McNitt, R. P. (2003). Application of nonlocal continuum models to nanotechnology. International Journal of Engineering Science, 41, 305-312. Reddy, J. N. (2007). Nonlocal theories for bending, buckling and vibration of beams. International Journal of Engineering Science, 45, 288-307.
Roque, C. M. C., Ferreira A. J. M. & Reddy, J. N. (2011). Analysis of Timoshenko nanobeams with a nonlocal formulation and meshless method. International Journal of Engineering Science, 49(9), 976-984. Wang, C. M., Zhang, Y. Y. & He, X. Q. (2007). Vibration of nonlocal Timoshenko beams. Nanotechnology, 18, 105401. Xu, M. (2006). Free transverse vibrations of nano-to-micron scale beams. Proceedings of the Royal Society A:Mathematical, Physical and Engineering Sciences, 462(2074), 2977-2995.

UEMK 2019 Proceedings Book
24/25 October 2019 Gaziantep University, TURKEY 612
A CONCEPTUAL DECISION MAKING MODEL PROPOSAL FOR R&D PROJECT SELECTION
Zeynep Didem UNUTMAZ DURMUŞOĞLU Gaziantep University [email protected]
Alptekin DURMUŞOĞLU Gaziantep University [email protected]
ABSTRACT: One of important functions of technology management (TM) research area is to present the required tools and techniques for “the correct selection of new R&D projects among the alternatives”. Many new technology project proposal prepared by R&D unit of companies located in our country and USA are evaluated by the executives and the projects that are thought to be promising are selected and implemented. This selection decision is usually executed by the heuristic approaches in the light of the experiences of executives. At the end, many projects that are predicted to be successful end with failure while the projects that may be probably successful are disclaimed. In this study, an analytical model frame is formed to be used in the evaluation of R&D projects among the alternatives. In the proposed model, fuzzy DEMATEL method will be used to determine interrelations among selection criteria whereas TOPSİS will be implemented to find out the hierarchy of criteria. Key words: R&D project selection, DEMATEL, TOPSİS AR&GE PROJESİ SEÇİMİ İÇİN KAVRAMSAL BİR KARAR VERME MODELİ ÖNERİSİ
ÖZET: Teknoloji yönetimi (TY) çalışma alanının önemli fonksiyonlarından biri de “yeni AR&GE projelerinin, alternatifler arasından doğru seçilmesi için” gerekli araçların ve tekniklerin uygulayıcılara sunulmasıdır. Ülkemizde ve ABD’de firmaların AR&GE birimleri tarafından hazırlanan birçok yeni teknoloji proje önerisi, firma üst yöneticileri tarafından değerlendirilmekte ve en çok başarı vaat ettiği düşünülen projeler seçilerek uygulama aşamasına geçilmektedir. Bu seçim kararı genellikle yöneticilerin tecrübeleri ışığında sezgisel yöntemler ile yürütülmektedir. Nihayetinde, başarılı olacağı öngörülen birçok proje, başarısızlıkla sonuçlanmakta, başarılı olması muhtemel bazı projelerden ise vazgeçilmektedir. Bu çalışmada, yeni AR&GE projesi alternatiflerinin

UEMK 2019 Proceedings Book
24/25 October 2019 Gaziantep University, TURKEY 613
değerlendirilmesinde kullanılmak amacıyla analitik bir modelin çerçevesi çizilmektedir. Önerilen modelde, seçim kriterleri arasındaki etkileşimi belirlemek için bulanık DEMATEL yöntemi, önerilen modeldeki kriter hiyerarşilerini incelemek için ise bulanık hiyerarşik TOPSİS yöntemi kullanılacaktır. Anahtar sözcükler: AR&GE proje seçimi, DEMATEL, TOPSİS GİRİŞ
“Varlığını sürdürebilmenin” yenilikçiliğe bağlı olduğu birçok işletmede, “yeni ürünler ve süreçler geliştirmek” rekabetçi kalabilmenin tek yolu olmuştur. Bu tip işletmeler için AR&GE, stratejik yönetim çerçevesinde içselleştirilmiş bir fonksiyona sahip olmalıdır. Ancak bir işletme için teknik anlamda mükemmel yeterliliklere sahip olunsa bile göz ardı edilmemesi gereken kısıtlı kaynaklar söz konusudur. AR&GE projesi seçim kararı kısıtlı organizasyonel kaynakların (para, insan, enerji vb.) doğru dağıtılmasını esas alır. Bu nedenle AR&GE projelerinin doğru seçimi ve fonlanması, firmaların hayatta kalabilmesi için kritik öneme sahiptir. Bu kritik önem ulusal düzeyde ülkelerin refahı açısından da oldukça önemlidir. Hızlı değişimin çevrelediği günümüz dünyasında, AR&GE, ulusların geleceklerine yaptıkları bir yatırımdır. Bu çerçevede ülkeler öz kaynaklarının optimum dağılımını belirlemek için gerçekçi ve analitik bir yaklaşıma ihtiyaç duymaktadır. Optimum kaynak dağılımının yanı sıra dikkate alınması gereken diğer önemli faktörler seçilen projenin başarıyla sonuçlanmasına ve kazanç oluşturacağına yönelik öngörülerin isabetli olmasıdır. Bilimsel yazın, AR&GE seçim kararına yönelik oldukça çok sayıda yöntem geliştirilmesine karşın bunların ancak bazılarının gerçekten kullanıldığını işaret etmektedir. Bu yöntemlerle ilgili temel eleştiri, yöntemlerin stratejik unsurları dikkate almadığı ve matematiksel olarak oldukça karmaşık oldukları yönündedir. Bu çalışma ile hedeflenen, bahsedilen eleştirileri dikkate alan, kısıtları yok saymayan analitik, çok kriterli bir karar verme yönteminin kavramsal olarak sunulmasıdır. BİLİMSEL YAZIN TARAMASI
Bu bölüm, bilimsel yazında yer alan AR&GE projesi değerlendirme yöntemlerinin gelişimini genel başlıklar halinde sunmak üzere hazırlanmıştır. Bilimsel yazına 40 yılı aşkın süredir konu olan AR&GE projesi seçimi konusunun bu denli ilgi çekmiş olması açıklanmaya muhtaçtır. Konunun bu denli ilgi çekmesinde ilk akla gelen sebepler şunlardır:
AR&GE projesi seçimi problemi ürün geliştirme departmanlarının sıklıkla karşılaştığı zorlu bir problemdir. Her ne kadar birçok araştırma yapılmış olsa da, konu gelecek için önemli fırsatların olduğu geniş bir çalışma konusudur.

UEMK 2019 Proceedings Book
24/25 October 2019 Gaziantep University, TURKEY 614
AR&GE projesi seçimi için önerilen çözümler diğer bazı alanlar için de çözüm değeri taşıyabilir. Örneğin; bulunacak bir çözüm, firmaların sıklıkla karşılaştığı
“teknoloji seçimi” problemi için de tatmin edici bir düzeyde olabilir. Çünkü AR&GE projesi ve teknoloji seçimi ortak özelliklere sahip süreçlerdir.
Kamu kurumları aracılığıyla fonlanan AR&GE çalışmalarının değerlendirilmesinde, kamuoyunu ikna edebilecek nesnellikte adil bir değerlendirme sistemi arayışı söz konusudur. Bu nedenle teknik unsurları dikkate alan ve popülizmi dışlayan şeffaf yöntemler üzerinde çalışmalar sürdürülmektedir. AR&GE projesi seçimi için uygulanan yöntemlerin sınıflandırılmasında genel olarak iki ana görüşün etkisinde kalınmıştır. Bunlardan ilki Baker, Freeland, ve Pound (Baker & Freeland, 1975; Pound, 1964) tarafından ortaya atılan sağlanacak faydanın öngörülmesi üzerine kurulu yaklaşımdır. İkincisi ise Baker, Freeland, ve Pound tarafından ortaya atılan opsiyonların teknik analizine dayalı yöntemlerin sınıflandırılmasıdır (Kocaoglu, 1992; Souder & Mandakovic, 1986). Her iki görüşün de ortaya koyduğu sınıflandırmalar dikkate alındığında AR&GE projesi seçimi için bilimsel yazında sunulan yöntemleri altı değişik kategori de toplamak mümkündür. Şekil 1 de görüldüğü üzere; bu yöntemler, fayda ölçüm metotları, matematiksel modeller, benzetim ve sezgisel modeller, bilişsel yaklaşımlar, gerçek alternatifler ve amaca mahsus tasarlanmış modellerdir. Burada ismi anılan her yaklaşım problemi kendine özgü bir şekilde ele aldığından, yöntemlerin yine kendilerine özgü farklı avantajları ve dezavantajları söz konusudur. Problemi bir karar problemi olarak ele alan yaklaşımlar birbirinden farklı alternatiflerden birinin en iyi kararı almak üzere seçilmesine odaklanırken, maliyetler çoğu zaman göreceli bir değerlendirme ile (hâlbuki öngörülen maliyetler sayısal olarak ifade edilebilmektedir) sadece ağırlıklandırılmış bir faktör olarak ele alınmaktadır. Bir diğer yandan problemi bir optimizasyon problemi gibi ele alan yaklaşımlar ise projenin başarısına yönelik uzman öngörülerini dışlayan ve salt nesnel verileri dikkate alan teknik çözümler üretebilmektedir. Bu nedenle farklı yaklaşımların görece dezavantajlı yönlerini dengeleyecek melez yaklaşımlar önerilmesinin problemin daha sağlıklı ele alınmasını sağlayacağı ifade edilebilir.
Fayda Ölçümü Amaçlı Modeller Karşılaştırmalı Modeller: Karşılaştırmalı modeller bir grup proje önerisinin önceden belirlenmiş kriterler eşliğinde birbirleriyle kıyaslanarak değerlendirilmesi üzerine kuruludur (Milosevic, 2003). Bu modeller bir grup uzmanın proje önerilerini kıyaslaması üzerine kurulur. Bu nedenle değerlendirmeler yüksek derecede öznellik içerir. Karşılaştırmalı modellerin de kendi içinde değişik biçimlerde sınıflandırılması mümkündür. Bu çalışmada ele alınan alt sınıflar şu şekildedir: Skorlama Yaklaşımları: Skorlama yöntemleri aday projelerin sıralanması için geliştirilmiş
metotlardır. Her aday proje sırasıyla bir kritere göre puanlanır ve tüm puanlar toplanarak

UEMK 2019 Proceedings Book
24/25 October 2019 Gaziantep University, TURKEY 615
proje skoru hesaplanır. Çok kriterli karar verme yöntemlerinin önemli bir kısmı da bu kategoride sınıflandırılabilir. Analitik hiyerarşi prosesi (AHP) bu yaklaşımlardan biridir. AHP’nin AR&GE projesi seçimi kullanımına çeşitli çalışmalarda rastlamak mümkündür (Amer & Daim, 2011; Khorramshahgol, Azani, & Gousty, 1988; M. J. Liberatore, 1987; Lockett, Hetherington, Yallup, Stratford, & Cox, 1986; Suh, Suh, & Baek, 1994; Unutmaz Durmuşoğlu, 2018; Wang, Kocaoglu, Daim, & Yang, 2010). Hiyerarşik yapıdaki faktörlerin birbirleriyle etkileşimlerini dikkate alan analitik ağ süreci (ANP) yaklaşımı da proje seçiminde kullanılmakta olan bir yöntemdir (Iskin, Daim, Kayakutlu, & Altuntas, 2012). Veri zarflama analizinin çok kriterli bir değerlendirmenin ardından proje skorlama ve sıralamada kullanıldığı özgün çalışmalar da mevcuttur (Karasakal & Aker, 2017).
Şekil 1. AR&GE Projesi Seçiminde Kullanılan Yöntemler

UEMK 2019 Proceedings Book
24/25 October 2019 Gaziantep University, TURKEY 616
Matematiksel Programlama Yaklaşımları Doğrusal Programlama Modelleri: Doğrusal programlama modelleri doğrusal programlamayı proje seçiminde kullanan sayısal modellerdir. Bu konuda ilk geliştirilen model Asher’in geliştirdiği modeldir (Asher, 1962). Bu modelde profesyonel çalışan gücü düşünülerek (çalışanların oluşturacağı maliyet kısıtları tanımlanmıştır) AR&GE projesinden sağlanacak ekonomik fayda optimize edilmeye çalışılmıştır. Doğrusal Olmayan Programlama Modelleri: Aslında uygulamada Blanning’in risk getiri modelinde (Blanning, 1981) olduğu gibi birçok karar modeli doğası gereği doğrusal değildir. Blanning’in modelinde toplam beklenen getirinin, toplam getiri ile toplam riskin çarpımından farkı (kayıtsızlık eğrisinin doğrusal eğimi çarpan katsayı olarak kullanılır) en çoklanmaya çalışılır. Tam Sayı Programlama Modelleri: En klasik örneklerinden biri Paolini ve Glaser (Paolini & Glaser, 1977) tarafından gerçekleştirilmiştir. Model seçilecek projeden elde edilecek faydanın en çoklanması için kurulmuştur. Model kısıtları müsait araştırmacı sayısı, teknisyen sayısı ve sermaye harcamasıdır. Projenin gerçekleştirilip gerçekleştirilmeyeceği değişkeni 0 ve 1 gibi tam sayı değerleri alabilmektedir. Hedef Programlama Modelleri: Hedef programlama ile proje seçiminde, karar vericinin, hedeflerini durumsal gerçeklerle karşılaşınca koyduğu varsayılır. Bu varsayım hedef programlama yaklaşımını birçok yaklaşımına göre daha gerçekçi kılar. Winkofsky ve arkadaşlarının (Winkofsky, Baker, & Sweeney, 1981) modeli bu yaklaşımın en iyi örneklerindendir. Bu modelde AR&GE kaynaklarının dağıtımıyla ilgili bireysel karar noktaları belirlenir ve proje için önemli faktörler önceliklendirilir. Daha öncelikli faktörlerde elde edilen tatmin düzeyi daha az öncelikli faktörlerin tatminin düzeyinden önemlidir. Bu nedenle model sıralı basamakların çözümüyle sağlanır. Stokastik Programlama Modelleri: Şans kısıtlı programlamanın kullanıldığı modellerdir. Charnes ve Stedry (Charnes & Stedry, 1966), bu yaklaşımı AR&GE projesi seçiminde ilk kez kullananlardır. Gerekli AR&GE seviyesi ile gerçekleştirilebilecek AR&GE seviyesi modelde dikkate alınmaktadır. Gerçekleştirilebilecek AR&GE seviyesi tesadüflerden etkilenmektedir. Her AR&GE aktivitesinin tamamlanması için gerekli minimum seviyeyi yakalanmalı ve yakalanan seviye gerçekleştirilebilecek AR&GE seviyesinden fazla olmamalıdır. Bulanık Matematiksel Programlama Modelleri: AR&GE projesi seçim problemlerinin girdileri “yüksek” “düşük” “orta” gibi bulanık olabilir. Bu girdiler uygun bir şekilde matematiksel modelde yer alabilirler. Weber ve arkadaşları (Weber, Werners, &

UEMK 2019 Proceedings Book
24/25 October 2019 Gaziantep University, TURKEY 617
Zimmermann, 1990) geliştirdikleri modelde hedef fonksiyonun maksimizasyonu yerine belirli bir istenilen seviyeyi aşmasını hedeflemişlerdir. Bu modelde kısıtlar da bulanık olup doğrusal modelleme ile çözülmüştür. Bilişsel Benzetim Yaklaşımları Karar Ağaçları: Karar ağacı analizleri zaman içinde gerçekleşecek, çoğunlukla belirsizlik içeren AR&GE projesi yatırım kararlarının gösteriminde kullanılır. Genellikle bir karar ağacında karar vericinin karşılaşabileceği durumlar ve alternatifler ile bu durumların gerçekleşebilme olasılıkları yer alır (Martino, 1995). Alternatiflerin dizilimi ve bu dizilimlere karşıt gelen olasılıklara göre çözümler oluşturulur. Oyun Teorisi Temelli Yaklaşımlar: Oyun teorisi temelli modeller, rakiplerin nasıl davranacağını da dikkate alarak (rasyonel davranış sergileyecekleri varsayımı ile) AR&GE kaynakları dağıtımı stratejilerinin değerlendirilmesini sağlarlar. Örneğin, patentlerde rekabet edilen bir firmanın AR&GE harcaması kalıpları incelenebilir (Grossman & Shapiro, 1985). Grup Karar Verme Teknikleri: Grup karar verme teknikleri, sistematik olarak alanında uzman olan kişilerden bilgi toplanması ve birleştirilmesine dayanır. Bu nedenle, bu teknikler, (en azından daha karmaşık modeller için uzman bilgisinin derlenmesinde) pratikte AR&GE projesi seçimi için uygun ve gerçekçi çözümler sağlarlar (Khorramshahgol vd., 1988). Delfi yöntemi, bu yöntemlerden en yaygın kullanıma sahip olanlardandır. İstatistiksel Yaklaşımlar: AR&GE proje performansını etkileyen faktörlerin
belirlenmesinde istatistiksel yöntemlerin uygulandığı yaklaşımlardır. Kümeleme analizleri, regresyon ve diskriminant analizi proje seçiminde yaygın olarak kullanılan yöntemlerdir. Diskriminant analizi, belirli proje özellikleri için kestirim değerleri sunarak, projelerin sınıflandırılmasını sağlar. Regresyon analizinde ise AR&GE performansıyla girdi değişkenler arasında ilişkiler kurulmaya çalışılır. AR&GE projesi seçiminde regresyon kullanan çalışmalara rastlamak mümkündür (Cooper, 1981; Schwartz & Vertinsky, 1977; Stahl & Harrell, 1983). Benzer özelliklere sahip AR&GE projelerinin aynı kümelerde toplanmaya çalışıldığı kümeleme yaklaşımında, kümeler için skorlama yapılarak proje seçimi yapılır (Mathieu & Gibson, 1993). Uzman Sistemler: Uzman sistemler, AR&GE müdürünün karar süreçlerinin kısmen taklit
edilerek projenin değerlendirildiği sistemlerdir (Hall & Nauda, 1990). Bir uzman sistem, bahsedilen taklit işlemini, bir bilgisayar yazılımı ara yüzü ile sağlar. Liberatore ve Stylianou (Matthew J. Liberatore & Stylianou, 1993) çalışmalarında bilgi tabanlı karar destek sistemlerinin AR&GE projelerinde yeterli karar desteği verebilecek bir yapıya sahip olup/olamayacağını araştırmak amaçlı bir uzman sistem oluşturmuştur. Uygulama deneyimi, sistemin karar desteği sağlamakta faydalı olduğunu göstermiş

UEMK 2019 Proceedings Book
24/25 October 2019 Gaziantep University, TURKEY 618
ancak ilerde daha gelişmiş çoklu uzman sistemlere ihtiyaç olduğunu işaret etmiştir (Matthew J. Liberatore & Stylianou, 1993). Karar Süreç Analizi: Karar süreç analizinin amacı genel yönetsel politikalar hakkında bilgi
edinimi ve AR&GE sürecine dâhil olan grupların hiyerarşik organizasyon yapısını yansıtmaktır. Schmidt ve Freeland (Schmidt & Freeland, 1992) çalışmalarında, AR&GE projesi seçiminde optimizasyon yaklaşımlarının organizasyonel bağlamı dikkate almadığını bu nedenle karar noktalarından karar süreçlerine doğru gerçekleşen bir yön arayışını ifade etmişlerdir. Yazarlar (Schmidt & Freeland, 1992) ayrıca, karar süreç analizlerinin bu anlamda sonuçlardan ziyade sürecin içeriğine dönük bir kavrama geliştirmeye çalıştırdığına dikkati çekmişlerdir. Benzetim ve Sezgisel Modeller
Monte Carlo benzetim çalışmaları AR&GE projelerindeki tüm rassal unsurların olasılıklarını kullanarak, hedef değerlere ve kullanılacak kaynaklara ait genel olasılığı ortaya koyarlar (Martino, 1995; Souder & Mandakovic, 1986). Versapalainen ve Lauro (Vepsalainen & Lauro, 1988) çalışmalarında, Monte Carlo benzetimini kullanarak rasyonel rakip firma stratejilerinin projeyi seçen firma üzerindeki etkilerini olasılıksal olarak incelemiştir. Sistem dinamikleri benzetimin de ise, geri besleme döngüleriyle belirli bir AR&GE sonucu ortaya çıkacak ürünle pazarda yaşanacak değişiklikler senaryo bazlı olarak incelenebilmektedir (Milling, 1996). Fox ve Baker’ın gerçekleştirdiği çalışmada (Fox & Baker, 1985) ise hipotetik bir firmanın, hipotetik bir pazardaki AR&GE süreci, sistem dinamikleri ile modellenerek politika değişiklerinin etkisi test edilmiştir. Matematiksel modellerle kıyaslandığında, sezgisel modeller genellikle en iyi olması gerekmeyen kabul edilebilir çözümleri de kabul ederler. Matematiksel modelin çok fazla değişkeni içermesi veya zorlayıcı kısıtlara sahip olması, çözüm için oldukça uzun zaman beklemeyi gerektirebilmektedir. Mandakovic ve Souder çalışmalarında, 1000 değişkenli, 400 bütçe kısıtına sahip bir AR&GE projesi seçimi problemini, Toyoda sezgiselini kullanılarak makul bir sürede çözmüş ve elde edilen çözümün de bilinen optimuma çok da uzak olmadığını göstermişlerdir (Mandakovic & Souder, 1985). Gerçek Opsiyonlar Analizleri
Gerçek (reel) opsiyonlar yaklaşımında, finansal opsiyonlar yerine, AR&GE projelerine ve daha geniş anlamda AR&GE stratejilerine uygun opsiyonlar değerlendirilir. Projenin başka bir tarihe ertelenmesi, projenin beklenenden erken ya da geç bitmesi gibi opsiyonlarda değerlendirilmeye dâhil edilir. Bu nedenle gerçek opsiyonlar yaklaşımı, işin doğasında olan belirsizlikleri ve aktif karar gerektiren stratejileri dikkate alan dinamik bir proje değerlendirme aracıdır (Luehrman, 1998).

UEMK 2019 Proceedings Book
24/25 October 2019 Gaziantep University, TURKEY 619
Kendine Has Modeller
Özel amaçlarla geliştirilmiş, yapısal olmayan modellerdir. İlgili yaklaşımlar AR&GE projesinin türüne, uygulama alanına ve sektöre uygun olarak kendine özgü bir şekilde oluşturulur. MEVCUT YAKLAŞIMLARIN DEĞERLENDİRİLMESİ
Bilimsel yazın bölümünde açıklandığı üzere AR&GE projesi değerlendirilmesinde kullanılmak üzere birçok model ve metot ortaya konulmuştur. Bu kadar çok önerilmiş
model olmasına karşın AR&GE projesi seçimi problematik olarak kalmış sadece birkaç model yaygın kabul görmüştür (Meade & Presley, 2002). Liberatore ve Titus, AR&GE projelerinin seçiminde kullanılan yöntemlerle ilgili gerçekleştirdikleri ampirik çalışmada, şirketlerin geleneksel finansal yöntemlerle diğer bazı metotları birleştirerek kullandıklarını tespit etmişlerdir (Matthew J. Liberatore & Titus, 1983). Ayrıca, proje, kaynak ve kriter çeşitliliği nedeniyle doğrusal ve tam sayılı programlamanın yaygın olarak kullanılmadığını belirtmiştirler. Bir diğer önemli tespitleri ise birçok yöneticinin, mevcut yöntemlerin karar kalitesini artırmadığına inandığı olmuştur. Benzer tespitler başkaca çalışmalarda (Bordley, 1999; Fahrni & Spätig, 1990; Lockett, Stratford, Cox, Hetherington, & Yallup, 1987) da belirtilmiştir. Baker ve Freeland (Baker & Freeland, 1975) mevcut yöntemlerdeki zayıflıkları şöyle sıralamıştır: 1) Çoklu ve birbirine bağımlı kriterlerin yetersiz değerlendirilmesi 2) Projeler arası iç ilişkilerin değer katkısı ve kaynak kullanımına göre yetersiz değerlendirilmesi 3) Risk ve belirsizliklerin yeterli olmayan bir şekilde değerlendirilmesi 4) Para dışı boyutların tanımlanması ve değerlendirilmesindeki yetersizlikler 5)AR&GE yöneticilerinin modelleri anlaşılmasını ve uygulanılmasını zor bulması yönündeki algıları Bu ve benzeri zayıflıkların önemli bir çoğunluğu yeni çalışmalarda da tam anlamıyla çözümlenememiş ve alternatif yöntemlerin geliştirilmesi için araştırmalar yapılması gereğini doğurmuştur. Bir sonraki bölümde, önerilen kavramsal model ile ortaya konulmaya çalışılan yaklaşım bu problemleri çözmede nasıl katkılar sağlayabileceği tartışılmıştır. KAVRAMSAL MODEL
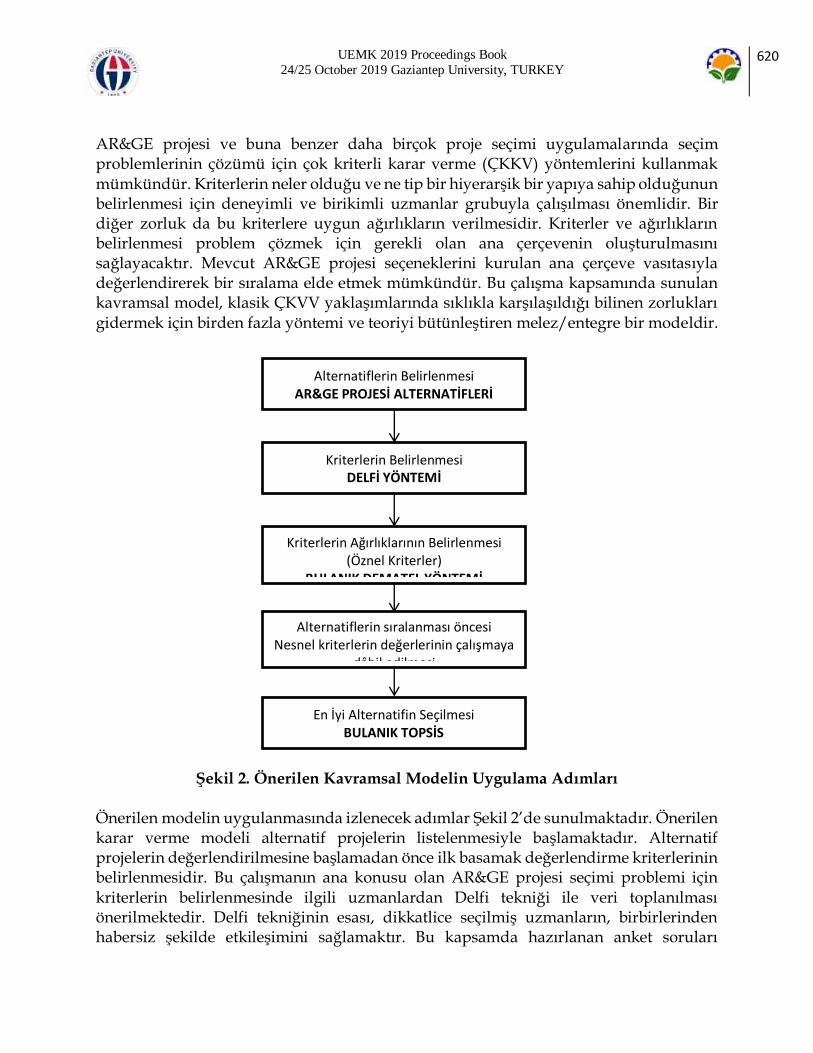
UEMK 2019 Proceedings Book
24/25 October 2019 Gaziantep University, TURKEY 620
AR&GE projesi ve buna benzer daha birçok proje seçimi uygulamalarında seçim problemlerinin çözümü için çok kriterli karar verme (ÇKKV) yöntemlerini kullanmak mümkündür. Kriterlerin neler olduğu ve ne tip bir hiyerarşik bir yapıya sahip olduğunun belirlenmesi için deneyimli ve birikimli uzmanlar grubuyla çalışılması önemlidir. Bir diğer zorluk da bu kriterlere uygun ağırlıkların verilmesidir. Kriterler ve ağırlıkların belirlenmesi problem çözmek için gerekli olan ana çerçevenin oluşturulmasını sağlayacaktır. Mevcut AR&GE projesi seçeneklerini kurulan ana çerçeve vasıtasıyla değerlendirerek bir sıralama elde etmek mümkündür. Bu çalışma kapsamında sunulan kavramsal model, klasik ÇKVV yaklaşımlarında sıklıkla karşılaşıldığı bilinen zorlukları gidermek için birden fazla yöntemi ve teoriyi bütünleştiren melez/entegre bir modeldir.
Şekil 2. Önerilen Kavramsal Modelin Uygulama Adımları
Önerilen modelin uygulanmasında izlenecek adımlar Şekil 2’de sunulmaktadır. Önerilen karar verme modeli alternatif projelerin listelenmesiyle başlamaktadır. Alternatif projelerin değerlendirilmesine başlamadan önce ilk basamak değerlendirme kriterlerinin belirlenmesidir. Bu çalışmanın ana konusu olan AR&GE projesi seçimi problemi için kriterlerin belirlenmesinde ilgili uzmanlardan Delfi tekniği ile veri toplanılması önerilmektedir. Delfi tekniğinin esası, dikkatlice seçilmiş uzmanların, birbirlerinden habersiz şekilde etkileşimini sağlamaktır. Bu kapsamda hazırlanan anket soruları
Alternatiflerin Belirlenmesi AR&GE PROJESİ ALTERNATİFLERİ
Kriterlerin Belirlenmesi DELFİ YÖNTEMİ
Alternatiflerin sıralanması öncesi Nesnel kriterlerin değerlerinin çalışmaya
dâhil edilmesi
En İyi Alternatifin Seçilmesi BULANIK TOPSİS
Kriterlerin Ağırlıklarının Belirlenmesi (Öznel Kriterler)
BULANIK DEMATEL YÖNTEMİ
UEMK 2019 Proceedings Book
24/25 October 2019 Gaziantep University, TURKEY 621
uzmanlara iletilerek ortak görüşler derlenmeye çalışılmalı ve izleyen turlarda ise tartışmalı hususlarda netliğin sağlanması amaçlı toplantılar düzenlenmelidir. Bu modelde ayrıca hiçbir öznel değerlendirmeye tabii tutulması ihtiyacı duyulmayan maliyet, kapasite vb kriterler daha sonra kullanılmak üzere bir kenarda tutulmaktadır. Burada amaçlanan maliyet gibi parasal bir unsurun, AR&GE konusunun “yenilik içermesi kriteri” gibi öznel bir ölçeklendirmeyle birlikte ele alınmasını önlemektir. Ayrıca, maliyetin doğrudan kriter olarak değerlendirildiği ÇKKV modellerinde, maliyet genelde karardaki en büyük kriter ağırlığına sahip olmakta ve maliyet üzerine bir karar inşa edilmektedir. Oysaki AR&GE projelerinde kesinlik kazanmamış ve tam olarak öngörülemeyen bir kazanç söz konusudur. Bu kazancın büyüklüğü maliyetten çok daha büyük olabilir. Modeli iki ayrı aşamada ele alarak projelerin oluşturacakları muhtemel faydaları maliyete ezdirmemektir. Bu kavramsal modelde, ilk olarak kriterlerin ağırlıklarının belirlenmesinde bulanık DEMATEL yöntemi, daha sonra ise alternatiflerin sıralanması için bulanık TOPSİS yöntemi kullanılacaktır. ÇKKV problemlerinde, bulanık kavramların/sözel ölçütlerin sıklıkla veri olarak yer alması, reel değerlerle analiz yapılmasını ve gerçeğin olduğu gibi modellenmesini zorlaştırdığından (Chen, 2000), analizlerde bulanık yöntemler kullanılacaktır. Kriterlerin birbiriyle etkileşimi ve hiyerarşik yapısının tespitinde
kullanılacak olan DEMATEL yöntemi karmaşık ilişkilerin yapısının görselleştirilmesi amacıyla geliştirilmiş bir yöntemdir (Büyüközkan & Çifçi, 2012). DEMATEL yönteminde kriterler “sebep” ve “etki” kriterleri olarak iki gruba ayrılırlar. Sebep kriterlerinin etki grubu üzerindeki gücü kriter ağırlıklarının belirlenmesinde kullanılmaktadır (Baykasoğlu, Kaplanoğlu, Durmuşoğlu, & Şahin, 2013). Hwang and Yoon (1981) tarafından geliştirilen TOPSİS yöntemi ise bu kavramsal model kapsamında, seçeneklerin ideal pozitif ve ideal negatif çözüme olan mesafelerine göre sıralanmasında kullanılacaktır. TOPSİS yönteminin en önemli avantajı, kriter ağırlıklarının belirlenmesi gibi önemli hususta daha az uzman görüşüne ihtiyaç kalmasını sağlamasıdır (Gupta & Barua, 2018). Öznel değerlendirmeler gerektiren tüm değerlendirmeler DEMATEL modelinde hesaplanarak alternatifler için toplam fayda skoru belirlenmektedir. Elde edilen toplam fayda skoru ile toplam maliyet ve diğer teknik özellikler gibi nesnel veriler ise daha sonra normalize edilerek TOPSİS yöntemine dâhil edilmekte ve alternatifler öznel ve nesnel veriler ışığında sıralanmaktadır. SONUÇ
AR&GE projesi seçim problemi, özellikle gelişmekte olan ülkeler için kritik öneme sahip bir problemdir. Kısıtlı kaynakların ülkelerin refahını artıracak şekilde doğru projelere tahsisi elzem niteliktedir. Özellikle kamu destekli projelerde seçimin hangi analitik

UEMK 2019 Proceedings Book
24/25 October 2019 Gaziantep University, TURKEY 622
yöntemlerle yapıldığı, kriterlerin ve ağırlıklarının neler olduğu kamu şeffaflığının ve kaynakların doğru kullanıldığının ispatı olarak toplumla paylaşılmalıdır. Bu kapsamda doğru kararın verilmesi için kullanılacak olan yöntem analitik temelleri olan ancak oldukça fazla sayıda öngörüyü de kapsayacak (başarı/başarısızlık; kazanç beklentisi vb) bir model olmak durumundadır. Bu çalışmada öznel ve nesnel değerlendirmeleri öncelikle ayrı değerlendiren daha sonra ise birlikte ele alınmasını sağlayan analitik melez bir yöntem önerilmiştir. DEMATEL metodu ile öznel değerlendirme gerektiren kriterlerin ağırlıkları belirlenmekte ve kriterlerin önem dereceleri sıralanmaktadır. Nesnel veriler analizin ilk kısmında dikkate alınmamakta, pozitif ideal çözüm ve negatif ideal çözümlerin TOPSİS yöntemiyle hesaplanması sırasında devreye sokulmaktadır. Nesnel ile öznel kriterlerin ilk aşamada birbiriyle kıyaslanmasının farklı ölçeklere sahip olmaları sebebiyle adaletsiz olacağı düşünülmektedir. Bu çalışmada kavramsal olarak sunulan modelin başarımı hiç şüphesiz çalışmada yer verilecek uzmanların tecrübeleri ve bilgi birikimiyle yakından ilintilidir. Bu nedenle “doğru uzmanları” bulma hususunda özenle durulmalıdır. Gelecek çalışmalarda, burada sunulan kavramsal modelin somut ve gerçek bir modele çevrilmesi ve test edilmesi mümkündür. KAYNAKLAR
Amer, M., & Daim, T. U. (2011). Selection of renewable energy technologies for a developing county: A case of Pakistan. Energy for Sustainable Development, 15(4), 420-435. https://doi.org/10.1016/j.esd.2011.09.001 Asher, D. T. (1962). A Linear Programming Model for the Allocation of R and D Efforts. IRE Transactions on Engineering Management, EM-9(4), 154-157.
https://doi.org/10.1109/IRET-EM.1962.5007697 Baker, N., & Freeland, J. (1975). Recent Advances in R&D Benefit Measurement and Project Selection Methods. Management Science, 21(10), 1164-1175. https://doi.org/10.1287/mnsc.21.10.1164 Baykasoğlu, A., Kaplanoğlu, V., Durmuşoğlu, Z. D. U., & Şahin, C. (2013). Integrating fuzzy DEMATEL and fuzzy hierarchical TOPSIS methods for truck selection. Expert Systems with Applications, 40(3), 899-907. https://doi.org/10.1016/j.eswa.2012.05.046 Blanning, R. W. (1981). Variable-Base Budgeting for R&D. Management Science, 27(5), 547-558. https://doi.org/10.1287/mnsc.27.5.547 Bordley, R. F. (1999). Keeping It Sophisticatedly Simple in R&d Project Management. The Engineering Economist, 44(2), 168-183. https://doi.org/10.1080/00137919908967515
Büyüközkan, G., & Çifçi, G. (2012). A novel hybrid MCDM approach based on fuzzy DEMATEL, fuzzy ANP and fuzzy TOPSIS to evaluate green suppliers. Expert Systems
with Applications, 39(3), 3000-3011. https://doi.org/10.1016/j.eswa.2011.08.162 Charnes, A., & Stedry, A. C. (1966). A Chance-Constrained Model for Real-Time Control in Research and Development Management. Management Science, 12(8), B-353. https://doi.org/10.1287/mnsc.12.8.B353

UEMK 2019 Proceedings Book
24/25 October 2019 Gaziantep University, TURKEY 623
Chen, C.-T. (2000). Extensions of the TOPSIS for group decision-making under fuzzy environment. Fuzzy Sets and Systems, 114(1), 1-9. https://doi.org/10.1016/S0165-
0114(97)00377-1 Cooper, R. G. (1981). An empirically derived new product project selection model. IEEE
Transactions on Engineering Management, EM-28(3), 54-61. https://doi.org/10.1109/TEM.1981.6448587 Fahrni, P., & Spätig, M. (1990). An application-oriented guide to R&D project selection and evaluation methods. R&D Management, 20(2), 155-171.
https://doi.org/10.1111/j.1467-9310.1990.tb00693.x Fox, G. E., & Baker, N. R. (1985). Project Selection Decision Making Linked to a Dynamic Environment. Management Science, 31(10), 1272-1285.
https://doi.org/10.1287/mnsc.31.10.1272 Grossman, G. M., & Shapiro, C. (1985). Dynamic R&D Competition (Working Paper Sy
1674). https://doi.org/10.3386/w1674 Gupta, H., & Barua, M. K. (2018). A framework to overcome barriers to green innovation in SMEs using BWM and Fuzzy TOPSIS. Science of The Total Environment, 633, 122-139. https://doi.org/10.1016/j.scitotenv.2018.03.173 Hall, D. L., & Nauda, A. (1990). An interactive approach for selecting IR&D projects. IEEE Transactions on Engineering Management, 37(2), 126-133.
https://doi.org/10.1109/17.53715 Hwang, C. L., & Yoon, K. (1981). Multiple attributes decision making methods and applications. Springer Berlin. Iskin, I., Daim, T., Kayakutlu, G., & Altuntas, M. (2012). Exploring renewable energy pricing with analytic network process—Comparing a developed and a developing economy. Energy Economics, 34(4), 882-891. https://doi.org/10.1016/j.eneco.2012.04.005
Karasakal, E., & Aker, P. (2017). A multicriteria sorting approach based on data envelopment analysis for R&D project selection problem. Omega, 73, 79-92. https://doi.org/10.1016/j.omega.2016.12.006 Khorramshahgol, R., Azani, H., & Gousty, Y. (1988). An integrated approach to project evaluation and selection. IEEE Transactions on Engineering Management, 35(4), 265-270.
https://doi.org/10.1109/17.7449 Kocaoglu, D. F. (Ed.). (1992). Management of R&D and engineering. Amsterdam ; New York: North-Holland. Liberatore, M. J. (1987). An extension of the analytic hierarchy process for industrial R amp;D project selection and resource allocation. IEEE Transactions on Engineering Management, EM-34(1), 12-18. https://doi.org/10.1109/TEM.1987.6498854
Liberatore, Matthew J., & Stylianou, A. C. (1993). The Development Manager’s Advisory System: A Knowledge-Based DSS Tool for Project Assessment*. Decision Sciences, 24(5), 953-976. https://doi.org/10.1111/j.1540-5915.1993.tb00498.x Liberatore, Matthew J., & Titus, G. J. (1983). The Practice of Management Science in R&D Project Management. Management Science, 29(8), 962-974.
https://doi.org/10.1287/mnsc.29.8.962

UEMK 2019 Proceedings Book
24/25 October 2019 Gaziantep University, TURKEY 624
Lockett, G., Hetherington, B., Yallup, P., Stratford, M., & Cox, B. (1986). Modelling a Research Portfolio Using AHP: A Group Decision Process. R&D Management, 16(2), 151-
160. https://doi.org/10.1111/j.1467-9310.1986.tb01168.x Lockett, G., Stratford, M., Cox, B., Hetherington, B., & Yallup, P. (1987). Modelling a research portfolio using AHP — a group decision process. Mathematical Modelling, 8, 142-148. https://doi.org/10.1016/0270-0255(87)90558-6 Luehrman, T. A. (1998). Investment Opportunities as Real Options: Getting Started on the Numbers. Harvard Business Review, 76. Geliş tarihi gönderen
https://hbr.org/1998/07/investment-opportunities-as-real-options-getting-started-on-the-numbers Mandakovic, T., & Souder, W. E. (1985). An Interactive Decomposable Heuristic for Project Selection. Management Science, 31(10), 1257-1271. https://doi.org/10.1287/mnsc.31.10.1257 Martino, J. P. (1995). Research and Development Project Selection. Wiley. Mathieu, R. G., & Gibson, J. E. (1993). A methodology for large-scale R&D planning based on cluster analysis. IEEE Transactions on Engineering Management, 40(3), 283-292. https://doi.org/10.1109/17.233190 Meade, L. M., & Presley, A. (2002). R&D project selection using the analytic network process. IEEE Transactions on Engineering Management, 49(1), 59-66.
https://doi.org/10.1109/17.985748 Milling, P. M. (1996). Modeling innovation processes for decision support and management simulation. System Dynamics Review, 12(3), 211-234. https://doi.org/10.1002/(SICI)1099-1727(199623)12:3<211::AID-SDR105>3.0.CO;2-8 Milosevic, D. Z. (2003). Project Management ToolBox: Tools and Techniques for the Practicing Project Manager (1 edition). Hoboken, N.J: Wiley. Paolini, A., & Glaser, M. A. (1977). Project Selection Methods that Pick Winners. Research
Management, 20(3), 26-29. Pound, W. H. (1964). Research project selection: Testing a model in the field. IEEE Transactions on Engineering Management, EM-11(1), 16-22. https://doi.org/10.1109/TEM.1964.6446389 Schmidt, R. L., & Freeland, J. R. (1992). Recent progress in modeling R&D project-selection processes. IEEE Transactions on Engineering Management, 39(2), 189-201. https://doi.org/10.1109/17.141276 Schwartz, S. L., & Vertinsky, I. (1977). Multi-Attribute Investment Decisions: A Study of R&D Project Selection. Management Science, 24(3), 285-301. https://doi.org/10.1287/mnsc.24.3.285 Souder, W. E., & Mandakovic, T. (1986). R&D Project Selection Models. Research Management, 29(4), 36-42. https://doi.org/10.1080/00345334.1986.11756981 Stahl, M. J., & Harrell, A. M. (1983). Identifying operative goals by modeling project selection decisions in research and development. IEEE Transactions on Engineering Management, EM-30(4), 223-228. https://doi.org/10.1109/TEM.1983.6448624

UEMK 2019 Proceedings Book
24/25 October 2019 Gaziantep University, TURKEY 625
Suh, C.-K., Suh, E.-H., & Baek, K.-C. (1994). Prioritizing telecommunications technologies for long-range R&D planning to the year 2006. IEEE Transactions on Engineering Management, 41(3), 264-275. https://doi.org/10.1109/17.310141 Unutmaz Durmuşoğlu, Z. D. (2018). Assessment of techno-entrepreneurship projects by using Analytical Hierarchy Process (AHP). Technology in Society, 54, 41-46. https://doi.org/10.1016/j.techsoc.2018.02.001 Vepsalainen, A. P. J., & Lauro, G. L. (1988). Analysis of R&D portfolio strategies for contract competition. IEEE Transactions on Engineering Management, 35(3), 181-186.
https://doi.org/10.1109/17.7438 Wang, B., Kocaoglu, D. F., Daim, T. U., & Yang, J. (2010). A decision model for energy resource selection in China. Energy Policy, 38(11), 7130-7141.
https://doi.org/10.1016/j.enpol.2010.07.031 Weber, R., Werners, B., & Zimmermann, H.-J. (1990). Planning models for research and development. European Journal of Operational Research, 48(2), 175-188. https://doi.org/10.1016/0377-2217(90)90372-I Winkofsky, E. P., Baker, N. R., & Sweeney, D. J. (1981). A Decision Process Model of R&D Resource Allocation in Hierarchical Organizations. Management Science, 27(3), 268-283.

UEMK 2019 Proceedings Book
24/25 October 2019 Gaziantep University, TURKEY 626
HYBRID MULTI-LEVEL INVERTER BASED PHOTOVOLTAIC APPLICATION.
Omar AL-BASRI Department of Electric and Electronic Engineering, Gaziantep University, Gaziantep 27310, Turkey, [email protected] Ergun ERÇELEBİ Department of Electric and Electronic Engineering, Gaziantep University, Gaziantep 27310, Turkey, [email protected]
ABSTRACT: Multi-level inverter performance is high when compared to conventional two-level inverter. This due to their reduced harmonics distortion , less electromagnetic
interference ,reduced common mode voltage and higher dc link voltages .yet the main drawbacks of multi-level inverter are complex pulses with modulations control , balancing of capacitor voltages and increased number of switches .The study and simulation of three phase nine level inverter using only twelve switches and feed by photovoltaic panels is focused here in this paper . This paper also present control technique for nine level inverter topology. Key words: Cascade multilevel inverter, Photovoltaic, Buck – boost dc to dc converter, Perturb and observe maximum power point method. INTRODUCTION Resent research studues have witnessed a huge increasing interest to multi-level power conversion.These researchers involve the introduction of new inverter topologies and unique modulation teqniques .But the most widly used of multi level inverter topologies are multi-cell inverter [1],diode clamped inverter[8]-[5] and flying capacitor inverter [6].Some of the applications included for these inverters are industrial drives flexable ac transmission system[7],traction applications in the transport industrry and grid integration of non-conventional energy sources. Becouse of the values of all voltage sources are the same ,the nine level twelive switches topology is a symetrical topology however there are several asymetrical topologies that need voltage sources of different values.The results of this asymmetry have aspicific
relations between them concerning the need of dc voltages and also the difference in the rating of the semiconductor switches . This paper presents study and simulation of nine level new multi level inverter topology named by the reversing voltage (RV) . This topology differs from conventional topologies becouse it requre less number of component ,not only this it is more efficient since the inverter operate at line frequency

UEMK 2019 Proceedings Book
24/25 October 2019 Gaziantep University, TURKEY 627
.As result there is no need for all frequency to work in high frequency. This leads to simpler and reliable control of the inverter .In this paper the dc source will represented by solar panals instead of conventional sourses so this paper will handeled also Interview of photovoltaic system and their maximum power point Algorithm and components. In section I, introduction to multi-level inverter is discussed. In section II, we discussed the nine level multilevel inverter. In section III, Interview of photovoltaic system. Our proposed inverter results is discussed in section IV whereas conclusions are drawn in section VI. INTERVIEW OF NINE LEVEL-TWELVE SWITCH INVERTER
There are two seperated parts as an output voltage in this hybirid multi-level inverter .The first part is named “level generator “whitch is responsible for level generation in positive polarity .To produce required levels , high-frequency switches are required in this part . The other part is named “polarity generation“ whitch is responsible for generating the polarity of the output voltage .polarity generator operates at line frequency . In order to produce the multi-level voltage output ,this topology mergs the two parts (low frequency and high frequency) . The positive levels are generated by the level generator (high frequency part )to generate a complete multilevel output . this part is then feed to apolaity genrator ( full bridge inverter )and this will generate the required polarity for the output. Accordingly, this process will reduce the number of the semiconductor switches whitch responsible to generate the output voltage levels in negative and positive polarities . In figure one shown below the proposed nine level twilve switches is shown at the left of this figure the level generator is lockated whitch consists of eight switches and four dc sources that we will repalce them with solar panal sources while in the right side of the figure the polarity generator occupied its place whitch consists of conventioal h bidge unit the out put of level generator will be the input to polarity generator ,more over there is no need of using isolation component between the polarity and level part .

UEMK 2019 Proceedings Book
24/25 October 2019 Gaziantep University, TURKEY 628
Figure 1. Nine Level Twelve Switch Inverter
Five possible switching states to control the inverter . The level generator produces the required output possitive voltage levels as follows : 1- Zero output level :Switches S2,S4,S6,S8 are ON with short circuit the input of the polarity generator .Results in the generation of zero voltage. 2- Vdc output level: Switches S2,S4,S6,S7 are ON with all other high frequency swithches are off results in generation of Vdc voltage level. 3- Two Vdc output level: Switches S2,S4,S5 are ON with all other high frequency swithches are off results in generation of two Vdc voltage level. 4- Three Vdc output level: Switches S2,S3 are ON with all other high frequency swithches are off results in generation of three Vdc voltage level. 5- Four Vdc output level: Switches S1 are ON with all other high frequency swithches are off results in generation of fourVdc voltage level. The modulation teqnique whitch is used to generate nine level output is based on sinisodal pulse with modulation method(spwm) . In this teqnique the reference signals have the same amplitude and the same frequency to line frequency . They are in phase with each other with an offset equal to the value of the magnitude of the carrier signal. These references signals will be compared with the carrier signal to produce pulses required for the switches of the inverter circuit figure 2 shows the refereces signal with the carrier signal . The ratio of the amplitude of the reference signal to the amplitude of carrier signal defined as the modulation index for inverter .

UEMK 2019 Proceedings Book
24/25 October 2019 Gaziantep University, TURKEY 629
Figure 2. Modulation Method
Figure 3. Gate Pulses for Level Genration Switches INTERVIEW OF PHOTOVOLTAIC SYSTEM
In general, solar cells generate potential from solar energy through photovoltaic modules made up of silicon cells. And since the output of these cells is always very low, a photovoltaic array is formed to increase the potential total output. An array can consist
of solar cells connected in series or in parallel to increase the voltage or current generated by the module. The array is positioned to provide maximum output power at a specific point. This is called the maximum power point depending on the load, temperature and illumination. According to this characteristic, the photovoltaic module cannot operate at the maximum power point due to external effects, so one of the maximum power point tracking algorithms is used. The operating point should be close to the maximum power point area that should be used with the DC-DC converter to maintain the panel [4]. These

UEMK 2019 Proceedings Book
24/25 October 2019 Gaziantep University, TURKEY 630
techniques include the constant voltage MPPT algorithm, the perturbation and observation (P & O) MPPT algorithm, and the incremental conductance (INC) MPPT algorithm [8]. The cuk converter combined with buck-boost, mppt algorithm is the construction of the maximum power point tracking and solar charge controller [7] to ensure that the module runs in it. This article uses the following components: 1-buck-boost dc-dc converter 2-perturb and observe algorithm Buck –Boost Dc-Dc Converter
Typically, a DC-DC converter is an electronic circuit that can generate various levels of DC voltage and uses many conversion processes such as mode, linearity, and magnetism [7]. Some of the most well-known topologies are step-down, step-up, and buck-boost converters for buck converters whose output voltage is lower than the input voltage. On the other hand, in the boost converter, the output voltage is used larger than the input voltage. As is clear from the title of this converter, the buck-boost type can operate in the buck mode and boost mode. As mentioned earlier, this type of converter and (mppt) algorithm will be used to implement the If the current in the converter does not go to zero, this converter can be put into a continuous conduction mode (ccm) of two operating modes, and once the converter current reaches the zero region of the converter current, the other operating modes are , Called discontinuous operation mode (dcm) during the period, different from all formula models
In this article, using continuous conduction mode (ccm), the output voltage is calculated as: vo= vi * D/( 1-D) (1) While in discontinuous conduction mode (dcm)the output vol tage is calculated as: vo=vi D^2/2Io (2) Where D is the duty ratio which will fed to the controlling switch and vo in both modes n average values is the current through the load. In continuous conduction mode (ccm) when D > 0.5 it will operate in buck mode while when D< 0.5 it will be in boost mode. In fig. it shows the diagram of the buck boost converter

UEMK 2019 Proceedings Book
24/25 October 2019 Gaziantep University, TURKEY 631
Figure 4. Buck Boost DC-DC Converter
inductor, and the current path passes through the diode (D) and capacitor (C).
Because this article uses a buck-boost DC-DC converter, there are several reasons for choosing a buck-boost converter model for this task. • Ability to run buck mode and boost mode • Easy design • Reduce costs • Reduce power loss • Fewer components required One feature of this type of converters is the output of this converter has the opposite polarity with respect to it is input. Perturb And Observe Maximum Power Point Tracking Algorithm (P&O Mppt)
Solar cells are considered the most advertised source of renewable energy because of their availability and the positive impact of this energy on the environment. This solar energy affected by weather conditions, such as temperature, irradiance, shading etc. Many techniques, such as Constant Voltage MPPT, perturbation and observation Algorithm and Incremental conductance (INC) MPPT algorithm, etc are used to solve this problem and ensure that the PV module operates at or near its maximum point figure 5 show the (iv) characteristic of pv cell and its maximum power point (mpp) location. This work will be simple and fair based on the use of perturbation and observation methods. Figure 6 shows the flowchart for this technique. The symbol of the last increment and the power of one step are used to determine the next decision. Increasing the voltage on the left side of the MPP increases power, and decreasing the voltage on the right-side increases power.
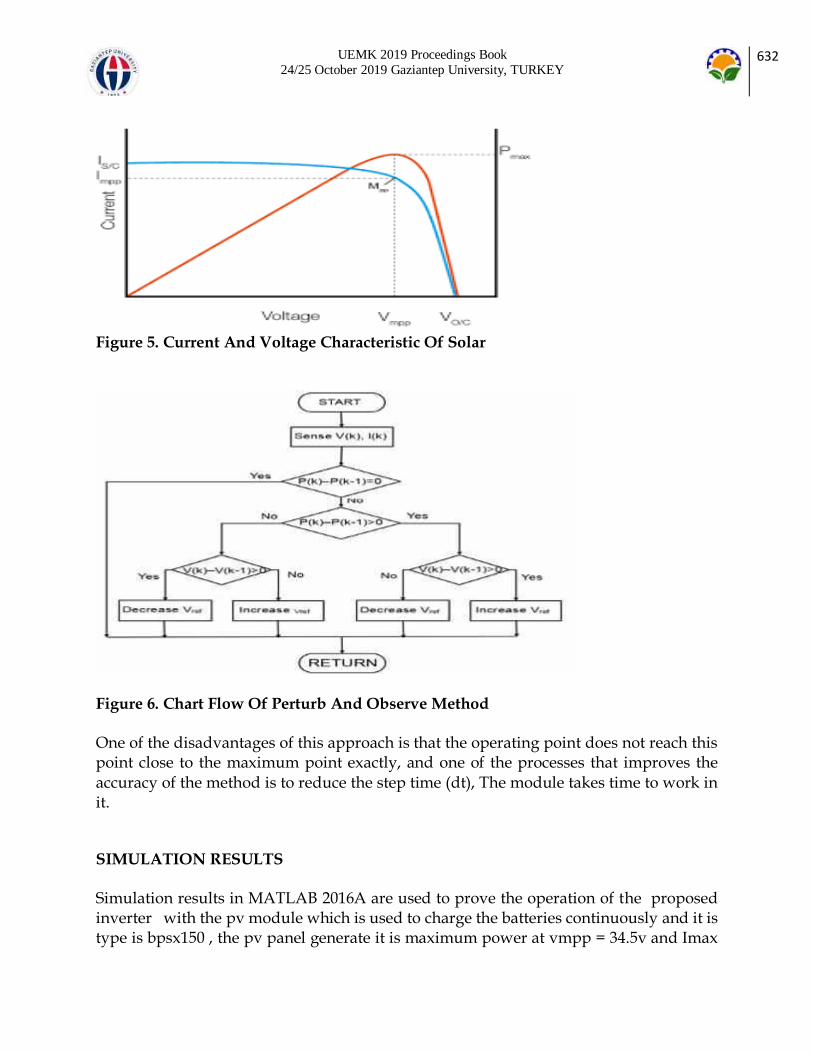
UEMK 2019 Proceedings Book
24/25 October 2019 Gaziantep University, TURKEY 632
Figure 5. Current And Voltage Characteristic Of Solar
Figure 6. Chart Flow Of Perturb And Observe Method
One of the disadvantages of this approach is that the operating point does not reach this point close to the maximum point exactly, and one of the processes that improves the accuracy of the method is to reduce the step time (dt), The module takes time to work in it.
SIMULATION RESULTS
Simulation results in MATLAB 2016A are used to prove the operation of the proposed inverter with the pv module which is used to charge the batteries continuously and it is type is bpsx150 , the pv panel generate it is maximum power at vmpp = 34.5v and Imax

UEMK 2019 Proceedings Book
24/25 October 2019 Gaziantep University, TURKEY 633
= 4.35 A .so due to the symmetric the all pv panels should give the same voltages,e.g 54 volt will be the voltage of of each pv module in results the dc to dc converter will operate in boost d <0.5 in figure it shows the duty cycle of the pv module.
Figure 7. Duty Cycle of Buck Boost Converter
The voltage of the batteries is shown in figure (8) shown below:
Figure 8. Battery Output Voltage
Figures (9) show the final output waveform (nine levels)

UEMK 2019 Proceedings Book
24/25 October 2019 Gaziantep University, TURKEY 634
Figure 9. Three Phase Output Of Nine Level Output Voltage CONCLUSION
In this work an improvement in the cascade inverter is done this improvement includes two points: the first is related to the number of the output levels witch increased by using minimum number of dc sources and semiconductor switches and the second concern with the amount of power which drawn from each DC source is equalized .this inverter
is working perfectly with direct connect batteries and pave panels as shown in the simulation result shows the performance of the proposed inverter.
REFERENCES
[1] Adam, G. P., & Williams, B. W. (2014). New emerging voltage source converter for high-voltage application: hybrid multilevel converter with dc side H-bridge chain links. IET Generation, Transmission & Distribution, 8(4), 765-773. doi:10.1049/iet-gtd.2013.0076 [2] Agelidis, V., Baker, D., Lawrance, W., & Nayar, C. (n.d.). A multilevel PWM inverter topology for photovoltaic applications. ISIE '97 Proceeding of the IEEE International Symposium on Industrial Electronics. doi:10.1109/isie.1997.649027 [3] Babaei, E. (2011). Charge Balance Control Methods for a Class of Fundamental Frequency Modulated Asymmetric Cascaded Multilevel Inverters. Journal of Power Electronics, 11(6), 811-818. doi:10.6113/jpe.2011.11.6.811
UEMK 2019 Proceedings Book
24/25 October 2019 Gaziantep University, TURKEY 635
[4] Bahravar, S., Babaei, E., & Hosseini, S. H. (2012). New cascaded multilevel inverter topology with reduced variety of magnitudes of dc voltage sources. 2012 IEEE 5th India International Conference on Power Electronics (IICPE). doi:10.1109/iicpe.2012.6450408 [5] Calais, M., Borle, L., & Agelidis, V. (n.d.). Analysis of multicarrier PWM methods for a single-phase five level inverter. 2001 IEEE 32nd Annual Power Electronics Specialists Conference (IEEE Cat. No..01CH37230). doi:10.1109/pesc.2001.954308 [6] Cintron-Rivera, J. G., Li, Y., Jiang, S., & Peng, F. Z. (2011). Quasi-Z-Source inverter with energy storage for Photovoltaic power generation systems. 2011 Twenty-Sixth Annual IEEE Applied Power Electronics Conference and Exposition (APEC). doi:10.1109/apec.2011.5744628 [7] Ding, K., Cheng, K., & Zou, Y. (2012). Analysis of an asymmetric modulation method for cascaded multilevel inverters. IET Power Electronics, 5(1), 74. doi:10.1049/iet-pel.2010.0370 [8] Farokhnia, N., Fathi, S., Yousefpoor, N., & Bakhshizadeh, M. (2012). Minimisation of total harmonic distortion in a cascaded multilevel inverter by regulating voltages of DC sources. IET Power Electronics, 5(1), 106. doi:10.1049/iet-pel.2011.0092 [9] Hossain, M. K., & Ali, M. H. (2014). Low voltage ride through capability enhancement of grid connected PV system by SDBR. 2014 IEEE PES T&D Conference and Exposition. doi:10.1109/tdc.2014.6863248
[10] Kouro, S., Leon, J. I., Vinnikov, D., & Franquelo, L. G. (2015). Grid-Connected Photovoltaic Systems: An Overview of Recent Research and Emerging PV Converter TechNo.logy. IEEE Industrial Electronics Magazine, 9(1), 47-61. doi:10.1109/mie.2014.2376976 [11] Linus, R. M., & Damodharan, P. (2015). Maximum power point tracking method using a modified perturb and observe algorithm for grid connected wind energy conversion systems. IET Renewable Power Generation, 9(6), 682-689. doi:10.1049/iet-
rpg.2014.0070 [12] Manjrekar, M., & Lipo, T. (n.d.). A hybrid multilevel inverter topology for drive applications. APEC '98 Thirteenth Annual Applied Power Electronics Conference and Exposition. doi:10.1109/apec.1998.653825
[13] Osborn, D. (2013). Wind Power Grid Integration wind power grid integration : Transmission Planning wind power grid integration transmission planning. Renewable Energy Systems, 1740-1768. doi:10.1007/978-1-4614-5820-3_90 [14] Sung-Jun Park, Feel-Soon Kang, Man Hyung Lee, & Kim, C. (2003). A new single-phase five-level PWM inverter employing a deadbeat control scheme. IEEE Transactions on Power Electronics, 18(3), 831-843. doi:10.1109/tpel.2003.810837
[15] Rao, S. N., Kumar, D. V., & Babu, C. S. (2013). New multilevel inverter topology with reduced number of switches using advanced modulation strategies. 2013 International Conference on Power, Energy and Control (ICPEC). doi:10.1109/icpec.2013.6527745 [16] Syed Abdul Moiz, M. (2019). Study and Simulation of Seven Level - Ten Switch Inverter Topology. International Journal Of Research, VIII(2236-6124), 778-803.

UEMK 2019 Proceedings Book
24/25 October 2019 Gaziantep University, TURKEY 636
[17] Thilaga, S., & Kumar, S. (2013). Simulation and Analysis of Seven Switch Nine-Level Hybrid Cascaded Inverter for Fuel Cell Applications. Applied Mechanics And Materials, 367, 199-203. doi: 10.4028/www.scientific.net/amm.367.199.
UEMK 2019 Proceedings Book
24/25 October 2019 Gaziantep University, TURKEY 637
DESIGN OF AN EXPERIMENTAL SETUP FOR DETERMINING FRICTION PARAMETERS OF LINEAR PNEUMATIC CYLINDERS
Mustafa DAĞDELEN Çukurova University, Mechanical Engineering Department [email protected]
Mehmet İlteriş SARIGEÇİLİ Çukurova University, Mechanical Engineering Department [email protected]
ABSTRACT: The friction resistance characteristics should be identified clearly to ensure precise control of linear pneumatic cylinders. There are many friction models [Tran et al. (2015); Schroeder and Singh (1993); Liu et al. (2011); Kosari and Moosavian (2015); Belforte et al. (2003)] developed for pneumatic cylinders available in the literature. In this study, an experimental setup designed to determine the parameters of the Static-Coulomb-Stribeck-Viscous friction model [Kosari and Moosavian (2015)] for a given pneumatic cylinder will be presented. In the experimental setup, there is a compressor for driving piston rod, a pressure regulating valve for adjusting the pressure and two speed control valves for controlling the speed of piston rod. For controlling the direction of motion of piston rod, a control card is utilized where a solenoid valve, two-way relay card as well as control buttons are connected to this card. While the net force acting on the piston rod can be calculated with the pressure sensors connected to the inlet and outlet ports, the linear potentiometer connected to the piston rod can provide instant position information of the piston rod and thus speed and acceleration information. The desired friction parameters can easily be found from the experiments by transferring the data to the computer via the control card. Key words: Pneumatic cylinder, friction model, parameter estimation, experimental setup
Acknowledgement: This project is funded by “ÖYP Coordination” in Çukurova University. REFERENCES
Tran, X., Dao, H., & Tran, K. (2015). A new mathematical model of friction for pneumatic cylinders. Proceedings of the Institution of Mechanical Engineers, Part C: Journal of Mechanical Engineering Science, 230(14), 2399-2412. doi:10.1177/0954406215594828.

UEMK 2019 Proceedings Book
24/25 October 2019 Gaziantep University, TURKEY 638
Schroeder, L. E., & Singh, R. (1993). Experimental Study of Friction in a Pneumatic Actuator at Constant Velocity. Journal of Dynamic Systems, Measurement, and Control, 115(3), 575. doi:10.1115/1.2899143. Liu, H., Chen, J., Tao,G. (2011).Parameter identification and analysis of pneumatic cylinders friction model based on experiments. Proceedings of the 8th JFPS International Symposium on Fluid Power,pp.276-284, 25-28 Oct., OKINAWA. Kosari, H., Moosavian, S.A.A., 2015. Friction Compensation in a Pneumatic Actuator Using Recursive Least Square Algorithm. 5th Australian Control Conference (AUCC), 5th-
6th Nov., Gold Coast, Australia, pp. 81-86. Belforte, G., Mattiazzo, G., Mauro, S., & Tokashiki, L. R. (2003). Measurement of friction force in pneumatic cylinders. Tribotest, 10(1), 33-48. doi:10.1002/tt.3020100104.

UEMK 2019 Proceedings Book
24/25 October 2019 Gaziantep University, TURKEY 639
EFFECT OF HEAT TREATMENT PROCESS ON PHASE TRANSFORMATION OF NEW TYPE ZIRCONIA BASED SOLID ELECTROLYTE SYSTEM
Aynur GÜRBÜZ Mersin University, Advanced Technology Education Research and Application Center, Ciftlikkoy Campus, 33343, Yenisehir/Mersin/Turkey [email protected]
Serdar YILMAZ Mersin University, Department of Physics, Ciftlikköy Campus, 33343, Yenisehir/Mersin/Turkey Mersin University, Department of Nanotechnology and Advanced Materials, Ciftlikköy Campus, 33343, Yenisehir/Mersin/Turkey [email protected]
ABSTRACT: In this study, heat treatment procedure was investigated of (Yb2O3)x(Y2O3)y(ZrO2)1-x-y solid electrolyte ternary system for x=0.2,0.4,0.8 and y=0.2,0.4,0.8. The heat treatment steps for stabilizing of high temperature doped Zirconia Oxide based systems is an important parameter. Also the cubic phase of these electroceramic systems uses in many application such as SOFCs, oxygen sensors and thermal barrier materials as a solid state electrolyte. In the sintering procedure not only the gradual heat treatment but also only one step heating is open to research. For this reason in this study we compared the gradual heat treatment and one-step heating effect on microstructure and crystal formation of the samples calcined at 750 °C for 2 hours. In the first group of materials, the gradual heat treatment was applied consecutively at 900, 1000 and 1100 °C for 24 h and in the second group only one-step heating applied at 1000 and 1100 °C for 24 h. The grain structures of the samples sintered at different temperatures and times were examined by FE-SEM. There was no difference in grain structure and size between the two groups. The crystal structures of the samples were examined by XRD. When XRD data were analyzed, cubic structure formation was observed at all of synthesized powders. Because there is no difference between two group materials, it is proposed that the one-step sintering is efficient and the optimum synthesis temperature for the synthesis of (Yb2O3)x(Y2O3)y(ZrO2)1-x-y solid electrolyte was proposed as 900 °C for 24 h which is lowest sintering temperature.
Key Words: Electroceramic, Solid Electrolyte, Sintering, ZrO2 Acknowledgement: This study is supported by the Mersin University (project no: 2018-1-TP3-2795).

UEMK 2019 Proceedings Book
24/25 October 2019 Gaziantep University, TURKEY 640
AUTOMATIC RECOGNITION OF VINE LEAF DISEASES USING DEEP
LEARNING AND CONVOLUTIONAL NEURAL NETWORKS
Ahmet Alkan, KSÜ, Department of Electrical &Electronics Engineering, Kahramanmaraş, [email protected] Muhammed Üsame Abdullah, KSÜ, Department of Electrical &Electronics Engineering, Kahramanmaraş, [email protected] Hanadi Omaish Abdullah, GAÜN, Department of Civil Engineering,Gaziantep, [email protected] Muhammed Assaf, KSÜ, Department of Agriculture Engineering, Kahramanmaraş, [email protected]
ABSTRACT: Grape production for grape juice and grape are a very important economic issue in and around Syria. There are vast vineyards in this area. Quality is also very important in grape production as it is in most areas today. The aim of this research is to improve the accuracy of detection of diseases in vine leaves and to develop a system to help Syrian and Turkish farmers, Agricultural Engineers. The proposed system will be useful for the early identification of diseases to be processed later and thus contribute to raising the efficiency and quality of crops of this type of fruit. In this study, images (600 pictures) of vine leaves were collected from farmers and the internet. These images were processed using MATLAB 2018B. The proposed methodology will be able to increase the effective and healthy grape leaves and grape growth in Syria and nearby areas. Also, this new technique will provide researchers and international farmers with disease diagnosis which can be used in the production of high-quality grapes. Deep learning and Convolutional Neural Network (CNN) technologies and transfer learning algorithm were used to increase the accuracy of disease detection in grape leaves to produce high-quality grapes. In this research CUDA code and GPU processing were used for Accelerate processing. After this step, we became able to build a system capable of detecting five types of diseases and natural/healthy condition automatically and rapidly. The experimental studies showed that the total recognition of the accuracy of the proposed system reached to 91.1%. Key words: Convolutional Neural Network(CNN), CUDA code, Deep learning, transfer learning, GPU processing.

UEMK 2019 Proceedings Book
24/25 October 2019 Gaziantep University, TURKEY 641
INTRODUCTION
The plant diseases recognition with deep learning is considered one of the most advanced
and modern techniques. Here is a summary of research into these techniques:
Reis et al, presented a simple system for the detection, which works in the natural environment, for vine, in color images range, they used of one a simple technique which based on image processing, this technique is work on recognizing between white and red grapes, this system which based on this technique is also to work at night, which can be using in help the working of harvesting robot. The system presented here represents part of an effort that is being made by their team to help introducing PA (Precision Agriculture) and PV (Precision Viticulture) in the farmers’ every day (Reis et al, 2012). Mohanty et al ,used deep learning for classification of 14 crop species with 26 diseases (or healthy) they used dataset consist of 54.000 images from PlantVillage which it is open
access. They reported the obtained results will help in the diagnosis of cases and the identification of diseases automatically ( Mohanty et al , 2016). K. Muthukannan et al, used feed forward neural network (FFNN) which is one kind of the artificial neural network algorithm (ANN) to solve complex problems by modelling complex input-output relationships. They used Learning Vector Quantization (LVQ) is a supervised version of vector quantization that can be used for labeled input data. The inputs were 118 images, this leads to the classification stage in output, in addition to this ,they used radial basis function network (RBF) were tested for two different diseased leaf image classifications such as bean and bitter gourd leaves (K. Muthukannan et al,2015). Thanki et al , used machine learning, for example on machine learning approaches which they used, the support vector machine (SVM) (Ahmet, A. (2011)), neural network models and clustering models. To predict specific diseases and classify various diseases from the input plant leaf images of different plants, and for the quantification of disease severity in plants, they used images from potato and tomato leaves, and they can classification for leaf identification and disease detection, this leads to meet the new challenges in the field of agriculture ( Thanki et al ,2018) .
S. E. A. Raza and et al, used thermal imaging by thermal camera, which provides a fast and non-destructive way of scanning plants, for diseased regions, Thermal imaging used to study the effect of disease, on the thermal profile of a plant, and they developed a machine learning system, to remotely detect plants infected, they used support vector machine (SVM), which it is one of kind machine learning, where it used to classification between diseases leaves and healthy leaf ( Raza and et al,2015). As can be seen from the studies above, transfer learning based deep learning and in particular the use of digital image processing has made the detection of leaf diseases possible. This study contributes to the developments in this field by presenting a new technique based on deep learning to increase the accuracy of disease detection in vine

UEMK 2019 Proceedings Book
24/25 October 2019 Gaziantep University, TURKEY 642
leaves for greater efficiency of high-quality grape production. To the best of our knowledge, there have been no studies of this kind in the literature on image processing research. For this, in our research, we will try to present a new technique, to increase accuracy for detection of diseases in vine leaves for contributing in obtaining high-quality grape production, this new technique is based on deep learning. MATERIALS
We have used 600 images of vine leaves that were collected from farmers and internet. A sample of dataset is shown Figure 2. We have employed Matlab2018A, Neural Network Toolbox . As an CNN network we have used Alexnet which is a pre-trained network and contain 25 layers. The first five layers are convolutional layers and the final three layers are fully connected layer as can be seen in the Figure 1. The first layer, the image input layer, requires input images for size 227-by-227-by-3, where 3 is the number of color channels net = alexnet; net.Layers
Figure1. Layers in the Alexnet

UEMK 2019 Proceedings Book
24/25 October 2019 Gaziantep University, TURKEY 643
Figure 2. A sample of dataset
In this study was used transfer learning that based on deep learning, but what is transfer learning and why we used it ? Transfer learning is an efficient solution for many problems. Training requires some data and computer time, but much less than training from scratch, and the result is a network suited to our specific problem , we benefited from pretrained network (Alexnet as example) in new building for our network , Figures 3,4 (www.mathwork.com, n.d,2017).
Figure 3. Transfer learning between pretrained network and training from scratch
Figure 4. Typical workflow for transfer learning

UEMK 2019 Proceedings Book
24/25 October 2019 Gaziantep University, TURKEY 644
METHODS
Pre-Processing of the Images :
We have resized the images to 227*227*3 where 3 is the number of color channels, This process is done by Matlab2018B and manually, We can do this through Paint program or another photo editing program Figure.5 .
Figure 5. The deference between grayscale and color images
Training and Testing Stages:
After above step and by Alexnet network and transfer learning code, where we can run the new code with new data and new inputs. At this stage, all legacy network data will be erased and replaced with new our data, where our data are 600 images with 6 categories (There are five kinds of diseases and a normal condition, each category contain 100 images). The new code will run automatically in training network stage and testing stage. We used Alexnet based on CUDA code which work with Nvidia productions, and all processing operations can be done with GPU, that helps to accelerate the processing and achieve a high accuracy. Figure.6 is shown stages of processing of diseases in vine leaves by Deep learning.

UEMK 2019 Proceedings Book
24/25 October 2019 Gaziantep University, TURKEY 645
Figure 6. stages of processing of diseases in vine leaves by Deep learning
RESULTS AND FINDINGS
In the system, which we have proposed, we can confirm the results by some commands in Matlab 2018B We knew the number of randomly selected images for the testing phase by the following command in Matlab 2018B: Vine Actual = testImages.Labels ; >> vinePreds = classify(myNet,testImages)
vinePreds = 180×1 categorical array Now for knowing how many images is correct and identical to the category to which it belongs by next command we knew this : >> numCorrect = nnz(vinePreds == vineActual) numCorrect = 164 >> fracCorrect = numCorrect/numel(vinePreds) fracCorrect = accuracy = 0.9111 Where: Accuracy =Total number of vine images correctly /Total number of vine images used for testing According to this : 164/180=0.91111 For a confusion matrix Figure7.This figure shows the number of correct and incorrect images when testing stage

UEMK 2019 Proceedings Book
24/25 October 2019 Gaziantep University, TURKEY 646
Figure7. Confusion matrix
CONCLUSION
In this project we have used deep learning and transfer learning for detection the diseases of vine leaves automatically , these diseases are defined by five types of diseases(Anthracnose, Black Rot, Fe-deficiency, Phylloxera, Powdery mildew) and Normal type .Finally, the proposed system obtained the accuracy of 91.1%. So that this system can detect/recognize diseases automatically and rapidly, therefore our proposed system will be helpful for the farmers and scientists that study in related areas. RECOMMENDATIONS
For future projects, we aspire to expand with the other diseases for vine leaves also, we aspire to transform this system to work on mobile devices in order to be of greater benefit to farmers and agricultural engineers. Also , Also the used methodology may be used/ applied to the different images for the different analyses for the different plants. ACKNOWLEDGMENT
This research is sponsored by CARA organization ( from Uk for Academics ). This research has won a small grant from Cara, so the authors of this research thank Cara for sponsoring this research. REFERENCES

UEMK 2019 Proceedings Book
24/25 October 2019 Gaziantep University, TURKEY 647
Reis, M.J.C.S., Morais, R., Peres, E., Pereira, C., Contente, O., Soares, S., Valente, A., Baptista, J., Ferreira, P.J.S.G., Bulas Cruz, J., (2012). Automatic detection of bunches of grapes in natural environment from color images. J. Appl. Log. 10, 285–290. https://doi.org/10.1016/j.jal.2012.07.004
Mohanty, S. P., Hughes, D. P., & Salathé, M. (2016). Using Deep Learning for Image-Based Plant Disease Detection. Frontiers in Plant Science, 7. https://doi:10.3389/fpls.2016.01419
Muthukannan, K., Latha, P., Pon Selvi, R., Nisha, P., (2015). Classification of diseased plant leaves using neural network algorithms. ARPN J. Eng. Appl. Sci. 10, 1913–1919. Thanki, R., Borra, S., Dey, N., Ashour, A.S., (2018). Machine Learning Based Plant Leaf
Disease Detection and Severity Assessment Techniques: State-of-the-Art, Lecture Notes in Computational Vision and Biomechanics. https://doi.org/10.1007/978-3-319-65981-7_1.
Raza, S.E.A., Prince, G., Clarkson, J.P., Rajpoot, N.M.,(2015). Automatic detection of diseased tomato plants using thermal and stereo visible light images. PLoS One 10, 1–20. https://doi.org/10.1371/journal.pone.0123262.
www.mathwork.com,n.d. https://matlabacademy.mathworks.com/R2017b/portal.html?course=deeplearning&s_tid=course_dlor_
start. Ahmet, A. (2011). Analysis of knee osteoarthritis by using fuzzy c-means clustering and SVM classification. Scientific Research and Essays, 6(20), 4213–4219. doi:10.5897/sre11.068.

UEMK 2019 Proceedings Book
24/25 October 2019 Gaziantep University, TURKEY 648
FACIAL EXPRESSION RECOGNITION USING CONVOLUTIONAL NEURAL NETWORKS
Ahmet Alkan, KSÜ, Department of Electrical &Electronics Engineering, Kahramanmaraş, [email protected] Muhammed Üsame Abdullah, KSÜ, Department of Electrical &Electronics Engineering, Kahramanmaraş, [email protected] Hanadi Omaish Abdullah, GAÜN, Department of Civil Engineering,Gaziantep [email protected]
ABSTRACT: The face recognition technique using deep learning is one of the most advanced and modern techniques. Face recognition have been used for security purposes such as sensitive security centers, airports, metro stations, tramway stations, and any other crowded places. Identification of the facial expressions using convolutional neural networks is a novel technology, and it was intended to be used to recognize facial expressions on social media sites. However, as far as we know, facial recognition has not
been studied together with facial expression in previous research. So, this research introduces a convolutional neural network based deep learning technique to recognize faces and facial expressions together. The aim of this research is to introduce new technology to use in companies, institutions and schools, in order to aid psychiatrists when there are large numbers of staff, employees or students, need to follow their psychological situations. In this research, images of five people (four males and one female) with eight emotional state expressions (anger, happiness, surprise, disgust, concentration, sadness, and fear) were used. These images were taken from publicly available MMI dataset which is available to those working in higher education institutions and is provided on the condition that it is being used only for educational and research purposes. 1200 images were processed using convolutional neural networks (CNNs) developed on MATLAB2018-a environment. Obtained results on the used database showed that the proposed system capable of recognizing facial expressions related to the emotional states and faces (the names of people for the five people mentioned above), with the excellent accuracy. Keywords: Deep learning ,CNN, Facial Expression . INTRODUCTION

UEMK 2019 Proceedings Book
24/25 October 2019 Gaziantep University, TURKEY 649
Face recognition technology and recognizing facial expressions with deep learning is
considered one of the most advanced and modern techniques. Here is a brief summary
of research related to these techniques:
Veena Mayya and et al., proposed a method to automatically recognize facial expressions.
Their method was based on Deep Convolutional Neural Network (DCNN) that focuses on recognizing the facial expressions of an individual from a single image. The feature extraction time is significantly reduced by using general purpose graphic processing unit (GPGPU). They used images from CK+ Dataset (Japanese Female Facial Expression) and JAFFE Dataset for many facial expressions such as, anger, disgust, fear, happiness, neutral, sadness and surprise expressions (Veena Mayya and et al,2016). Abir Fathallah and et al., have used Deep Neural Networks (DNN) based on Convolutional
neural networks (CNN) for Automated Facial Expression Recognition. They fine-tuned their architecture with the Visual Geometry Group model (VGG) to improve results. To evaluate their architecture, they tested it with many large public databases (CK+, MUG, and RAFD). The results obtained showed that the CNN approach is very effective in image expression recognition on many public databases which represented an improvement in facial expression analysis (Abir Fathallah and et al,2017). Dinh Viet Sang and et al., have applied recent advances in deep learning to propose
effective deep Convolutional Neural Networks (CNNs) that can accurately interpret semantic information available in faces in an automated manner without hand-designing of features descriptors. They used the FERC-2013 dataset provided on the Kaggle facial expression recognition competition. The dataset consists of 35,887 gray images of 48x48 resolution. Kaggle has divided these images into 28,709 training images, 3589 public test images and 3589 private test images (Dinh Viet Sang and et al,2017). Shraddha Arya and et al., proposed a method for face recognition based on Deep learning
and Linear Discriminant Analysis (LDA), where typical structures of face recognition system consist of three major steps, obtaining face data, extracting facial features and recognition of faces. In the first phase, the face images are partitioned into multiple face parts. This step is termed as the pre-processing of images. Secondly, the images are processed for feature extraction to apply the LDA algorithm. Finally, the neural network is proposed to perform training on extracted face features and classes and the trained model is used for recognizing the faces ( Shraddha Arya and et al,2018). Hayfaa Hussein and et al., in their research, they relied on the geometric features of facial
expressions with relatively low complexity. They used three databases of different faces images, namely VDMFP, BINED, and MMI. These databases contain images of different facial expressions in different imaging conditions. These images were rotated around a central point. then these images were processed and features were extracted using deep learning (Hayfaa Hussein and et al,2018). Examining the summarized previous studies, we can reach the conclusion that most of
the research focused on face recognition without focusing on facial expression

UEMK 2019 Proceedings Book
24/25 October 2019 Gaziantep University, TURKEY 650
recognition, or have been focused on facial expression without focusing on face recognition , therefore in the current study we presented new technique for recognize the facial expression and faces for the five people mentioned above . MATERIALS
In this research we have used 1200 images belonging to five people these pictures are distributed over eight psychological/emotional expressions so that each person has eight facial expressions (anger, happiness, surprise, disgust, concentration, sadness, and fear) and therefore we have 40 categories in each category 30 pictures, It should be noted that the images were obtained from a base and after we pledged to use them only for scientific and research purposes, we then classified facial expressions and we put fake names of the five people ( Mary, Mechil , Mario, Jon, Frank ) A sample of dataset is shown Figure 1. We have employed Matlab2018A, Neural Network Toolbox. As an CNN network we have used Alexnet which is a pre-trained network and contain 25 layers. The first five layers are convolutional layers and the final three layers are fully connected layer as can be seen in the Figure 1. The first layer, the image input layer, requires input images for size 227-by-227-by-3, where 3 is the number of color channels.
Figure 1. A sample of dataset
Convolutional Neural Networks (CNNs) are one of the most popular and novel neural network architectures. They are extremely successful at image processing, but also for many other tasks (such as speech recognition, natural language processing, and more). The state of the art CNNs are pretty deep (dozens of layers at least), so they are part of Deep Learning.
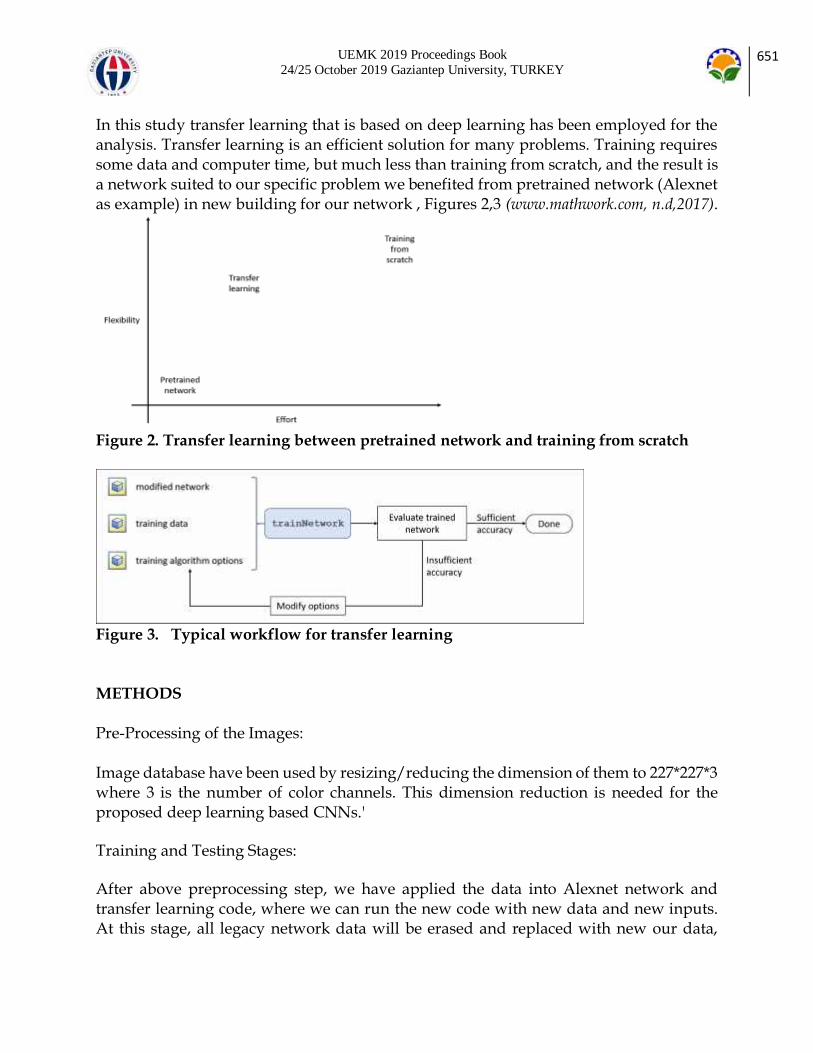
UEMK 2019 Proceedings Book
24/25 October 2019 Gaziantep University, TURKEY 651
In this study transfer learning that is based on deep learning has been employed for the analysis. Transfer learning is an efficient solution for many problems. Training requires some data and computer time, but much less than training from scratch, and the result is a network suited to our specific problem we benefited from pretrained network (Alexnet as example) in new building for our network , Figures 2,3 (www.mathwork.com, n.d,2017).
Figure 2. Transfer learning between pretrained network and training from scratch
Figure 3. Typical workflow for transfer learning
METHODS
Pre-Processing of the Images: Image database have been used by resizing/reducing the dimension of them to 227*227*3 where 3 is the number of color channels. This dimension reduction is needed for the proposed deep learning based CNNs.'
Training and Testing Stages:
After above preprocessing step, we have applied the data into Alexnet network and transfer learning code, where we can run the new code with new data and new inputs. At this stage, all legacy network data will be erased and replaced with new our data,

UEMK 2019 Proceedings Book
24/25 October 2019 Gaziantep University, TURKEY 652
where our data are 1200 images with 40 categories (for five people with eight facial expressions, each category contain 30 images). we selected 70% from images (840 images) for training stage and 30% from images (360 images) for testing stage. The developed code will run automatically in training network stage and testing stage. We have used Alexnet based on CUDA code which work with Nvidia productions, and all processing operations can be done with GPU, that helps to accelerate the processing and achieve a high accuracy. Stages of the developed facial expressions and face recognition system is shown in figure 4.
Figure 4. Processing stages of the proposed system by using CNN based Deep learning
RESULTS AND FINDINGS
In the proposed system, the system was reduced to 227*227*3 by reducing its dimensions (Ahmet, A. (2011)) and classified with CCN based deep learning. 70% of the dataset was used for the training of the system. After the training process was completed, the test process was completed using the remaining 30% dataset.

UEMK 2019 Proceedings Book
24/25 October 2019 Gaziantep University, TURKEY 653
Figure 5. confusion matrix
When the accuracy of the test process was calculated, an excellent classification performance (100% classification accuracy) was obtained. With the proposed system, both the face of the person and the emotional state of the person whose face is recognized have been classified very successfully. Figure 5. shows the confusion matrix that includes the number of correct and incorrect images on testing stage, where the X-axis represents the predicted situations and the Y-axis represents the actual situations. CONCLUSIONS
In this study to recognize the facial expressions and faces automatically, we have proposed a system employed used convolutional neural networks and transfer learning, these faces with fake names are five people (Mary-Mechil -Mario -Frank -Jon) and eight facial expressions are anger, happiness, surprise, disgust, concentration, sadness, and fear. Finally, the proposed system obtained the accuracy of 100%. So that this system can detect/recognize facial expressions and faces automatically and rapidly, therefore our proposed system will be helpful for the psychiatrists and scientists that study in related areas.

UEMK 2019 Proceedings Book
24/25 October 2019 Gaziantep University, TURKEY 654
RECOMMENDATIONS
For future projects, we plan to expand this research to include recognizing a much larger number of people, based on our own database, in order to provide more help for psychiatrists and contribute to accelerating the solution of psychological problems for students, workers, and employees or the target groups in this research. REFERENCES
V. Mayya, R. M. Pai, and M. M. Manohara Pai.(2016). “Automatic Facial Expression Recognition Using DCNN,” Procedia Comput. Sci., vol. 93, no. September, pp. 453–461.
A. Fathallah, L. Abdi, and A. Douik.(2017). “Facial Expression Recognition via Deep Learning,” 2017 IEEE/ACS 14th Int. Conf. Comput. Syst. Appl., pp. 745–750. Sang, D. V., Van Dat, N., & Thuan, D. P. (2017). Facial expression recognition using deep convolutional neural networks. 2017 9th International Conference on Knowledge and Systems Engineering (IEEE /KSE). doi:10.1109/kse.2017.8119447. A. A. M.E, Shraddha Arya.(2018).“Face Recognition with Partial Face Recognition and Convolutional Neural Network,” vol. 7, no. January, pp. 91–94. Hussein, H., Angelini, F., Naqvi, M., & Chambers, J. A. (2018). Deep-Learning Based Facial Expression Recognition System Evaluated on Three Spontaneous Databases. 9th International Symposium on Signal, Image, Video and Communications (ISIVC). doi:10.1109/isivc.2018.8709224 . www.mathwork.com,n.d. https://matlabacademy.mathworks.com/R2017b/portal.html?course=deeplearning&s_tid=course_dlor_start. Ahmet, A. (2011). Analysis of knee osteoarthritis by using fuzzy c-means clustering and SVM classification. Scientific Research and Essays, 6(20), 4213–4219. doi:10.5897/sre11.068.

UEMK 2019 Proceedings Book
24/25 October 2019 Gaziantep University, TURKEY 655
THERMODYNAMIC ANALYSIS OF HYBRID GEOTHERMAL POWER PLANT
SUPPORTED WITH BIOMASS USING DIFFERENT BIOMASSES
Mustafa Alper YERLİKAYA Erzincan Binali Yıldırım Üniversitesi [email protected] Prof Dr. Ahmet TANDIROĞLU Erzincan Binali Yıldırım Üniversitesi atandı[email protected]
ABSTRACT: The concept of energy and the sustainability of energy resources have been one of the most important issues and problems on a global scale from the past to the present. With all the technological developments, different fossil energy sources have been used over time (coal, oil, natural gas, etc.). Furthermore, considering the damages it causes to the environment and humanity, the demand for renewable energy sources, which are environmentally friendly, increased. One of these renewable energy sources is biomass. Biomass energy has started to gain importance as it has an impact on the solution of the global environmental and air pollution problems. In developing and energy-needly countries, especially Turkey which has high potential of waste and animal, the value given to biomass should increase in order to decrease dependence on importing energy since herbal animal and other waste are in biomass class too. After an overview of the kinds of biomass energy in Turkey in this study the most efficient and economic was chosen by comparison. Then a model of biomass supported hybrid geothermal power plant was examined and calculations were made using certain data and assumptions. It is aimed to generate electrical energy from geothermal energy known as alternative energy source by increasing energy efficiency by using more efficient and economical biomass. Key words: Thermodynamic Analysis, Geothermal Energy, Hybrid Geothermal Power Plant, BioMass. FARKLI BİOKÜTLELER KULLANAN BİOKÜTLE DESTEKLİ JEOTERMAL ENERJİ SANTRALİNİN TERMODİNAMİK ANALİZİ
ÖZET: Enerji kavramı ve enerji kaynaklarının sürdürülebilir olması geçmişten günümüze kadar evrensel boyutta en önemli konulardan ve sorunlardan biri olmuştur. Teknolojik gelişmelerle birlikte zaman içerisinde çok farklı fosil enerji (kömür, petrol, doğalgaz vb. ) kaynakları kullanılmıştır. Fosil enerji kaynaklarının çevreye ve insanlığa

UEMK 2019 Proceedings Book
24/25 October 2019 Gaziantep University, TURKEY 656
vermiş olduğu zararları da göz önüne alınınca, çevre dostu olan yenilenebilir enerji kaynaklarına talep artmıştır. Bu yenilenebilir enerji kaynaklarından biri de biokütledir. Küresel bir sorun olan çevre ve hava kirliliği sorunlarının çözümünde de etkisi olduğundan biokütle enerjisi önem kazanmaya başlamıştır. Bitkisel, hayvansal ve diğer atıklarda biokütle sınıfında olduğundan gelişmekte ve enerji ihtiyacı çok olan ülkelerde ve özellikle hayvansal ve atık olarak önemli bir biokütle potansiyeline sahip olan Türkiye’de de enerjide dışa bağımlılığın azaltılması için biokütleye verilen değerin artması gerekmektedir. Bu çalışmada Türkiye’deki biokütle enerji çeşitlerine genel bir bakış yapıldıktan sonra aralarında bir kıyaslama yapılarak en verimli ve ekonomik olanı seçilmiştir. Çalışmada, biokütle destekli hibrit jeotermal enerji santralinin bir modeli incelenmiş ve belli veriler ve kabuller kullanılarak hesaplamalar yapılmıştır. Alternatif enerji kaynağı olarak bilinen jeotermal enerjiden, daha verimli ve ekonomik biokütleler kullanılarak enerji verimi arttırılarak elektrik enerjisi üretmek amaçlanmıştır. Anahtar sözcükler: Termodinamik Analiz, Jeotermal Enerji, Hibrit Jeotermal Enerji Santrali, Biokütle.

UEMK 2019 Proceedings Book
24/25 October 2019 Gaziantep University, TURKEY 657
HYDROCHEMICAL INVESTIGATION OF HOT AND MİNERAL WATERS IN EMİR GEOTHERMAL FIELD (KULA, MANİSA)
Özgün DEMİREL Pamukkale University [email protected]
Ali GÖKGÖZ Pamukkale University [email protected]
ABSTRACT: Emir geothermal field is located 13 km northeast of Kula district of Manisa province. The aim of this study is to determine the chemical composition of thermal
waters in the Emir geothermal field and to provide an approach to reservoir temperature. The basement rock of the study area is the Upper Cretaceous Vezirler melange composed of serpentinite, chert, mudstones and limestone blocks. Melange is unconformably overlain by the conglomerates and sandstones of Kurtköyü formation and by the Yeniköy formation composed of conglomerates-sandstone-siltstone-claystone-clayey and sandy limestone-marl-tuffite alternations. Both formations are Miocene in age. These formations are overlain by the Lower Pliocene Ahmetler formation (Balçıkdere member), which consists of conglomerate-sandstone-claystone-marl and limestone intercalations. Qaternary is represented by the Asartepe formation, which consists of Quaternary conglomerate-sandstone intercalations and the Kula volcanics made up basalt, slag and tuffs, travertine and alluvium. There are three geothermal drillings in the Emir geothermal field, eight thermal springs and one mineral water resource. Temperatures of the thermal waters vary between 21.1 and 63.3°C, electrical conductivities 3840 to 5210 µS/cm and pH values varybetween 6.56 and 7.69. The cation arrangement is Na> Mg> Ca> K and the anion arrangement is HCO3>Cl>SO4. Na concentration of the thermal waters is 720-1025 mg/l, HCO3 concentration is between 2500-3480 mg/l and they are generally are of the Na-HCO3 type. Chalcedony and quartz geothermometers applied to approach the reservoir temperature of the thermal waters of the study area. Chalcedony geothermometers yielded reservoir temperatures ranging from 80 to 125°C and quartz geothermometers ranging from 102-150°C. This work was supported by PAU BAP Coordinator (Project No: 2018FEBE049). Key words: Emir, Kula, geothermal, hydrochemistry, geothermometer

UEMK 2019 Proceedings Book
24/25 October 2019 Gaziantep University, TURKEY 658
EMİR JEOTERMAL SAHASI (KULA, MANİSA) SICAK VE MİNERALLİ SULARININ HİDROKİMYASAL İNCELEMESİ
ÖZET: Emir jeotermal sahası Manisa ilinin Kula ilçesinin 13 km kuzeydoğusunda yer alır. Bu çalışmanın amacı Emir jeotermal sahasındaki sıcak suların kimyasal kompozisyonlarını belirlemek ve rezervuar sıcaklığına yaklaşım sağlamaktır. İnceleme alanının temelini serpantinit, çört ve çamurtaşlarıyla kireçtaşı bloklarından meydana gelen Üst Kretase yaşlı Vezirler melanjı oluşturur. Melanj üzerine uyumsuz olarak çakıltaşı ve kumtaşından oluşan Kurtköyü formasyonu ile çakıltaşı-kumtaşı-silttaşı-kiltaşı-killi ve kumlu kireçtaşı-marn-tüfit ardalanmasından oluşan Yeniköy formasyonu gelir. Her iki formasyon da Miyosen yaşlıdır. Bu formasyonlar üzerinde çakıltaşı-kumtaşı-kiltaşı-marn ve kireçtaşı ardalanmasından oluşan Alt Pliyosen yaşlı Ahmetler formasyonu (Balçıkdere üyesi) bulunur. Kuvaterner çakıltaşı-kumtaşı ardalanmasından oluşan Asartepe formasyonu, bazalt, cüruf ve tüflerden oluşan Kula volkanitleri, traverten ve alüvyonla temsil edilir. Emir jeotermal sahasında üç jeotermal sondaj, sekiz termal kaynak ve bir maden suyu kaynağı bulunur. Termal suların sıcaklıkları 21,1 ile 63,3°C, elektriksel iletkenlikleri 3840 ile 5210 µS/cm ve pH değerleri 6,56 ile 7,69 arasında değişir. Katyon dizilimi Na>Mg>Ca>K, anyon dizilimi ise HCO3>Cl>SO4 şeklindedir. Sıcak suların Na derişimi 720-1025 mg/l, HCO3 derişimi de 2500-3480 mg/l arasında olup hidrokimyasal olarak genellikle Na-HCO3 tipindedirler. İnceleme alanı termal sularının rezervuar sıcaklığına yaklaşımda bulunmak için kalsedon ve kuvars jeotermometreleri uygulanmıştır. Kalsedon jeotermometreleri 80-125°C, kuvars jeotermometreleri ise 102-150°C arasında değişen rezervuar sıcaklıkları vermiştir. Bu çalışma PAÜ BAP Koordinatörlüğü tarafından desteklenmiştir (Proje No: 2018FEBE049).
Anahtar sözcükler: Emir, Kula, jeotermal, hidrokimya, jeotermometre.

UEMK 2019 Proceedings Book
24/25 October 2019 Gaziantep University, TURKEY 659
EXPERIMENTAL INVESTIGATION OF A SOLAR DISH COLLECTOR WITH SPIRAL COIL TUBE HEAT EXCHANGER FOR HOT WATER PRODUCTION
Devrim AYDIN Eastern Mediterranean University [email protected]
ABSTRACT: In the last decade, solar energy technologies are gaining attention due to their potential for reducing environmental emissions and enhancing sustainability in residential and industrial applications. In this regard, solar collector systems are widely used for hot water production in buildings. Currently, flat plate collectors are mostly used collector type; however their efficiency dramatically drops in winter period when the hot water demand is at its peak. Consequently, present study is concerned with the design and development of a parabolic dish collector as an alternative to flat plate collectors. The proposed collector consists of a parabolic dish, a receiver made up of a black painted spiral coil tube heat exchanger and a glass glazing. In the system, a 50 L water tank is also used and the water is circulated between the collector and the water tank by employing a water pump. System is tested on the coldest days of the year (10-13 December 2018) and highest water temperature of 42 is achieved. The average and maximum instantaneous thermal efficiencies of collector were obtained as 48% and 76% respectively. Key words: solar energy, parabolic dish, water heating, thermal energy analysis, efficiency INTRODUCTION
With the growing emphasis on energy conservation, renewable energy sources have received increasing attention (Tian and Zhao, 2013). The term "renewable energy" is not a new concept to the environment, but rapidly it continues to emerge as an alternative to fossil fuels and all other deleterious energy resources. Solar energy, which is one of the most abundant renewable source have the potential to meet the total global energy demand. However, only 0.02% of that energy is utilized in the present day (Devabhaktuni et al., 2013). Nevertheless, since the initial implementation of solar systems, numerous projects have been completed and the developments in the field of solar energy are
ongoing. Among all renewable sources, solar energy is considered as one of the most economic and efficient alternative. Solar systems are basically converts solar irradiation into useful form of energy such as heat or electricity. In solar thermal applications, solar collectors or concentrators are used to gather the solar radiation. The radiation energy can then be used for space/water

UEMK 2019 Proceedings Book
24/25 October 2019 Gaziantep University, TURKEY 660
heating and for producing process heat in residential and industrial applications (Mekhilef et al., 2011). In the literature, several studies investigating different type of solar collector performances have been completed previously. Bellos & Tzivanidis (2018) studied flat plate collector performance experimentally and numerically under Athens conditions. Average efficiency of the investigated system was found 54.2%. Zhang et al. (2016) investigated a multi-purpose flat place solar collector for air and water heating. The overall efficiency of the collector in combined air-water heating mode reached to 73.4%. Nikolić and Lukić (2015) studied a double exposure flate plate collector for water heating. Results showed that double exposure collector provides an efficiency enhancement of 18.4% when compared to conventional flat plate collector. Fan et al. (2019) investigated a novel solar collector with V-corrugated multi-channel absorber. Thermal efficiency of the new collector was found in the range of 69-74%, while the efficiency of conventional solar collectors is determined as 58-69% for the same operating conditions. Jowzi et al. (2018) investigated evacuated tube collector performance with cylindrical absorbers in Greece. It is obtained that; four evacuated tube collectors connected in series can produce a maximum of 5.6 kW thermal energy. Xu et al. (2019) carried out experimental studies on evacuated tube collector performance under China climate conditions. Thermal efficiency of the developed collector was found between 43-55%.
Teles et al. (2019) numerically investigated the performance enhancement with the use of sun-tracking in evacuated tube solar collector applications in Brazil climate. The efficiencies of tracking and non-tracking evacuated tube collector were found 73% and 42% respectively. In another study, Budihardjo and Morrison (2009) performed comparative investigations between vacuum tube and flat plate collector in Sydney. The thermal performance of the vacuum tube collector was found higher while its sensitivity to the size of the storage tank was found lower compared to the flat plate collector. Despite several studies have been performed on flat plate and vacuum tube collectors, research on dish type concentrating solar water heaters is very limited in the literature. Such type of solar systems is mostly investigated for high temperature applications such as in solar thermal power plants. Different than the previous research, in present study, a dish type concentrating solar water heater using spiral coil tube heat exchanger is investigated for residential applications under North Cyprus climate conditions. METHODS
System Design and Operation
The proposed parabolic dish solar water heating unit consists of four main components namely; solar dish, copper coil receiver, support frame and water tank, as illustrated in Figure 1. In the system, receiver is made up of a horizontally aligned copper coil which is fitted inside a cylindrical glass glazing. With such design, it is targeted to enhance the
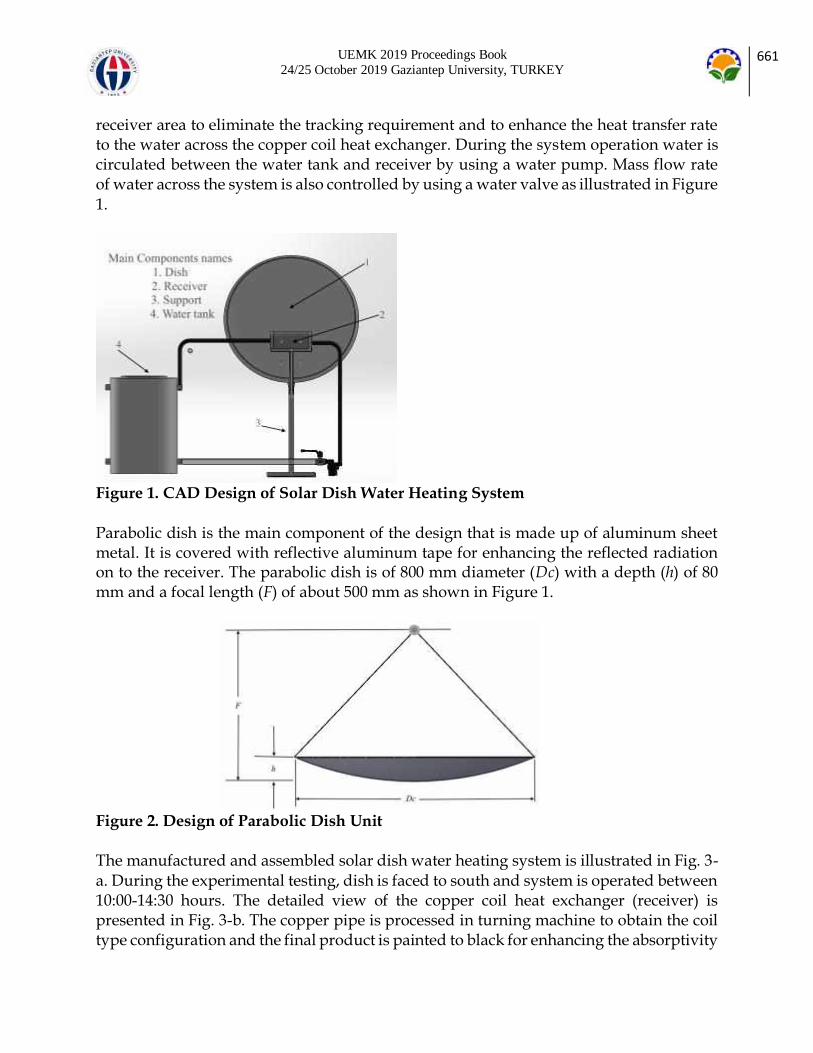
UEMK 2019 Proceedings Book
24/25 October 2019 Gaziantep University, TURKEY 661
receiver area to eliminate the tracking requirement and to enhance the heat transfer rate to the water across the copper coil heat exchanger. During the system operation water is circulated between the water tank and receiver by using a water pump. Mass flow rate of water across the system is also controlled by using a water valve as illustrated in Figure 1.
Figure 1. CAD Design of Solar Dish Water Heating System
Parabolic dish is the main component of the design that is made up of aluminum sheet metal. It is covered with reflective aluminum tape for enhancing the reflected radiation on to the receiver. The parabolic dish is of 800 mm diameter (Dc) with a depth (h) of 80 mm and a focal length (F) of about 500 mm as shown in Figure 1.
Figure 2. Design of Parabolic Dish Unit
The manufactured and assembled solar dish water heating system is illustrated in Fig. 3-a. During the experimental testing, dish is faced to south and system is operated between 10:00-14:30 hours. The detailed view of the copper coil heat exchanger (receiver) is presented in Fig. 3-b. The copper pipe is processed in turning machine to obtain the coil type configuration and the final product is painted to black for enhancing the absorptivity
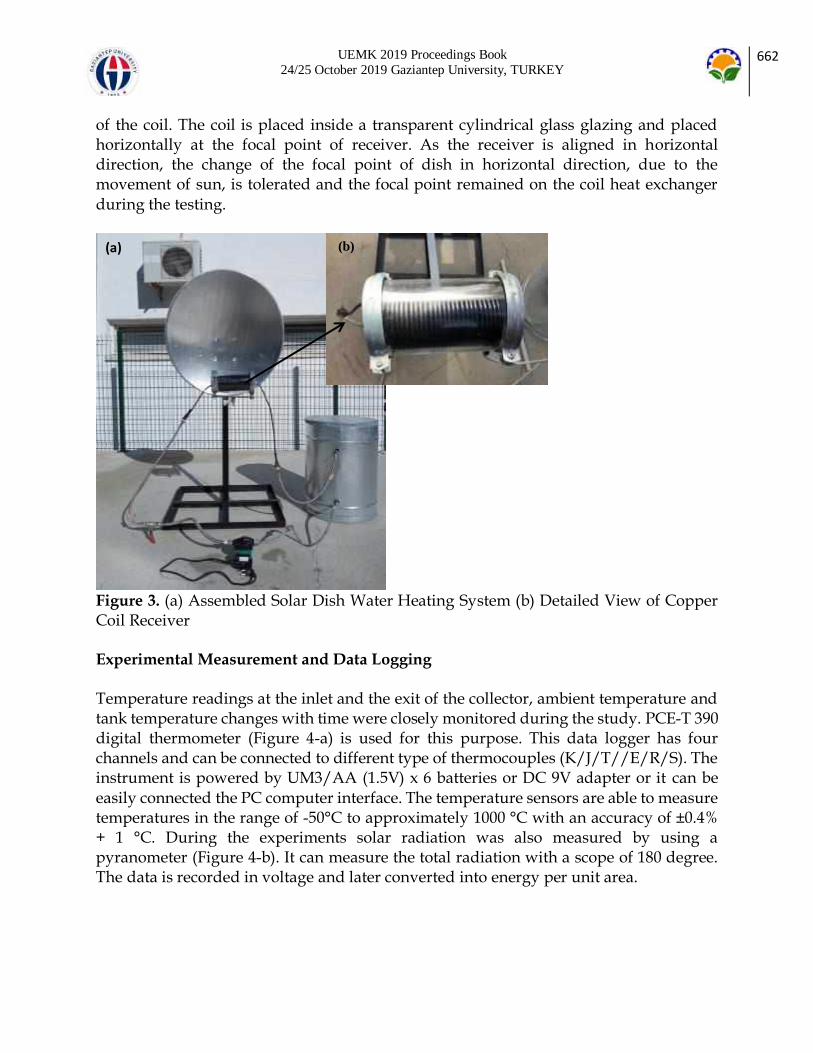
UEMK 2019 Proceedings Book
24/25 October 2019 Gaziantep University, TURKEY 662
of the coil. The coil is placed inside a transparent cylindrical glass glazing and placed horizontally at the focal point of receiver. As the receiver is aligned in horizontal direction, the change of the focal point of dish in horizontal direction, due to the movement of sun, is tolerated and the focal point remained on the coil heat exchanger during the testing.
Figure 3. (a) Assembled Solar Dish Water Heating System (b) Detailed View of Copper Coil Receiver Experimental Measurement and Data Logging
Temperature readings at the inlet and the exit of the collector, ambient temperature and tank temperature changes with time were closely monitored during the study. PCE-T 390 digital thermometer (Figure 4-a) is used for this purpose. This data logger has four channels and can be connected to different type of thermocouples (K/J/T//E/R/S). The instrument is powered by UM3/AA (1.5V) x 6 batteries or DC 9V adapter or it can be easily connected the PC computer interface. The temperature sensors are able to measure temperatures in the range of -50°C to approximately 1000 °C with an accuracy of ±0.4% + 1 °C. During the experiments solar radiation was also measured by using a pyranometer (Figure 4-b). It can measure the total radiation with a scope of 180 degree. The data is recorded in voltage and later converted into energy per unit area.
(a) (b)
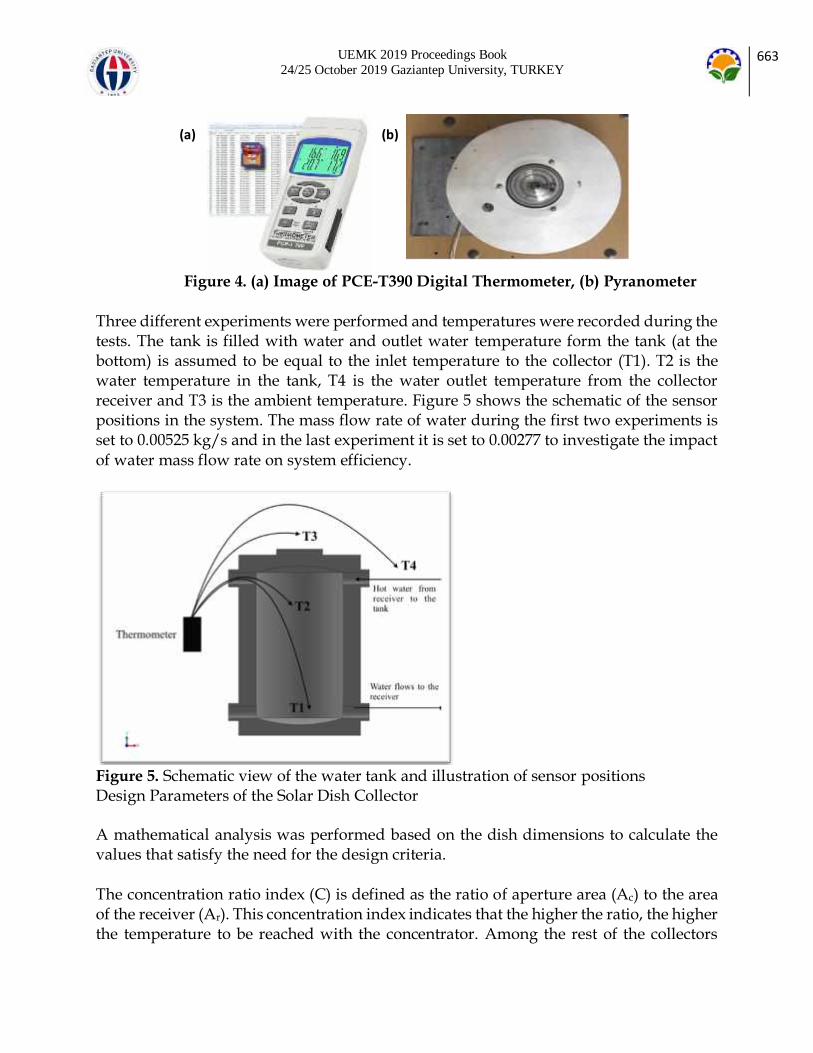
UEMK 2019 Proceedings Book
24/25 October 2019 Gaziantep University, TURKEY 663
Figure 4. (a) Image of PCE-T390 Digital Thermometer, (b) Pyranometer
Three different experiments were performed and temperatures were recorded during the tests. The tank is filled with water and outlet water temperature form the tank (at the bottom) is assumed to be equal to the inlet temperature to the collector (T1). T2 is the water temperature in the tank, T4 is the water outlet temperature from the collector receiver and T3 is the ambient temperature. Figure 5 shows the schematic of the sensor positions in the system. The mass flow rate of water during the first two experiments is set to 0.00525 kg/s and in the last experiment it is set to 0.00277 to investigate the impact of water mass flow rate on system efficiency.
Figure 5. Schematic view of the water tank and illustration of sensor positions Design Parameters of the Solar Dish Collector
A mathematical analysis was performed based on the dish dimensions to calculate the values that satisfy the need for the design criteria. The concentration ratio index (C) is defined as the ratio of aperture area (Ac) to the area of the receiver (Ar). This concentration index indicates that the higher the ratio, the higher the temperature to be reached with the concentrator. Among the rest of the collectors
(b) (a)

UEMK 2019 Proceedings Book
24/25 October 2019 Gaziantep University, TURKEY 664
parabolic dish is known or characterized as the best collectors with higher concentration ratio. C is defined in Equation (1).
C = 𝐴𝑐
𝐴𝑟 (1)
The collector area Ac can be calculated by the following equation:
Ac = 𝜋𝐷𝑐^2
4 (2)
While the receiver area is the surface area of the cylindrical receiver and is given by: Ar = 𝜋𝐷𝑙 (3) Where D is the diameter of the cylinder with a value of 0.12m, and it has a length l of 0.21m. Therefore Ac = 0.503 m2 and Ar = 0.0792 m2, then;
C = 0.503
0.0792 = 6.34
The half acceptance angle (John and Nidhi, 2015, Alarcón et al. 2013) is given by:
∅ = sin−1√1
𝐶 = 23.40° (4)
The optimum rim angle (John and Nidhi, 2015, Alarcón et al. 2013) is given by: 𝜓 = 90 - ∅ = 66.6° (5) Thermodynamic Analysis of the Solar Dish Collector
The available solar energy that can be obtained from the reflection can be calculated by: Qs = Ig .Ac (6) While the total amount of heat from the parabolic dish reflected to the receiver aperture area can be defined as the optical efficiency by the available solar energy is defined by Equation (7) below: Qabs = opt .Ig .Ac (7)

UEMK 2019 Proceedings Book
24/25 October 2019 Gaziantep University, TURKEY 665
Where, opt is the optical efficiency of the dish collector, Ac is the dish collector aperture area and Ig is the solar irradiation intensity. The optical efficiency for most solar collectors is 60 - 70 % (Alarcón et al. 2013) The estimated useful energy is calculated by: Q = 𝓂w.Cp.ΔT (8) Where, 𝓂w mass flow rate of water, Cp is the specific heat capacity of water and ΔT is change in the final and initial temperature. While the thermal efficiency of the collector can be calculated by Equation (9) and is defined as the ratio of the useful delivered energy to the incident energy falling to the concentrator surface (John and Nidhi, 2015);
c,therm=𝑄
Qabs (9)
The energy balance over the absorber leads to Eq. (10). According to the equation, absorbed heat by the receiver is equal to the total of heat gain by water and the heat losses. Qabs= Q + Qlosses (10)
The efficiency ( ) of most solar collectors’ is between 40-60% (Alarcón et al. 2013). Gained useful energy can be calculated by: Q = .Ig .Ac (11) This shows that Equations (8) and (11) are equal and yield: Q = .Ig .Ac = 𝓂w.Cp.ΔT (12) The instantaneous thermal efficiency is given by;
= Q
Ig .Ac (13)
RESULTS AND FINDINGS
This section presents the results obtained from the performed experiments. The testing was conducted in three different days; Dec 10, Dec 11 and Dec 13. On the first two days, mass flow rate of water is set to 0.00525 kg/s and in the final day of testing it is set to 0.00277 kg/s. By applying high and low water flow rates, it was aimed to analyze the impact of flow rate on the solar dish efficiency.

UEMK 2019 Proceedings Book
24/25 October 2019 Gaziantep University, TURKEY 666
Results for 10th December 2018
The system was tested for almost 4.5 hours of that day, which is from 10:00 to 14:30. During the experiments four different sensor locations were used. T1 (collector inlet temp) is the temp of the water inlet to the heat exchanger and it is also assumed equal to the bottom temperature in the tank, while T4 (collector outlet temp) represents the hot water temperature at the exit of the dish receiver. T2 (water tank temp) is the surface water temperature inside the tank, and T3 is the ambient temperature. Figure 6 a-d represents the temperature, solar radiation, energy and efficiency variations obtained during the experiment. The average temperature increase of water across the dish was determined as 6.3 °C whereas maximum water temperature inside the tank was reached to 37.7 °C from the initial temperature of 17.7 °C (See: Figure 6-a). As shown in Figure 6-b, solar radiation varied between 764 and 887 W/m2 while average heat transfer rate to the water was calculated as 139.1 W (Figure 6-c). Accordingly, based on the data presented in Fig 6-d, average efficiency of the dish was found 32.7% during the operation.
Figure 6. Variation of (a) Temperature, (b) Solar Radiation, (c) Absorbed, Useful and Lost Energy, and (d) Efficiency During the Experiment On 10th December
(a) (b)
(c) (d)

UEMK 2019 Proceedings Book
24/25 October 2019 Gaziantep University, TURKEY 667
Results for 11th December 2018
On 11th December, system is tested under similar operating conditions to validate the results obtained in initial testing. Temperature, solar radiation, energy and efficiency variations of the second day testing were illustrated in Fig. 7. The average temperature increase and rate of heat gain across the dish were found 9.1°C (See: Figure 7-a) and 199.7 W (See: Figure 7-c), which were higher than the values obtained in the first day of testing. On the other hand average solar radiation is measured as 811 W/m2 (See: Figure 7-b) on the second they which was slightly less than the average solar radiation in first day. As a result, as presented in Figure 7-d, efficiency of the dish varied in the range of 24.5%→58.3% and the average efficiency is obtained as 48.3% on that day.
Figure 7. Variation of (a) Temperature, (b) Solar Radiation, (c) Absorbed, Useful and Lost Energy, and (d) Efficiency During the Experiment On 11th December Results for 13th December 2018
In the last day of testing, mass flow rate of water is reduced to 0.00277 kg/s to see the impact of flow rate on solar dish water heater performance (See: Figure 8). Besides, in this testing, receiver temperature was also measured to demonstrate the highest temperature
(c) (d)
(a) (b)

UEMK 2019 Proceedings Book
24/25 October 2019 Gaziantep University, TURKEY 668
obtained with spiral coil heat exchanger. According to the testing results average temperature lift and rate of heat gain of water across the dish were achieved as 7.1 °C (Figure 8-a) and 153.9 W (Figure 8-b) respectively, while the maximum receiver temperature reached to 116 °C at around 11:45 am (Figure 8-e). During the experiments average solar intensity is measured as 810.1 W/m2 (Figure 8-b), and it was in close approximation with the intensity on the second day of testing. Accordingly efficiency of the dish water heater is obtained as 37.3% (Figure 8-d), which was higher than the first day but lower than the second day of testing.
(a) (b)
(c) (d)

UEMK 2019 Proceedings Book
24/25 October 2019 Gaziantep University, TURKEY 669
Figure 8: Variation of (a) Temperature, (b) Solar Radiation, (c) Absorbed, Useful and Lost Energy, (d) Efficiency, and (e) Receiver Temperature during the Experiment On 13th December CONCLUSION
In this study, a solar dish unit with copper coil receiver is designed and experimentally investigated for residential water heating applications. System is tested under different solar radiation and water mass flow rate conditions. The summary of the testing results are presented in Table 1. According to the study results, maximum hot water temperature inside the tank is achieved in the first day of testing, while maximum rate of heat gain is obtained in the last day. However the highest average of heat gain across the dish is achieved in Day 2. Results showed that both solar radiation and mass flow rate of water significantly effects the system performance. More specifically, it could be stated that; dish system provides higher efficiency at lower solar radiation conditions (ηday3 > ηday1) and higher mass flow rates (ηday2 > ηday3). However further studies are required for optimizing the operating parameters (mass flow rate, dish size, receiver configuration, water tank volume etc.) of the investigated solar dish system. Table 1. Summary of the Testing Results
Dec 10 Dec 11 Dec 13
mw (kg/s) 0.00525 0.00525 0.00277 Ig (W/m2) 836.2 811.4 809.1 T1average (OC) 28.5 33 29.4 T2average (OC) 32.6 34.7 34.3 T4max (OC) 42.1 41.2 40.1 T4average (OC) 34.8 37.3 36.4 Qmax (W) 243.5 243.5 265.5 Qaverage (W) 139.1 200 153.9 η 0.33 0.48 0.37
RECOMMENDATIONS
(e)

UEMK 2019 Proceedings Book
24/25 October 2019 Gaziantep University, TURKEY 670
This study presents a water heating system using solar dish unit for building application. As such systems are low cost, efficient and require less space compared to flat plate collectors, they demonstrate a potential to be employed in building water heating applications in the future. However deep research on numerical modelling, experimental validation through pilot applications and economic feasibility analysis of such systems is required to bring them to the market level. REFERENCES
Tian, Y., & Zhao, C. Y. (2013). A review of solar collectors and thermal energy storage in solar thermal applications. Applied Energy, 104, 538-553.
Devabhaktuni, V., Alam, M., Depuru, S. S. S. R., Green II, R. C., Nims, D., & Near, C. (2013). Solar energy: Trends and enabling technologies. Renewable and Sustainable Energy Reviews, 19, 555-564.
Mekhilef, S., Saidur, R., & Safari, A. (2011). A review on solar energy use in industries. Renewable and Sustainable Energy Reviews, 15(4), 1777-1790. Bellos, E., & Tzivanidis, C. (2018). Development of an analytical model for the daily performance of solar thermal systems with experimental validation. Sustain. Energy Technol. Assessments, 28, 22–29. Zhang, D., Li, J., Gao, Z., Wang, L., & Nan, J. (2016). Thermal performance investigation of modified flat plate solar collector with dual-function. Applied Thermal Engineering, 108, 1126–1135. Nikolić, N., & Lukić, N. (2015). Theoretical and experimental investigation of the thermal performance of a double exposure flat-plate solar collector. Solar Energy, 119, 100–113. Fan M., et al. (2019). A comparative study on the performance of liquid flat-plate solar collector with a new V-corrugated absorber. Energy Conversion and Management, 184, 235–248. Jowzi, M., Veysi, F., & Sadeghi, G. (2018). Novel experimental approaches to investigate distribution of solar insolation around the tubes in evacuated tube solar collectors. Renewable Energy, 127, 724–732. Xu, L.-C., Liu, Z.-H., Li, S.-F., Shao, Z.-X., & Xia, N. (2019). Performance of solar mid-temperature evacuated tube collector for steam generation. Solar Energy, 183, 162–172. Teles, M. de P. R., Ismail, K. A. R., & Arabkoohsar, A. (2019). A new version of a low concentration evacuated tube solar collector: Optical and thermal investigation. Solar Energy, 180, 324–339. Budihardjo, I., & Morrison, G. L. (2009). Performance of water-in-glass evacuated tube solar water heaters. Solar Energy, 83, 49–56. John, G. A., & Nidhi, M. J. (2015). Design and simulation of parabolic dish collector for hot water generation. Retrieved December 13, 2018 from http://troindia.in/journal/ijcesr/vol2iss9/20-24.pdf

UEMK 2019 Proceedings Book
24/25 October 2019 Gaziantep University, TURKEY 671
Alarcón, J. A., Hortúa, J. E., & Lopez, A. (2013). Design and construction of a solar collector parabolic dish for rural zones in Colombia. Tecciencia, 7(14), 14-22.
UEMK 2019 Proceedings Book
24/25 October 2019 Gaziantep University, TURKEY 672
INVESTIGATION OF CRYSTAL STRUCTURE OF BaCeO3 BASED NEW TYPE
ELECTROCERAMICS DEPENDING ON TEMPERATURE AND Gd ADDITIVE
AMOUNT
Çiğdem ÇELEN Institute of Natural and Applied Sciences, Department of Nanotechnology and Advanced Materials, Mersin University, Mersin, Turkey [email protected] Serdar YILMAZ Faculty of Arts and Sciences, Department of Physics, Mersin University, Mersin, Turkey Institute of Natural and Applied Sciences, Department of Nanotechnology and Advanced Materials, Mersin University, Mersin, Turkey [email protected]
ABSTRACT: The rapid development in urbanization and industrialization as a result of the increase of the world population increases energy consumption. Consequently, the need for energy increases day by day. The use of fossil fuels to meet the energy needs also damages the ecological balance and thus reduces the quality of human life. Because of these negative effects, new, sustainable, safe and non-polluting alternative energy sources are extremely important to search. The most remarkable renewable energy source is hydrogen energy among the alternative energy sources to fossil fuels. The fuel cells are clean and efficient electricity generating systems therefore they have been working hard in recent years. A fuel cell has three important components: anode, electrolyte and cathode. The most important (main) part of these components is the electrolyte of the ceramic fuel cell. The materials used for electrolyte in the proton conductive solid oxide fuel cell (PC-SOFC) are called proton conductive solid/ceramic oxide. Perovskite compounds (ABO3) have structure flexibility that can contain both large(A position) and small(B position) cations. They are also suitable to form void and other crystal motifs in
atomic size. Because of these properties, it can be used as a solid electrolyte in PSYH as used in many fields. In this study, electroseramics which can be used as solid electrolyte with the general formula of BaCe(1-x)MxO3 have Perovskite (ABMO3) structure which are doped in different stoichiometric ratios were synthesized by using sol-gel(Pechini) method. Where A; Barium(Ba), B; Cerium(Ce), while M is the Zirconium(Zr), Yttrium(Y) and Gadolinium(Gd) cations which settle into the lattice by doping. These synthesized materials were heat treated at three different temperatures, 900oC, 1100oC and 1300oC. Crystal structures were determined by XRD analysis on the synthesized powder materials. As a result of XRD analysis, the solid electrolytes synthesized were found to have perovskite structure.

UEMK 2019 Proceedings Book
24/25 October 2019 Gaziantep University, TURKEY 673
Keywords: Protonic Ceramic Fuel Cells, Solid Electroseramics, Perovskite, Barium Cerate. Acknowledgement:
This study is supported by the Department of Scientific Research Project of Mersin University “2019-1-TP3-3424” (Mersin, Turkey). BaCeO3 TABANLI YENİ TİP ELEKTROSERAMİKLERİN SICAKLIK VE Gd KATKI MİKTARINA BAĞLI OLARAK KRİSTAL YAPILARININ İNCELENMESİ
Çiğdem ÇELEN Fen Bilimleri Enstitüsü, Nanoteknoloji ve İleri Malzemeler Bölümü, Mersin Üniversitesi, Mersin, Türkiye [email protected] Serdar YILMAZ Fen Edebiyat Fakültesi, Fizik Bölümü, Mersin Üniversitesi, Mersin, Türkiye Fen Bilimleri Enstitüsü, Nanoteknoloji ve İleri Malzemeler Bölümü, Mersin Üniversitesi, Mersin, Türkiye [email protected] ÖZET: Dünya nüfusunun artmasının sonucu olan kentleşme ve sanayileşmedeki hızlı gelişim, enerji tüketimini arttırmaktadır. Buna bağlı olarak her geçen gün enerji ihtiyacı artmaktadır. Enerji ihtiyacını karşılamak için fosil yakıtların kullanılması ekolojik dengeye de zarar vermekte ve dolayısıyla insanın yaşam kalitesini düşürmektedir. Bu olumsuz etkilerden dolayı, yeni, sürdürülebilir, güvenli ve çevreyi kirletmeyen alternatif enerji kaynaklarının araştırılması son derece önemlidir. Fosil yakıtlara alternatif olan yenilenebilir enerji kaynakları arasında en dikkat çekici olanı Hidrojen enerjisidir. Yakıt Hücrelerinin temiz ve etkili elektrik üreten sistemler olmalarından dolayı son yıllarda
oldukça fazla çalışılmaktadır. Bir yakıt hücresinde anot, elektrolit ve katot olmak üzere üç önemli bileşen vardır. Bu bileşenler içinde en önemli (ana) kısım seramik yakıt hücresinin elektrolitidir Proton iletken katı oksit yakıt hücresinde (PC-SOFC) elektrolit için kullanılan materyallere proton iletken katı / seramik oksit denir. Perovskit bileşikler (ABO3) hem büyük (A konumu) hem de küçük (B konumu) katyonları yapısında bulundurabilecek yapı esnekliğine sahiptirler. Ayrıca boşluk oluşumuna ve atomik boyutta diğer kristal motiflerin oluşmasına elverişlidirler. Bu özelliklerden dolayı birçok alanda kullanıldığı gibi PSYH’lerde de katı elektrolit olarak kullanılabilmektedir. Bu çalışmada sol-jel (Pechini) yöntemi kullanılarak farklı stokiyometrik oranlarda katkılanmış Perovskit (ABMO3) yapılı BaCe(1-x)MxO3 genel formülüne sahip katı elektrolit olarak kullanılabilecek elektroseramikler sentezlenmiştir. Burada A; Baryum (Ba), B; Seryum iken M ise katkılama ile örgüye yerleşen Zirkonyum (Zr), Yitriyum (Y) ve

UEMK 2019 Proceedings Book
24/25 October 2019 Gaziantep University, TURKEY 674
Gadolinyum (Gd) katyonlarıdır. Sentezlenen malzemelere 900oC, 1100oC ve 1300oC olmak üzere üç farklı sıcaklıklarda ısıl işlem uygulanmıştır. Sentezlenen toz malzemelere XRD analizi yapılarak kristal yapıları tespit edilmiştir. XRD analizi sonucunda sentezlenen katı elektrolitlerin perovskit yapıda olduğu tespit edilmiştir. Anahtar kelimeler: Protonik Seramik Yakıt Hücreleri, Katı Elektroseramikler, Perovskit, Baryum Serat. TEŞEKKÜR
Bu çalışma; Mersin Üniversitesi Bilimsel Araştırma Proje Birimi tarafından (2019-1-TP3-3424) desteklenmiştir (Mersin, Türkiye).

UEMK 2019 Proceedings Book
24/25 October 2019 Gaziantep University, TURKEY 675
MINICHANNEL EVAPORATOR DESIGN FOR ELECTRONIC COMPONENTS IN COMPUTER COOLING APPLICATIONS
Mehmet Harun SÖKÜCÜ* Gebze Technical University Friterm Termik Cihazlar Inc. [email protected], [email protected]
Mustafa Fazıl SERİNCAN Gebze Technical University [email protected] Hüseyin ONBAŞIOĞLU Friterm Termik Cihazlar Inc. [email protected]
ABSTRACT: In parallel with the developments in electronic component production the heat dissipation amount of the chips has increased considerably. Electronics cooling is one of the most critical concerns in reliable operation of computers. Conventionally, some applications available for electronics cooling such as radiation, free convection, force air - liquid cooling and evaporation. Especially the cooling methods used for military applications and supercomputers need to be designed specially in order to obtain reliable operating temperatures for electronic components. Conventional cooling methods for electronic components may be inadequate in harsh operating environments. At this point, active cooling techniques may be considered such as vapor compression refrigeration (VCR) system. In this study, a vapor compression refrigeration system for computers which need powerful cooling applications have been studied for maintaining the chip surface temperature below the critical value of 85 oC. At the same time a calculation module, for evaporator optimization and design, has been developed. The minichannel evaporator design calculations were done by selecting from heat transfer and pressure drop equations from the literature. Then, the chips which generates 100 - 500 W heat power will be modeled experimentally in the test apparatus which will be formed by producing the designed evaporators. Chip surface temperatures will be measured according to constant evaporation temperature and variable condensation
capacity and the results will be compared with the generated calculation module. Key words: Computer cooling, Minichannel evaporator, Calculation module, VCR
UEMK 2019 Proceedings Book
24/25 October 2019 Gaziantep University, TURKEY 676
EFFECTS OF AIR POLLUTION ON HUMAN HEALTH AND AIR POLLUTION PROBLEM IN GAZIANTEP
Rukiye DOĞANYİĞİT Vocational School of Health Services, Gaziantep University, Gaziantep, Turkey [email protected]
ABSTRACT: Air pollution refers to a phenomenon in which pollutants that are present in various forms in the atmosphere have reached a level that harms humans and other living beings. Human beings are the main reason for this pollution. Human activities form the main source of pollutants (e.g. traffic, industry, heating systems). Natural
environment factors also have an influence on pollution, either positively or negatively. Air pollution is one of the top ten risk factors against health throughout the world, which makes it an important problem. Air pollution still exceeds safe limits worldwide, particularly in big metropolitans, despite regular monitoring facilities and measures taken. It is usually originated from industrial activities, fossil fuel use in domestic settings and vehicle exhaust emission. Although there is a decrease in air pollution in big cities of Turkey due to use of natural gas, it is still a serious health concern. In Gaziantep, because of a rapid increase in its population recently, wrong urbanization and a relative increase in industrialization, air pollution leads to dangerous levels, particularly in the winter. In the study, first of all, literature studies were conducted and the causes of air pollution and the problems caused by increasing air pollution for human and environmental health were tried to be concretized. In the study; The annual air pollution monitoring data of Gaziantep province in the recent years were examined and the level of air pollution in the province and the studies on the reduction of air pollution in the province were examined Key words: Gaziantep city, air pollutants, air pollution sources, lung health. HAVA KİRLİLİĞİNİN İNSAN SAĞLIĞI ÜZERİNE ETKİLERİ VE GAZİANTEP İLİNDE HAVA KİRLİLİĞİ SORUNU
ÖZET: Atmosferde çeşitli şekillerde bulunan kirleticilerin, insan ve diğer canlılara zarar verecek düzeye erişmesi biçiminde tanımlanan hava kirliliğinin temel sorumlusu insandır. İnsanın yaptığı beşeri faaliyetler kirleticilerin temel kaynağını (trafik, sanayi ve ısınma sistemleri vs.) oluştururken, doğal çevre faktörleri de kirliliğin etkisini olumlu

UEMK 2019 Proceedings Book
24/25 October 2019 Gaziantep University, TURKEY 677
veya olumsuz biçimde etkilemektedirler. Hava kirliliği, dünya genelinde sağlığa yönelik ilk on risk faktörlerinden olup, önemli bir sorun teşkil etmektedir. Türkiye’deki hava kalitesi de endişe verici boyutlara ulaşmıştır. Hava kirliliği düzeyleri düzenli olarak izlenmesine ve mücadele edilmesine rağmen, bütün dünyada, başta büyük metropoller olmak üzere halen kabul edilen sınırların üzerinde seyretmektedir. Kirlilik özellikle endüstriyel tesislerden, konutlarda ısınma amaçlı yakıt tüketiminden ve motorlu taşıt egzozlarından kaynaklanmaktadır. Ülkemizde doğal gaz kullanımıyla büyük kentlerde hava kirliliğinde nispeten bir gerileme olmasına rağmen, halen ciddi bir sorun olarak varlığını sürdürmektedir. Gaziantep’te son yıllarda hızlı nüfus artışı, yanlış kentleşme ve nispeten artan sanayileşme nedeniyle özellikle kış aylarında hava kirliliği ciddi boyutlara ulaşmaktadır. Çalışmada öncelikle literatür çalışması yapılarak hava kirliliğinin nedenleri, artan hava kirliliğinin insan ve çevre sağlığı için oluşturduğu sorunlar somutlaştırılmaya çalışılmıştır. Çalışmada ayrıca; Gaziantep ilinin son yıllardaki yıllık hava kirliliği izleme verileri incelenerek ilin hava kirliliği bakımından hangi düzeyde olduğu ve ilde hava kirliliğinin azaltılması konusunda yapılan çalımalar incelenmiştir. Anahtar sözcükler: Gaziantep şehri, hava kirleticileri, hava kirliliği kaynakları, akciğer sağlığı,
GİRİŞ
Çevre; insanların ve diğer canlıların yaşamları boyunca karşılıklı olarak etkileşim içinde bulunduğu, biyolojik, kimyasal, sosyal, ekonomik ve kültürel bütün faaliyetlerini devam ettirdiği bir ortamdır. Ne yazık ki bütün canlılar için önemli olan çevre, sanayinin dünyada hızla gelişmesine paralel olarak, ham madde ihtiyacının karşılanması için doğal kaynakların tüketilmeye başlanması, üretim atıklarının hızla artması ve insanların bilinçsizce doğaya zarar vermesi sonucunda hızla kirletilmeye, tahrip edilmeye kısacası yok edilmeye başlanmıştır. Günümüze gelindiğinde ise çevre sorunları ciddi problemler doğurmaya başlamış ve tüm canlı yaşamı için tehlikeli bir hal almıştır (Çay ve Çelik 2015). Çevre sorunlarının başında bütün canlıları tehdit eden hava kirliliği problemi gelmektedir. Atmosfer çok hızlı hareket eden ve akışkan dinamik bir yapı gösterdiği için istenmeyen çok sayıda madde atmosfere hızla karışmaktadır, bu karışmada İklim özelliklerinin olumlu ve olumsuz etkileri bilinmektedir (Garipağaoğlu, 2013).
Atmosferin doğal yapısında bulunan maddelerin miktarlarının yükselmesi veya yapıya yabancı maddelerin girmesi sonucunda canlı ve cansız tüm ekosistemi farklı seviyelerde olumsuz etkileyen havaya kirli hava denir. Orman yangınları, volkanik patlamalar,

UEMK 2019 Proceedings Book
24/25 October 2019 Gaziantep University, TURKEY 678
bataklıklarda anaerobik bakterilerin karmaşık organik maddeleri oluşturması esnasında ortaya çıkan karbon dioksit, metan, vb. gibi gazların atmosfere yayılması gibi doğal olaylar nedeni ile atmosfer hiç bir zaman tertemiz olmamıştır. Prehistorik devirde ateşin bulunması ile başlayan atmosferik kirlilik 20. yüzyılın ortalarından itibaren patlama noktasına varan endüstrileşme, kırsal alanlardan kentlere yönelik büyük insan göçü, hava kirlenmesi olayının boyutlarını büyütmüştür (Tufan Çetin ve Sümbül, 2010). 1. HAVA KİRLİLİĞİ
Hava kirliliği, insan sağlığı, canlı hayatına zarar verecek, eşya ve malzemelerin bozulmalarına, ekolojik dengenin bozulmasına neden olabilecek düzeyde katı, sıvı veya gaz formundaki kirleticilerin atmosferde bulunmasıdır. Hava kirliliği, volkanik aktiviteler, orman yangınları, depremler ve bataklıklar gibi doğal nedenlerle oluşabildiği gibi, sanayileşme, ısınma, ulaşım ve enerji üretimi gibi insan aktivitelerine bağlı da oluşabilmektedir. Nüfus artışı ve buna bağlı olarak artan şehirleşme ve sanayileşme eğilimi hava kirliliği sorununu beraberinde getirmektedir. Kuraklık, topoğrafik koşullar ve iklimsel özellikler de hava kirliliğinin düzeyini etkilemektedir (TMMOB Çevre Mühendisleri Odası, 2018). Endüstriler ve enerji santralleri, yüksek miktarda Partikül Madde (PM), Azot Oksitler (NOx), Kükürt dioksit (SO2), karbon monoksit (CO), Hidrokarbonlar (HC), organik bileşik ve diğer kimyasalların atmosfere salınmasına ve hava kalitesinin azalmasına neden olur. Bu tesisler sadece yerel düzeyde insan ve çevre sağlığına zarar vermekle kalmaz, aynı zamanda bölgesel ölçekte asit yağmurları, ozon oluşumuna, ya küresel ölçekte ise iklim değişikliğine neden olarak dünyanın geleceği için yıkıcı sonuçlara sebep olabilir. Endüstriyel tesislerin enerji üretimi veya ürün prosesi sırasında hava kirliliğine neden olabilen kirletici emisyonları oluşabilmektedir. Enerji üretimindeki hava kirliliğinin en büyük aktörü fosil yakıt kullanımıdır. 19. yüzyıldan beri kullanılmakta olan fosil yakıtlar insan ve çevre sağlığı açısından büyük tahribata neden olmuştur. Enerji ihtiyacı ulaşım sektöründe de kendini göstermektedir. Hava, deniz ve kara ulaşımı için gereken enerjinin çok büyük kısmı halen fosil yakıtlardan karşılanmaktadır. OECD verilerine göre, Türkiye’deki enerji ihtiyacının %88’i fosil yakıtlardan sağlanmaktadır (OECD, 2019) Ulusal Hava Kalitesi İndeksi, EPA (Amerika Birleşik Devletleri Çevre Koruma Ajansı) Hava Kalitesi İndeksinin ulusal mevzuatımız ve sınır değerlerimize uyarlanması sonucu oluşturulmuştur. 5 temel kirletici için hava kalitesi indeksi hesaplanmaktadır. Bunlar; partikül maddeler (PM10), karbon monoksit (CO), kükürt dioksit (SO2), azot dioksit (NO2) ve ozon (O3) dur.

UEMK 2019 Proceedings Book
24/25 October 2019 Gaziantep University, TURKEY 679
1.1 Hava Kirliliğine Neden Olan Faaliyetler
İç ya da dış ortamda soluduğumuz havanın, kimyasal, fiziksel veya biyolojik ajanlar ile doğal özelliğinin bozulması olarak tanımladığımız hava kirliliğini genel olarak iki ana nedenden dolayı ortaya çıkmaktadır. Birincisi doğal kökenli kirliliktir. Burada en temel havayı kirleten kaynak, çöl tozları, volkanik patlamalar sonucunda ortaya çıkan toz, deniz tuzu gibi doğal kaynaklardan köken alan çoğunlukla toz ya da daha teknik olarak ifade etmek gerekirse partikül madde kirliliğidir. Bu kaynaklardan oluşan toz bulutları atmosfere karışmakta ve rüzgar ile uzak mesafelere kadar taşınabilmektedir.
İkincisi ise insan kaynaklı kirliliktir (Antropojenik kaynaklı). Ulaşım, sanayi ve santrallerde enerji üretimi için kullanılan fosil yakıtlar, madencilik tesisleri ve endüstriyel tesisler, evlerde ısınma ve yemek yapma amaçlı kömür ve odun yakılması, inşaat faaliyetleri ve yollardan kaynaklanan tozlar, atık ve anızların yakılması, bazı endüstriyel tarım faaliyetleri gibi insanların faaliyetleri sonucunda ortaya çıkan hava kirliliği de insan kaynaklı nedenlerdir.
Özellikle sanayiden kaynaklanan kirleticiler; iklim değişikliği ve asit yağmurlarının yanı sıra ciddi sağlık sorunlarına da neden olurlar. Bacalardan çıkan ve saç telinden daha ince olduğundan göremediğimiz partikül maddeler kana karışarak sağlık sorunlarına neden olmaktadır (Anonim 2019a).
1.2 Partikül Maddeler
PM 2.5 sağlık açısından çok tehlikelidir çünkü solunduğunda akciğerler içindeki gaz alışverişi ile kana karışabilir.
Partikül maddeler (birincil partikül maddeler) kirlilik oluşturan kaynaklardan doğrudan havaya yayılabilir veya atmosferik olaylar sonucunda sanayi kaynaklı diğer gazlarla birleşerek ikincil partikül maddeler ortaya çıkabilir ve hava hareketleriyle kilometrelerce uzaklara taşınabilir. Saç telinden bile ince olan ve (2,5-10) mikrometre çapındaki partikül maddelerin temel kaynakları sanayi tozları, topraktan kaynaklanan tozlar (çiftçilik, madencilik, yollar vb.), inşaat ve yıkım, kömür ve petrol yanması, okyanus spreyi ve biyolojik kaynaklardır
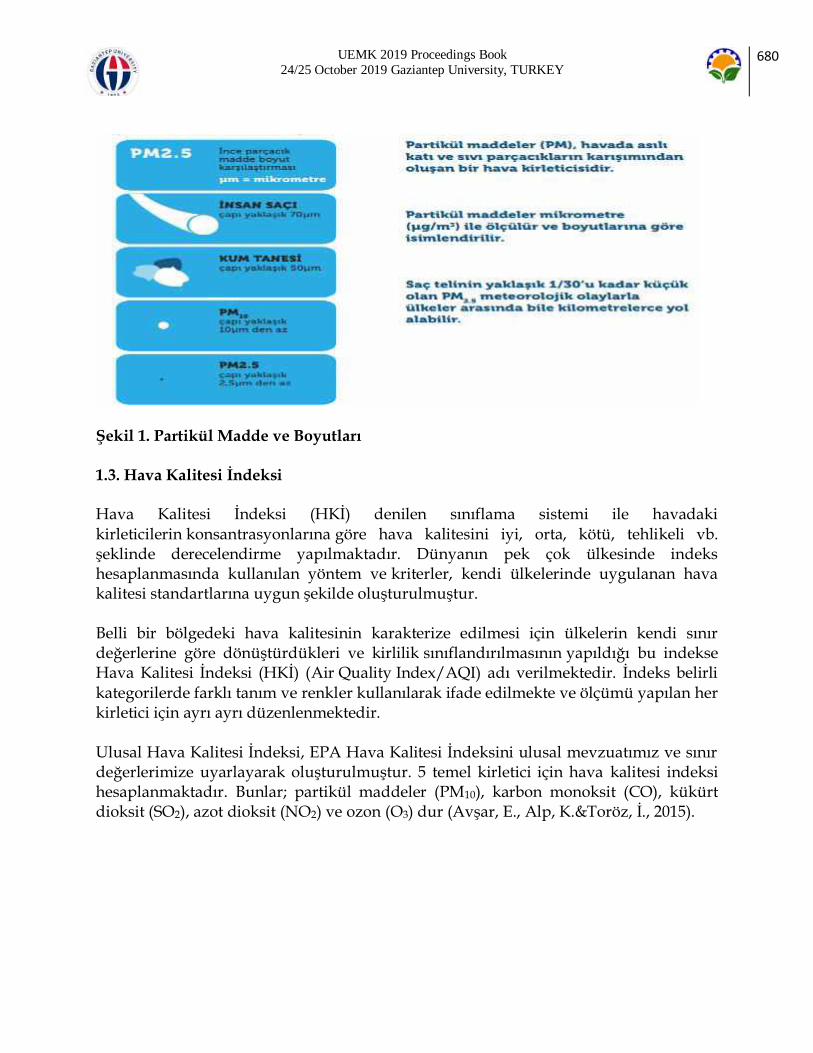
UEMK 2019 Proceedings Book
24/25 October 2019 Gaziantep University, TURKEY 680
Şekil 1. Partikül Madde ve Boyutları
1.3. Hava Kalitesi İndeksi
Hava Kalitesi İndeksi (HKİ) denilen sınıflama sistemi ile havadaki kirleticilerin konsantrasyonlarına göre hava kalitesini iyi, orta, kötü, tehlikeli vb. şeklinde derecelendirme yapılmaktadır. Dünyanın pek çok ülkesinde indeks hesaplanmasında kullanılan yöntem ve kriterler, kendi ülkelerinde uygulanan hava kalitesi standartlarına uygun şekilde oluşturulmuştur. Belli bir bölgedeki hava kalitesinin karakterize edilmesi için ülkelerin kendi sınır değerlerine göre dönüştürdükleri ve kirlilik sınıflandırılmasının yapıldığı bu indekse Hava Kalitesi İndeksi (HKİ) (Air Quality Index/AQI) adı verilmektedir. İndeks belirli kategorilerde farklı tanım ve renkler kullanılarak ifade edilmekte ve ölçümü yapılan her kirletici için ayrı ayrı düzenlenmektedir. Ulusal Hava Kalitesi İndeksi, EPA Hava Kalitesi İndeksini ulusal mevzuatımız ve sınır değerlerimize uyarlayarak oluşturulmuştur. 5 temel kirletici için hava kalitesi indeksi hesaplanmaktadır. Bunlar; partikül maddeler (PM10), karbon monoksit (CO), kükürt dioksit (SO2), azot dioksit (NO2) ve ozon (O3) dur (Avşar, E., Alp, K.&Toröz, İ., 2015).

UEMK 2019 Proceedings Book
24/25 October 2019 Gaziantep University, TURKEY 681
Tablo 3. EPA Hava Kalitesi indeksi
Tablo 4. Ulusal Hava Kalitesi İndeksi Kesme Noktaları
Tablo 5. İndeks Hesaplanan Parametrelerin Sınır Değerleri
06.06.2008 tarih ve 26898 Resmi Gazetede yayımlanan Hava Kalitesi Değerlendirme ve Yönetimi Yönetmeliğin Hava Kalitesi Değerlendirme ve Yönetimi Yönetmeliğine göre kirleticiler ve limit değerleri Tablo 6’da gösterilmiştir.
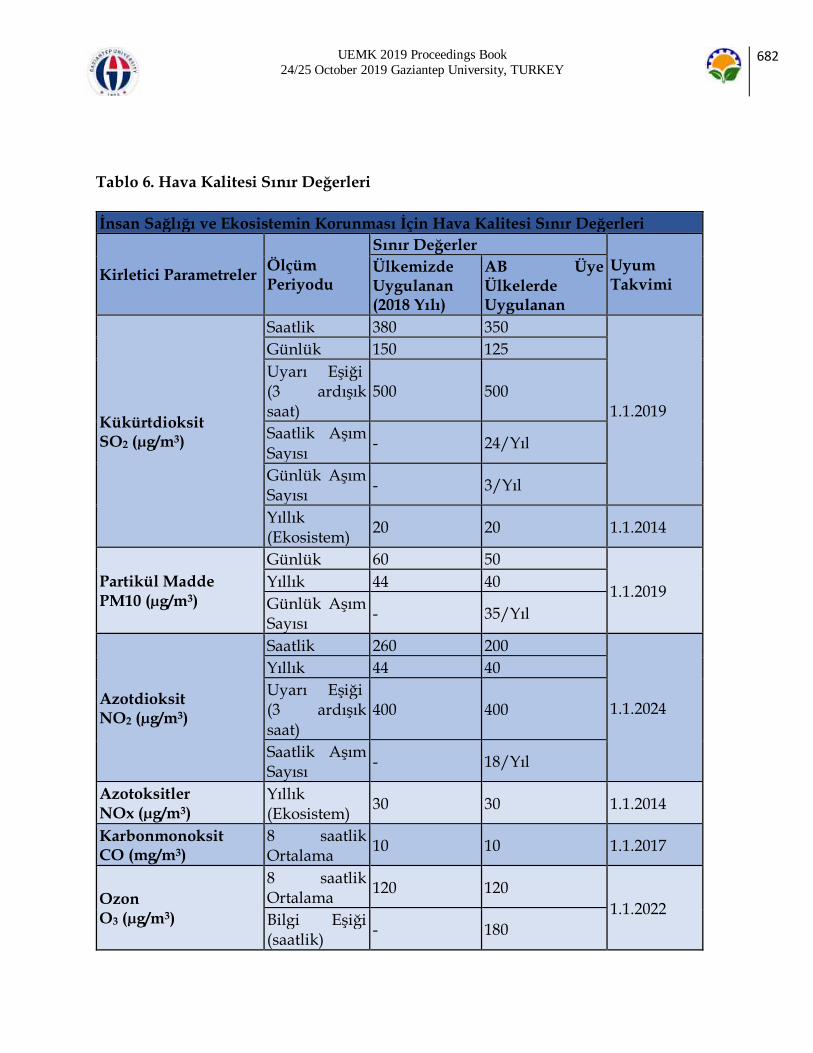
UEMK 2019 Proceedings Book
24/25 October 2019 Gaziantep University, TURKEY 682
Tablo 6. Hava Kalitesi Sınır Değerleri
İnsan Sağlığı ve Ekosistemin Korunması İçin Hava Kalitesi Sınır Değerleri
Kirletici Parametreler Ölçüm Periyodu
Sınır Değerler
Uyum Takvimi
Ülkemizde Uygulanan (2018 Yılı)
AB Üye Ülkelerde Uygulanan
Kükürtdioksit SO2 (µg/m3)
Saatlik 380 350
1.1.2019
Günlük 150 125
Uyarı Eşiği (3 ardışık saat)
500 500
Saatlik Aşım Sayısı
- 24/Yıl
Günlük Aşım Sayısı
- 3/Yıl
Yıllık (Ekosistem)
20 20 1.1.2014
Partikül Madde PM10 (µg/m3)
Günlük 60 50
1.1.2019 Yıllık 44 40
Günlük Aşım Sayısı
- 35/Yıl
Azotdioksit NO2 (µg/m3)
Saatlik 260 200
1.1.2024
Yıllık 44 40
Uyarı Eşiği (3 ardışık
saat)
400 400
Saatlik Aşım Sayısı
- 18/Yıl
Azotoksitler NOx (µg/m3)
Yıllık (Ekosistem)
30 30 1.1.2014
Karbonmonoksit CO (mg/m3)
8 saatlik Ortalama
10 10 1.1.2017
Ozon O3 (µg/m3)
8 saatlik Ortalama
120 120
1.1.2022 Bilgi Eşiği (saatlik)
- 180

UEMK 2019 Proceedings Book
24/25 October 2019 Gaziantep University, TURKEY 683
Uyarı Eşiği (saatlik)
- 240
Benzen C6H6 (µg/m3)
Yıllık 8 5 1.1.2021
Kurşun Pb (µg/m3)
Yıllık 0.6 0.5 1.1.2019
Arsenik As (ng/m3)
Yıllık - 6 1.1.2020
KadmiyumCd (ng/m3) Yıllık - 5 2.1.2020
Nikel Ni (ng/m3)
Yıllık - 20 3.1.2020
Benzoapiren B(a)p (ng/m3)
Yıllık - 1 4.1.2020
2. GAZİANTEP İLİNDE HAVA KİRLİLİĞİ KONUSUNDA YAPILAN ÇALIŞMALAR
Gaziantep nüfusu ve endüstrisi hızla büyüyen büyük şehirlerimizden birisidir. İlde son 35 yılda kaydedilen hızlı değişim, tarihi ve kültürel zenginliğinin yanı sıra, bilim ve teknolojik gelişmelere açık bir kent olarak da adından söz ettirmektedir. İldeki nüfus artışı, sanayileşme ve teknolojik gelişmelere paralel olarak Hava Kalitesinde de doğal olarak değişim yaşanmaktadır. Bölgede hava kirliliği konusunda Çevre ve Şehircilik Bakanlığı ve taşra teşkilatının yaptığı çalışmalarla üniversitelerde yapılan araştırma ve tez çalışmaları bulunmaktadır.
Bu kapsamda yapılan en geniş kapsamlı çalışmalardan biri “Kentlerde Hava Kalitesi Değerlendirme Sisteminin Geliştirilmesi (KENTAIR)” projesi kapsamında hazırlanan hava kalitesi değerlendirme raporlarıdır. Proje kapsamında, ön değerlendirmesi yapılan 7 ilden Adana, Gaziantep ve Mersin için çalışmalar yapılarak rapor hazırlanmıştır. Bu raporlarda kentin emisyon envanteri ısınma, sanayi ve trafik emisyonları için çıkarılmış, mevcut hava kalitesi değerlendirmeleri yapılmış ve öneriler getirilmiştir. Gaziantep Belediyesi, Gaziantep Kent Konseyi tarafından hazırlanan Gaziantep İli Hava Kirliliği Değerlendirme Raporu’nda ilin emisyon kaynakları tanımlanarak hava kalitesi ölçüm istasyonu verileri değerlendirilmiş ve çözüm önerileri sunulmuştur. Yapılan çalışma neticesinde elde edilen verilere göre Gaziantep’teki hava kirliliğinin öncelikli sebebinin ısınmadan kaynaklandığı, ikincil sebebinin motorlu taşıtlar olduğu belirlenmiştir. Ancak, ölçüm verilerine göre yönetmeliklerde belirtilen sınır değerlerin aşılmadığı görülmektedir. Çalışmada çözüm önerisi olarak, trafik kaynaklı emisyonlar için taşıtların emisyon ölçümlerinin gerçekleştirilesi ve bakımlarının zamanında yapılması, kısa mesafelerde araç kullanılmamasının, uzun mesafelerde toplu taşımanın

UEMK 2019 Proceedings Book
24/25 October 2019 Gaziantep University, TURKEY 684
özendirilmesi, ısınma kaynaklı emisyonlarda kaliteli yakıt kullanılması ve temiz enerji kaynaklarına (rüzgar, güneş enerjisi vb.), sanayi kaynaklı emisyonlarda sanayicilerin bilinçlendirilmesi ve denetim ve kontrollerin sık ve standartlara uygun olarak yapılması sunulmuştur. 2.1. Gaziantep İli Hava Kalitesi Ve Ölçüm İstasyonu Verilerinin Değerlendirilmesi
Gaziantep İlinde 1 adet sabit hava kalitesi izleme istasyonu bulunmakta olup, istasyonda sürekli olarak kükürt dioksit (SO2) ve partiküller madde (PM10) parametreleri otomatik cihazla ölçülmektedir ve saatlik ortalama değerler olarak alınmaktadır. İstasyonda ölçülen değerler öncelikle elektronik ağ sistemi sayesinde Çevre ve Şehircilik Bakanlığının veri toplama merkezine iletilmekte olup buradan da İl Müdürlüğünde de bulunan bilgisayar ve modem aracılığı ile bilgiler elektronik ortama aktarılmakta ve istenildiği zaman ulaşılabilecek nitelikte depolanmaktadır. Bu ölçümlere ait saatlik, günlük, haftalık ve aylık verilerin internet sitesinden www.havaizleme.gov.tr adresinden izlenmesi mümkündür.
Şekil 2. ve 3. Gaziantep Temiz Hava eylem Planı ve Gaziantep Hava Kalitesi Ölçüm İstasyonu

UEMK 2019 Proceedings Book
24/25 October 2019 Gaziantep University, TURKEY 685
Tablo 7. Gaziantep İlinde Son Dokuz Yıllık Hava Kalitesi Ölçüm Değerleri
Şekil 4. ve 5. İl Genel Kirletici Dağılımı ve Kirleticilerin İl Genelinde Dağılım
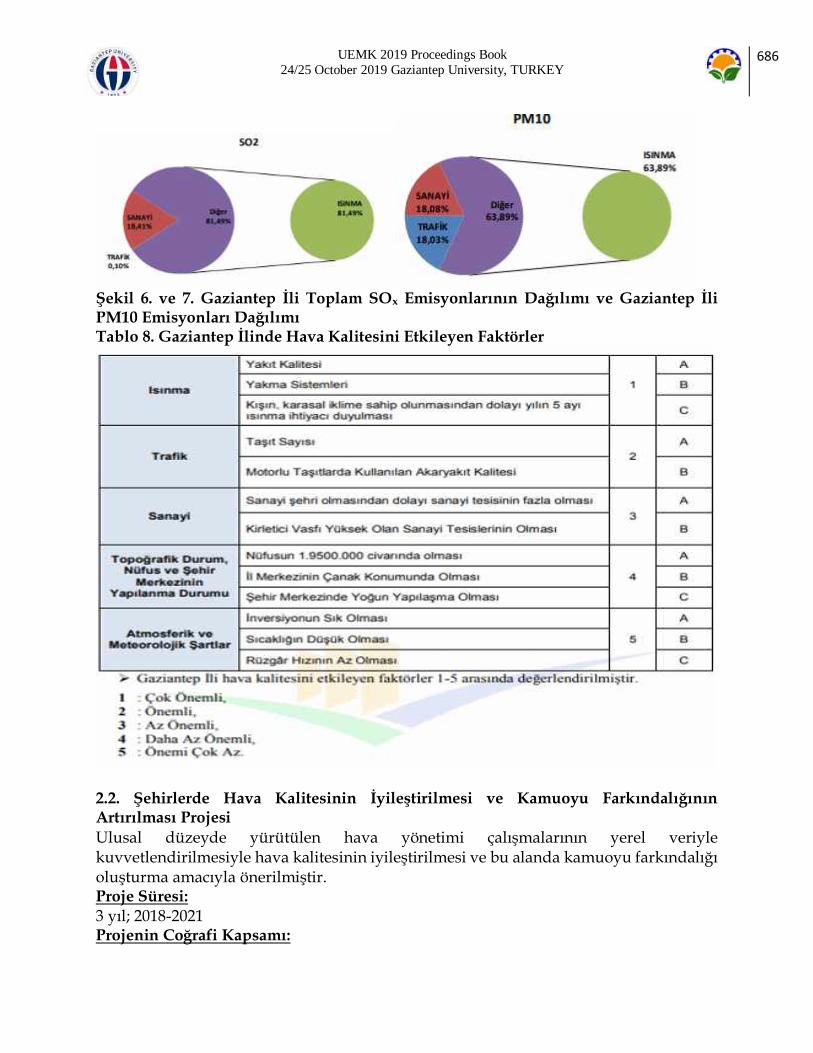
UEMK 2019 Proceedings Book
24/25 October 2019 Gaziantep University, TURKEY 686
Şekil 6. ve 7. Gaziantep İli Toplam SOx Emisyonlarının Dağılımı ve Gaziantep İli PM10 Emisyonları Dağılımı Tablo 8. Gaziantep İlinde Hava Kalitesini Etkileyen Faktörler
2.2. Şehirlerde Hava Kalitesinin İyileştirilmesi ve Kamuoyu Farkındalığının Artırılması Projesi
Ulusal düzeyde yürütülen hava yönetimi çalışmalarının yerel veriyle kuvvetlendirilmesiyle hava kalitesinin iyileştirilmesi ve bu alanda kamuoyu farkındalığı oluşturma amacıyla önerilmiştir. Proje Süresi:
3 yıl; 2018-2021 Projenin Coğrafi Kapsamı:

UEMK 2019 Proceedings Book
24/25 October 2019 Gaziantep University, TURKEY 687
Aydın, Denizli, İzmir, Manisa, Muğla, Uşak, Adana, Gaziantep, Hatay, Kahramanmaraş, Kilis, Mersin, Osmaniye, Amasya, Çorum, Giresun, Ordu, Samsun, Sinop, Sivas, Tokat, Afyon, Aksaray, Antalya, Burdur, Isparta, Karaman, Kayseri, Konya, Nevşehir ve Niğde Proje Başlangıç Tarihi:
17 Aralık 2018 Proje Kapsamında:
AB Direktifleri ile uyumlu olacak şekilde yerel veriyle birlikte ulusal emisyon envanteri raporlama kapasitesi artacaktır.
Tüm paydaşların emisyon senaryoları, hava kalitesi modelleri, sektörel emisyon yönetim stratejileri konularında bilgi birikimleri artacaktır.
Hava kirliliği ile mücadele yöntemleri konusunda kapasite arttırılacaktır.
Kamuoyunun ve özellikle vatandaşlarımızın hava kalitesine ilişkin farkındalığı arttırılacaktır.
Çevre ve Şehircilik Bakanlığının mevcut Hava Emisyon Yönetimi (HEY) Portalı için teknolojik gelişmeler ve diğer uygulama örnekleri ile sokak düzeyinde hava kalitesi modelleme çalışmaları için kapasite geliştirilmiş olacaktır.
31 ilin Temiz Hava Eylem Planları güncellenecektir. 3. HAVA KİRLİLİĞİNİN İNSAN SAĞLIĞI ÜZERİNE ETKİLERİ
Hava kirliliğinin yaygınlaşarak, bir halk sağlığı sorunu haline gelmesinin en önemli nedenleri kentleşme, ulaşım ve sanayileşmedir. Bu üç kaynak bir kısır döngü içinde birbirlerini etkilemektedir. Sanayileşmeyle birlikte endüstriyel tarım uygulamalarına geçiş kırsal işsizliği artırmış ve böylece kırdan kente göçü hızlanmıştır. Bunun bir sonucu olarak da kent büyüdükçe yaşayan insan sayısı artmakta, kentin konuşlandığı alan
genişlemekte, ısınma kaynaklı kirletici miktarı artmaktadır. Kent büyüdükçe, buna bağlı olarak ulaşım ağı genişlemekte, araç sayısı artmakta, trafik yoğunlaşmakta kimi zaman çok yavaşlayıp durabilmekte, kullanılan yakıt miktarı ve egzoz emisyonları artmaktadır. Her üçünün birlikte artışı ise hava kirliliğinin yoğunlaşmasıyla sonuçlanmaktadır. (OECD, 2019) Dünya Sağlık Örgütü (DSÖ) verilerine göre dünyada her yıl toplam 8 milyon insan iç ve dış ortam hava kirliliğinin yol açtığı hastalıklar nedeniyle erken ölmektedir. Bu ölümlerin 4,2 milyonu temelde sanayi, trafik ve ısınma kaynaklı dış ortamdaki hava kirliliği; 3,8 milyonu ise evin içinde yemek ve ısınma için yakılan yakıtlardan kaynaklanan iç ortam kirliliğine bağlı gerçekleşmektedir. Türkiye’de de her yıl 34 binden fazla kişinin hava kirliliği nedeniyle erken öldüğü tahmin edilmektedir. Erken ölenlere başta akciğer kanseri olmak üzere hava kirliliğine bağlı olarak hastalananları, hastanede yatanları, ilaç kullananları ve işlerinden alıkonanları da ekleyecek olursak, hava kirliliğinin ülkemize maliyeti çok yüksektir.

UEMK 2019 Proceedings Book
24/25 October 2019 Gaziantep University, TURKEY 688
Ortalama ağırlıkta bir insanın, ciğerlerinden her gün 12 m3’ten (yaklaşık 15 kilogramdan) fazla hava geçmektedir. Bu miktar kişinin yaşına ve fiziksel aktivitesine göre farklılık göstermektedir. Solunumun kalitesi, insan metabolizmasının fonksiyonlarını yerine getirmede büyük bir etkendir. Her yıl 3,7 milyon kişi hava kirliliğin etkileri nedeniyle ölmekte ve bu tüm ölümlerin yüzde 5’ini oluşturmaktadır (Anonim, 2019b). Hava kirliliğinin sağlık etkisi öksürük ve bronşitten, kalp hastalığı ve akciğer kanserine kadar değişmektedir. Kirliliğin olumsuz etkileri sağlıklı kişilerde bile gözlenmekle birlikte, bazı hassası gruplar daha kolay etkilenmekte ve daha ciddi sorunlar ortaya çıkmaktadır. Bu gruplardan biri yaşlılardır. Fizyolojik kapasitesi ve fizyolojik savunma mekanizması fonksiyonlarındaki azalma, kronik hastalıklardaki artma sebebiyle yaşlılar normal yaş gurubundaki halka nazaran hava kirliliğinden daha kolay etkilenmektedir. Küçük çocuklar, savunma mekanizması gelişiminin tamamlanmaması, vücut kitle birimi başına daha yüksek ventilasyon (soluk alıp verme) hızları ve dış ortamla daha sık temas sebebiyle daha fazla riske sahip diğer bir hassas gruptur. Yaş durumunun yanı sıra hava yolunda daralmaya yol açan hastalıklar da kirleticilere hassasiyeti artırmaktadır (Anonim 2016). 3.1 Solunum Sistemi Üzerine Etkileri
Etkiler şunları içerir: solunum bulgularında, enfeksiyonlarda artış; hava yolu tepkilerinde ve tahrişinde artış; akciğer iltihabı; solunumla ilişkili ölümlerde, hastane başvurularında ve hastanede tedavilerde artış; akciğer fonksiyonlarında azalma, astım atakları, kronik tıkayıcı akciğer hastalığında (KOAH) alevlenme ve akciğer kanseri riskinde artış gözlenmektedir. Hava kirliliğine maruz kalma, yeni astım vakalarını tetikleyebilir; önceden var olan solunum hastalıklarını kötüleştirebilir ve aralarında KOAH, amfizem ve akciğer kanserinin de yer aldığı kronik hastalıkların gelişmesini veya ilerlemesini tetikleyebilir. KOAH, normal solumayı engelleyen ve yaşam tehdidi oluşturan bir akciğer hastalığıdır. 3.2 Kardiyovasküler Sistem Üzerine Etkileri
Etkiler şunları içerir: kalbin otonomik fonksiyonunda bozulma, kalp krizi (miyokard enfarktüsü), kalp kaynaklı göğüs ağrısı (angina pektoris); yükselmiş kan basıncı, damar sertleşmesi, hipertansiyon ve serebrovasküler iskemide artış gözlenmektedir. Son yıllarda, farklı hava kirleticilerine maruz kalma ve kardiyovasküler etkiler arasında
akut ve/veya kronik sonuçlar açısından- bağlantıyı güçlendiren önemli miktarda bilimsel kanıt ortaya konmuştur. 3.3 Sinir Sistemi Ve Serebrovasküler Sistem Üzerine Etkileri

UEMK 2019 Proceedings Book
24/25 October 2019 Gaziantep University, TURKEY 689
Etkiler şunları içerir: nörogelişimsel hastalıklar, nöroinflamasyon,oksidatif stres, kan-beyin bariyerinde değişimler, baş ağrıları, anksiyete, inmeler, Alzheimer hastalığı ve Parkinson hastalığı. Hava kirliliği bileşenlerinin karışımı, atmosfere yayılan cıva veya kurşun gibi ağır metaller de içerir. Bu metaller, yağmurla tekrar toprağa iletilene dek havada kalırlar. Ağır metallerin birçoğu insan vücudu ve özellikle çocuklar için nörotoksiktir. 3.4 Üreme Kapasitesi ve Çocuk Sağlığı Üzerine Etkileri
Etkiler şunları içerir: sperm kalitesinde düşüş, DNA parçalanması, düşük doğum ağırlığı, erken doğum ve gebelik yaşına göre küçük bebek doğumları. Embriyo gelişiminde plasenta, çevresel açıdan tehlikeli birçok maddeye karşı bir bariyer olarak görev yapar; ancak hava kirliliğinin tüm bileşenlerine karşı koruyucu olamayabilir. Özellikle çocuklar, doğum öncesinde bile hava kirliliğine duyarlıdır. Sayıları giderek artan kanıtlar, yaşamın erken dönemlerinde hava kirliliğine maruz kalmanın, ileri yıllarda aralarında obezite, diyabet, göğüs ve prostat kanseri gibi hormonlarla ilintili kanserlerin de bulunduğu kronik hastalıklar geliştirme riskini artırdığını göstermektedir (Anonim 2015). Tablo 1. Hava Kirleticileri ve Sağlık Etkileri
Kaynak: ÇMO (2019), Hava Kirliliği Raporu 2018

UEMK 2019 Proceedings Book
24/25 October 2019 Gaziantep University, TURKEY 690
Şekil 2. ve 3. Hava Kirliliğinin Neden Olduğu Sağlık Sorunları (Dünya Sağlık Örgütü Hava Kirliliği Raporu/ 2016) ve Hava Kirleticilerinin Şematik Olarak Gösterilmesi
4. HAVA KİRLETİCİLERİNİN İNSAN SAĞLIĞI ÜZERİNE ETKİLERİ
Partikül Madde (PM10, PM2.5): Havadaki partikül madde insan sağlığını etkileyen en önemli kirleticilerden biridir. Partikül boyutu ile sağlık üzerindeki olumsuz etkisi doğrusal olarak bağlantılıdır.
PM’nin 10 μM’den büyük kısmı burun ve nazofarenkste tutulmaktadır.10 μM’den küçük kısmı bronşlarda birikirken 1-2 mikron çapındakiler alveollerde 0,1 mikron çapında olanlar ise alveollerden intrakapiller aralığa diffüze olmaktadır. Partikül maddeler civa, kurşun, kadmiyum gibi ağır metaller ile kanserojenik kimyasalları bünyelerinde bulundurabilmekte ve sağlık üzerinde önemli tehdit oluşturabilmektedirler.
Ozon (O3): Ozon suda çözünmediğinden solunum sisteminin derinliklerine ulaşarak, akciğerlerdeki olumsuz etkilerini gösterir. Azot Oksitler (NOx): Azot oksitler (NOx) yüksek sıcaklıklarda (1200°C) oluşan pek çok türü renksiz ve kokusuzdur ve suda erimezler. Bu nedenle üst solunum yollarında elimine edilmeden solunum yollarının en uç noktalarına kadar inhale edilir ve buralarda olumsuz etkilerini gösterirler.
Kükürt dioksit (SO2): Renksiz, yanmayan ve parlamayan bir gazdır. Burun ve farenkste irritasyona, ana hava yollarında spazma yol açabilir. Bu gaz suda çözüldüğünden, solunum yollarında uç noktalarına ulaşmadan büyük ölçüde burun ve farenkste elimine edilir. Karbonmonoksit (CO): Renksiz, kokusuz bir gazdır ve yakıtlardaki karbon tam olarak yanmadığında oluşur. CO alveolar-kapilar membranda kolayca difüzyona uğrayarak hemoglobine bağlanarak kanda COHb oluşmasına yol açar. CO, O2’ye oranla

UEMK 2019 Proceedings Book
24/25 October 2019 Gaziantep University, TURKEY 691
Hemoglobine 200 kat daha kuvvetli bağlanır. Bundan dolayı da dokulara O2 taşınmasını engelleyerek boğulmalara yol açar. Uçucu Organik Bileşikler (UOB): Bu sınıfa çok sayıda kimyasal girer ve 300’ün üzerinde türü bulunmaktadır. Benzen, toluen, etilbenzen, ksilen, stiren en fazla sağlık riski oluşturan türlerdir. Kısa ve uzun dönemli olumsuz sağlık etkileri vardır. Hidrokarbonlar: Yakıtların tam yanmaması sonucu ortaya çıkmasından dolayı CO2’ye benzerler. Normal bulundukları düzeyde toksik etkileri gösterilememiştir.
Kurşun (Pb): Hava kirliliğine yol açan en önemli metaldir. Kurşun özellikle çocuklarda daha ciddi zehirlenmelere yol açmaktadır. Anemi, zeka geriliği ve davranış problemlerine neden olması yönünden önemlidir (Anonim 2019c). 2.3. HAVA KİRLİLİĞİNE KARŞI ALINABİLECEK ÖNLEMLER
Hava kirliliğinin yoğun olduğu büyük illerimizde kaliteli ve temiz linyitin yakılması için gerekli tedbirler alınmalıdır. Kentsel ısınmada doğal gazın kullanımının artırılması ve yoğun hava kirliliği yaşanan illerimize doğal gazın götürülmesi gerekmektedir. Yakıtların tekniğe uygun olarak yakılabilmesi için kazanın, yakıtın yanma özelliğine göre standartlarına uygun olarak üretilmesi ve uygun yanma şartlarının sağlanması gerekmektedir. Kazan yakıcıların periyodik zamanlarda eğitilerek, uygun yakma kurallarını öğrenmeleri sağlanmalıdır. Büyük ısıtma sistemlerine filtre takma zorunluluğu getirilmelidir. Sadece uçucu kül için elektrofiltre bulunan termik santrallere desülfürizasyon tesislerinin de zorunlu olarak kurdurulması sağlanmalıdır. Bina projelerinde, baca ve kazanın konacağı yer standartlara uygun olmalı ve ısı yalıtımına önem verilmelidir. SONUÇ
Ülkemizde hava kirliliği genel olarak ısınma, sanayi, madencilik ve motorlu taşıtlardan kaynaklanmaktadır. Bunların yanında büyük şehirlerimizde çarpık kentleşme, şehirlerin topografik yapısı, atmosferik şartlar ve meteorolojik parametreler, bina ve nüfus yoğunluğu gibi etkenler de özellikle kış sezonunda kirliliğin artmasına katkıda bulunmaktadır. Sınır değerlerin üzerinde konsantrasyona sahip olan kirleticilerin, insanlar ve çevre üzerinde olumsuz etkileri vardır (Anonim, 2017a). Bu olumsuz etkileri en aza indirmek amacı ile yasal düzenlemere uyulması, hava kalitesinin korunması, halkın bilgilendirilmesi, çözümlerin üretilebilmesi ve gerekli

UEMK 2019 Proceedings Book
24/25 October 2019 Gaziantep University, TURKEY 692
önlemlerin alınması bakımından Hava kalitesinin doğru bir şekilde belirlenmesi büyük önem taşımaktadır. Hava kirliliğinin ölçülmesi, tüm illerde hava kirliliği politikaları oluşturulması ve bu politikalar çerçevesinde illerin hava kalitesinin bir önceki yılın değerlerinden daha iyi durumlara getirilebilmesi amacıyla, Çevre ve Şehircilik Bakanlığı toplam 199 istasyondan oluşan Ulusal Hava Kalitesi İzleme Ağı oluşturmuştur. Bu istasyonlarının tamamında kükürtdioksit (SO2) ve partikül madde (PM10) parametreleri, bazılarında ise partikül madde (PM2.5), azotoksitler (NO, NO2, NOX), karbonmonoksit (CO) ve ozon (O3) miktarı ölçülmektedir (Anonim, 2017a). Kirleticilerden insanların olumsuz yönde etkilenmemesi için en kısa sürede kirlilik seviyesinin bilinerek eyleme geçilmesi amacı ile ölçümler tam otomatik yöntemlerle yapılmakta ve sürekli olarak hava kalitesinin izlenmesi ve halkın bilgilendirilmesi sağlanmaktadır. KAYNAKLAR
Anonim 2015. Türkiye’de Hava Kirliliği ve Sağlık Gerçekler, Veriler Ve Öneriler, Yayın Tarihi: Şubat 2015. Bu bilgi broşürü, Türkiye’den aşağıdaki hekim ve uzmanlık derneklerinin işbirliği ile yayınlanmıştır. Anonim 2016. Gaziantep Temiz Hava Eylem Planı 2016-2019, Gaziantep Çevre Şehircilik İl Müdürlüğü. Anonim 2019a. Toraks. https://www.toraks.org.tr/ halk/News Anonim 2019b. https://www.who.int/airpollution/en/ Anonim 2019c. https://hsgm.saglik.gov.tr/tr/(Erişim Tarihi:30.09.2019). Avşar, E., Alp, K.&Toröz, İ. 2015. Balıkesir İli Burhaniye İlçesi (İskele Mahallesi) Hava Kalitesinin Değerlendirilmesi. BEÜ Fen Bilimleri Dergisi. 4(1), 68-82
Çay, Y.& ÇELİK, E. (2015). Hava Kirliliğinin Doğal Gaz Kullanımı İle Değişimi, Sakarya İli Örneği, Akademik Platform, 1497-1504, ISITES Valencia –SPAİN Çetin, T.Ö. & Sümbül, H. (2010). Hava kirliliğinin belirlenmesinde likenlerin kullanımı. Mehmet Akif Ersoy Üniversitesi Fen Bilimleri Enstitüsü Dergisi. 2: 73-85. Garipağaoğlu, N. (2013). Tokat’ın Hava Kalitesinin Zamanla Değişimi ve Karadeniz Bölgesi İçerisindeki Durumu, Tokat Sempozyumu 1-3 Kasım 2012 Tokat Bildiriler Kitabı. Cilt:
II s.9-32, Özyurt Matbaacılık, Ankara. OECD. (2019, Şubat 1). OECD Çevresel Performans İncelemeleri Türkiye 2019. TMMOB Çevre Mühendisleri Odası (2018). Hava Kirliliği Raporu, Çevre ve Şehircilik İl Müdürlüğü, (2017). Hava Kirliliği Verileri, Kırıkkale.

UEMK 2019 Proceedings Book
24/25 October 2019 Gaziantep University, TURKEY 693
OBSERVATION OF PRIMARY PARAMETERS IN TWO-STAGE ANAEROBIC DIGESTERS UNDER UNSTEADY-STATE CONDITION
Merve AKCAKAYA Environmental Engineering Department, Middle East Technical University [email protected]
Sera TUNCAY Environmental Engineering Department, Middle East Technical University [email protected] Bulent ICGEN Environmental Engineering Department, Middle East Technical University [email protected]
ABSTRACT: Anaerobic digestion is a common sludge treatment method to produce biogas by microorganisms. Anaerobic digestion takes place through four stages as hydrolysis, acidogenesis, acetogenesis and methanogenesis. In single-stage anaerobic digesters, process failures often occur due to accumulation of volatile fatty acids. To overcome these problems, physical separation of acidogenesis and methanogenesis phase has led to the emergence of two-stage anaerobic digesters. Due to the complexity of the bioconversion processes, there are many factors affecting the performances of an anaerobic digesters. Those can be categorized as sludge characteristics and operational conditions. Among the operational conditions, temperature and pH are the most important parameters. For the characteristics of sludge, chemical oxygen demand (COD) and total nitrogen (TN) are also important parameters since they reflect the number of organics present in the sludge. The efficiency of anaerobic digestion can also be evaluated using COD, because its consumption shows the degradation taking place within an anaerobic digester. Therefore, in this study, weekly changes of primary parameters were investigated for 2 two-stage anaerobic digesters under unsteady-state condition. During the operation, pH, temperature, COD and TN values of the sludge were measured. It was observed that the values for each parameter fluctuated for the first 10 weeks. The values of the following weeks started to show same trend meaning that the digesters reached steady-state condition.
Keywords: Two-stage anaerobic digester, unsteady-state, COD, TN Acknowledgement: This study was supported by TÜBİTAK 1001-Scientific and Technological Research Projects Funding Program (116Y181).

UEMK 2019 Proceedings Book
24/25 October 2019 Gaziantep University, TURKEY 694
IDENTIFICATION AND EVALUATION OF TRAFFIC MANAGEMENT
SCENARIOUS USING MICROSCOPIC SIMULATION IN MEKELLE
Hiluf Gebremariam Tetemke 1, Temesgen Destalem Yihdego 2 Melat Bereket Abraha 3 1 Graduate student at Mekelle University, Mekelle, Ethiopia 2 Bachelor Degree student at Adigrat University, Adigrat, Ethiopia 3 Bachelor Degree student at Adigrat University, Adigrat, Ethiopia
ABSTRACT: Transpiration system is an integral part of modern society. An increase in transportation demand is a serious problem for every city. As the number of vehicle and pedestrian grows the roads which were designed back are remaining the same.The Mekelle city roads are narrow and suffering traffic congestion. There could be two approaches to solve this peoblem. First and the most obevious approach is come up with modification and construction new rods. But for developing countires like Ethiopia, fund and land aquistion are serious concerns. The second approach is to manage existing tarffic with supply and demand taffic managmet is the economical and easily implementable. If traffic congestion are not solved, they could open door socioeconomic and safetey problem mainly on the residence. Studies neglected to consider how traffic mangmet could help to relax traffic conestion and assoiciated impacts at Mekelle city. The research study was aimed at investigatigation and evaluation traffic management scenarios using microscopic model at Mekelle city most busiest intersection and to select most suitable that can be adopt to reduce traffic congestion and other associated benefits such as reduction in in fuel consumption and motor vehicle emission. Three real-life implementaion tarfic managemet scenarios has been implemeted to solve those problems.The base case or do nothing was considered as control/reference for comparison success scenario. A model has been developed using microscopic simulation software SYNCRO version 9 and performance of the intersction has been found before and after implemtation of traffic mangment measure. The proposed of traffic mangemet scenarios was converting curb parking to effective tarffic lane, wavinig/shifting out of private vehicle to outside main road and providing traffic signal for Adi-Haqi Bridge and: lane addition, traffic signal timining optimizing, and wavinig/shifting out of private vehicle to outside main road for Adi-Shunduhun intersection. Result was extracted from the SYNCRO simulation output report the selection of the most decisive or most welcome scenario was based on set of measurement of effectiveness(Delay time, capacity, CO emission, queue length and fuel consumption). Based on the measurement of effectiveness criteria used the succeed scenario was recommended for implementation. The scenario or alternative congestion mitigation measurement being most effective were converting curb parking lane to effective lane and lane addition for Adi-Haqi Bridge and Adi-Shinduhun.

UEMK 2019 Proceedings Book
24/25 October 2019 Gaziantep University, TURKEY 695
Keywords: Traffic congestion; Traffic management; Microscopic simulation; Measure of effectiveness; most welcome scenario
1. Introduction
Transport is crucial and necessary for modern life pattern. The freedom to move short and long distance creates horizons for personal development and professional activates, increases the opportunities for leisure and holidays, and allows better connection and understanding between people. Transpiration system is integral part of modern day society, designed to provide efficient and economic movement between the component parts of a country and offer maximum possible mobility to all citizens. According to (Leshem and Ritov, 2007), road transportation is a critical link between all the other modes of transportation and their proper functioning. Unfortunately, the existing road networks, including the motorway system, is becoming explosively congested due to increase in the number of vehicles and inability to build new and larger motorway (David
and Gregory, 2010). Congestion reduces city inhabitant quality of life and also has environmental adverse impact. The waste of energy in gridlocked traffic and the production of greenhouse gases and other pollutants are harmful to the urban areas. Perhaps most importantly, congestion has substantial economic costs. Decisions investment and jobs hinge depend on the quality of transportation infrastructure and the free flow of goods and people in and through our cities (UTTF, 2012). Traffic congestion is the growing problem in Ethiopia. It is becoming acute for largest cities in Country including Mekelle. Mekelle has witnessed tremendous changes in the development
of its economy. There exist rapid growing of population, both resident people and floating people. The city population is increasing 5% every year (CSA, 2013). The number vehicles are growing at a dramatically
rate, even though road space remains stagnant, hence road capacity does not catch up with growth of vehicles. The road networks of Mekelle city are narrow. During the study the transport demand and capacity of facility were mismatched. This shows there is a need for concerted effort of improving the transport service in the city in order to increase accessibility and efficiency. There could be two approaches to solve this problem of congestion. First and the most obvious solutions are to come up with infrastructure involving wider roads, flyovers,
bypass and expressways. But for developing countries like Ethiopia, money and space are serious concerns. Second approach is to manage existing traffic, with the use of technology and by involving commuters in process which is traffic management. In modern day, widening road is not the appropriate mitigation of road network particularly in mega city. Road expansion maybe encourages the development of real estate and
businesses along the expressway. And new traffic flows added by those new settlers will offset some part of the benefits, which old road’s users expected to have from upgrading of road at the beginning. So, it seems difficult to remove peak-hour traffic congestion only by enlarging the capacity of roads network.
Enlarging the capacity of streets in old city for automotive traffic is widely opposed by local residents, since dwellings would be turn down by widening streets. Therefore, the growth of road capacity does not catch up with growth of vehicles and this mismatch could cause lots of vehicle blocked on narrow roads. There are three types of convergence
UEMK 2019 Proceedings Book
24/25 October 2019 Gaziantep University, TURKEY 696
that appear when an new road is opened or an old road is improved: travelers who formerly chose alternative routes during peak hour turn to the new road (spatial convergence); travelers who formerly did not drive in peak hours start to travel during those periods (time convergence); and travelers who formerly did not travelling by vehicles switch to driving (modal convergence). So many drivers shift from those three types convergence to the new built or improved route, before long, its traffic capacity is reached and its top limit exceeded. This outcome is almost inescapable if peak hour traffic was slow already before the highway was improved (Downs, 2003). This present study traffic management measures development and evaluation has not been done by else in Mekelle city before. There are some studies that have been done before with specific objectives investigation level of congestion and some optimization as scenarios of mitigation congestion. Even though, signal adjustment is method of alleviation traffic congestion impact on the road users, but there another strategy or instruments that are applicable traffic congestion potential avoidance. This study, in addition to traffic signal adjustment, has introduced several traffic management strategies towards reducing impact of traffic congestion on road users of Mekelle city. 2. Background
There is no unique definition of Traffic Management (TM), it differs upon the scholars. In generally, Traffic Management (TM) is the planning, monitoring, and control or influencing of traffic (TRKC, 2009). Traffic management measures comprises different of intervention mainly in urban areas. Traffic management measures in principle aim at the following goals: to reduce traffic congestion; to improve road safety; to reduce environmental pollution and; to reduce
energy consumption. Additional, traffic management (TM) is a management system and process conducted to improve traffic operations and safety through strategies that reduce demand or through operational improvement. Traffic management strategies are low-cost strategies, easily implemented in short period of time and cost-effective compared to more traditional capacity improvements, such as adding travel lanes, which takes several years to construct. Congestion managements start by understanding the problem characteristics and causes. As (CMP, 2016) identifies the main cause of congestion to appear are: bottlenecks, traffic incidents, work zones, bad weather, poor traffic signal timing, and special events. There are numerous measures that can be taken to alleviate urban traffic congestion. At a conceptual level, it is possible to identify and classify these measures according to three broad categories. The first category comprises measures that address the supply side of transport facilities (i.e., they are basically directed at increasing urban transport capacity). Measures in the second category are aimed at managing the demand side, specifically, in terms of encouraging efficient use of existing transport facilities (e.g., road space uncongested central areas). The third set of measures concerns the development of alternative urban structures conducive to the dispersal of economic activities and

UEMK 2019 Proceedings Book
24/25 October 2019 Gaziantep University, TURKEY 697
improved physical integration between employment, amenities, and housing. Within the two main strategies (e.g., demand side and supply side), according to Dougherty (1994) there are more than 40 conventional and innovative congestion management measures, which are categories into nine strategic class: these are Land use and Zoning, Communications substitutes, Traveller information services, Economic measures, Administrative measures, Traffic operational measures, Preferential treatment, Public transport operations, Freight transport operations. Table 1: Classification of Traffic Management Measures
Demand Side Land use and zoning • land use and zoning policy • site amenities and design
Communications substitutes
• Telecommuting • Teleconferencing • Tele shopping
Traveler information service
• pre-trip travel information • Regional rideshare matching
Economic measures • Congestion pricing • Parking pricing • Transportation allowances • Transit and rideshare financial incentive • Public transport pass program • Innovative Financing
Administrative measures
• Transportation partnership • Trip reduction ordinances and Regulations • Alternative work schedules
Supply-Side Traffic Operation measures
• Entrance ramp controls • Traveler information systems • Traffic signalization
improvements • Incident management • Traffic maintenance during construction
Preferential Treatment • Bus lanes • Carpool lanes • Cycle and pedestrian facilities • Traffic signal pre-emption
Public transport operations
• Express bus services • Park and ride services • Service improvements • public transport images
UEMK 2019 Proceedings Book
24/25 October 2019 Gaziantep University, TURKEY 698
• High capacity public transport vehicle
Freight transport operations
• Urban goods movement • Intercity goods movement
(Source: Dougherty, 1994) The software package SYNCHRO/SimTraffic incorporates both the analytical and micro- simulation models into the designing process. The analytical model is used in SYNCHRO to quickly evaluate the performance measures of different scenarios. The micro-simulation model is used in SimTraffic to provide better estimates of the performance measures (Li and Tarko, 2007). SYNCRO version 9 software which is used for capacity analysis, coordination, signal modeling and to find signal timing. SYNCRO optimize cycle length, split times, offsets and phase sequence to minimize driver’s stops and delay. The software can also provide a detailed summary report on analysis results like intersection capacity, level of service, volumes, timing, queue length, blocking problems, delay, fuel consumption and emission level. For design and analysis of the signalized and non-signalized road intersections, many procedures or techniques are developed by researchers and traffic management companies (Freeman et al., 1999). 3. Study Area
For this study two main intersections were selected for further analysis in this study. Those are selected because privilege solution worthy. Those two selected intersection; Adi-Shinduhun and Adi-Haqi Bridge intersection were selected to be close as possible to scenarios developed and most congested intersection they were. Adi-Haqi Bridge intersection was among most congested intersections of the city and high traffic accident where occurred. It is All-Way Stop Controlled intersection (AWSC).That intersection located at business area, which contains banks and insurance
and it, is described as Center Business District (CBD) area. The Center of Business Districts are characterized by high traffic flow, high parking turnover, narrow short-block roadway and high pedestrian activity and the saturation flow of such areas are lower than other areas. Adi-Shinduhun intersection was among most congested and very narrow intersection in city from traffic police witness. It is four-legged signalized intersection. In fact it serving arterial road class, but the geometry of link in the South-North approach is single in each direction. It deviated from local manual and international manual stated minimum lane required. Different manual covered that minimum lane required per direction is two, but it the existing road geometry is single lane.

UEMK 2019 Proceedings Book
24/25 October 2019 Gaziantep University, TURKEY 699
(Source: Digital Google earth map) Figure 1: (a). Adi-Haqi Bridge intersection, (b). Adi-Shinduhun intersection 4. Data Collection and Analysis
To achieve the objective of the investigation data’s has been collected from primary and secondary sources. Primary data includes, traffic data, geometric data, signal timing or signing, whereas secondary data includes, registered vehicles in Mekelle city and the estimated population growth of the city. The traffic data was collected at morning peak and evening peak hour for three days: Monday, Tuesday and Saturday. The three days were selected, because previous study conducted by city government shows high traffic was recorded on that days highly. The traffic data depicted Figure 2 and 3 shows traffic volume of morning peak hour and evening peak hour. Fortunately the peak hour or highest hourly volume was recorded, on Monday from 7-8:00Am, on both study areas. Monday is market day, that why maximum traffic is collected on Monday.

UEMK 2019 Proceedings Book
24/25 October 2019 Gaziantep University, TURKEY 700
Figure 2: Traffic data of Adi-Haqi Bridge intersection
Figure 3: Traffic data of Adishinduhun intersection 5. Modeling and Scenario Development
After the data collection and analysis, a model is developed replicating the field condition. Volume at peak hour, modal split road inventory of study area the inputs required.
7:00-8:00 AM 8:00-9:00AM 4:30-5:30PM 5:30-6:30PM
Monday 1773 1445 1539 1357
Tuesday 1295 1140 882 666
Saturday 929 908 826 775
0
500
1000
1500
2000
Nu
mb
er o
f ve
hic
les
Traffic Volume
7:00-8:00 AM 8:00-9:00AM 4:30-5:30PM 5:30-6:30PM
Monday 1058 648 770 746
Tuesday 984 741 833 827
Saturday 800 740 786 853
0
200
400
600
800
1000
1200
Nu
mb
er o
f V
ehic
les
Traffic Volume

UEMK 2019 Proceedings Book
24/25 October 2019 Gaziantep University, TURKEY 701
Traffic congestion mitigation strategies are the most important target of all transport decisions to balance the relationship between the demand and supply in a transport system so as to relax the traffic congestion. Urban traffic congestion mitigation measures encompass a set of strategies and techniques to reduce the impact of traffic congestion. Several mitigation strategies are available for mitigation of traffic congestion, using these strategies traffic congestion can be reduced on road user (OECD, 2004). There are many possible combinations to mitigate congestion; there is no single solution for congestion these solutions differs to place-to-place and site to site. The mitigation strategy selected should have the following criteria (OECD, 2004). The following rules were followed while developing scenarios for this study. Proven effectiveness in many studies congestion reduction The solution should be easy for implementation It should consider the minimum infrastructure modification It should interact and complement with other congestion mitigation programs A. The alternative strategies forwarded for Adi-Haqi Bridge intersection were:
i.Providing signal control: Heavy traffic and money traffic accident occurred in intersection, since none signalized intersection is risky traffic safety. To reduce occurrence of traffic accident and minimize congestion effect traffic signal control has been implemented to as scenario mitigation of congestion
ii.Converting parking lane to travel lane: This study has implanted to convert curb parking lane to effective traffic lane in west bound approach. As it depicted in Figure 3 the west bound approach has single lane entry at boundary of intersection, however it has directional two lanes at upstream. At boundary intersection space of a traffic lane is occupied or reserved for on street (online) parking lane. For present study it was proposed to restrict on street parking, and to convert curb parking lane to effective lane.
Figure 3: Curb parking facility
iii.Rerouting private vehicle: This study has implemented waving out or shifting of private vehicle(Car and 4WD/Land Rovers) to uncongested to minor routes outside the system (outside Adi-Shinduhun intersection). Those private and semiprivate cars allowed them out from main road to minor roads join main road at the peak morning and evening.

UEMK 2019 Proceedings Book
24/25 October 2019 Gaziantep University, TURKEY 702
Those private and semiprivate vehicles cause extra congestion and blocking problem, however their occupancy is very low. Then, private vehicle must be constrained to encourage public transportation. In order to attract more people to use the bus is necessary to introduce certain bus priority strategies. The main road will serve for High occupancy vehicle (HOV), and commercial vehicle. B. The alternative strategies forwarded for Adi-Shinduhun intersection were:
i. Optimizing signal timing: The existing signal time plan is failed to accommodate for existing traffic demand. Seasonal signal time is necessary, since traffic demand varies season to season even month to month, because socio economic of commuters. The existing signal timing has taken long time without adjustment, even though it should have reviewed and updated periodically not longer than three or five years (MUCTD, 2010). ii. Rerouting private vehicles: It is waving or shifting of private vehicle(Car and 4WD/Land Rovers) to uncongested to minor routes outside the system (outside Adi-Shinduhun intersection). Those private and semiprivate cars allowing them out from main road to minor road joins main road at the peak morning and evening. In order to attract more people to use the bus it is necessary to introduce certain bus priority strategies. iii. Lane addition: The function of all road network pass through Adi-Shinduhun intersection was Arterial type. They are public routes. They connect trip origin to trip destination. The segments of South-North bound were single lane per direction; hence those segments even didn’t meet the minimum lane number of urban arterial that in reference to AACRA standard. However, traffic management is searching strategies that could displace minimum infrastructure; at very minimum but the corridor should meet
the minimum standard. Hence, adding a lane in South-North segment was proposed as congestion mitigation. 6. Evaluation of traffic management Scenarios
The measure of effectives varies from author to author, type control, purpose of evaluation. In principle traffic management goal is to exist fast, or less congested, energy efficient, environmental friendly transport system. To account to those goal and according to type control and simulation out the measure of effectiveness Delay time, fuel consumption and Co emission: Delay time, fuel consumption, queue length and capacity were chosen for Adi-Haqi Bridge and Adi-Shinduhun intersection sequentially. i. Adi-Haqi Bridge intersection
Table 2: Simulated Measure of Effectives of Adi-Haqi Bridge intersection

UEMK 2019 Proceedings Book
24/25 October 2019 Gaziantep University, TURKEY 703
Scenario(case) Delay, sec CO Emission, g/hr Fuel consumption, l/hr
Do nothing 105 4160 239 Scenario-I 152 5565 299 Scenario-II 54 3140 169 Scenario-III 73 2800 151
Accordingly the analysis run and result of analysis are summarized in Table 2 it is surprising the performance measurement of if it were signal control, went from bad to worse the average control delay increased by 47 seconds (44.8%) compare to Do Nothing case. Hence signal control failed to reduce congestion adverse effect delay time. For second scenario curb parking converting to traffic lane result analysis as depicted Table 2 the average delay time extremely decreased that is from 105 seconds to 54 seconds. Final waving out private vehicles scenario 3 analysis result shows moderate operation performance was gained. Intersection delay was changed from 105 second delay to 73 second if they were waved out private vehicle in most approach those right turn movements. Finally, the best improvement in delay time was noticed in scenario two (2) followed by scenario three (3). As seen in Figure 4, the simulated delay time of Scenario two seen below others strategies simulated delay times cases.
Figure 4: simulated delay time result The estimated fuel consumption for do nothing case and scenarios case studied. As shown Table 2 considerable fuel consumption decrease noticed in case of scenario 2 (converting parking lane to effective lane) relative others. However scenario 1 didn’t produce decrease fuel consumption, rather get worse or increased about 25.1%. The figures of fuel consumption shows the best result in terms of saving fuel consumption was obtained from scenario 2 with average percentage of 29.3 % compared to Do nothing case.
020406080
100120140160
Basecasecondtion
ProvidingSignal Control
ConvertingCurb Parking
to Travel Lane
ReroutingPrivate
vehicles (carand 4WD)
Del
ay T
ime
(s)
Strategy

UEMK 2019 Proceedings Book
24/25 October 2019 Gaziantep University, TURKEY 704
It is important to note fuel consumption from scenario 3(shifting private vehicle), was not used to compare for fuel consumption. Because some vehicle was waved out the main intersection that means that simulated figure fuel consumption is merely referred to those vehicle drives through main intersection, then it is not true fuel consumption depicted in Table 2 because it did not included energy consumed by vehicle shifted to the minor roads. Among the objective of traffic management is to exist less pollution transportation system. To take account pollution effect, it has been considered, CO emission as measure of effectiveness.CO emission for the Do nothing case and scenario are presented in Table 2. It is clear from the Table that CO emission differ scenario to others. As shown in figure considerable decrease noticed incase case of scenario 2 that converting curb parking lane to travel lane. However scenario 1(Providing signal control) went from bad to worse, as traffic signal implemented. Hence it didn’t produce decrease CO emission. The figure showed in Table 2 the best result in terms of decreasing CO emission to be healthy environment was obtained from scenario 2(curb parking lane change to effective lane) with average percentage of 24.35% compared to Do nothing case. ii. Adi-Shinduhun Intersection
For first scenario(Optimizing signal time) that is optimize signal timing result analysis as depicted Table 3 the average intersection delay time dropped by 8 seconds. For second scenario (shifting private vehicles to outside the study areas) the average delay time dropped by 18 seconds (16%). This shows moderate performance change of traffic operation is seen. Final lane addition scenario analysis result as seen in Table 3 shown better operation performance change was gained. Intersection delay was changed from 112 second to 60 seconds (46% dropped) after added single lane in South-North corridor. Finally, the best improvement in delay time was noticed in scenario 3 followed by scenario 2 where the graph of two scenarios were well below the graph of other scenarios as depicted Figure 5. As seen in Figure 5, the delay time seen continue to decrease from Do nothing (left) to land addition).

UEMK 2019 Proceedings Book
24/25 October 2019 Gaziantep University, TURKEY 705
Figure 5: simulated delay time result After implementation traffic management of noticeable improvement was gained from Scenario one (do nothing). Capacity of intersection increased by 12% (155vph) for the optimization signal time scenario compared to Do nothing case. The rerouting private vehicle to back street nearby main intersection didn’t produce better change on capacity, instead it decreased by 10% compared to Do nothing. This is because of the closed intersection to Adi-Shinduhun are being activated during waving out scenario simulation. It produces effect on capacity of main intersection. In the other hand, for Do nothing condition, the minor intersections were not activated because it was too low volume where they use back street. Drastic increasing capacity has been observed, as lane addition scenario implemented as shown Table 3. The capacity increased by 55% compared to Do nothing condition. The best improvement incapacity was noticed in Scenario 3 and followed scenario 1. Table 3: Simulated Measure of Effectives of Adi-Shinduhun intersection
Scenario(case) Delay, sec Capacity, veh/hr
Queue length, m Fuel consumption, l/hr
Do nothing 112 1320 343 131 Scenario-I 104 1475 314 124 Scenario-II 94 1179 284 94
Scenario-III 60 2054 191 75
Accordingly the analysis run and result of fuel used in all arms analysis result are summarized in Table 3.These shows estimated fuel consumption for do nothing case and scenarios studied. As shown in Table 3 result significance decrease noticed incase case of scenario three (lane addition). However scenario one (optimizing signal time) didn’t
0
20
40
60
80
100
120
Basecasecondtion
OptimizeSignal Timing
Secenario
ReroutingPrivate
vehicles (carand 4WD)
Lane Addition
Del
ay T
ime(
s)Total Delay Time

UEMK 2019 Proceedings Book
24/25 October 2019 Gaziantep University, TURKEY 706
produce significance decrease fuel consumption. The figures shows the best result in terms of saving fuel consumption was obtained from scenario three (lane addition) with average percentage of 43% compared to Do nothing case. It is important to note fuel consumption from scenario two (shifting private vehicle), was not used to compare for fuel consumption. Because some vehicle was waved out the main intersection, then it is not true fuel consumption depicted in Table 3. SUMMARY AND CONCLUSIONS
The following conclusions are made according to the analysis: This study identification traffic congestion mitigation measures and evaluated using SYNCRO studio microscopic simulation. Delay, fuel consumption and CO emission; delay time, capacity, fuel consumption and queue length has been used to compare the effectiveness or success of traffic congestion mitigation with respect to base case or do nothing condition for Adi-Haqi Bridge and Adi-Shindihun intersection sequentially. The levels of service on the intersection were performing above their capacity for Adi-Haqi intersection with intersection delay 105 seconds. But, for signal providing scenarios intersection delay raised by 47seconds (45%). In converting curb parking lane to travel lane scenario the whole intersection delay dropped by 51 second (49%) that almost half for existing traffic operation performance. Likewise, the performance of third scenario rerouting or constrain of private vehicle like car, 4WD found moderate. Intersection delay changed from 105 second to 73 seconds after shifting of low volume vehicle to outside system. By looking at all performance measure possible scenarios, Scenario-II (Converting curb parking to traffic lane) is better to method to practice on
selected intersection. And shifting of low occupancy vehicles (car and 4WD) is second best mitigation for selected Adi-Haqi Bridge intersection. Most traffic operation was operating with total delay 112 seconds at Adi-Shinduhun signalized intersection. The intersection delay a few change appeared that is 8 seconds after optimize signal time to the do nothing condition. Likewise, the performance of second scenario rerouting or constrain of private vehicle like car, 4WD found moderate performance seen. Final the lane addition scenarios, in fact it brought infrastructure modification, its performance found better than other scenarios. The intersection delay dropped from 112 seconds to 60 seconds after lane addition implemented South-North corridor a single lane to become two lanes per direction. By looking at all possible scenarios, Scenario-III (Lane addition) is better to method to practice on selected intersection. And shifting of low occupancy vehicles (car and 4WD) is second best mitigation for selected intersection.

UEMK 2019 Proceedings Book
24/25 October 2019 Gaziantep University, TURKEY 707
REFERENCES
AACRA. (2003). Addis Ababa City Road Authority (AACRA): Geometric Design. Abebe, Z. (2006). Urbanization for National Development in Ethiopia. Vision 2020 Ethiopia Forum held on May 2, 2006. Ethiopian Economic Association, Addis Ababa Alaci, D.S.A. (2010). Regulating Urbanization in Sub-Saharan Africa through Cluster Settlements: Lessons for Urban Mangers in Ethiopia. Theoretical and Empirical Researches in Urban management 5(14). Andy, H.F. Chow, Alex Santacreu, Ioannis Tsapakis, Garavig Tanasaranond and Tao Cheng. (2014). Empirical assessment of urban traffic congestion, Journal of Advanced Transportation, J. Adv. Transp. 2014; 48:1000–1016.
Belachew, M.H., Zeleke, D.A. (2015).Statistical Analysis of Road Traffic Car Accident in Dire Dawa Administrative City, Eastern Ethiopia. Science Journal of Applied Mathematics and Statistics. Vol. 3, No. 6, 2015, pp. 250-256. doi: 10.11648/j.sjams.20150306.14.
Byrne, G.E. & Mulhall, S.M. (1995) Congestion management data requirement and comparisons, Transportation Research Record: Journal of the Transportation Research Board, No. 1499, pp. 28-36.
Congestion Managmet Process (CMP).(2016). Congestion management process Technical Report. Metroplan Orlando, USA. David, H., & Gregory, F. (2009). Gridlock and growth: The effect of traffic congestion on regional economic performance. Downs, A. (2003). Still Stuck in Traffic: Coping with Peak-Hour Traffic Congestion. Washington, DC: Brookings Institution Press.
European Environment Agency (EEA). (2014) Noise in Europe 2014. European Environment Agency, Report 10/2014. Luxembourg: Publications Office of the European Union. European Commission. (2015). Science for Environment Policy: Noise impacts on health. E. O. Mogaka, Z. Ng’ang’a, J. Oundo, J. Omolo, and E. Luman. (2011).Factors associated with severity of road traffic injuries, Tika, Kenya, Pan African Medical Journal, vol. 8, article 20, 2011.
Emily, S., Mekamu, K. (2009). Urbanization and Spatial Connectivity in Ethiopia: Urban Growth Analysis Using GIS, Development Strategy and Governance Division, International Food Policy Research Institute-Ethiopia Strategy Support Program 2, Ethiopia. FHWA. (2008). Traffic Signal Timing Manual: Kittelson and Associates, Inc, Wasninton, Dc,
HWA-HOP-08-024. FREEMAN, W., HO, K. & MCCHESNEY, E. An evaluation of signalized intersection system analysis techniques. Transportation Frontiers for the Next Millennium: 69th Annual Meeting of the Institute of Transportation Engineers, 1999. Highway Capacity Manual (HCM). (2000).TRB, National Research Council, Washington, D.C.

UEMK 2019 Proceedings Book
24/25 October 2019 Gaziantep University, TURKEY 708
Highway Capacity Manual (HCM). (2010).TRB, National Research Council, Washington, D.C. Issa, Yazan. (2014). Reducing of Roads Congestion Using Demand Management Techniques, International Journal of Computational Engineering Research (IJCER), vol. 04, no. 7, 2014.
Jonkers, K., and Gorris, T. (2015) Intelligent Transport Systems and traffic management in urban areas. Policy Note 2020, CIVITAS WIKI Team, Netherland Kibrom, G. (2005). Investigation into engineering properties of Mekele soils with an emphasis on expansive soils: MSc Thesis, Addis Ababa University, Ethiopia. Kumar, A., Singh, R.R. (2017). Traffic Congestion and Possible Solutions in Urban
Transportation System. 4th International conference on Emerging Trends in Engineering, Technology, Science and Management, ISBN: 978-93-8617154-2 New Delhi, India
Leshem G & Ritov Y. (2007). Traffic Flow Prediction using Adaboost Algorithm with Random Forests as a Weak Learner. International Journal of Intelligent Technology Vol. 2 No. 2 ISSN 1305-6417
Levy, Jonathan I., Jonathan J. Buonocore, and Katherine von Stackelberg. (2010). Evaluation of the public health impacts of traffic congestion: a health risk assessment. Environmental Health 9(1): 65. Lim Lan Yuan. A Case Study on Urban Transportation Development and Management in Singapore. National University of Singapore. Lindley, J.A. (1987).Urban freeway congestion: quantification of the problem and effectiveness of potential solutions, ITE journal, 57(1), 27-32. LI, W. & TARKO, A. P. (2007). Effective and Robust Coordination of Traffic Signals on Arterial Streets, Volume 1, Research Report. Joint Transportation Research Program, 246. Lomax, T., Turner, S., Shunk, G., Levinson, H.S., Pratt, R.H., Bay, P.N. and Douglas, G.B. (1997). Quantifying congestion, volume 1 & 2, NCHRP Report 398, Washington, DC: Transportation Research Board. MUCD. (2009).Manual on Uniform Traffic Control Device; for streets and Highway. Federal Highway Administration Washington, D.C. M. Aftabuzzaman. Measuring Traffic Congestion: A Critical Review, Institute of
Transport Studies, Monash University, Melbourne, Victoria, Australia. Nantulya, V.M. and Muli-Musiime. (2009).Uncovering the Social Determinants of Road Traffic Accidents, Chapter 15 in Challenging Inequities in Health: From Ethics to Action. In Timothy Evans, Margaret Whitehead, Finn Diderichsen, Abbas Bhuiya, and Meg Wirth. New York: Oxford University Press; pp. 211–225. National Urban Planning Institute (NUPI). (2002). Urban Development and Implementation Problems in Ethiopia and Future Prosperity. Proceedings of the 2nd National Conference, 2002 Papaioannou p., and Georgiou, G. Are Traffic Demand Management (TDM) measures a solution for traffic problems in urban areas?: The Greek experience. Dept of Civil Engineering Aristotle University of Thessalonik, Greece.

UEMK 2019 Proceedings Book
24/25 October 2019 Gaziantep University, TURKEY 709
PARK, B. (1998). Development of genetic algorithm-based signal optimization program for oversaturated intersections. Texas A&M University.
Peden, M., Scurfield, R., Sleet D. (2004). World report on road traffic injury prevention. Rodrigue, J-P, Comtois, C., and Slack, B. (1997). Transportation and spatial cycles: evidence from maritime systems. Journal of Transport Geography, Vol. 5, 1997, pp. 87-98. Rukunga, Kithunka Daniel. (2002). Towards A Strategy For The Reduction Of Urban
Traffic Congestion: A Case Study of Nairobi Central Business District. MA. Thesis, University Of Nairobi, Kenya. Sanjay Kumar Singh. (2012).Urban Transport in India: Issues, Challenges, and the Way Forward. European Transport Issue 52, Paper no. 05, ISSN 1825-3997. Sengupta R. (2001). Sustainable Transport Pricing in India. Asian Institute of Transport Development, New Delhi, pp.80. Singh, S.K. (2005). Review of urban transportation in India. Journal of Public Transportation, vol. 8, no. 1, pp. 79-97
SHUAIYU, C., HAO, X. & HONGCHAO, L. (2013). Timing oversaturated signals: what can we learn from classic and state-of-the-art signal control models. Journal of Transportation Systems Engineering and Information Technology, 13, 97-110 The Federal Democratic Republic Of Ethiopia, Ministry Of Transport, Ethiopian Roads Authority, (FDREMT). (2015).The Road Sector Development Program: Phase V, Addis Ababa. Transport Research Knowledge Center (TRKC). (2009). Traffic Management for Land Transport, Directorate General for Energy and Transport, European Commission. United Nations, Department of Economic and Social Affairs (UNDESA), (2014). World Urbanization Prospects: The 2014 Revision, Highlights. Working Paper No. ST/ESA/SER.A/352.
Urban Transportation Task Force (UTTF), Council of Ministers Responsible for Transportation and Highway Safety. (2012). The High Cost of Congestion in Canadian Cities, Canada. Wheeler, N. and Figliozzi, M. (2011).Multi Criteria Freeway Performance Measures for Trucking in Congested Corridors, Transportation Research Record: Journal of the Transportation Research Board, Volume 2224 William L. Garrison. Historical Transportation Development. University of California, Berkeley, USA. World Health Organization (WHO). (2005). Health Effects of Transport-related Air Pollution. WHO Regional Office for Europe, Copenhagen. 125-165. World Health Organization (WHO). (2009). Global Status on Road safety: Time for action. Geneva; WHO . World Health Organization (WHO). (2012). World Report on Road Traffic Injury Prevention. World Health Organization (WHO). (2015). Economic Cost of the Health Impact of Air Pollution in Europe: Clean air, health and wealth. Copenhagen: WHO Regional Office for Europe.

UEMK 2019 Proceedings Book
24/25 October 2019 Gaziantep University, TURKEY 710

UEMK 2019 Proceedings Book
24/25 October 2019 Gaziantep University, TURKEY 711
SOLAR ASSISTED GROUND SOURCE HEAT PUMP MODELING AND SIMULATION FOR VAN REGION
Osman Seyit ÖZDAMAR Iskenderun Technical University, Institute of Energy, Iskenderun, Hatay, Turkey Van Yuzuncu Yıl University, Department of Mechanical Engineering, Tuşba, Van Turkey, [email protected]
Hazel SAĞLAM ÖZDAMAR Van Yuzuncu Yıl University, Başkale Vocational School, Tuşba, Van Turkey, [email protected] Suha Orçun MERT* Iskenderun Technical University, Department of Mechanical Engineering, Iskenderun, Hatay, Turkey, Iskenderun Technical University, Institute of Energy, Iskenderun, Hatay, Turkey, [email protected], [email protected] Tolga DEPCİ Iskenderun Technical University, Department of Engineering Sciences, Iskenderun, Hatay, Turkey, [email protected]
ABSTRACT: The use of the Ground Source Heat Pump (TKIP) is increasing due to increasing energy prices, decreasing resources and environmental concerns. The operating principle of the system used in the heating and cooling of buildings, various engineering structures using the heat energy stored in the soil, as well as in the production of hot water is based on the principle of heat transfer. Especially in cold regions like Van, the need for heating is met with imported fossil fuels such as natural gas and coal. With the developing technology, the use of thermal energy storage systems, which is a new alternative energy source, is increasing. The aim of this study is to design a combined system consisting of TKIP and BTES systems to increase TKIP’s performance coefficient (COP). In this study, the application of TKIP and BTES systems together in the regions with cold climatic conditions is modeled and calculated using MATLAB program. Different temperature distributions in the storage volume determined in the calculations of the designed system were calculated. In addition, heat losses, efficiency and heat draw values of the system were calculated. Calculations were made every
month and also starting from May including the extraction of heat from the system. According to the results of each month, the most efficient and highest temperature values were determined in July and the lowest efficiency values and temperature values were determined in December. The highest yields were observed in May, while the highest yields were observed in July. It was determined that the maximum heat dissipation from the system was in January and December, and the maximum heat loss was observed in

UEMK 2019 Proceedings Book
24/25 October 2019 Gaziantep University, TURKEY 712
these months. When the results were evaluated, it was found that TKIP and BTES systems are suitable for heating especially in cold climate regions with high solar potential or geothermal resources. Key words: Thermal Energy Storage, Energy Efficiency, Ground Source Heat Pump VAN BÖLGESİ İÇİN GÜNEŞ DESTEKLİ TOPRAK KAYNAKLI ISI POMPASI MODELLENMESİ VE SİMÜLASYONU
ÖZET: Toprak Kaynaklı Isı Pompasının (TKIP) kullanımı artan enerji fiyatları azalan, kaynaklar ve çevresel kaygılar sebebiyle gittikçe artmaktadır. Toprakta depolanan ısı enerjisini kullanarak binaların, çeşitli mühendislik yapıların ısıtılması ve soğutulmasında, ayrıca sıcak su üretiminde kullanılan sistemin çalışma prensibi, ısının taşınması esasına dayanmaktadır. Özellikle Van gibi soğuk bölgelerde ısınma ihtiyacı doğalgaz ve kömür gibi ithal fosil yakıtlarla karşılanmaktadır. Gelişen teknoloji ile birlikte yeni alternatif enerji kaynağı olan termal enerji depolama sistemleri kullanımı artmaktadır. Bu çalışmadaki amaç TKIP ve BTES sistemlerinden oluşan kombine bir sistem tasarlamak TKIP’ın performans katsayısını (COP) artırmaktır. Bu çalışmada soğuk iklim koşullarına sahip bölgelerde TKIP ve BTES sistemlerinin birlikte uygulanması modellenmesi ve MATLAB programı kullanılarak hesaplamaları yapılmıştır. Tasarlanan sistemin hesaplamalarında belirlenen depolama hacmindeki farklı sıcaklık dağılımları hesaplanmıştır. Ayrıca sistemin ısı kayıpları, verimi ve ısı çekim değerleri de hesaplanmıştır. Hesaplamalar her ay kendi içinde ve ayrıca Mayıs ayında başlanarak sistemden ısı çekilmesi de dâhil edilerek bir yıl zaman diliminin hesaplamaları yapılmıştır. Her ayı kendi içinde hesapladığımız sonuçlara göre en verimli ve en yüksek sıcaklık değerleri Temmuz ayındayken, en düşük verim değerleri ve sıcaklık değerleri ise Aralık ayında tespit edilmiştir. Bir yıl için yapılan hesaplamalarda ise en yüksek verim değerlerinin Mayıs ayındayken, en yüksek sıcaklık değerleri Temmuz ayında gözlemlenmiştir. Sistemden en çok ısı çekiminin Ocak ve Aralık aylarında olduğu, aynı zamanda en fazla ısı kaybının da bu aylarda olduğu tespit edilmiştir. Çıkan sonuçlar değerlendirildiğinde özellikle güneş potansiyeli veya jeotermal kaynakları fazla olan soğuk iklim bölgelerindeki ısıtma için TKIP ve BTES sistemlerinin uygun olduğu tespit edilmiştir.
Anahtar sözcükler: Termal Enerji Depolama, Enerji verimliliği, Toprak Kaynaklı Isı Pompası GİRİŞ
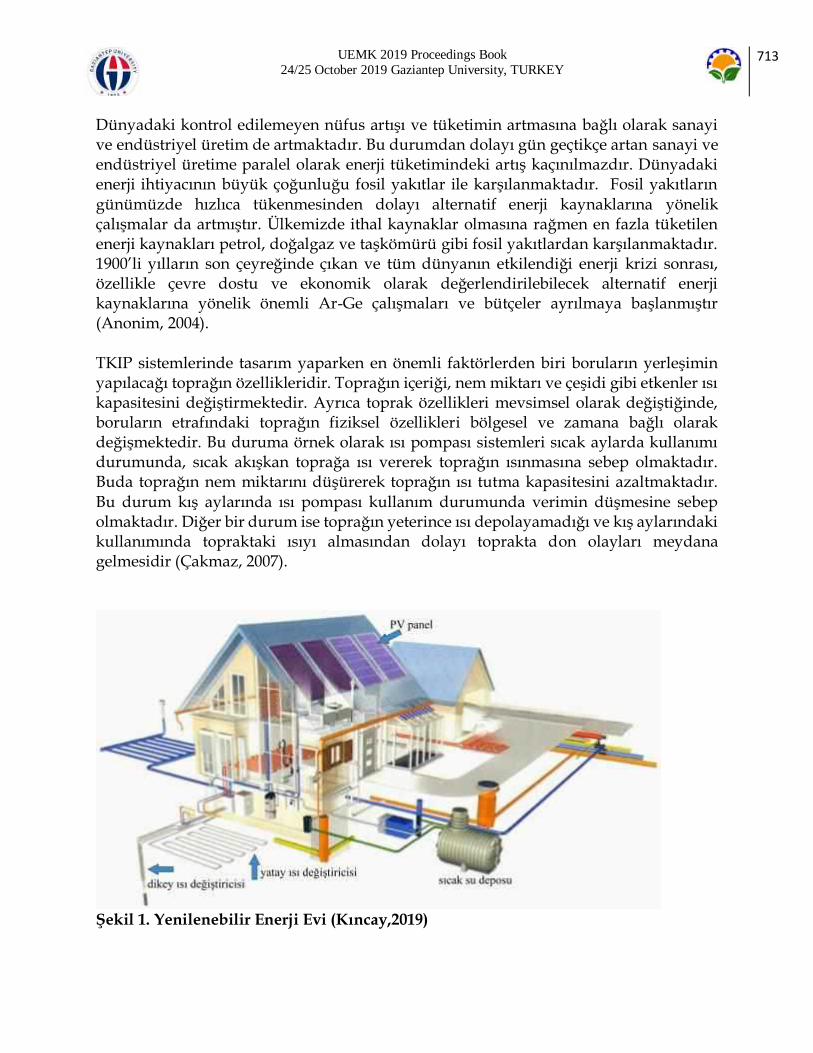
UEMK 2019 Proceedings Book
24/25 October 2019 Gaziantep University, TURKEY 713
Dünyadaki kontrol edilemeyen nüfus artışı ve tüketimin artmasına bağlı olarak sanayi ve endüstriyel üretim de artmaktadır. Bu durumdan dolayı gün geçtikçe artan sanayi ve endüstriyel üretime paralel olarak enerji tüketimindeki artış kaçınılmazdır. Dünyadaki enerji ihtiyacının büyük çoğunluğu fosil yakıtlar ile karşılanmaktadır. Fosil yakıtların günümüzde hızlıca tükenmesinden dolayı alternatif enerji kaynaklarına yönelik çalışmalar da artmıştır. Ülkemizde ithal kaynaklar olmasına rağmen en fazla tüketilen enerji kaynakları petrol, doğalgaz ve taşkömürü gibi fosil yakıtlardan karşılanmaktadır. 1900’li yılların son çeyreğinde çıkan ve tüm dünyanın etkilendiği enerji krizi sonrası, özellikle çevre dostu ve ekonomik olarak değerlendirilebilecek alternatif enerji kaynaklarına yönelik önemli Ar-Ge çalışmaları ve bütçeler ayrılmaya başlanmıştır (Anonim, 2004). TKIP sistemlerinde tasarım yaparken en önemli faktörlerden biri boruların yerleşimin yapılacağı toprağın özellikleridir. Toprağın içeriği, nem miktarı ve çeşidi gibi etkenler ısı kapasitesini değiştirmektedir. Ayrıca toprak özellikleri mevsimsel olarak değiştiğinde, boruların etrafındaki toprağın fiziksel özellikleri bölgesel ve zamana bağlı olarak değişmektedir. Bu duruma örnek olarak ısı pompası sistemleri sıcak aylarda kullanımı durumunda, sıcak akışkan toprağa ısı vererek toprağın ısınmasına sebep olmaktadır. Buda toprağın nem miktarını düşürerek toprağın ısı tutma kapasitesini azaltmaktadır.
Bu durum kış aylarında ısı pompası kullanım durumunda verimin düşmesine sebep olmaktadır. Diğer bir durum ise toprağın yeterince ısı depolayamadığı ve kış aylarındaki kullanımında topraktaki ısıyı almasından dolayı toprakta don olayları meydana gelmesidir (Çakmaz, 2007).
Şekil 1. Yenilenebilir Enerji Evi (Kıncay,2019)

UEMK 2019 Proceedings Book
24/25 October 2019 Gaziantep University, TURKEY 714
TKIP sistemleri temelde topraktaki depolanan ısı enerjisini kullanır (Şekil 1). TKIP temel çalışma prensipleri toprağın altına döşenen borulardan akışkan geçirilerek bu akışkana topraktaki ısı enerjisinin aktarılmasıdır. Akışkan taşıdığı ısıyı ısı pompasında bulunan havaya aktarmaktadır. Bu sistemler TKIP tipindeki ısı değiştiricisinin başlangıcını oluşturmaktadır. TKIP sistemlerinde, topraktaki ısıyı en verimli şekilde almak için toprakaltı borular farklı şekillerde yerleştirilmektedir. Bu borular temel kısımda yatay ve dikey olmak üzere iki konumda yerleştirilir (Şekil 1). Yatay ısı değiştiricileri için toprağa açılan kuyu derinliği 1-3m arasında değişmektedir. Bu sistemlerin kurulumu ve maliyeti diğerlerine göre ucuz ve kolaydır. Konut ısıtması için de en uygun olan bu sistemdir. Toprağın 1-3 m arasındaki sıcaklığı derinlere göre daha azdır. Toprağın altına yatay olarak döşenen borular, topraktaki ısıl alışverişin en verimli şekilde olması için akışkanın temas yüzeyinin arttırılmasını gerektirir. Bu yüzden paralel, spiral veya serpantin gibi farklı şekillerde döşenir. Yatay ısı değiştiricili toprak kaynaklı ısı pompaları konut ısıtılması dışında soğuk bölgelerde yol ısıtılmasında da yaygın olarak kullanılmaya başlanılmıştır. Buna örnek olarak Arjantin, Amerika, Japonya, İzlanda ve İsviçre gibi ülkelerde 500.000 m2’lik yol ısıtılmasında kullanılmaktadır (Hepbaşlı ve Hancıoğlu, 2001). YÖNTEM
Çalışmanın yapılacağı yer Van Yüzüncü Yıl Üniversitesi Zeve Kampüsü olarak seçilmiştir. Van bölgesinin güneş potansiyeli göz önüne alındığında bu potansiyel BTES kısmında termal enerji depolama olarak kullanılacaktır. Toprakta 5m*5m*5m bir alan olarak belirlenmiştir. Toprağın 2,5 metre derinliğine BTES borularının yerleştirildiği kabul edilmiştir. Bu boruların içerisinde sıcak aylarda (Mayıs-Haziran-Temmuz-Ağustos-Eylül) güneşten gelen ısı ile ısınan sıcak su gönderilmesi planlamıştır. Bu sayede toprakta belirlenen alandan termal ısı depolanmasına bağlı olarak toprağın sıcaklık dağılımı incelenmiştir. Konutun ısıtılması gereken aylarda (Ekim-Kasım-Aralık-
Ocak-Şubat-Mart-Nisan) sistemden TKIP yardımıyla ısı çekilmesi durumları incelenmiştir. Isı çekilmesi ve ısı kayıpları dâhil edildikten sonraki belirlenen depolama alanındaki sıcaklık dağılımı ve verim grafikleri elde edilmiştir.
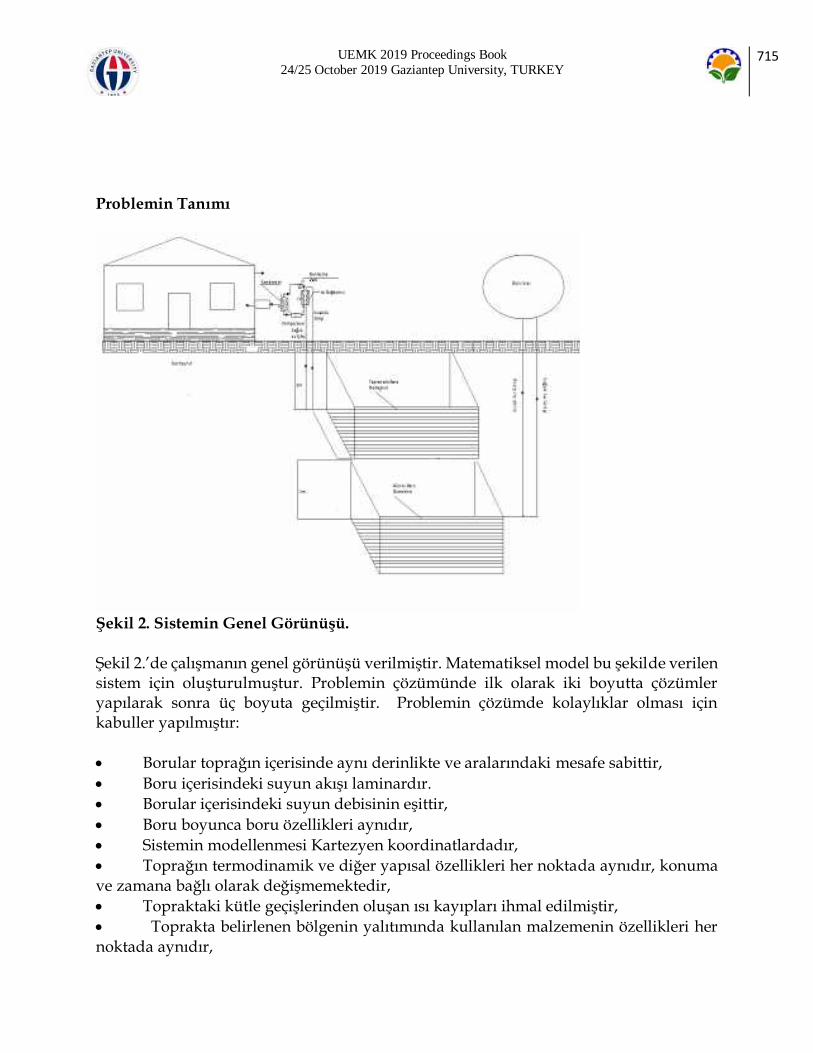
UEMK 2019 Proceedings Book
24/25 October 2019 Gaziantep University, TURKEY 715
Problemin Tanımı
Şekil 2. Sistemin Genel Görünüşü.
Şekil 2.’de çalışmanın genel görünüşü verilmiştir. Matematiksel model bu şekilde verilen sistem için oluşturulmuştur. Problemin çözümünde ilk olarak iki boyutta çözümler yapılarak sonra üç boyuta geçilmiştir. Problemin çözümde kolaylıklar olması için kabuller yapılmıştır:
Borular toprağın içerisinde aynı derinlikte ve aralarındaki mesafe sabittir,
Boru içerisindeki suyun akışı laminardır.
Borular içerisindeki suyun debisinin eşittir,
Boru boyunca boru özellikleri aynıdır,
Sistemin modellenmesi Kartezyen koordinatlardadır,
Toprağın termodinamik ve diğer yapısal özellikleri her noktada aynıdır, konuma ve zamana bağlı olarak değişmemektedir,
Topraktaki kütle geçişlerinden oluşan ısı kayıpları ihmal edilmiştir,
Toprakta belirlenen bölgenin yalıtımında kullanılan malzemenin özellikleri her
noktada aynıdır,

UEMK 2019 Proceedings Book
24/25 October 2019 Gaziantep University, TURKEY 716
Toprak sıcaklığı her noktada sabittir,
Ay içeresinde güneşli günler peş peşedir,
Isı geçişi iletim yoluyla olmaktadır. Tasarım Adımları
Çalışmamanın tasarım adımları sırasıyla yapılmıştır, hesaplamalar ve tabloler sonucunda tablo 1 oluşturulmuştur. Oluşturulan tablodeki verilere göre MATLAB programında modelle yapılmıştır. 1. Konutun ısı kayıpları ve gerekli ısıl yükleri hesaplandı, 2. Yatay tip TKIP seçildi, 3. TKIP kurulacağı bölgenin toprak çeşidine göre ısıl direnç ve ısı iletim katsayıları belirlendi, 4. Boru secimi yapıldı, 5. Boru çapı belirlendi ve buna göre boru uzunluğu hesaplandı, 6. Isı pompası seçimi yapıldı, 7. Matematiksel model oluşturuldu 8. MATLAB’da Sonlu Elemanlar Yöntemi temel alınarak oluşturulan matematiksel model ile bir yıl için topraktaki sıcaklık dağılımı ve depolanmış ısıl enerji değerleri hesaplandı. 9. Aynı zamanda oluşturulan modelde toprakta depolanan enerjinin ısı çekme durumunda oluşan sıcaklık dağılımı ve elde edilen ısı miktarı hesaplandı. Tablo 1 Sistem İçin Gerekli Veriler
Açıklama Birim Değer Hesaplama
Boru malzemesi - PESCH40 Seçilir Boru çapı İnç 1 Seçilir Boru direnci, Rb moC/W 0,159 Tablo 2.3. Toprak cinsi - Killi-Nemli Kabul Toprak direnci, Rt moC/W 1,42 Tablo 2.3. Ortalama yıllık hava sıcaklığı, Torthava
oC 9,4 Meteoroloji
Ortalama yıllık toprak sıcaklığı, Torthava
oC 15,2 Meteoroloji
Yüksek toprak sıcaklığı, Tmaxtoprak
oC 25 Tablo 3.6.
Düşük toprak sıcaklığı, Tmintoprak
oC 7,2 Tablo 3.6.
Düşük toprak sıcaklığı, T’
mintoprak
oC 15 Tahmin

UEMK 2019 Proceedings Book
24/25 October 2019 Gaziantep University, TURKEY 717
Toprak Özelliklerinin Belirlenmesi
Hesaplamalarda ısı transferi iletim yoluyla olduğu kabul edilmiştir. MATLAB da hesaplamalar yapılırken Van Yüzüncü Yıl Üniversitesi Zeve Kampüsü için toprak özellikler killi nemli toprak olarak kabul edilmiştir. Literatür taramalarında kuru killi toprak ve doygun nemli toprak için yapılan deneysel sonuçlar bulunmuştur. Bu değerlerin ortalamaları alınarak toprak için sabitler aşağıda listelenmiştir.
𝑘𝑡 =1,7+0,5
2= 0.92 𝑊/𝑚𝐾 Toprak ısı iletkenliği
𝐶𝑝 =3,4+1,6
2= 2,5 𝑀𝐽/𝑚3𝐾 Toprak sabit hacimde ısı kapasitesi
𝛼 =0,5+0,31
2= 0,415 10−6𝑚2/𝑠 Toprak ısıl geçirgenliği
∆𝑥 = 6𝑐𝑚 Nodlar arası mesafe Tablo 2. Toprak Termodinamik Özellikleri (Marquez, 2016).
Toprak Tipi Isıl iletkenlik (𝑾/𝒎𝑲)
Sabit hacimde ısı kapasitesi
( 𝑴𝑱/𝒎𝟑𝑲)
Toprak ısıl
geçirgenliği (𝒎𝟐
𝒔)
Min. Ort. Maks. Ort. Min. Ort. Maks. Kuru killi 0,4 0,5 1 1,6 0,25 0,31 0,68
Üniteye giren en düşük su sıcaklığı, Tmax
oC 7 Kabul
Üniteye giren en yüksek su sıcaklığı, Tmin
oC 70 Kabul
Isıtma çalışma faktörü, Fı - 0,134 Eş. 3.15 Ünitenin ısıtma performansı, COPı
- 3,2 Tablo 3.5.
Ünitenin ısıtma kapasitesi Kw 21,4 Hesap Boru uzunluğu m 140 Eş. 3.18. Boru kullanım şekli - Yatay Seçilir Gün Isısı Sistemi 30 Vakumlu Seçilir Yalıtım Malzemesi XLPE 60 m2 Seçilir Boru içerisindeki akışkanın debisi
𝑚3/ℎ 0,536 Hesaplama
Sirkülasyon Pompa Gücü kW 0,8 kW Hesaplama Kontrol Mekanizması
Isı Sensoru Basınç Sensoru
Seçilir

UEMK 2019 Proceedings Book
24/25 October 2019 Gaziantep University, TURKEY 718
Doygun nemli killi
0,9 1,7 2,3 3,4 0,26 0,5 0,62
Sabit Değerlerin Belirlenmesi ve Hesaplanaması
Zaman aralığının hesaplamasında akışkanın toprak altı borularda tam bir döngüyü yapması için gerekli süre alınmıştır. ∆𝑡 hesaplanması; 𝑉𝑏 = 𝜋𝑥𝑟𝑏
2𝑥𝐿′𝑡𝑜𝑝 1)
𝑟𝑏 = 1,27 𝑐𝑚 𝐿′𝑡𝑜𝑝 = 140 𝑚
𝑉𝑏 = 𝜋𝑥𝑟𝑏2𝑥𝐿′𝑡𝑜𝑝 = 𝜋𝑥(1,27𝑥10
−2𝑚)2𝑥140𝑚 ≅ 0,071 𝑚3
∆𝑡 =𝑉𝑏
𝑄𝑝=
0.07𝑚3
0.4 𝑚3/ℎ≅ 10 𝑑𝑘 (2)
𝑉𝑏 = 𝜋𝑟𝑏
2𝐿𝑏 = 𝜋𝑥(1.25𝑥10−2𝑚)2𝑥140𝑚 ≅ 0.07𝑚3
∆𝑡 = 10 𝑑𝑘 Zaman aralığı Toprak için fourier sayısı aşağıda hesaplamıştır.
𝐹𝑜 =𝛼∆𝑡
(∆𝑥2)=0,415 10−6𝑚2/𝑠 ∗ 600𝑠
(6 ∗ 10−2𝑚)2≅ 0,069
Tasarımda toprakta belirlenen alanın duvarlarında 20 cm kalınlıkta polietilen köpük kullanılarak yalıtım yapılmıştır. Yalıtım malzemesinin özellikleri aşağıda listelenmiştir. 𝑘𝑦 = 0,04𝑊/𝑚𝐾 Yalıtım malzemesi ısı iletkenliği
𝐿𝑦 = 20 𝑐𝑚 Yalıtım malzemesi kalınlığı
Diğer gerekli bir bilgi borular içerisindeki suyun debisi bilinmesi gerekmektedir. 8. adımda akışın laminar ve reynold sayısı 2000 olarak kabul edilmiştir. Buradan yapılan
hesaplamalarda suyun debisi 𝟎, 𝟓𝟑𝟔𝒎𝟑
𝒉 olarak hesaplanmıştır. Pompa gücü hesaplanıp
ve piyasa araştırması yapıldığında aşağıdaki özelliklere sahip pompa seçimi yapılmıştır. 𝑃𝑝 = 700 𝑊 Kabul edilen sirkülasyon pompa gücü
𝑄𝑝 = 0.5 𝑚3/ℎ Kabul edilen borulardaki suyun debisi
Hesaplamalarda kolaylık olması için ilk olarak iki boyutta merkez kısım için hesaplamalar yapılmıştır. Sonraki kısımda derinlik için hesaplamalar yapılarak farklı derinlikler için ısı dağılımı hesaplanmıştır. Burada foruier değeri yeniden program tarafından hesaplanmıştır. ∆𝑧 = 10 𝑐𝑚 Topraktaki derinlik aralığı TKIP kısmında sisteme giriş yapan su sıcaklıkları Ankara için olan veriler kullanılmıştır.
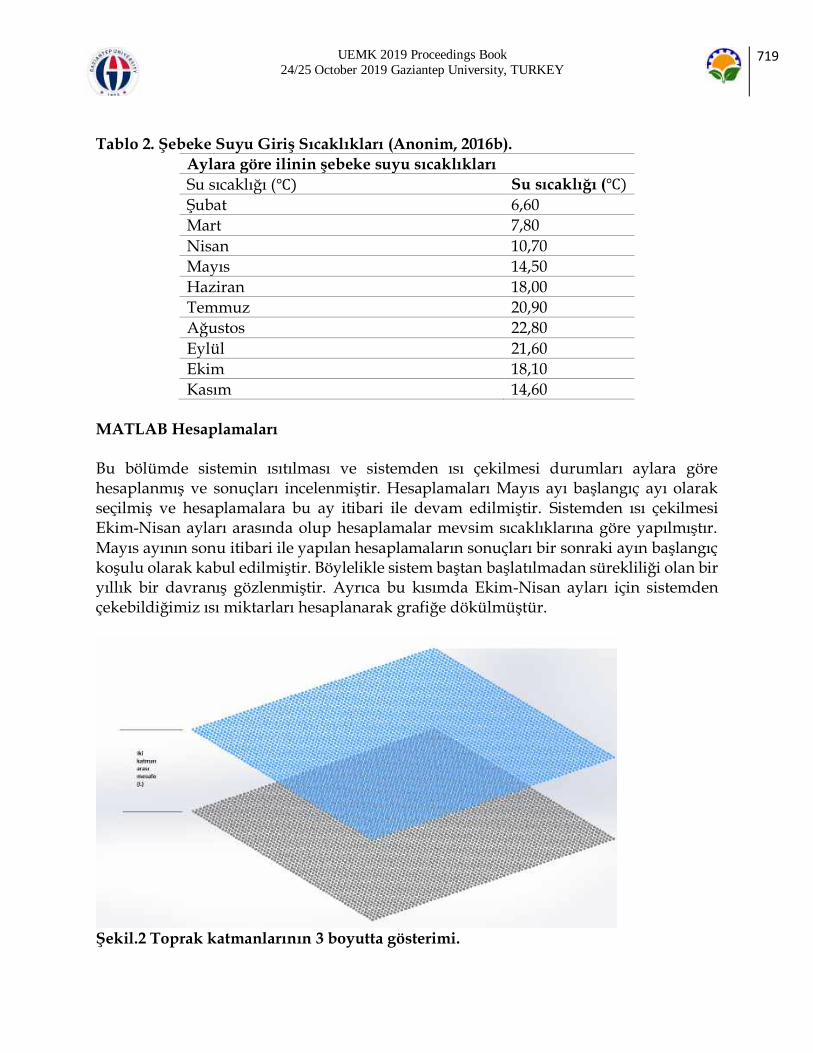
UEMK 2019 Proceedings Book
24/25 October 2019 Gaziantep University, TURKEY 719
Tablo 2. Şebeke Suyu Giriş Sıcaklıkları (Anonim, 2016b).
Aylara göre ilinin şebeke suyu sıcaklıkları
Su sıcaklığı () Su sıcaklığı ()
Şubat 6,60
Mart 7,80
Nisan 10,70
Mayıs 14,50
Haziran 18,00
Temmuz 20,90
Ağustos 22,80
Eylül 21,60
Ekim 18,10
Kasım 14,60
MATLAB Hesaplamaları
Bu bölümde sistemin ısıtılması ve sistemden ısı çekilmesi durumları aylara göre hesaplanmış ve sonuçları incelenmiştir. Hesaplamaları Mayıs ayı başlangıç ayı olarak seçilmiş ve hesaplamalara bu ay itibari ile devam edilmiştir. Sistemden ısı çekilmesi Ekim-Nisan ayları arasında olup hesaplamalar mevsim sıcaklıklarına göre yapılmıştır. Mayıs ayının sonu itibari ile yapılan hesaplamaların sonuçları bir sonraki ayın başlangıç koşulu olarak kabul edilmiştir. Böylelikle sistem baştan başlatılmadan sürekliliği olan bir yıllık bir davranış gözlenmiştir. Ayrıca bu kısımda Ekim-Nisan ayları için sistemden çekebildiğimiz ısı miktarları hesaplanarak grafiğe dökülmüştür.
Şekil.2 Toprak katmanlarının 3 boyutta gösterimi.

UEMK 2019 Proceedings Book
24/25 October 2019 Gaziantep University, TURKEY 720
BULGULAR
Bu çalışma iki ana bölümden oluşmaktadır. Toprak altına boruların yerleşimi iki farklı derinlikte olduğu kabul edilmiştir Bu kısımda başlangıç sıcaklıkları yukarıdaki zaman adımı sonucunda ortaya çıkan sıcaklık profili baz alınarak oluşturulmuştur. BTES’in merkez yüzeyinin toprağa yakın olan bir üst katmanı TKIP sisteminin borularının döşendiği yüzey olarak seçilmiştir. Bu seçimde merkez yüzey sıcaklığının daha yüksek olması ve buradan çekilecek olan ısı miktarının daha fazla olması nedeniyle ve de merkeze en yakın katman olması itibariyle bu yüzey en uygun seçenek olarak belirlenmiştir. Boruların yerleşimdeki geometri ise daha yüksek verim elde edebilmek için BTES paralel olarak ve akış yönüne zıt akış biçiminde tanımlanmıştır. Bu yüzden yine yüzeylerde 67x67 nod sayısı ve 6 cm nod aralıkları devam ettirilmiştir. Burada farklı olarak sisteme giren suyun ilk sıcaklığı mevsimlere bağlı olarak şebeke su sıcaklıkları ile örtüşecek biçimde belirlenmiştir. Yine sisteme giriş ve sistemden çıkış yapan çevrim suyu sıcaklıkları farkı ile ısı pompasının verimi göz önüne alınarak sistemden farklı sürelerdeki ısı miktarları hesaplanmıştır
Şekil 3. TKIP ve BTES Durumunda Her Ayın Son Günündeki Verim Değerleri.
0,63 0,64
0,8 0,84 0,87 0,85 0,81 0,81 0,780,72
0,6
0,4
TKIP&BTES Verim Değeleri

UEMK 2019 Proceedings Book
24/25 October 2019 Gaziantep University, TURKEY 721
Şekil 4. TKIP & BTES Durumunda Her Ayın Son Günündeki Isı Kaybı Değerleri
Şekil 5 TKIP & BTES Durumunda Her Ayın Son Günündeki Sistemden Çekilen Isı
Değerleri. Ekim ayından itibaren Nisan ayına kadar öncekine ek olarak mevsimsel koşullara bağlı olarak sistemden ısı çekerek buna bağlı değişimler de hesaplamıştır. Yine gün bazlı olarak bir ay için sistemden çekilen toplam ısı ve sistemden kaybedilen toplam ısı hesaplamalarının sonuçları yansıtılmıştır. Bu sonuçlara bakıldığında Aralık ayında sistemden çekilen ısı 24kW’a yaklaşan bir değerle maksimum olmuştur. Nisan ayı için ise 2.7kW’a yaklaşan bir değer ile minimum aylık değer hesaplanmıştır. Değerler de beklendiği üzere hava sıcaklığının düşmesi ile artarak ve yine hava sıcaklığının artması ise düşerek beklenilen değerlere yakın bir davranış göstermiştir. Ekim ayı ve özellikle Kasım ayında sistemden çekilen toplam ısının bir miktar parabolik davranış gösterdiği görülmektedir. Bunun sebebi ise ısı çekmeye başladığımız ilk aylarda sistemin sıcaklık değerlerinin yüksek olmasından, akışkanın sıcaklığının yüksek sıcaklık değerlerine
13
9
5,5
3,8
5,8
2,7 3,2 3,2
5,96,8
8,8
14
ocak şubat mart nisan mayıs haziran temmuz ağustos eylül ekim kasım aralık
TKIP & BTES Isı Kaybı Değerleri (kWx10^4)
2,2
32,3
3,7
7
3,5
2,6
Ekim Kasım Aralık Ocak Şubat Mart Nisan
TKIP &BTES Çekilen Isı Değerleri (kWx10^3)

UEMK 2019 Proceedings Book
24/25 October 2019 Gaziantep University, TURKEY 722
hızlıca ulaşmasıdır. İlerleyen aylarda sistemimizde depolanan ısının azalmasına bağlı olarak sistemimizden çekilen toplam ısı değerleri lineer bir davranışa yönelmiştir.

UEMK 2019 Proceedings Book
24/25 October 2019 Gaziantep University, TURKEY 723
Şekil 6. TKIP& BTES Isıtma, Soğuma ve Isı Çekimi Durumu İçin Aylara Göre
Merkez Yüzeydeki (-2,5 M) Sıcaklık Dağılımları

UEMK 2019 Proceedings Book
24/25 October 2019 Gaziantep University, TURKEY 724
SONUÇ
Ortaya çıkan sonuçlar doğrultusunda sistemin çalıştırılmaya başlandığı ilk aylarda verimli bir şekilde ısı depolama sağlanabilmiştir. Daha sonrasında ise modellemesi yapılan hacmin yeterli olmaması nedeniyle bu verimin giderek düştüğü gözlemlenmiştir. Benzer şekilde ısı çekimi süresince sistemden verimli ve yeterli bir bicimde ısı çekmeyi başlandığı gözlemlenmiştir. Isı çekiminin yapıldığı aylarda kullanılması planlanan ısı pompasını COP değerlerinin karşılaştırılması yapıldığında BTES uygulamalı sistemin daha yüksek değerlere sahip olduğu tespit edilmiştir. Belirlenen konutun ısıtılması için gerekli ısı miktarının sistemden karşılandığı hesaplanmıştır. Çıkan sonuçlar değerlendirildiğinde çekilen ısının belirlenen konutun ısıtılması için yüzde yüz aktartılabilmesi durumunda yeterli olacağı görülmüştür. Fakat dünyada ki hiçbir ısı transfer sistemi yüzde yüz verime sahip değildir. Bu yüzden konutun için ısıtılması için gerekli çekilen ısının yetersizliği söz konusudur Hesaplamalar yapılırken kabul edilen ihmallerde göz önüne alındığında COP değerinin, sistemde depolanan ısı enerjisinin ve ısı çekimi değerlerinin düşmesi beklemektedir. Bu değerleri iyileştirmek için oluşturulan modele göre sistemimizde birtakım iyileştirmeler yapılması gerekmektedir. Modellemesinin yapıldığı TKIP ve BTES uygulamaları soğuk iklime sahip ancak güneş alan veya jeotermal kaynaklara yakın bölgelerde kullanım için gayet uygun sistemlerdir. Hesaplar dâhilinde verilen aralıkta yeterli ısı enerjisi üretilememesinin temel nedeni seçtiğimiz sistem hacminin küçük olmasından kaynaklanmaktadır. Yukarıdaki verim artış yöntemlerinin uygulanması dâhilinde oldukça TKIP ve BTES’in akılcı ve çevreci sistemler olduğu ispatlanmıştır. KAYNAKLAR
Andújar Márquez, J., Martínez Bohórquez, M., & Gómez Melgar, S. 2016. Ground thermal diffusivity calculation by direct soil temperature measurement. Application to very low enthalpy geothermal energy systems, Sensors, 16 (3): 306.
Anonim , 2015b, İllere göre şebeke suyu sıcaklıkları. http://www.svsltd.com.tr/gunes3.htm. SVS Enerji Sistemleri, İstanbul. Erişim tarihi: 01.04.2018 Anonim, 2004. Toprak Kaynaklı Isı pompası, uygulamaları ve hesaplamaları ile ilgili bilgiler, http://www.dicle.edu.tr/Contents/c1bc26e3-4692-4a8e-933e-
04ef617ac1df.doc. Dicle Üniversitesi, Diyarbakır. Erişim Tarihi 14.04.2019 Çakmaz, T., 2007. Termal Enerjinin Yeraltında Depolanması ve Toprak Kaynaklı Dikey Borulu Isı Pompalı Sistemler İçin Ekserji Analizi (doktora tezi, basılmamış) YTU, Fen Bilimleri Enstitüsü, İstanbul. Çengel Y., Boles M.A.,2002. The Second Law of Thermodynamics, Chap.5. Thermodynamic An Engineering Approach, 4th ed. Mc Graw Hill, Boston, England. Demir, H., 2006. Toprak Kaynaklı Isı Pompası Ve Toprak Isı Değiştiricilerinin
Optimizasyonu ve Geliştirilmesi (doktora tezi, basılmamış). Yıldız Teknik Üniversitesi, Fen Bilimleri Enstitüsü, İstanbul.

UEMK 2019 Proceedings Book
24/25 October 2019 Gaziantep University, TURKEY 725
Hepbaşlı A. ve Hancıoğlu E. 2001 Toprak Kaynaklı (Jeotermal) Isı pompalarının tasarımı, testi ve fizibilitesi. V. Ulusal Tesisat Mühendisliği Kongresi ve Sergisi. 3-6,
Ekim, Konya: 521-564. Incropera, F, P., Dewitt, P.,1996. Fundamentals of Heat and Mass Transfer Internal 4th ed, , Chap.8. Internal Flow, Willey, United States of America, 340. Kıncay, O., 2019. Isı pompaları .http://www.yildiz.edu.tr /~okincay/dersnotu /IsiPompasi.pdf, Yıldız Teknik Üniversitesi, İzmir Erişim Tarihi 15.06.2018
Miles, L. 1994 , Heat pump theory and services. Delmar Publishers Inc.

UEMK 2019 Proceedings Book
24/25 October 2019 Gaziantep University, TURKEY 726
SEASONAL ENERGY STORAGE MODELING AND SIMULATION IN COLD CLIMATE CONDITIONS (VAN REGION)
Hazel SAĞLAM ÖZDAMAR Van Yuzuncu Yıl University, Başkale Vocational School, Tuşba, Van Turkey [email protected] Osman Seyit ÖZDAMAR Iskenderun Technical University, Institute of Energy, Iskenderun, Hatay, Turkey Van Yuzuncu Yıl University, Department of Mechanical Engineering, Tuşba, Van Turkey [email protected]
Suha Orçun MERT* Iskenderun Technical University, ISTE, Department of Mechanical Engineering, Iskenderun, Hatay, Iskenderun Technical University, Institute of Energy, Iskenderun, Hatay, Turkey Turkey [email protected], [email protected] Tolga DEPCİ Iskenderun Technical University, ISTE, Department of Engineering Sciences, Iskenderun, Hatay, Turkey tolga.depci@ iste.edu.tr
ABSTRACT: Today, the most widely used types of energy are electricity and heat energy and are mostly supplied from fossil fuels. However, due to the reasons such as depletion of fossil fuels, increasing prices and damages to the environment, the importance given to energy storage methods and R & D studies are increasing. It aims to eliminate the time difference between the time when the energy is needed and its use by storing waste energy or renewable energy resources that are limited as a result of the use of energy through energy storage methods. Especially in our country, the importance of storage of renewable energy sources and produced energy is increasing day by day in order to reduce domestic dependency and to reduce dependence on foreign sources. In this study, UTES (Underground Thermal Energy Storage), which is one of the thermal energy storage (TED) methods, is modeled for Van Region by MATLAB program. The aim of this study is to investigate the performance of using an isolated zone defined by day heat system as TED. The area where thermal energy will be stored is determined as 5x5x5m soil area on Van Yüzüncü Yıl University Campus. In order to protect the stored heat, it was assumed that the volume was covered with 20 cm thick XLPE (Crosslinked Polyethylene) insulation. In the central part of the area (-2.5m), 140 m long U shaped underground pipes were designed. The temperature distribution in the soil was calculated by using the Finite Element Method (SEM) in MATLAB. The calculations were made for two different time conditions. The first part

UEMK 2019 Proceedings Book
24/25 October 2019 Gaziantep University, TURKEY 727
was applied for the whole year starting from May. Thus, temperature distribution, heat loss and yield calculations were made for one-year time period according to 3D months in soil. In the other part, it was evaluated independently each month. The highest yields were observed in May, while the highest yields were observed in July. It was found that the maximum heat loss from the system was in January and December, and the maximum heat loss was observed in these months. Key words: Thermal Energy Storage, Energy Efficiency, UTES, Finite Element Method SOĞUK İKLİM KOŞULLARINA SAHİP (VAN BÖLGESİ) BÖLGELERDE MEVSİMSEL ENERJİ DEPOLAMA MODELLENMESİ VE SİMÜLASYONU
ÖZET: Günümüzde en çok kullanılan enerji çeşitleri elektrik ve ısı enerjisidir ve çoğunlukla da fosil yakıtlardan sağlanmaktadır. Fakat fosil yakıtların tükenmesi, artan fiyatları ve çevreye verdiği zararlar gibi nedenlerden dolayı enerji depolama yöntemlerine verilen önem ve Ar-Ge çalışmaları artmaktadır. Enerji depolama yöntemleri ile enerjinin kullanımı sonucunda oluşan atık enerjiyi veya zamanı kısıtlı olan yenilenebilir enerji kaynaklarını depolayarak enerjiye ihtiyaç duyulduğu zaman ile kullanımı arasındaki zaman farkı gidermeyi amaçlamaktadır. Özellikle ülkemizde yerli kaynaklarının sınırlı olması ve dışa bağımlığı azaltmak için yenilenebilir enerji kaynakları ve üretilen enerjinin depolanmasının önemi gün geçtikçe artmaktadır. Bu çalışmada Termal Enerji Depolama (TED) yöntemlerinin biri olan yeraltında termal enerji depolama olan UTES (Underground Thermal Energy Storage) yöntemi MATLAB programıyla Van Bölgesi için modellenmiştir. Bu çalışmanın amacı gün ısı sistemi ile tanımlı izole edilmiş bir bölgenin TED olarak kullanılmasının performansının incelenmesidir. Termal enerjinin depolanacağı alan Van Yüzüncü Yıl Üniversitesi Kampüsü’nde 5x5x5m toprak alanı olarak belirlenmiştir. Depolanan ısının korunması için hacmin etrafının 20 cm kalınlığında XLPE (Çapraz Bağlı Polietilen) yalıtım ile kaplandığı kabul edilmiştir. Alanın merkez kısmında (-2,5m) 140 m uzunluğunda U şeklinde toprak altı borularının tasarımı yapılmıştır. Toprak içerisindeki sıcaklık dağılımının hesabı Sonlu Elementler Metodu (SEM) ile MATLAB programında yapılmıştır. Çalışmada hesaplamalar iki farklı zaman koşulu için yapılmıştır. İlk kısımda Mayıs ayından başlanılarak tüm yıl için uygulanmıştır. Böylece bir yıllık zaman dilimi için toprak içerisindeki 3B aylara göre sıcaklık dağılımı, ısı kaybı ve verim hesapları yapılmıştır. Diğer kısımda ise her ay bağımsız olarak
değerlendirilmiştir. Bir yıl için yapılan hesaplamalar da ise en yüksek verim değerlerinin Mayıs ayındayken, en yüksek sıcaklık değerleri Temmuz ayında gözlemlenmiştir. Sistemden en fazla ısı kaybının ise Ocak ve Aralık aylarında olduğu, aynı zamanda en fazla ısı kaybının da bu aylarda olduğu tespit edilmiştir.
Anahtar sözcükler: Termal Enerji Depolama, Enerji verimliliği, UTES, Sonlu Elementler Metodu

UEMK 2019 Proceedings Book
24/25 October 2019 Gaziantep University, TURKEY 728
GİRİŞ
Günümüzde en çok kullanılan enerji çeşitleri elektrik ve ısı enerjisidir ve çoğunlukla da fosil yakıtlardan sağlanmaktadır. Fakat fosil yakıtların tükenmesi, artan fiyatları ve çevreye verdiği zararlar gibi nedenlerden dolayı enerji depolama yöntemlerine verilen önem ve Ar-Ge çalışmaları artmaktadır. Son zamanlarda TED sistemlerinin kullanılması gelişmiş ülkelerde yaygınlaşmaya başlamıştır. TED yöntemlerinden biri olan yeraltında termal enerji depolama UTES (Underground Thermal Energy Storage)
n çok tercih edilen yöntemlerdendir. Isınmada yaygın olarak kullanılan yöntemlerle karşılaştırıldığında bu yöntemlerin tercih edilmesine bağlı olarak fosil yakıt tüketimindeki azalma ile sonuçlanması sera gazlarının salınımında ciddi bir düşüş olacağı göz ardı edilmemelidir (Yılmazoğlu, 2010). BTES birden fazla uygulama ve modellenmesi ile ilgili literatürde birçok çalışma bulunmaktadır. BTES metodu genellikle akifer bulundurmayan jeolojik olarak dengeli ve bozulmalarını olmadığı bölgelerde kullanılmaktadır. Bu metot diğerlerine göre daha küçük ölçekli konutların ısıtılmasında ve soğutulmasında kullanılmaktadır. Tekniğin temel çalışma prensibi toprağın altı ve üstü arasındaki sıcaklık farkından kaynaklı ısı taşınımına dayanmaktadır. Örnek olarak Türkiye’nin doğusunda bulunan Van bölgesi kış aylarında -30oC’lere kadar düşmektedir. Fakat Van bölgesinin jeolojik yapısı incelendiğinde jeotermal bakımdan, orta entalpi bakımından zengin bir bölge olduğu tespit edilmiştir. Buda yeraltı toprak sıcaklarının 10oC ile 15oC arasında olmasını sağlamaktadır. Kanallarda termal enerji depolamanın temel prensibi yeraltı ve üstündeki sıcaklık farkından yararlanarak, bu farkı ısıtma ve soğutmada kullanmaktır. Genel olarak çalışma prensibi; ısıtma veya soğutma yapılacak olan yapının ısıl yükleri hesaplanır. Bu hesaplamalara göre ısı yüklerini karşılayacak sondajlar açılır ve sondaj derinliği kadar yalıtım özelliği olmayan ve korozyona karşı dirençli polietilen borular yerleştirilir. Boruların yerleştirilmesi sırasında düzgün olması için boruların alt kısmına ağırlık yerleştirilir. Burada dikkat edilmesi gereken sondajlar arasında ısı etkileşimi olmaması için aralarındaki mesafenin 10 m olacak şekilde yerleşimleri yapılır. Boru ile toprak arasında ısıl direnci en aza indirgemek için
dolgu malzemesi enjeksiyonu yapılır. Bu sayede boru ile toprak arasındaki temas maksimum düzeye çıkartılır. Isıtma aylarında soğuk bir akışkan borular içerisinde dolaştırılır ve akışkanın sıcaklığı yükseltilerek ısıtılması istenilen konuta verilir. Aynı işlem soğutma aylarında ise sıcak olan akışkan borularda dolaştırılarak akışkanın sıcaklığı düşürülür. Bu teknikte dikkat edilmesi gerekenlerden biri sistemin sürekli olarak ısıtma için kullanılması durumunda topraktan çekilen ısı miktarı, toprağa verilen ısı miktarını geçerse toprak sıcaklığı zamana bağlı olarak düşmeye başlayacaktır. Bu durumu önlemek için sıcak aylarda güneş enerjisi veya atık ısı kaynağı gibi kaynaklardan elde edilen sıcak akışkan borularda dolaştırılarak toprak sıcaklığı ve verimi artırılmış olur (Özsoy, 2015). Bu çalışmada Termal Enerji Depolama (TED) yöntemlerinin biri olan yeraltında termal enerji depolama olan UTES (Underground Thermal Energy Storage) yöntemi MATLAB programıyla Van Bölgesi için modellenmiştir. Bu çalışmanın amacı gün ısı sistemi ile tanımlı izole edilmiş bir bölgenin TED olarak kullanılmasının

UEMK 2019 Proceedings Book
24/25 October 2019 Gaziantep University, TURKEY 729
performansının incelenmesidir. Termal enerjinin depolanacağı alan Van Yüzüncü Yıl Üniversitesi Kampüsü’nde 5x5x5m toprak alanı olarak belirlenmiştir. Depolanan ısının korunması için hacmin etrafının 20 cm kalınlığında XLPE (Çapraz Bağlı Polietilen) yalıtım ile kaplandığı kabul edilmiştir. Alanın merkez kısmında (-2,5m) 140 m uzunluğunda U şeklinde toprak altı borularının tasarımı yapılmıştır. Toprak içerisindeki sıcaklık dağılımının hesabı Sonlu Elementler Metodu (SEM) ile MATLAB programında yapılmıştır. Çalışmada hesaplamalar iki farklı zaman koşulu için yapılmıştır. İlk kısımda Mayıs ayından başlanılarak tüm yıl için uygulanmıştır. Böylece bir yıllık zaman dilimi için toprak içerisindeki 3B aylara göre sıcaklık dağılımı, ısı kaybı ve verim hesapları yapılmıştır. YÖNTEM
Modellemenin temelini SEM metodu oluşturmaktadır. BTES kısmı için toprağa verilen ısının hesaplanması gerekmektedir. Meteorolojiden alınan verilerde günün belli saatleri için Van bölgesindeki güneşten gelen radyasyon ölçülmüştür. Fakat verilenin değişken olmasından dolayı aylar için günlük güneşten gelen ortalama radyasyon değerleri hesaplanmıştır. Tabloda ayrıca aylara göre güneşlenme süresi ve günlük güneşlenme sürelerinin ortalama değerleri hesaplanmıştır. Güneşten Gelen Enerjinin ve Gün Sayılarının Hesaplanması BTES kısmı için toprağa verilen ısının hesaplanması gerekmektedir. Meteorolojiden alınan verilerde günün belli saatleri için Van bölgesindeki güneşten gelen radyasyon ölçülmüştür. Fakat verilenin değişken olmasından dolayı aylar için günlük güneşten gelen ortalama radyasyon değerleri hesaplanmıştır. Tabloda ayrıca aylara göre güneşlenme süresi ve günlük güneşlenme sürelerinin ortalama değerleri hesaplanmıştır. Tablo 1. Güneşten Gelen Aylara Göre Radyasyon Değerleri (MGM, 2016).
Aylar Güneşten gelen ortalama radyasyon miktarı (W/hm2)
Aylık ortalama güneşli gün sayısı (gün)
Günlük ortalama güneşlenme süresi (saat)
Ocak 11.9 19.1 4.6
Şubat 17.7 21.1 5.4 Mart 19.9 17.8 6.0 Nisan 26.4 17.7 7.3 Mayıs 27.4 19.9 9.3
Haziran 30.6 24.8 11.7
Temmuz 31.9 28 12.1 Ağustos 27.6 28.7 11.4 Eylül 25.6 27.6 9.8 Ekim 18.9 21.6 7.1

UEMK 2019 Proceedings Book
24/25 October 2019 Gaziantep University, TURKEY 730
Kasım 15.6 21 5.5 Aralık 11.7 20.2 4.2
Güneşten gelen radyasyon gün ısısı yöntemi ile depolanmıştır. Suda depolanan enerji toprak altı boruları yardımıyla toprakta termal enerji depolanması için kullanılmıştır. Günlük sisteme verilecek olan toplam ısı miktarı aylara göre aşağıdaki eşitliklerden hesaplanmıştır (Anonim, 2016c). 𝑄𝑘 = 𝑅 ∗ 𝐹 ∗ 𝑠 ∗ ɲ𝑘 (1) Hesaplamalarda aşağıdaki fiziksel özelliklere sahip gün ısısı sistemi kullanıldığı kabul edilip ve hesaplamalar bu değerlere göre yapılmıştır. Aylara göre kolektörde toplanan ortalama günlük ısıl enerji miktarı Tablo 2. de gösterilmiştir. 𝑅 : Tablo 3.8 aylara göre ortalama güneşten gelen radyasyon miktarı (W/m2) 𝐹 : 30 o eğimli güneş kolektörü için eğim faktörü 1,03 𝑠 : 1,76 m2 ɲ𝑘 : 0,7 Tablo 2. deki veriler termal enerji depolama hesaplamalarında kullanılacaktır. Su depolama hacmi 300 lt olarak seçilmiştir. Tablo 2. Kolektörde aylara göre günlük ortalama hesaplanan ısı enerji miktarı.
Ocak Şubat Mart Nisan
Mayıs Haziran
𝑄𝑘 (𝑘𝑊/𝑔)
15.0 26.3 29.7 39.3 40.71 45.5
Temmuz
Ağustos Eylül Ekim Ekim
Kasım
𝑄𝑘 (𝑘𝑊/𝑔)
47.5 41.1 38.2 28.1 23.3 17.4
Sabit Değerlerin Hesaplanması
Zaman aralığının hesaplamasında akışkanın toprak altı borularda tam bir döngüyü yapması için gerekli süre alınmıştır. ∆𝑡 hesaplanması 𝑉𝑏 = 𝜋𝑥𝑟𝑏
2𝑥𝐿′𝑡𝑜𝑝 (2)
𝑟𝑏 = 1,27 𝑐𝑚 𝐿′𝑡𝑜𝑝 = 140 𝑚
𝑉𝑏 = 𝜋𝑥𝑟𝑏2𝑥𝐿′𝑡𝑜𝑝 = 𝜋𝑥(1,27𝑥10
−2𝑚)2𝑥140𝑚 ≅ 0,071 𝑚3
∆𝑡 =𝑉𝑏
𝑄𝑝=
0.07𝑚3
0.4 𝑚3/ℎ≅ 10 𝑑𝑘 (3)

UEMK 2019 Proceedings Book
24/25 October 2019 Gaziantep University, TURKEY 731
𝑉𝑏 = 𝜋𝑟𝑏2𝐿𝑏 = 𝜋𝑥(1.25𝑥10
−2𝑚)2𝑥140𝑚 ≅ 0.07𝑚3 ∆𝑡 = 10 𝑑𝑘 Zaman aralığı
Toprak için fourier sayısı aşağıda hesaplamıştır.
𝐹𝑜 =𝛼∆𝑡
(∆𝑥2)=0,415 10−6𝑚2/𝑠 ∗ 600𝑠
(6 ∗ 10−2𝑚)2≅ 0,069
Tasarımda toprakta belirlenen alanın duvarlarında 20 cm kalınlıkta polietilen köpük kullanılarak yalıtım yapılmıştır. Yalıtım malzemesinin özellikleri aşağıda listelenmiştir. 𝑘𝑦 = 0,04𝑊/𝑚𝐾 Yalıtım malzemesi ısı iletkenliği
𝐿𝑦 = 20 𝑐𝑚 Yalıtım malzemesi kalınlığı
Diğer gerekli bir bilgi borular içerisindeki suyun debisi bilinmesi gerekmektedir. 8. adımda akışın laminar ve Reynold sayısı 2000 olarak kabul edilmiştir. Buradan yapılan
hesaplamalarda suyun debisi 𝟎, 𝟓𝟑𝟔𝒎𝟑
𝒉 olarak hesaplanmıştır. Pompa gücü hesaplanıp
ve piyasa araştırması yapıldığında aşağıdaki özelliklere sahip pompa seçimi yapılmıştır. 𝑃𝑝 = 700 𝑊 Kabul edilen sirkülasyon pompa gücü
𝑄𝑝 = 0.5 𝑚3/ℎ Kabul edilen borulardaki suyun debisi
Hesaplamalarda kolaylık olması için ilk olarak iki boyutta merkez kısım için hesaplamalar yapılmıştır. Sonraki kısımda derinlik için hesaplamalar yapılarak farklı derinlikler için ısı dağılımı hesaplanmıştır. Burada foruier değeri yeniden program tarafından hesaplanmıştır. ∆𝑧 = 10 𝑐𝑚 Topraktaki derinlik aralığı Boru Boyunca Sıcaklık Dağılımını
Başlangıç için boru içerisindeki akışkanın konuma göre sıcaklık değişiminin belirlenmesi gerekmektedir. Toprak altında gömülü bulunan borulardan geçen akışkan yataydaki konuma bağlı olarak zamanla sıcaklığı değişmektedir. Şekil 2. boru boyunca akışkanın sıcaklık ve ısı değişimini temsili olarak gösterimidir.
Şekil 1. Boru boyunca akışkandaki sıcaklık ve ısı değişimin (Demir, 2006).
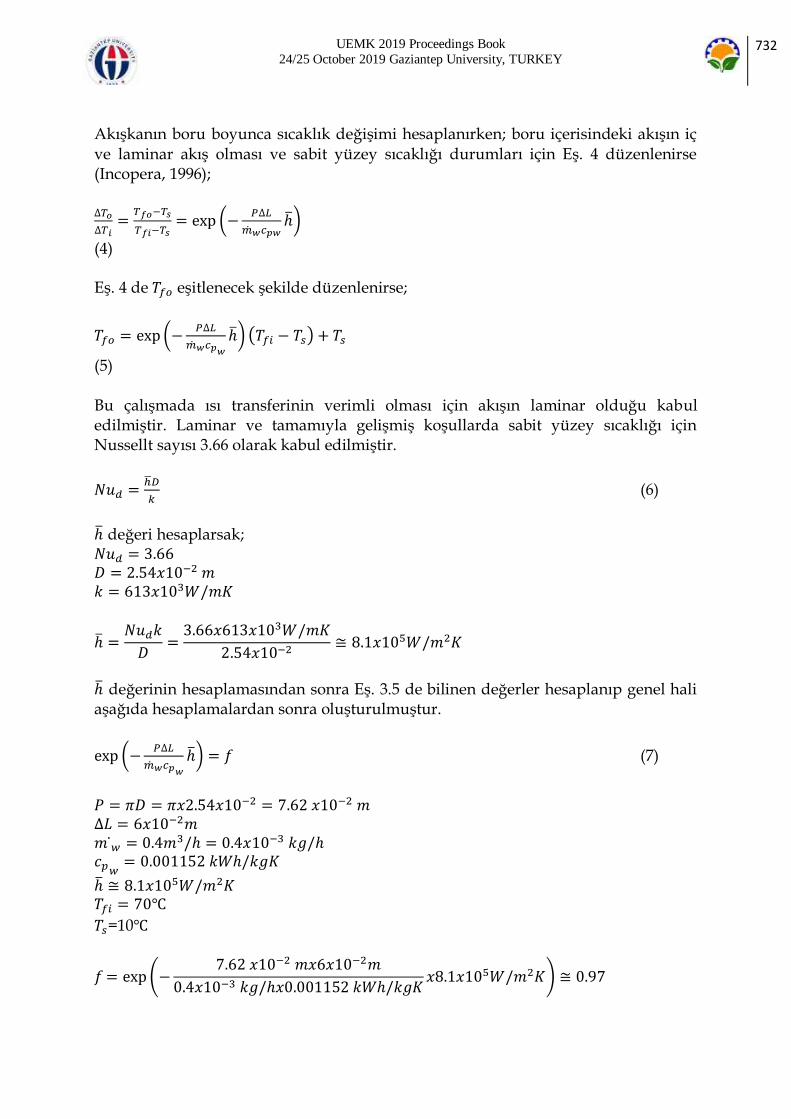
UEMK 2019 Proceedings Book
24/25 October 2019 Gaziantep University, TURKEY 732
Akışkanın boru boyunca sıcaklık değişimi hesaplanırken; boru içerisindeki akışın iç ve laminar akış olması ve sabit yüzey sıcaklığı durumları için Eş. 4 düzenlenirse (Incopera, 1996); ∆𝑇𝑜
∆𝑇𝑖=
𝑇𝑓𝑜−𝑇𝑠
𝑇𝑓𝑖−𝑇𝑠= exp (−
𝑃∆𝐿
𝑤𝑐𝑝𝑤ℎ)
(4) Eş. 4 de 𝑇𝑓𝑜 eşitlenecek şekilde düzenlenirse;
𝑇𝑓𝑜 = exp (−𝑃∆𝐿
𝑤𝑐𝑝𝑤
ℎ) (𝑇𝑓𝑖 − 𝑇𝑠) + 𝑇𝑠
(5) Bu çalışmada ısı transferinin verimli olması için akışın laminar olduğu kabul edilmiştir. Laminar ve tamamıyla gelişmiş koşullarda sabit yüzey sıcaklığı için Nussellt sayısı 3.66 olarak kabul edilmiştir.
𝑁𝑢𝑑 =ℎ𝐷
𝑘 (6)
ℎ değeri hesaplarsak; 𝑁𝑢𝑑 = 3.66 𝐷 = 2.54𝑥10−2 𝑚 𝑘 = 613𝑥103𝑊/𝑚𝐾
ℎ =𝑁𝑢𝑑𝑘
𝐷=3.66𝑥613𝑥103𝑊/𝑚𝐾
2.54𝑥10−2≅ 8.1𝑥105𝑊/𝑚2𝐾
ℎ değerinin hesaplamasından sonra Eş. 3.5 de bilinen değerler hesaplanıp genel hali aşağıda hesaplamalardan sonra oluşturulmuştur.
exp (−𝑃∆𝐿
𝑤𝑐𝑝𝑤
ℎ) = 𝑓 (7)
𝑃 = 𝜋𝐷 = 𝜋𝑥2.54𝑥10−2 = 7.62 𝑥10−2 𝑚 ∆𝐿 = 6𝑥10−2𝑚 𝑚 𝑤 = 0.4𝑚
3/ℎ = 0.4𝑥10−3 𝑘𝑔/ℎ 𝑐𝑝𝑤 = 0.001152 𝑘𝑊ℎ/𝑘𝑔𝐾
ℎ ≅ 8.1𝑥105𝑊/𝑚2𝐾 𝑇𝑓𝑖 = 70
𝑇𝑠=10
𝑓= exp(−7.62 𝑥10−2 𝑚𝑥6𝑥10−2𝑚
0.4𝑥10−3 𝑘𝑔/ℎ𝑥0.001152 𝑘𝑊ℎ/𝑘𝑔𝐾𝑥8.1𝑥105𝑊/𝑚2𝐾) ≅ 0.97

UEMK 2019 Proceedings Book
24/25 October 2019 Gaziantep University, TURKEY 733
Eş. 7’de 𝑓 yerine konulursa; 𝑇𝑓𝑜 = 0.97 (𝑇𝑓𝑖 − 𝑇𝑠) + 𝑇𝑠 (8)
Programda Eş.8’den boru boyunca geçen akışkanın sıcaklık değişimini hesaplamakta kullanılmıştır BTES Matlap Hesaplamaları
Hesaplamalara iki boyutta merkez yüzey seçilerek başlanmıştır. Merkez yüzeyinin yaklaşık 4m*4m yüzey alanına sahip olduğu kabul edilerek ve bu alanı çevreleyen 20 cm kalınlığında bir yalıtım yüzeyinin olduğu varsayılmıştır Buna dayanarak 6 cm aralıklarla 67*67 nodun uygun bir biçimde tüm yüzey alanının istenilen hassasiyette kapladığı bir çalışma alanı oluşturulmuştur. Sol alt köşenin hemen bir sağındaki noddan itibaren sıcak su girişinin yapıldığı varsayılıp bu nodun sağında ve solunda toprak yüzey nodlarının bulunduğu kabul edilmiştir. Giriş suyu sıcaklığı gün ısı sistemi yardımıyla ısıtılan sıcak su değerleridir. Sıcak su girişi 70 oC olarak kabul edilmiştir. Sıcak su girişinin yapıldığı 1. noddan 66. noda kadar akışın devam ettiği düşünülerek 67. sınır nodunun yine sınır toprak nodu olduğu kabul edilmiştir. Aşağıdaki Şekil 2 nodların yerleşimi gösterilmiştir.
Şekil 2. Yüzey kesitinde 67x67 nodun yerleşim gösterimi. İlk olarak başlangıç toprak sıcaklığı 10 olarak kabul edilmiştir. Toprak altı boru boyunca suyun konuma bağlı olarak sıcaklık değişimi ise Eş. 8’den hesaplandı. Nodun bir sonraki zaman SEM metodları kullanılarak giriş nodunda itibaren bir sonraki nodu komşuluklarındaki toprak sıcaklıkları hesaplanarak adım adım ilerlemektedir. Sağ üst köşe çıkış nodu sıcaklığı ve sol alt köşe nodu farkı baz alınaraktan sisteme aktarılan o yüzey için toplam ısı miktarı belirlenmiştir. Sonrasında ise merkez yüzeyin bir sonraki zaman için bütün nodlardaki sıcaklık değerleri hesaplanması ile bir üst yüzeyin sıcaklık değerleri yine SEM yardımıyla hesaplanmıştır. Sistemin toplam yüksekliği 5m olup merkez yüzeyinden toprak yüzeyine olan mesafenin de- 2,5 m olduğu göz önüne alınarak toplam 25 üst yüzey katmanı olduğu kabul edilmiştir. Böylelikle sistemde üçüncü boyutta sıcaklık ve ısı değerleri hesaplanmıştır.

UEMK 2019 Proceedings Book
24/25 October 2019 Gaziantep University, TURKEY 734
Zaman adımlarının süresi ve sayısı hesaplanırken bir günün 24 saatten oluştuğu ve gün içerisinde güneşlenme saati ve gece süreleri göz önüne alınıp, sisteme giriş yapan suyun sistemde tam bir döngü yapması için gerekli olan süre temel alınmıştır. Sisteme giriş yapan suyun sistemde tam bir döngü yapması için gerekli olan 10 dk aynı zamanda adım süresi olarak da belirlenmiştir Güneşli süre zarfında kaç kez döngü oluşturabileceği göz önüne alınarak toprağın ısınması için toplam kaç kere döngü yapabileceği de ısıtma zaman adım sayısı olarak belirlenmiştir. Mevsimlere göre akşam saatleri temel alınarak soğutma kısmı içinde soğutma adım sayısı belirlenmiştir. Gün ışığının olmadığı zamanlarda ise sistem soğuma durumuna geçmiştir. Bu soğumanın etkisi hesaplanırken, soğumanın tüm yüzeylerde, yalıtım malzemesi sıcaklığına bağlı olarak ve soğuma süresi adımları boyunca ısı kayıpları hesaplandı Hesaplamalarda soğumanın sınırlara aynı anda etki etki ettiği dikkate alınmıştır. BULGULAR
Bütün bu hesaplamalarının sonucunda bütün yüzeylerde sıcaklık değerleri oluşturulmuştur. Sınırdaki nodların sıcaklıkları ve sınır nodlarının yüksekliği ve aralığı doğrultusunda hesaplanan yüzey alanları baz alınaraktan ve sınır nodu ile toprak sıcaklığına bağlı olarak hesaplanan yalıtım sıcaklığı farkı ile, bütün yüzey nodlarının kaybettiği ısı miktarları ve bunların toplamı sistemimizin kaybettiği toplam ısı miktarı olarak ortaya çıkmıştır.
Şekil 3. BTES durumunda her ayın son günü için verim değerleri
0,62 0,65
0,82 0,85 0,87 0,85 0,81 0,78 0,76 0,730,6
0,4
Aylık verim değerleri

UEMK 2019 Proceedings Book
24/25 October 2019 Gaziantep University, TURKEY 735
Şekil 4. BTES durumunda her ayın son günü için ısı kaybı değerleri
Genel olarak toprağın ısıya doyması ile gün geçtikçe verim değerleri lineer olarak azalmaktadır. Verimin düşmesi ve ısı kaybının artmasındaki en büyük etken çeper nodların sıcaklılarının yükselmesi ile ısı kaybındaki artıştır. Aynı zamanda sıcaklığı artan bir kütlenin zamana bağlı olarak ısı çekmesi de azalmaktadır. Özellikle kış aylarında verimin yıl içerisindeki en düşük değerleri gözlemlenmektedir. Bunun sebebi kış aylarında güneşte gelen radyasyonun az olması ile birlikte ısı kaybının da çevre koşullarına bağlı olarak artmasıdır. Görüldüğü üzere günlere bağlı olarak ısı kayıpları lineer olarak artmaktadır. En yüksek verimler de beklendiği gibi yaz aylarında gözlenmiştir. Bunun sebepleri ise güneşten gelen radyasyon miktarının artması ve aynı zamanda toprak sıcaklığının yükselmesi ile ısı kayıplarının azalmasıdır.
Şekil 5. BTES Sadece Isıtma Durumu İçin Merkez Yüzeydeki (-2,5 M) Sıcaklık Dağılım
2 2,21,9 2 2,2
2,73,2 3,3 3,2
2,1 2 2
Isı Kaybı Değerleri (kW)

UEMK 2019 Proceedings Book
24/25 October 2019 Gaziantep University, TURKEY 736
SONUÇ
Matematiksel model oluşturulurken akışkanın geçtiği güzergah gerçeğe yakın olması amaçlanarak, ısıl dağılım yalnızca düz bir plaka olarak değil Şekil 2. deki gibi zikzak biçiminde tasarlanmıştır. Ayrıca soğumanın gerçekleştiği anlarda, soğuma kenarlardan sırasıyla değil de, aynı anda gerçekleştiği kabul edilerek model oluşturulmuştur. Bu yaklaşımlar daha gerçekçi sonuçlar elde edilmesine yardımcı olmuştur. Oluşturulan sistemde sadece ısınma ve ısınma anındaki soğumaların yanı sıra, aynı zamanda güneşlenme süresi bitiminde ortaya çıkan soğuma evresi de dikkate alınmıştır. Bütün bunlara ek olarak model, üçüncü boyut içinde incelemeye olanak sağlaması düşünülerek katmanlara ayrılarak, katmanlardaki sıcaklık dağılım hesaplamaları da yapılmıştır. Modelleme sonuçlarına bakıldığında en yüksek sıcaklık değerleri Temmuz ayında ve Haziran ayında görülmüştür. En düşük sıcaklıklar ise güneşten gelen radyasyon miktarının azalmasına bağlı olarak aralık ayında tespit edilmiştir. Termal enerji depolanmasının ve sıcaklık değerlerinin Ağustos ayından sonra fazla değişim olmadığı hesaplanmıştır. Bu aydan sonraki sisteme verilen ısı enerjisinin sistemdeki mevcut ısıyı korumak için sistemde harcanmıştır. KAYNAKLAR
Anonim, 2004. Toprak Kaynaklı Isı pompası, uygulamaları ve hesaplamaları ile ilgili bilgiler, http://www.dicle.edu.tr/Contents/c1bc26e3-4692-4a8e-933e-04ef617ac1df.doc. Dicle Üniversitesi, Diyarbakır. Erişim Tarihi 14.04.2019 Anonim, 2016c. Güneş enerjisi kollektör hesabı ve tesisat bağlantıları. https://www.tesisat.org/gunes-enerjisi-kollektor-hesabi-ve-tesisat-baglantilari.html. Tesisat Bilgi ve Haber Portalı. Erişim Tarihi 10.01 2019
Cruickshanks, Frank B., O. Anderson, and James Bardsley.,2007. Borehole sealing in a coaxial heat exchanger by bentonite treatment. Report Prepared for Environment Canada, Climate Change Division (Atlantic Region), Halifax, Dartmouth, Canada Çengel Y., Boles M.A.,2002. The Second Law of Thermodynamics, Chap.5. Thermodynamic An Engineering Approach, 4th ed. Mc Graw Hill, Boston, England. Demir, H., 2006. Toprak Kaynaklı Isı Pompası Ve Toprak Isı Değiştiricilerinin Optimizasyonu ve Geliştirilmesi (doktora tezi, basılmamış). Yıldız Teknik Üniversitesi, Fen Bilimleri Enstitüsü, İstanbul. Incropera, F, P., Dewitt, P.,1996. Fundamentals of Heat and Mass Transfer Internal 4th ed, , Chap.8. Internal Flow, Willey, United States of America, 340.
Özsoy, A., 2015. Güneş enerjisinin ısıtma amaçlı mevsimlik depolanması ve ısı pompası destekli. Süleyman Demirel Üniversitesi Fen Bilimleri Enstitüsü Dergisi,, 19(2): 55-59. Uzun, M.H., 2010 Güneş Enerjisi Depolama Olanakları ve Bir Yöntemin Değerlendirilmesi (yüksek lisans tezi, basılmamış). Trakya Üniversitesi, Fen Bilimleri
Enstitüsü, Trakya. Yılmazoğlu, M Mustafa Zeki., 2010. Isı enerjisi depolama yöntemleri ve binalarda uygulanması. Politeknik Dergisi ,13.1: 33-42.

UEMK 2019 Proceedings Book
24/25 October 2019 Gaziantep University, TURKEY 737
EXTRACTED OF AMORPHOUS SILICA FROM INDUSTRIAL RAW MATERIALS TO USE AS AN ADDITIVE FOR THE DRILLING MUD
Mustafa Göktan AYDIN Iskenderun Technical University, Department of Petroleum and Natural Gas Engineering, Hatay, Turkey [email protected] Tolga DEPCİ Iskenderun Technical University, Department of Engineering Science, Hatay, Turkey tolga.depci@ iste.edu.tr Süha Orçun MERT Iskenderun Technical University, Department of Mechanical Engineering, Hatay,
Turkey Ersin BAHÇECİ Iskenderun Technical University, Department of Metallurgical and Material Engineering, Hatay, Turkey [email protected]
ABSTRACT: Due to rapid industrialization, drilling operation has been intensively increased. In order to make cost effective drilling operations, some additives, nano or microsize materials/ore, have been added into drilling mud. In the present study, amorphous silica as an additive was extracted from the industrial raw materials (pumice, diatomite, pyrophyllite and quartzite) with high silica content by alkaline treatment method. Chemical and morphologies properties of the industrial raw materials and the extracted amorphous silica were determined by, XRD, ATR, XRF, SEM and BET. Comparison of the results showed that highly pure amorphous silica (SiO2 ratio 98%), having a remarkable surface area (>300 m2/g) with meso-pore structure could produce regardless of the starting materials. Key words: amorphous silica, pumice, quartzite, diatomite, pyrophylite INTRODUCTION
In a drilling activities for oil and gas, one of the main components to lift cuttings to the surface, stabilizing the wellbore and subsurface pressures, soften the cutting surface, cool and lubricate the all systems is drilling mud. Due to rapid industrialization, new oil and gas fields have been extensively researched and especially difficult subsurface environments and rigid part of the earth’s crust are started to investigated. Therefore, formulation of the drill mud has been modified and while doing so, drilling operation is tried to cost effective [1-6]. Recently, Afolabi et al. [7,8] developed the new model to predict the fluid loss of the water based drilling fluid. They use as an additive
UEMK 2019 Proceedings Book
24/25 October 2019 Gaziantep University, TURKEY 738
commercial silica particle which enhance the properties of the drilling muds, especially the preserve the fluid loss. In the present study, amorphous silica was extracted from industrial raw materials, pumice, diatomite, pyrophyllite and quartzite to evaluate as an additive for drilling mud. Different novel and advanced materials like SiC, Si3N4, etc. are produced using amorphous SiO2 [9-11]. Generally, amorphous silica is synthesized by sol–gel method [12] and precipitation method [13] and low-temperature alkali extraction method [14]. Our research group prefers the use low-temperature alkali extraction method due to its simplicity and efficiency [15,16]. The pumice, diatomite, pyrophyllite and quartzite as industrial raw materials were used, since they are abundant, cheap and easy to obtain in Turkey. METHODS
Materials
The industrial raw materials with high silicium oxide content were chosen as starting materials. Pumice and diatomite from Van, Turkey, Quartzite and pyrophyllite from Malatya, Turkey were brought into our laboratory. All samples were crushed and ground to 80–85 mass% passing 180 μm. NaOH, H2SO4 and HCl (from Merck) were used for alkali extraction method. Methods
Mourhly et al., [14] and our past studies [15,16] 300 ml of 3 molarities NaOH in a 500 ml 3 neck flask equipped with a reflux condenser was prepared and 5 gr of the sample was added into the flask. The mixture was continuously stirred at 100 °C for 14 hours to dissolve the silica and produce sodium silicate. After that, the solid part was removed by filter paper and the liquid part was titrated with H2SO4 (5M) while being stirred vigorously until obtaining a silica gel which was occurred at pH 7 until the silica gel was occurred. The silica gel was kept at room temperature for 24 hours and then washed several times to remove the sulphate salt. The gel form was put into the furnace at 80°C for 24 hours. The obtained solid material was put into the flask which contained hydrochloric acid HCl (1M) solution and stirred at 110°C for 3 hours to remove the soluble minerals Al and K. The liquid and solid separation was done using centrifuge and the solid part was washed with distilled water at several times and dried at 110°C overnight and then sintered at 800 °C for two hours. All experiments were duplicated and the same procedure was followed for each industrial raw material. Characterization of the Ore and Amorphous Silica
Chemical composition, structure and morphological properties of the industrial raw materials and the extracted amorphous silica was determined by Spectro XEPOS, Rigaku Miniflex 600 with Cu Kα (40 kV, 15 mA, λ=1.54050 Å) XRD, Perkin Elmer

UEMK 2019 Proceedings Book
24/25 October 2019 Gaziantep University, TURKEY 739
Spectrum One FTIR-ATR and Leo Evo-40x VP Electron Microscope (Inonu University, Central Research Lab) and BET (Inonu University, Chemical Engineering Lab) RESULTS AND FINDINGS
The XRD patterns of the industrial raw materials and the extracted amorphous silica were presented in Figure 1. P-SiO2, D-SiO2, Pyr-SiO2 and Q-SiO2 refer to amorphous silica samples were extracted, pumice, diatomite, pyrophyllite and quartzite, respectively. The comparison studies of the XRD patterns showed that the amorphous SiO2 were extracted from the materials and there is no difference observed depending on the starting materials. The detected strong broad hump between 15 and 30° at 2θ values indicates the amorphous silica [14,15,17].
Figure 1. XRD Patterns of the Ores and Extracted Amorphous Silica
The IR spectra of the industrial raw materials and the amorphous silica materials are presented in Figure 2. The same result was observed in the IR spectra. The extracted amorphous silica process shows starting materials-independent character. All IR bands belonging to amorphous silica are nearly same and the vibrations were recorded at 1054 cm-1 and 792 cm-1, representing the stretching-vibrations of Si-O-Si, which are characteristic bands of the amorphous SiO2 [18].
5 15 25 35 45 55 65
2 q (Degree)
In
ten
sit
y (
a.u
)
Pumice
Diatomite
Pyrophyllite
Quartzite
5 15 25 35 45 55 65
2 q (Degree)
In
ten
sit
y (
a.u
)
P-SiO2
D-SiO2
Pyr-SiO2
Q-SiO2

UEMK 2019 Proceedings Book
24/25 October 2019 Gaziantep University, TURKEY 740
Figure 2. IR spectra of Ores and Extracted Amorphous Silica
In terms of the XRD and IR spectra results, the main composition of the extracted materials are silica and their structures are amorphous. The elemental composition of the extracted materials (Table 1) showed that the main composition was SiO2, supporting to XRD and IR results. It means that amorphous silica was easily extracted from pumice, diatomite, pyrophyllite and quartzite by the alkaline method. Table 1. Elemental analysis of the Ores and Extracted Amorphous Silica
Sample
Pumice
Diatomite
Pyrophylite
Quartzite
P-SiO2
D-SiO2
Pyr-SiO2
Q-SiO
2
SiO2 74.01 71.10 59.53 91.5 98.12
98.74
98.68
99.1
TiO2 0.22 0.08 0.71 0.21 n/a n/a n/a n/a Al2O3 14.7 11,48 30.14 3.12 0.06 0.23 0.4 0.08 Fe2O3 2.66 3,98 0.64 1.43 n/a n/a n/a n/a MgO 0.31 0.12 0.16 0.16 n/a n/a n/a n/a CaO 0.75 0,85 0.24 n/a n/a n/a n/a n/a
Na2O 1.44 0,58 0.65 n/a 0.35 n/a 0.210
n/a
K2O 4.5 1,20 1.89 2.18 0.54 n/a 0.14 0.22
The morphological structure of the raw materials and the amorphous silica materials were identified using SEM. The SEM images (Figure 3) show that the obtained materials have glassy structure and small particle size (agglomeration was seen due to the low resolution).
70
90
110
130
150
170
190
6501450225030503850
Wave number (cm-1
)
Tran
sm
itta
nce (
a. u
.)
Pumice
Diatomite
Pyrophyllite
Quartzite
50
70
90
110
130
150
170
190
7501550235031503950
Wave number (cm-1
)
Tran
sm
itta
nce (
a. u
.)
P-SiO2
D-SiO2
Pyr-SiO2
Q-SiO2

UEMK 2019 Proceedings Book
24/25 October 2019 Gaziantep University, TURKEY 741
Figure 3. SEM images of the Ores and Extracted Amorphous Silica
In order to detect small particle size in the SEM images, the surface areas of the extracted amorphous silica materials were determined using BET. The BET results indicates that the obtained amorphous silica materials have remarkable surface area. The small size and remarkable surface area can make the amorphous silica to form
Pumice
Diatomite
Pyrophylite
Quartzite
P-SiO2
D-SiO2
Pyr-SiO2
Q-SiO2

UEMK 2019 Proceedings Book
24/25 October 2019 Gaziantep University, TURKEY 742
very good dispersion in the drilling mud and caused the filling gaps to prevent the fluid loss. Table 2. BET Surface Area of the Ores and Extracted Amorphous Silica
Pum. Diat. Pyro. Quar. P-SiO2 D-SiO2 Pyr-SiO2 Q-SiO2
BET Surface Area, m2/g 2.97 62.8270 1.68 0,82 358.27 333.75 318.43 348.56
CONCLUSION
The experimental results showed that the highly pure amorphous silica (> 98 % content SiO2) could be extracted from the local and cheap silica rich industrial raw materials by alkaline treatment methods. Depending on the particle size and the remarkable surface area (> 300 m2/g), the obtained silica might be a good candidate as an additive for drilling mud. Since, usage of the silica might be reducing the permeability of the mud cake and fluid loss. RECOMMENDATIONS
As know that to improve the drilling fluid properties with cost effective way, some additives are mixed with drilling mud. Research should be done to improve the related properties of drilling mud by adding the obtained amorphous silica in different ratio. REFERENCES
[1] Abdo, J., & Haneef, M. D. (2012). Nano-enhanced drilling fluids: pioneering approach to overcome uncompromising drilling problems. Journal of Energy Resources Technology, 134(1), 014501.
[2] Sehly, K., Chiew, H. L., Li, H., Song, A., Leong, Y. K., & Huang, W. (2015). Stability and ageing behaviour and the formulation of potassium-based drilling muds. Applied Clay Science, 104, 309-317. [3] Mahmoud, O., Nasr-El-Din, H. A., Vryzas, Z., & Kelessidis, V. C. (2016, February). Nanoparticle-based drilling fluids for minimizing formation damage in HP/HT applications. In SPE International Conference and Exhibition on Formation Damage Control.
Society of Petroleum Engineers. [4] Afolabi, R. O., Orodu, O. D., Efeovbokhan, V. E., & Rotimi, O. J. (2017). Optimizing the rheological properties of silica nano-modified bentonite mud using overlaid contour plot and estimation of maximum or upper shear stress limit. Cogent Engineering, 4(1), 1287248.
[5] Vryzas, Z., & Kelessidis, V. C. (2017). Nano-based drilling fluids: A review. Energies, 10(4), 540.
UEMK 2019 Proceedings Book
24/25 October 2019 Gaziantep University, TURKEY 743
[6] Singh, S. K., Ahmed, R. M., & Growcock, F. (2010, January). Vital role of nanopolymers in drilling and stimulations fluid applications. In SPE Annual Technical
Conference and Exhibition. Society of Petroleum Engineers.
[7] Afolabi, R. O. (2018). A new model for predicting fluid loss in nanoparticle modified drilling mud. Journal of Petroleum Science and Engineering, 171, 1294-1301. [8] Afolabi, R. O., Orodu, O. D., & Seteyeobot, I. (2018). Predictive modelling of the impact of silica nanoparticles on fluid loss of water based drilling mud. Applied Clay
Science, 151, 37-45. [9] Farooq, A., Al-Jowder, R., Narayanaswamy, R., Azzawi, M., Roche, P. J., & Whitehead, D. E. (2013). Gas detection using quenching fluorescence of dye-immobilised silica nanoparticles. Sensors and Actuators B: Chemical, 183, 230-238. [10] Arce, V. B., Gargarello, R. M., Ortega, F., Romañano, V., Mizrahi, M., Ramallo-López, J. M., ... & Mártire, D. O. (2015). EXAFS and DFT study of the cadmium and lead adsorption on modified silica nanoparticles. Spectrochimica Acta Part A: Molecular and Biomolecular Spectroscopy, 151, 156-163.
[11] Gao, X., Yu, Q. L., & Brouwers, H. J. H. (2015). Characterization of alkali activated slag–fly ash blends containing nano-silica. Construction and Building Materials, 98, 397-406. [12] Fan, W., & Gao, L. (2006). Synthesis of silica hollow spheres assisted by ultrasound. Journal of colloid and interface science, 297(1), 157-160.. [13] Monshizadeh, M., Rajabi, M., Ahmadi, M. H., & Mohammadi, V. (2015). Synthesis and characterization of nano SiO2 from rice husk ash by Precipitation method. In 3rd
National Conference on Modern Researches in Chemistry and Chemical Engineering (pp. 1-
4). [14] Mourhly, A., Khachani, M., Hamidi, A. E., Kacimi, M., Halim, M., & Arsalane, S. (2015). The synthesis and characterization of low-cost mesoporous silica SiO2 from local pumice rock. Nanomaterials and Nanotechnology, 5, 35. [15] Sarikaya, M., Depci, T., Aydogmus, R., Yucel, A., & Kizilkaya, N. (2016, October). Production of Nano Amorphous SiO2 from Malatya Pyrophyllite. In IOP Conference Series: Earth and Environmental Science (Vol. 44, No. 5, p. 052004). IOP Publishing.
[16] Bahceci, E., Aylikci, V., Gonullu, M. P., Ates, H., Celik, A. G., Depci, T. (2018, May). Adsorption of methylene blue on mesoporous nano silica obtained from quartzite. , IV Internatıonal Conference on Engineering and Natural Sciences (ICENS) (Page 55 – 61) [17] Sarikaya, M., Deniz Turan, M., Aydogmus, R., Yucel, A., Kizilkaya, N., & Depci, T. (2017). Extraction of meso-pores amorphous SiO2 from van pumice. Current Physical Chemistry, 7(4), 301-304. [18] Yang, J., & Wang, E. G. (2006). Reaction of water on silica surfaces. Current Opinion
in Solid State and Materials Science, 10(1), 33-39.

UEMK 2019 Proceedings Book
24/25 October 2019 Gaziantep University, TURKEY 744
USABILITY OF DIATOMITE AS ADDITIVE MATERIAL IN WATER-BASED DRILLING MUDS
Mustafa Göktan AYDIN Department of Petroleum and Natural Gas Engineering, İskenderun Technical University, Hatay, TURKEY [email protected] Tolga DEPCİ Department of Engineering Science, Iskenderun Technical University, Hatay, TURKEY [email protected] Volkan AYLIKCI Iskenderun Technical University, Department of Metallurgical and Material Engineering, Hatay, Turkey [email protected] ABSTRACT: One of the most important components in drilling operations is drilling mud. It is known that water based drilling mud is the most important control parameter in the progress of drilling operations. Various chemicals, different additives and polymers are mixed into the drilling mud to maintain flow characteristics (gel strength and filtration) parameters for the drilling mud at the desired levels. These substances are obtained by chemical processes, procurement, etc. and these causes increase the cost of drilling. In recent years, many studies have been carried out to reduce these costs and natural materials (sepiolite, diatomite) are prefered as additives. In this study, diatomite is used as water based drilling mud additive material. Diatomite reserves are abundant in our country and are relatively cheaper than other chemical additives. The diatomite sample was obtained from Kahramankazan district of Ankara province (40 ° 13′54 ″ N 32 ° 41′2 ″ D). Within the scope of the study, the Spud type drilling muds were prepared according to API 13-A standard and Bentonite and Diatomite were added to drilling mud. Sludge samples in different proportions (3-10%) were prepared. The rheological and filtration properties of the prepared samples were made according to API 13B-1 standard. According to the analysis results, only diatomite added sludge samples did not meet the values specified in the standards. The samples prepared with bentonite were found to
provide most of the values specified in the standard as long as 6% and more were added. When diatomite and bentonite were used together, it was determined that 9% and more by weight met the relevant standard. As a result of the study, it was determined that only diatomite cannot be used as an additive in drilling mud. When used with bentonite, it has been found to have a positive effect. Key words: Diatomite, Drilling Mud, Gel Strength, Bentonite, Drilling DİATOMİTİN SU BAZLI SONDAJ ÇAMURLARINDA KATKI MALZEMESİ OLARAK KULLANILABİLİRLİĞİ

UEMK 2019 Proceedings Book
24/25 October 2019 Gaziantep University, TURKEY 745
ÖZET: Sondaj operasyonlarında en önemli bileşenlerin başında sondaj çamuru gelmektedir. Su bazlı sondaj çamurunun sondaj operasyonlarının ilerlemesinde en önemli kontrol parametresi olduğu bilinmektedir. Sondaj çamuru için akış özelliklerinin (jel mukavemeti ve filtrasyon) istenilen seviyelerde tutulması için sondaj çamuruna çeşitli kimyasallar, farklı katkı maddeleri ve polimerler karıştırılmaktadır. Bu maddelerin kimyasal işlemler ile elde edilmesi, temin edilmesi vs. gibi sebepler sondaj maliyetini arttırmaktadır. Son yıllarda bu maliyetlerin azaltılması için birçok
çalışma yapılmakta olup, doğal malzemeler (sepiyolit, diatomit) katkı malzemesi olarak değerlendirilmektedir. Bu çalışmada, su bazlı sondaj çamuru katkı malzemesi olarak doğal bir kayaç olan diatomit kullanılmıştır. Ülkemizde diatomit rezervleri bol miktarda bulunmakta olup diğer kimyasal katkı maddelerine göre göreceli olarak daha ucuzdur. Diatomit örneği Ankara iline bağlı Kahramankazan ilçesinden (40 ° 13′54 ″ N 32 ° 41′2 ″ D) temin edilmiştir. Çalışma kapsamında Spud tipi sondaj çamurları API 13-A standardına göre hazırlanmış ve sondaj çamuruna Bentonite ve Diatomite eklenmiştir.. Ağırlıkça farklı oranlarda (%3-10) çamur numuneleri hazırlanmıştır. Hazırlanan numunelerin reolojik ve filtrasyon özellikleri API 13B-1 standardına göre yapılmıştır. Analiz sonuçlarına göre sadece diatomit katkılı çamur numunelerinin standartlarda belirtilen değerleri karşılamadığı saptanmıştır. Bentonit ile hazırlanan numunelerin ise ağırlıkça %6 ve daha fazla katkılandığı sürece standartta belirtilen değerlerin çoğunu sağladığı görülmüştür. Diatomit ve bentonitin birlikte kullanıldığı numuneler incelendiğinde ağırlıkça %9 ve fazlasının ilgili standardı sağladığı belirlenmiştir. Çalışma neticesinde sadece diatomitin sondaj çamurlarında katkı malzemesi olarak kullanılamayacağı belirlenmiştir. Bentonit ile birlikte kullanıldığı zaman ise olumlu yönde etki gösterdiği belirlenmiştir.
Anahtar sözcükler: Diatomit, Sondaj Çamuru, Jel Mukavemeti, Bentonit, Sondaj GİRİŞ
Sondaj çamurları inhibitiv ve inhibitiv olmayan iki ana başlık altında toplanmaktadır. Dünyada ve ülkemizdeki sondaj faaliyetleri incelendiğinde en çok kullanılan sondaj çamur türlerinin Spud, Lignosülfonat ve Polimer tip çamur oldukları görülmektedir. Bu sondaj çamurlarının sondaj operasyonlarının ilerlemesinde başlıca kontrol parametrelerinden birisi olduğu bilinmektedir. Dolayısı ile sondaj çamurunun önemi de giderek artmaktadır.[1] Sondaj operasyonları için sondaj çamurunun; Filtrasyon, pH, Viskozite(Görünür, Plastik), Jel Kuvveti, Kopma noktası (Yield Point) ve Çamur yoğunluğu gibi özelliklerinin sondaj operasyonunun optimum şartlarda ilerlemesi için belirlenen değerlerde olması gerekmektedir. Sondaj çamurunun kuyu içerisinde dolaşımı
sırasında bu özelliklerinin değerlerinin değiştiği bilinmektedir. Değişen değerleri istenilen seviyelere çekmek için sondaj çamuru içerisine çeşitli kimyasal katkı maddeleri katılmaktadır. Bu katkı malzemeleri sondaj maliyetini arttırdığı için günümüzde sondaj maliyetini düşürmek adına rezervi daha bol olan, ekonomik

UEMK 2019 Proceedings Book
24/25 October 2019 Gaziantep University, TURKEY 746
açıdan daha ucuz endüstriyel ham maddeler veya çeşitli zararsız atıklar araştırmacılar için daha değerli hale gelmiştir.[2] Çalışma kapsamında, diatomitlerin sondaj çamuru içerisinde katkı malzemesi olarak kullanılması araştırılmıştır. Diatomit, ülkemizde bol miktarda rezervi bulunan bir kayaçtır. Ekonomik olarak ucuz olması nedeniyle sondaj çamuru katkı malzemesi olarak kullanılmasının sondaj maliyetini düşüreceği düşünülmektedir. Kullanılan diatomitlerin boyutu 80 µm altındadır.
Diatomitin, volkanik aktivitelerin fazla olduğu bölgelerde bulunan tatlı ve tuzlu su haznelerinde fotosentez olayının yoğun olarak gerçekleştiği derinliklerde yaşayan tek hücreli alg türü olan diatome iskeletlerinin yanısıra kil, kum, volkanik kül ve diğer organik kalıntılardan oluşan bir kayaçtır. Diatomitin ana yapısını SiO2.nH2O oluşturmaktadır. Diatomitlerin kimyasal bileşimleri ortam şartlarına göre değişmektedir. Sertliği içeriğine uygun olarak 4,5-6 arasında değişmekte olup kırılgan yapısı ve tanelenebilmesi nedeniyle sertlik 1,5’ e kadar düşmektedir. Diatomiti oluşturan diatome iskelet kalıntıları 5-1000 µm boyutları arasında değişim gösterirken ağırlıklı olarak ortalama boyutları 50-100 µm arasında olmaktadır. Diatomitte boşluklu iskeletlere sahip diatomeler ve diatome taneleri arasında kalan boşluklar toplam poroziteyi oluşturmaktadırlar. Diatomitin boşluk değeri %95’e kadar çıkabilmektedir. Sahip oldukları poroz yapısının fazla miktarda olması nedeniyle ağırlıklarının neredeyse 3 katına kadar su emebildikleri bilinmektedir. Diatomitler birçok kimyasallara dayanıklıdır. Fakat yüksek sıcaklıklarda kuvvetli bazlardan etkilenir.[3-5] YÖNTEM
Kimyasal yapısı SiO2 (%72), Al2O3 (%12) ve Fe2O3 (%3) ‘den oluşmakta olan diatomitin yüzey alanı 63 m2/g’dır. Deneyler için kullanılan diatomit örneği Kahramankazan, Ankara’dan temin edilmiştir (Şekil 1).
Şekil 1. Deneylerde Kullanılan Diatomit Örneği
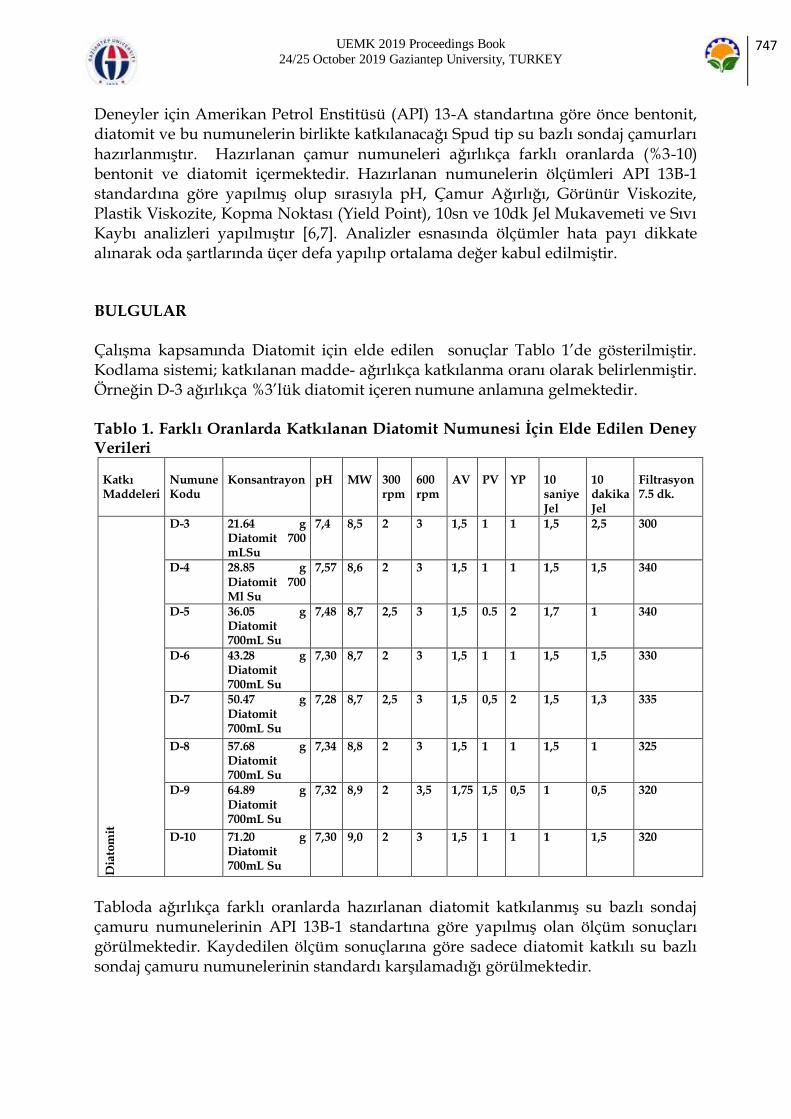
UEMK 2019 Proceedings Book
24/25 October 2019 Gaziantep University, TURKEY 747
Deneyler için Amerikan Petrol Enstitüsü (API) 13-A standartına göre önce bentonit, diatomit ve bu numunelerin birlikte katkılanacağı Spud tip su bazlı sondaj çamurları hazırlanmıştır. Hazırlanan çamur numuneleri ağırlıkça farklı oranlarda (%3-10) bentonit ve diatomit içermektedir. Hazırlanan numunelerin ölçümleri API 13B-1 standardına göre yapılmış olup sırasıyla pH, Çamur Ağırlığı, Görünür Viskozite, Plastik Viskozite, Kopma Noktası (Yield Point), 10sn ve 10dk Jel Mukavemeti ve Sıvı Kaybı analizleri yapılmıştır [6,7]. Analizler esnasında ölçümler hata payı dikkate alınarak oda şartlarında üçer defa yapılıp ortalama değer kabul edilmiştir. BULGULAR
Çalışma kapsamında Diatomit için elde edilen sonuçlar Tablo 1’de gösterilmiştir. Kodlama sistemi; katkılanan madde- ağırlıkça katkılanma oranı olarak belirlenmiştir. Örneğin D-3 ağırlıkça %3’lük diatomit içeren numune anlamına gelmektedir. Tablo 1. Farklı Oranlarda Katkılanan Diatomit Numunesi İçin Elde Edilen Deney Verileri
Katkı Maddeleri
Numune Kodu
Konsantrayon
pH
MW
300 rpm
600 rpm
AV
PV
YP
10 saniye Jel
10 dakika Jel
Filtrasyon 7.5 dk.
Dia
tom
it
D-3 21.64 g Diatomit 700 mLSu
7,4 8,5 2 3 1,5 1 1 1,5 2,5 300
D-4 28.85 g Diatomit 700 Ml Su
7,57 8,6 2 3 1,5 1 1 1,5 1,5 340
D-5 36.05 g Diatomit 700mL Su
7,48 8,7 2,5 3 1,5 0.5 2 1,7 1 340
D-6 43.28 g Diatomit 700mL Su
7,30 8,7 2 3 1,5 1 1 1,5 1,5 330
D-7 50.47 g Diatomit 700mL Su
7,28 8,7 2,5 3 1,5 0,5 2 1,5 1,3 335
D-8 57.68 g Diatomit 700mL Su
7,34 8,8 2 3 1,5 1 1 1,5 1 325
D-9 64.89 g Diatomit 700mL Su
7,32 8,9 2 3,5 1,75 1,5 0,5 1 0,5 320
D-10 71.20 g Diatomit 700mL Su
7,30 9,0 2 3 1,5 1 1 1 1,5 320
Tabloda ağırlıkça farklı oranlarda hazırlanan diatomit katkılanmış su bazlı sondaj çamuru numunelerinin API 13B-1 standartına göre yapılmış olan ölçüm sonuçları görülmektedir. Kaydedilen ölçüm sonuçlarına göre sadece diatomit katkılı su bazlı sondaj çamuru numunelerinin standardı karşılamadığı görülmektedir.
UEMK 2019 Proceedings Book
24/25 October 2019 Gaziantep University, TURKEY 748
Ölçülen filtrasyon değerlerinin tüm katkı değerleri için çok yüksek miktarda olduğu görülmektedir. Sondaj operasyonlarında sondaj çamurunun filtrasyon (sıvı kaybı) oldukça önemli bir parametredir. Sondaj çamurunda ki sıvı kaybının fazla olması çamur sirkülasyonunu olumsuz etkilemektedir. Poroz yapısının %95 oranlarında olmasından dolayı ağırlığının yaklaşık 3 katı kadar su emebilen diatomitin bünyesine aldığı suyu yeterince muhafaza edemediği görülmüş ve sondaj çamuru için tek başına kullanılmasının mümkün olmadığı saptanmıştır. Sondaj operasyonu için en önemli parametrelerden biri olan jel mukavemeti değerlerine bakıldığında 10 saniye ve 10 dakika olmak üzere iki tip jel mukavemetinin ölçüldüğü görülmektedir. Kuyu içerisinde ki sondaj çamurunun sirkülasyonunun durduğu sırada çamurun yüzeye taşıdığı kırıntıları bünyesinde tutması jel mukavemetiyle doğrudan ilişkilidir. Sirkülasyonu durdurulan sondaj çamurunun jel kuvveti istenilen seviyeden düşük ise yüzeye taşıdığı kırıntılar kuyu tabanına iner ve sondaj operasyonu bu durumdan olumsuz etkilenir. Sadece diatomit katkılanarak hazırlanan su bazlı sondaj çamuru numunelerinin her birinde jel mukavemetinin 10 saniyelik ve 10 dakikalık değerleri incelendiğinde jel mukavemeti değerlerinin standardı karşılamadığı görülmüştür. Sondaj operasyonları için önemli bir diğer parametre olan viskozite, sıvının akmaya karşı gösterdiği direnç olarak bilinmektedir. Viskozitesi yüksek sondaj sıvıları daha çok katı madde taşımaktadır. Ancak viskozitesi yüksek akışkanlar yüksek sürtünme kuvvetlerinden dolayı pompalanması için daha fazla motor gücü gerekmektedir. Viskozite değeri ile 3 değer hesaplanması mümkündür. Bu değerler; Plastik Viskozite, Görünür Viskozite ve Akma Noktası (Yield Point). Plastik Viskozite (PV) sondaj çamuruna katkılanan katı madde içeriği arttıkça artmaktadır. Bu tip durumlarda sondaj çamurunun seyreltilmesi gerektiği bilinmektedir [8]. Diatomit katkısı ile hazırlanan numuneler için bu değerler standartın çok altında olduğundan seyreltme işlemi yapılmasına gerek olmadığı görülmektedir. Sonuçlar bu tip çamurun operasyonu olumsuz etkileyeceğini göstermiştir. Söz konusu numuneler Görünür Viskozite (AV) için incelendiğinde standart değerlerin karşılanmadığı görülmektedir. Viskozite değeri ile hesaplanan değerlerin sonuncusu Akma Noktasıdır (YP). Akma noktası sondaj çamurunun kesintileri yüzeye taşıyabilme kabiliyetini göstermektedir. Akma noktasının yüksek değerlerde olması yüksek basınç kaybına yol açtığından sondaj operasyonları için bu değerin kuyu durumuna ve şartlarına gore iyi hesaplanması gerekmektedir. Sondaj operasyonunun verimi ve ekonomik olarak uygunluğu için viskozite değerinin dikkatli bir şekilde hesaplanması gerekmektedir. Diatomit katkılanarak hazırlanan su bazlı sondaj çamuru numunelerinin her birinde (%3-10 katkılı numunelerin tümü) viskozitenin standartın çok altında olduğu görülmüştür. Bu durum sadece diatomit katkısı ile yapılacak çamurun kuyu içerisinde yeterli katı miktarını taşıyamayacağını göstermiştir. Sadece diatomit katkılanarak hazırlanan su bazlı sondaj çamurunun ölçüm değerleri incelendiğinde tek başına bir katkı maddesi olarak kullanılamayacağı saptanmıştır. Bu sebeple önce aynı ağırlık oranlarında bentonit katkılanmış sondaj çamuru numuneleri

UEMK 2019 Proceedings Book
24/25 October 2019 Gaziantep University, TURKEY 749
ile diatomitin bentonit ile birlikte ağırlıkça %3-10 değerlerinde katkılandığı su bazlı sondaj çamuru numuneleri hazırlanmıştır. Bu numunelerin ölçüm sonuçları ile diatomitin bentonit ile kullanıldığında söz konusu parametreler üzerinde oluşturduğu etkiler incelenmiştir. Yapılan ölçümlerin sonuçları aynı parametreler için incelendiğinde Bentonit katkılanarak hazırlanan suz bazlı sondaj çamuru numunelerinden ağırlıkça %6-10 arasındaki numunelerin sondaj çamuru için standartların çoğunu sağladığı görülmekte olup bahsedilen numunelerden elde edilen deney verileri Tablo 2’de gösterilmiştir. Tablo 2. Farklı Oranlarda Katkılanan Bentonit Numunesi İçin Elde Edilen Deney Verileri
Katkı Maddeleri
Numune Kodu
Konsantrasyon
pH
MW
300 rpm
600 rpm
AV
PV
YP
10 saniye Jel
10 dakika Jel
Filtraayon 7.5 dk.
Ben
ton
it
B-6 43.28 g Bentonit 700mL Su
8,65 8,70 35 51 25,5 16 19 7 9 9
B-7 50.47 g Bentonit 700mL Su
9,00 8,80 49 77 38,5 28 21 10 13 7
B-8 57.68 g Bentonit 700mL Su
9,00 9,10 42 67 33,5 25 17 8 10 9
B-9 64.89 g Bentonit 700mL Su
9,21 9,10 33 53 26,5 20 13 7 8,5 6
B-10 71.20 g Bentonit 700mL Su
9,25 9,20 92 138 69 46 46 22 27 6
Sondaj operasyonlarında sondaj çamuru kuyu içerisinde sürekli sirkülasyon halindedir. Çamur, kuyu içerisinde dolaşırken birçok farklı katı madde içeriğine sahip formasyon ile temas ettiği için bünyesine karışan maddelerin özelliklerinden etkilenir. Bu durum yüzeyde hazırlanan sondaj çamurunun kontrol parametrelerinin sürekli değişmesine sebep olur. Operasyonların verimli bir şekilde devam edebilmesi için parametrelerinde değişiklik gösteren sondaj çamuruna birçok kimyasal katkı maddesi katıldığı bilinmektedir. Farklı katkı maddelerinin çamura katılması sondaj maliyetini arttırmaktadır. Bu sebeple sondaj operasyonlarının maliyeti düşürmek için ucuz yeni katkı maddeleri arayışı bulunmaktadır. Çalışma kapsamında ülkemizde rezervi bok miktarda bulunan ve ucuz bir kayaç olan diatomitin su bazlı sondaj çamuruna bentonit ile beraber katkılanarak kullanılabilirliği ölçülmüştür. Elde edilen ölçüm sonuçlarına göre ağırlıkça eşit olmak üzere hazırlanan %3-10 katkı maddesi içerikli Bentonit-Diatomit numunelerinden ağırlıkça %9 ve %10 katkı oranlarında ki
numunelerin ilgili standartları sağladığı görülmüştür. Elde edilen veri sonuçları Tablo 3’de gösterilmektedir.

UEMK 2019 Proceedings Book
24/25 October 2019 Gaziantep University, TURKEY 750
Tablo 3. Eşit Oranlarda Katkılanan Diatomit-Bentonit Numuneleri İçin Elde Edilen Deney Verileri
Katkı Maddeleri
Numune Kodu
Konsantrasyon
pH
MW
300 rpm
600 rpm
AV
PV
YP
10 saniye Jel
10 dakika Jel
Filtrasyon 7.5 dk.
Ben
ton
it +
Dia
tom
it
DB-9
32,44 g Bentonit 32,44 g Diatomit 700 mLSu
8,05
8,90
18,50
31
15,5
12,50
6
4
2,5
11
DB-10
35,60 g Bentonit 35,60 g Diatomit 700 mLSu
8,15
8,95
32
54
27
22
10
6
6,5
8
Ağırlıkça eşit miktarlarda diatomit ve bentonit katkılanarak hazırlanan %3-10 oranlarında ki su bazlı sondaj çamurlarının deney verileri incelendiğinde bentonit için belirlenen API standartlarını %9 ve %10 oranlarında katkı maddesi içeren numunelerin sağladığı görülmüştür. İlgili karşılaştırmaların yapıldığı bentonit standartları Tablo 4’de verilmektedir. Tablo 4. API Standartlarına Göre Bentonitin Fiziksel Özellikleri
SONUÇ VE ÖNERİLER
Çalışma kapsamında sondaj operasyonları için hayati önem taşıyan sondaj çamurunun maliyetini düşürmek için ülkemizde rezervi bol bulunan ve ekonomik açıdan göreceli olarak düşük maliyetli olan diatomit, önce tek başına ardından bentonit ile beraber su bazlı sondaj çamuru içerisine katkılanmıştır. Hazırlanan numunelerin analizleri esnasında ölçümlerin hata payı dikkate alınarak oda şartlarında üçer defa yapılıp ortalama değer kabul edilmiştir. Deneysel veriler ışığında Diatomitin tek başına sondaj çamuruna katkı malzemesi olarak kullanılamayacağı belirlenmiştir. Diatomitin, bentonit ile beraber sondaj çamuruna katkılandığı durumlarda belirli ağırlık oranlarında olumlu etkilerinin olduğu gözlenmiştir. Günümüzde sondaj maliyetlerinin artmasının büyük bir kısmının sondaj çamuruna katılan kimyasal katkı maddelerinden kaynaklandığı düşünüldüğünde tek başına olmasa da diatomitin bentonit ile %9-10 ağırlık oranlarında kullanılmasının uygun olabileceği önerilmektedir. Bu ağırlık oranlarında

UEMK 2019 Proceedings Book
24/25 October 2019 Gaziantep University, TURKEY 751
hazırlanan diatomit ve bentonit katkılı numunelerin standartların başta filtrasyon olmak üzere birçoğunu karşıladığı görülmüştür. KAYNAKLAR
[1] Kök, O. E., Tanrıverdi, İ., & Erdoğan, Y. (2018). Usage of Vermiculite as Additive Material in Water-Based Drilling Muds. Natural and Engineering Sciences, 3(2), 179-186.
[2] ALTUN, G., OSGOUEI, A. E., & SERPEN, U. SU BAZLI SEPİOLİT ÇAMUR ÖZELLİKLERİNİN ZORLU SONDAJ KOŞULLARINDA DENEYSEL OLARAK İNCELENMESİ. [3] UYGUN, A. (1976). DİATOMİT Jeolojisi, ve yararlanma olanakları. Bilimsel Madencilik Dergisi, 15(5), 31-38.
[4] Al-Sabagh, A. M., El-Awamri, A. A., Abdou, M. I., Hussien, H. A., El Fatah, H. A., & Rasmy, W. E. (2016). Egyptian diatomite as high fluid loss squeeze slurry in sealing fractures and high permeable formation. Egyptian Journal of Petroleum, 25(3), 409-421. [5] Mohamedbakr, H., & Burkitbaev, M. (2009). Elaboration and characterization of natural diatomite in Aktyubinsk/Kazakhstan. The Open Mineralogy Journal, 3, 12-16.
[6] American Petroleum Intitute (1990) 13A. Specification for drilling fluid materials. USA. [7] Caenn, R., & Chillingar, G. V. (1996). Drilling fluids: State of the art. Journal of Petroleum Science and Engineering, 14(3-4), 221-230. [8] ASME Shale Shaker Committee. (2011). Drilling fluids processing handbook. Elsevier.
UEMK 2019 Proceedings Book
24/25 October 2019 Gaziantep University, TURKEY 752
AN ANALYSIS FOR THE PERFORMANCE OF A MULTICORE CPU FOR NUMERICAL SIMULATIONS WITH SEVEN POINT STENCIL CONFIGURATION
Recep BAKAR Material Science and Engineering Department Koc University [email protected] Najeeb AHMAD Computer Engineering Department Koc University [email protected]
ABSTRACT: Simulations with seven-point simulations have been commonly used in engineering applications in many industries. Computational performance of simulations is very significant. The faster the results are found, the better it is in terms of time and cost. The objective of this study is to evaluate the performance of a reservoir simulation based on seven-point stencil configuration on Intel KNL, a multicore CPU, using different data formats, problem sizes, and vectorization modes. Four fundamental cases in terms of problem sizes were used on KNL with changing data formats namely CSR and SELL and with four different vectorization modes such as AVX, AVX2, AVX512, and no vectorization mode. In the simulated cases, the best performance was obtained with the number of processes equal to the number of KNL cores for all configurations. Also, SELL with AVX-512 vectorization mode resulted in the best performance for problem sizes occupying less than 50% of High Bandwidth Memory, followed by AVX2 and AVX. The performance of both SELL and CSR decreased with the problem size approaching to the memory of HBM. On the other hand, CSR AVX-512 was the best among CSR with all vectorization modes and marginally better than SELL AVX. With further usage of HBM, the best performance was obtained using CSR with AVX vectorization mode. However, generally, the performance of both CSR and SELL with any vectorization mode went down as problem size increased, but the rate of decline in performance was more for SELL than CSR. Among CSR with different vectorization modes, the performance of CSR-AVX degraded the least with increasing problem sizes. Finally, this study investigates, to the best of our knowledge, for the first time, the performance of SELL and CSR with different vectorization modes for numerical simulations with big problem sizes approaching and exceeding the size of the HBM. Key words: Seven-point stencil simulations, Matrix-vector multiplication, PETSc, vectorization modes, simulation on multicore CPU INTRODUCTION
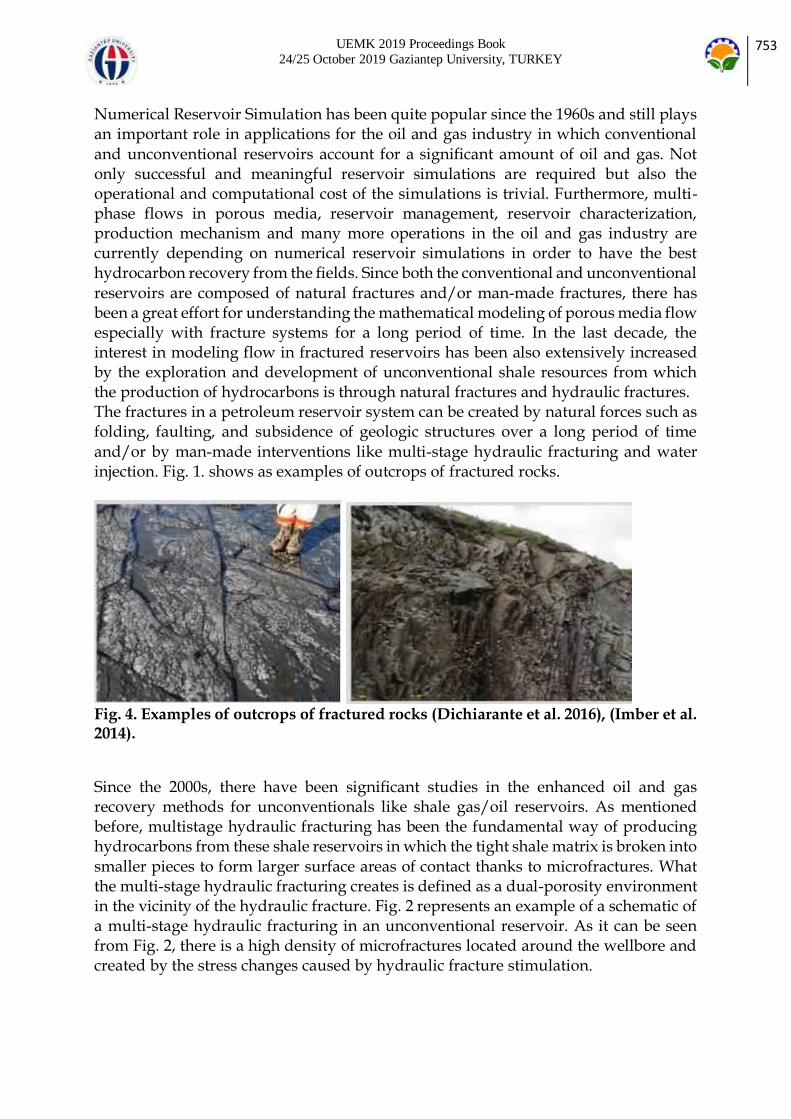
UEMK 2019 Proceedings Book
24/25 October 2019 Gaziantep University, TURKEY 753
Numerical Reservoir Simulation has been quite popular since the 1960s and still plays an important role in applications for the oil and gas industry in which conventional and unconventional reservoirs account for a significant amount of oil and gas. Not only successful and meaningful reservoir simulations are required but also the operational and computational cost of the simulations is trivial. Furthermore, multi-phase flows in porous media, reservoir management, reservoir characterization, production mechanism and many more operations in the oil and gas industry are currently depending on numerical reservoir simulations in order to have the best hydrocarbon recovery from the fields. Since both the conventional and unconventional reservoirs are composed of natural fractures and/or man-made fractures, there has been a great effort for understanding the mathematical modeling of porous media flow especially with fracture systems for a long period of time. In the last decade, the interest in modeling flow in fractured reservoirs has been also extensively increased by the exploration and development of unconventional shale resources from which the production of hydrocarbons is through natural fractures and hydraulic fractures. The fractures in a petroleum reservoir system can be created by natural forces such as folding, faulting, and subsidence of geologic structures over a long period of time and/or by man-made interventions like multi-stage hydraulic fracturing and water injection. Fig. 1. shows as examples of outcrops of fractured rocks.
Fig. 4. Examples of outcrops of fractured rocks (Dichiarante et al. 2016), (Imber et al. 2014).
Since the 2000s, there have been significant studies in the enhanced oil and gas recovery methods for unconventionals like shale gas/oil reservoirs. As mentioned before, multistage hydraulic fracturing has been the fundamental way of producing hydrocarbons from these shale reservoirs in which the tight shale matrix is broken into smaller pieces to form larger surface areas of contact thanks to microfractures. What the multi-stage hydraulic fracturing creates is defined as a dual-porosity environment in the vicinity of the hydraulic fracture. Fig. 2 represents an example of a schematic of a multi-stage hydraulic fracturing in an unconventional reservoir. As it can be seen from Fig. 2, there is a high density of microfractures located around the wellbore and created by the stress changes caused by hydraulic fracture stimulation.
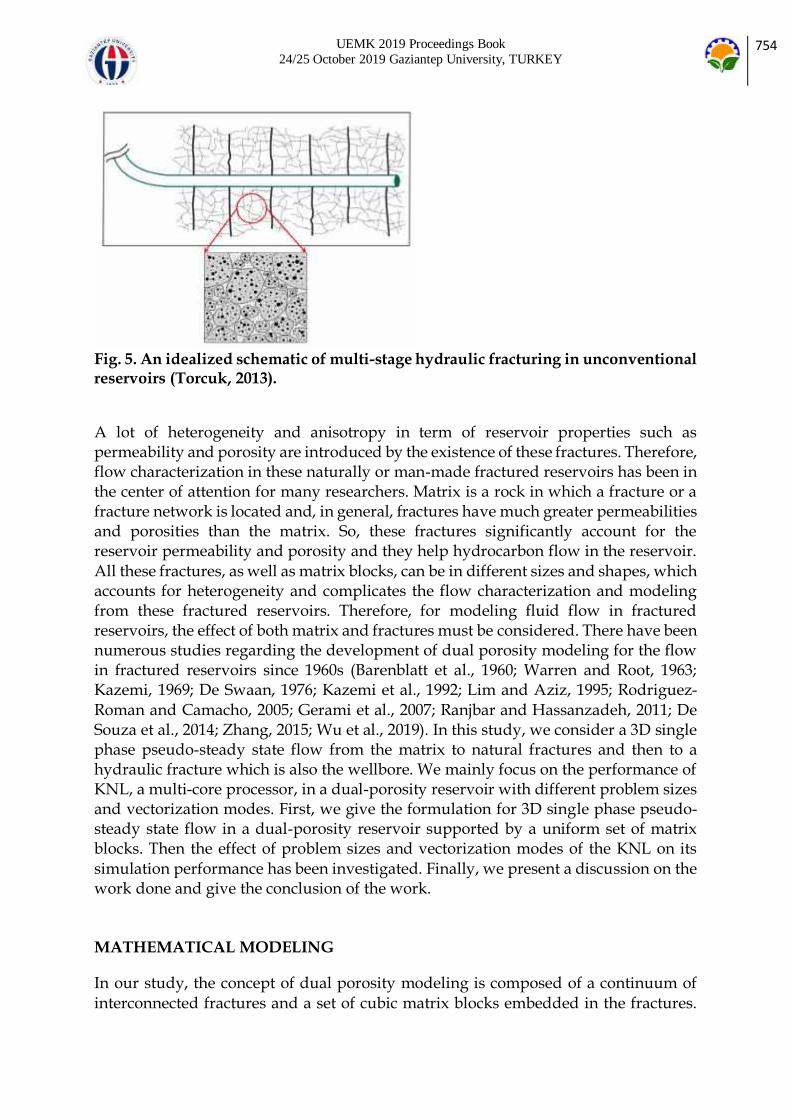
UEMK 2019 Proceedings Book
24/25 October 2019 Gaziantep University, TURKEY 754
Fig. 5. An idealized schematic of multi-stage hydraulic fracturing in unconventional reservoirs (Torcuk, 2013).
A lot of heterogeneity and anisotropy in term of reservoir properties such as permeability and porosity are introduced by the existence of these fractures. Therefore, flow characterization in these naturally or man-made fractured reservoirs has been in the center of attention for many researchers. Matrix is a rock in which a fracture or a fracture network is located and, in general, fractures have much greater permeabilities and porosities than the matrix. So, these fractures significantly account for the reservoir permeability and porosity and they help hydrocarbon flow in the reservoir. All these fractures, as well as matrix blocks, can be in different sizes and shapes, which accounts for heterogeneity and complicates the flow characterization and modeling from these fractured reservoirs. Therefore, for modeling fluid flow in fractured reservoirs, the effect of both matrix and fractures must be considered. There have been numerous studies regarding the development of dual porosity modeling for the flow in fractured reservoirs since 1960s (Barenblatt et al., 1960; Warren and Root, 1963; Kazemi, 1969; De Swaan, 1976; Kazemi et al., 1992; Lim and Aziz, 1995; Rodriguez-Roman and Camacho, 2005; Gerami et al., 2007; Ranjbar and Hassanzadeh, 2011; De Souza et al., 2014; Zhang, 2015; Wu et al., 2019). In this study, we consider a 3D single phase pseudo-steady state flow from the matrix to natural fractures and then to a hydraulic fracture which is also the wellbore. We mainly focus on the performance of KNL, a multi-core processor, in a dual-porosity reservoir with different problem sizes and vectorization modes. First, we give the formulation for 3D single phase pseudo-steady state flow in a dual-porosity reservoir supported by a uniform set of matrix blocks. Then the effect of problem sizes and vectorization modes of the KNL on its simulation performance has been investigated. Finally, we present a discussion on the work done and give the conclusion of the work. MATHEMATICAL MODELING
In our study, the concept of dual porosity modeling is composed of a continuum of interconnected fractures and a set of cubic matrix blocks embedded in the fractures.
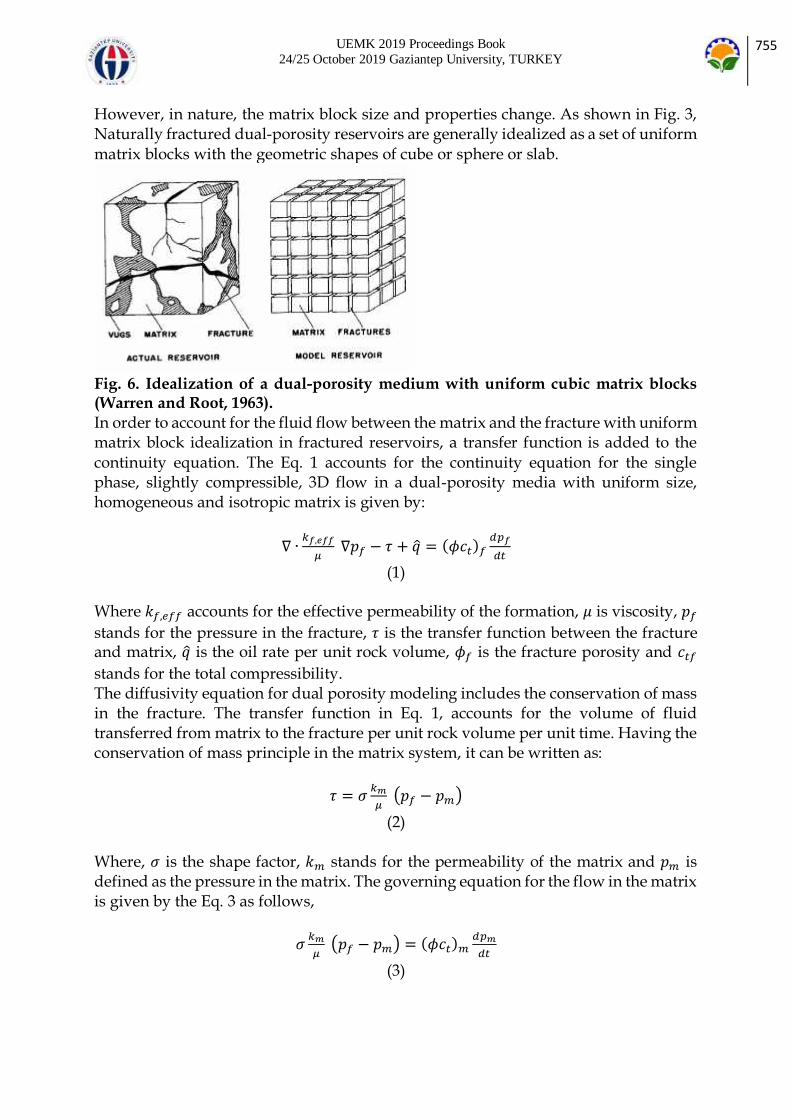
UEMK 2019 Proceedings Book
24/25 October 2019 Gaziantep University, TURKEY 755
However, in nature, the matrix block size and properties change. As shown in Fig. 3, Naturally fractured dual-porosity reservoirs are generally idealized as a set of uniform matrix blocks with the geometric shapes of cube or sphere or slab.
Fig. 6. Idealization of a dual-porosity medium with uniform cubic matrix blocks (Warren and Root, 1963).
In order to account for the fluid flow between the matrix and the fracture with uniform matrix block idealization in fractured reservoirs, a transfer function is added to the continuity equation. The Eq. 1 accounts for the continuity equation for the single phase, slightly compressible, 3D flow in a dual-porosity media with uniform size, homogeneous and isotropic matrix is given by:
∇ ∙𝑘𝑓,𝑒𝑓𝑓
𝜇 ∇𝑝𝑓 − 𝜏 + = (𝜙𝑐𝑡)𝑓
𝑑𝑝𝑓
𝑑𝑡
(1) Where 𝑘𝑓,𝑒𝑓𝑓 accounts for the effective permeability of the formation, 𝜇 is viscosity, 𝑝𝑓
stands for the pressure in the fracture, 𝜏 is the transfer function between the fracture and matrix, is the oil rate per unit rock volume, 𝜙𝑓 is the fracture porosity and 𝑐𝑡𝑓
stands for the total compressibility. The diffusivity equation for dual porosity modeling includes the conservation of mass in the fracture. The transfer function in Eq. 1, accounts for the volume of fluid transferred from matrix to the fracture per unit rock volume per unit time. Having the conservation of mass principle in the matrix system, it can be written as:
𝜏 = 𝜎𝑘𝑚
𝜇 (𝑝𝑓 − 𝑝𝑚)
(2) Where, 𝜎 is the shape factor, 𝑘𝑚 stands for the permeability of the matrix and 𝑝𝑚 is defined as the pressure in the matrix. The governing equation for the flow in the matrix is given by the Eq. 3 as follows,
𝜎𝑘𝑚
𝜇 (𝑝𝑓 − 𝑝𝑚) = (𝜙𝑐𝑡)𝑚
𝑑𝑝𝑚
𝑑𝑡
(3)

UEMK 2019 Proceedings Book
24/25 October 2019 Gaziantep University, TURKEY 756
Where, 𝜙𝑚 is the porosity in the matrix and 𝑐𝑡𝑚 accounts for the compressibility in the matrix. Also, the shape factor, 𝜎, for a cubic matrix block with dimensions 𝐿𝑥 , 𝐿𝑦 and
𝐿𝑧 can b calculated using the Eq. 4,
𝜎 = 4 [1
𝐿𝑥2 +
1
𝐿𝑦2 +
1
𝐿𝑧2]
(4) Eventually, the seven-point stencil configuration which was showed by the Fig. 4 was used for these flow equations to be solved. The set of linear equations then were solved for the pressure values in the fractures and this was followed by calculation of pressure values in the matrix using the following equations 5 and 6.
Fig. 4. Seven-Point Stencil Configuration
𝐻𝑖,𝑗,𝑘𝑝𝑓𝑖,𝑗,𝑘−1𝑛+1 + 𝐶𝑖,𝑗,𝑘𝑝𝑓𝑖,𝑗−1,𝑘
𝑛+1 +𝐷𝑖,𝑗,𝑘𝑝𝑓𝑖−1,𝑗,𝑘𝑛+1 + 𝐸𝑖,𝑗,𝑘𝑝𝑓𝑖,𝑗,𝑘
𝑛+1 + 𝐹𝑖,𝑗,𝑘𝑝𝑓𝑖+1,𝑗,𝑘𝑛+1 + 𝐺𝑖,𝑗,𝑘𝑝𝑓𝑖,𝑗+1,𝑘
𝑛+1 +
𝐾𝑖,𝑗,𝑘𝑝𝑓𝑖,𝑗,𝑘+1𝑛+1 = 𝑅𝑖,𝑗,𝑘
(5)
𝑃𝑚𝑖𝑛+1 =
(0.006328𝜎𝑘𝑚𝜇𝑃𝑓𝑖(𝑛+1)+
𝜙𝑚𝑐𝑡𝑚𝑃𝑚𝑖𝑛
∆𝑡)
𝜙𝑚𝑐𝑡𝑚∆𝑡
+0.006328𝜎𝑘𝑚
𝜇
(6) BACKGROUND AND MODEL IMPLEMENTATION
For this particular reservoir simulation, the partial differential equations representing the mathematical model are discretized, resulting in a large sparse linear system of the form Ax = b. This system is then solved using one of the many available solver algorithms. Preconditioned Krylov subspace method-based algorithms (Saad Y., 2003) are popular algorithms to iteratively solve such large sparse systems. In cases where parallel preconditioners like Jacobi preconditioners can be used in the iterative solver to speed up convergence, sparse matrix-vector multiplication (SpMV) generally turns out to be the most time-consuming operation. Thus, the overall performance of the simulation depends on the optimal execution of the SpMV on given execution platform. This, in turn, depends on the input matrix representing the linear system and its storage format which directly affects SpMV performance on a given machine architecture. Unfortunately, no single matrix storage format gives the best SpMV performance on all architectures. For this reason, many matrix storage formats have

UEMK 2019 Proceedings Book
24/25 October 2019 Gaziantep University, TURKEY 757
been proposed by researchers (Dongarra J., 2000; Liu W. et al., 2015; Kourtis K. et al., 2011). In order to analyze the performance of multicore CPU for reservoir simulation, we chose a versatile scientific computing library, namely Portable Extensible Toolkit for Scientific computation (PETSc) (Balay S et al., 2019) for implementation of our mathematical model. The reason for this selection is the ease with which PETSc allows to switch between solver algorithms, preconditioners and matrix storage formats as well as the popularity of PETSc for applications based on partial differential equations. For the selection of the multicore CPU platform for this analysis, we based our decision on the observation that the operations used in sparse linear solvers generally have low arithmetic intensity. Thus, achieving higher memory bandwidth becomes the main optimization goal for achieving higher performance on such systems. The Intel Xeon Phi Knights Landing (KNL) processor is one of the first manycore processors that offer up to 72 cores, up to 16 GB of high bandwidth memory (HBM) and up to 384 GB of DDR4 memory (HCM). The higher number of cores along with higher capacity of HBM and HCM memories makes KNL a good candidate for implementation of large scientific simulations like reservoir simulation. Brief PETSc Overview
PETSc library is a hierarchical collection of objects including solvers, preconditioners and parallel data structures that can be composed together to build a custom application. The library is designed for parallel execution of applications using MPI communication library. The library has been also enhanced to use manycore architectures like GPUs (Minden V., 2013). The parallel data structures offered by PETSc include vectors (Vec) and matrices (Mat). These data structures employ MPI for parallel implementation on CPUs while utilizing GPU libraries like cuSPARSE (NVIDIA cuSPARSE library, 2019) and VienaCL (Rupp K. et al., 2016) for GPU implementation. Linear solvers provided by PETSc are based on Krylov subspace methods and encapsulated in KSP class. Examples include Generalized Minimum Residual (GMRES), Conjugate Gradient (CG), Bi-conjugate Gradient (Bi-CG) and Bi-CGStab, Minimal Residual (MINRES), to name a few. The PC class provides various preconditioners. Some examples of preconditioners are Additive Schwarz, Jacobi, Block Jacobi, LU, ILU, SOR, and AMG. In addition, PETSc also provides interfaces to external solvers and preconditioners. For a complete list of linear solvers and preconditioners including external packages supported by PETSc, refer to (ANL; 2019). PETSc also supports non-linear solvers those are built on top of linear solvers and provided as SNES class. Other classes provided by PETSc include TS, DM, IS and TAO for time stepping, data management, index sets and optimization respectively. Intel Knights Landing (KNL) processor
Architectural overview
The Intel Knights Landing manycore processor is a member of Intel Xeon Phi family supporting up to 72 cores with other variants having 64 or 68 cores. It is an improved

UEMK 2019 Proceedings Book
24/25 October 2019 Gaziantep University, TURKEY 758
standalone version of its predecessor Knights Corner (KNC) processor that could only be used as a PCIe-connected device. From an architectural point of view, KNL is designed as a matrix of tiles, each tile containing two cores sharing 1 MB L2 cache and 2 Vector Processing Units (VPUs) per core (4 VPUs per tile). Tiles are interconnected with fast 2D mesh interconnect for accessing other processor L2 caches and HBM and HCM memory and for I/O operations. Fig. 5. shows an architectural block diagram of KNL. For a 72-core machine, 36 of the available tiles are used while the rest are disabled during manufacturing. Similarly, for the 64 core and 68 cores machines, 32 and 34 tiles are used respectively. With hyperthreading enabled, each core can run up to 4 hyperthreads. The KNL processor employs two types of memories, namely a high capacity DDR4 memory (HCM) and a high bandwidth MCDRAM memory (HBM). MCDRAM is integrated on-chip and is composed of 8 devices, each with a capacity of 2 GB. MCDRAM is accessible to the cores through fast EDC interfaces (one per 2GB device) and can achieve a bandwidth of the order of 450 GB/sec. MCDRAM can be configured in one of the three memory modes, as discussed in the next sub-section. Cores can access off-chip HCM through six DDR4 channels, each channel supporting 64 GB giving a total capacity of up to 384 GB. MCDRAM Memory modes
As previously discussed, MCDRAM, at boot-time, can be configured in one of the three memory modes, namely (i) Cache mode (ii) Flat mode and (iii) Hybrid mode. In cache mode, MCDRAM acts as a cache for the DDR memory. In flat mode, MCDRAM acts as addressable memory in same address space as DDR while in the hybrid mode, part of MCDRAM acts as a cache for DDR while the rest acts as addressable memory. In hybrid mode, it is possible to configure 25% or 50% of MCDRAM to act as a cache while the rest then acts as addressable memory. KNL memory modes are depicted in Fig. 6.
Fig. 7. Intel KNL processor block diagram (Jeffers J et al., 2016)
Cluster modes
Due to the presence of multiple tiles, memory access times for different cores are different, a phenomenon known as Non-uniform Memory Access (NUMA). To
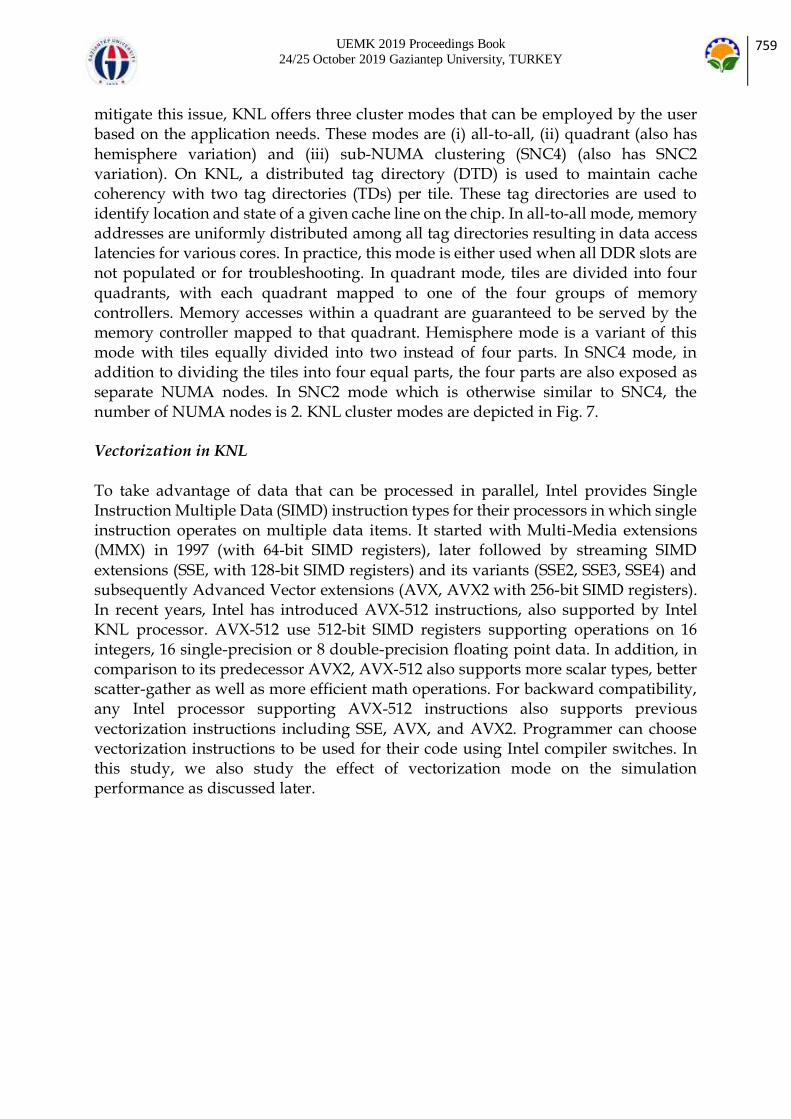
UEMK 2019 Proceedings Book
24/25 October 2019 Gaziantep University, TURKEY 759
mitigate this issue, KNL offers three cluster modes that can be employed by the user based on the application needs. These modes are (i) all-to-all, (ii) quadrant (also has hemisphere variation) and (iii) sub-NUMA clustering (SNC4) (also has SNC2 variation). On KNL, a distributed tag directory (DTD) is used to maintain cache coherency with two tag directories (TDs) per tile. These tag directories are used to identify location and state of a given cache line on the chip. In all-to-all mode, memory addresses are uniformly distributed among all tag directories resulting in data access latencies for various cores. In practice, this mode is either used when all DDR slots are not populated or for troubleshooting. In quadrant mode, tiles are divided into four quadrants, with each quadrant mapped to one of the four groups of memory controllers. Memory accesses within a quadrant are guaranteed to be served by the memory controller mapped to that quadrant. Hemisphere mode is a variant of this mode with tiles equally divided into two instead of four parts. In SNC4 mode, in addition to dividing the tiles into four equal parts, the four parts are also exposed as separate NUMA nodes. In SNC2 mode which is otherwise similar to SNC4, the number of NUMA nodes is 2. KNL cluster modes are depicted in Fig. 7. Vectorization in KNL
To take advantage of data that can be processed in parallel, Intel provides Single Instruction Multiple Data (SIMD) instruction types for their processors in which single instruction operates on multiple data items. It started with Multi-Media extensions (MMX) in 1997 (with 64-bit SIMD registers), later followed by streaming SIMD extensions (SSE, with 128-bit SIMD registers) and its variants (SSE2, SSE3, SSE4) and subsequently Advanced Vector extensions (AVX, AVX2 with 256-bit SIMD registers). In recent years, Intel has introduced AVX-512 instructions, also supported by Intel KNL processor. AVX-512 use 512-bit SIMD registers supporting operations on 16 integers, 16 single-precision or 8 double-precision floating point data. In addition, in comparison to its predecessor AVX2, AVX-512 also supports more scalar types, better scatter-gather as well as more efficient math operations. For backward compatibility, any Intel processor supporting AVX-512 instructions also supports previous
vectorization instructions including SSE, AVX, and AVX2. Programmer can choose vectorization instructions to be used for their code using Intel compiler switches. In this study, we also study the effect of vectorization mode on the simulation performance as discussed later.

UEMK 2019 Proceedings Book
24/25 October 2019 Gaziantep University, TURKEY 760
Fig. 8. KNL memory modes
Fig. 9. KNL clustering modes
CSR and SELL Sparse Matrix Storage Formats
In scientific simulations, the matrix representing the system is generally very large and its number of rows and columns can be in the order of millions. However, most of the data entries in the matrix are zero, thus constituting a sparse matrix. In order to save data storage space, zeroes are generally not stored and are implicitly represented by the data storage format that only stores non-zero entries. Compressed Sparse Row (CSR) format is one of the popular sparse matrix storage formats that uses three arrays to represent sparse matrix, a data array storing matrix non-zeroes row-wise (val), an array that stores positions of the first element of each row (ia) and an array storing column number of each non-zero (ja). Fig. 8. depicts CSR format for a sparse matrix where colored boxes show non-zero entries of the matrix and white boxes indicate zero entries. The corresponding val, ja and ia vectors are also

UEMK 2019 Proceedings Book
24/25 October 2019 Gaziantep University, TURKEY 761
depicted. CSR is one of the most common sparse matrix storage format used in practice. The sparsity pattern of the input matrix in conjunction with the matrix storage format and the machine architecture affect the performance of computational kernels like SpMV (Vuduc RW, 2003). With regard to matrix storage format, ELLPACK format has been designed to achieve better performance on vector processors like Intel KNL. The idea is to make the row length of the stored matrix uniform that equal to the maximum row length in the matrix and pad the rows with lesser row length with zeros on the right. This makes better utilization of the SIMD vectorization units in modern vector processors like Intel KNL thus improving throughput. However, if there is large variance between maximum row length and normal row lengths, the storage format can result in large storage overheads. To strike a balance between storage efficiency and vectorization performance, a variant of ELLPACK known as Sliced ELLPACK (SELL) is proposed by Monakov et al (Monakov A et al., 2010). The SELL format first slices input matrix into multiple submatrices, each containing the same number of adjacent matrix. Each of these submatrices is then represented in ELLPACK format. The result is better storage efficiency as maximum row length in each slice is different giving different row lengths for different slices.
Fig. 10. Compressed Sparse Row (CSR) sparse matrix storage format
Fig. 9. shows how SELL format stores the sparse matrix. It uses three arrays, one for storing values (val), an array to store column index of the non-zero values (colidx), an array to store the start of each slice in the matrix (sptr) and an array to store row lengths in each slice (rlen).
Fig. 11. Sliced ELLPACK sparse matrix storage format Model Implementation
For the implementation of our reservoir simulation model, we used PETSc framework. We chose Krylov sub-space method based GMRES as the linear solver for our system,

UEMK 2019 Proceedings Book
24/25 October 2019 Gaziantep University, TURKEY 762
which is a good choice for any general symmetric or non-symmetric system (Couturier R et al., 2012). For preconditioning, we used Jacobi preconditioner that has a better parallel efficiency and enabled our simulation to converge. The implementation is validated and tested by simulating a reservoir for a duration of one year (365 days). The hardware and software used for our implementation are given in Table 1 and 2 respectively. Table 1. List of software used
Operating system
Ubuntu LTS 16.04, Release 16.04.3
Compiler Intel ICC version 18.0.0
MPI library Intel MPI version 2018
PETSc library Version 3.10.4 Table 2. Specifications of hardware used
CPU Intel Xeon Phi 7250 @ 1.4 GHz
Code Name Knights Landing (KNL)
Number of cores
68 (272 hyperthreads)
DDR4 96 GB
MCDRAM 16 GB ANALYSIS METHODOLOGY, RESULTS, AND DISCUSSION
In (Zhang H et al., 2018), the authors analyze the performance of an optimized SpMV kernel based on SELL format which they implemented in PETSc library. They have a comparison their SpMV kernel performance in SELL format against widely used CSR format on Intel KNL machine under different vectorization modes. They use a reaction-diffusion chemical simulation on 2D rectangular grid (5-point stencil) for their evaluation. For their implementation, they intentionally choose a grid size (2048 x 2048 for single node) that makes all data fit into the MCDRAM memory. Their results show SpMV in SELL format achieves better performance than CSR format under all vectorization modes, with AVX512 achieving the best performance. In our analysis of SpMV performance for our 3D reservoir simulation model (7-point stencil), we chose to evaluate simulation performance (SpMV performance) as the grid size is gradually increased to give a data size from less than 50% of MCDRAM memory to more than 50% of the DDR memory and see whether SELL data format still performs the best for all data sizes and vectorization modes. For this purpose, we configured KNL memory mode as cache and cluster mode as the quadrant. Different simulation grid sizes and the corresponding size of data are listed in Table 3. For each of the CSR and SELL data
formats, we used AVX, AVX2, AVX512, and no-vectorization (novec) modes for our analysis.

UEMK 2019 Proceedings Book
24/25 October 2019 Gaziantep University, TURKEY 763
Table 3. Simulation grid and data sizes used
S.No. Grid size Data size as percentage of MCDRAM size (16 GB)
Data size as percentage of DDR size (96 GB)
1. 200 x 200 x 200 26% 4%
2. 300 x 300 x 300 88% 14.5%
3. 500 x 300 x 200 96% 16%
4. 800 x 400 x 400 390% 65%
Fig. 12. SpMV performance for grid size 200 x 200 x 200
Figures 10, 11, 12 and 13 show SpMV performance comparison in CSR and SELL formats for the four simulation configurations shown in Table 3 with varying number of MPI processes and different vectorization modes. For all simulation configurations, it is observed that for a given data format and vectorization mode, the best performance is observed when the number of MPI processes equals the number of processor cores on our KNL machine (68 cores) and the performance gradually decreases if the number of MPI processes is increased or decreased from this number. Also, it is observed that in case of no vectorization, CSR format performs better than SELL format for a given processor configuration and all simulation configurations (Table 3). Comparing the performance of SELL format under different vectorization modes for a given process configuration, we notice that AVX512 always gives best performance against AVX, AVX2 and no vectorization modes. For CSR format on the other hand, AVX512 vectorization gives the best performance only for the first simulation configuration (grid size 200 x 200 x 200) while for the rest of the configurations, AVX stands as the best performant for a given process configuration. Comparing the performance of SELL against CSR, when simulation data size is less than 50% of the MCDRAM size (last level cache size), SELL format performs better than CSR for a given processor configuration and vectorization mode. This behavior, however, changes when simulation data size increase beyond 50% of the MCDRAM size and we see CSR performing better than SELL format for given process configuration and vectorization mode. An interesting observation from these results

UEMK 2019 Proceedings Book
24/25 October 2019 Gaziantep University, TURKEY 764
is that for the simulation configurations where data size is less than the MCDRAM size, while the rest of data formats with a given vectorization and process configuration show rapid decline in performance as data size is increased, CSR with AVX and no-vectorization give almost consistent performance. Also, for data sizes exceeding 50% of the MCDRAM size and a given process configuration, CSR with AVX vectorization gives the best performance. This can be explained by the fact that as the data size approaches MCDRAM size, MCDRAM channels become saturated and efficiency of feeding the wider vectorization units, performing AVX2 and AVX512 operations drop. Apparently, the hardware can still efficiently feed vectorization units for AVX operations in CSR format even when data size approaches MCDRAM capacity.
Fig. 13. SpMV performance for grid size 300 x 300 x 300
Considering the case when data size is more than the MCDRAM size, we notice a considerable performance deterioration (compared with when data size is less than MCDRAM size) for all data formats and vectorization modes for a given process
configuration (Fig. 11). This deterioration is particularly higher for SELL format than for CSR format, with CSR along with AVX giving the best performance. From these results, we can conclude that when data size is considerably less than MCDRAM capacity (50% or less), SELL along with AVX512 vectorization gives promising results compared with CSR and other vectorization modes. However, as the problem size increases and approaches MCDRAM capacity and beyond (50% and more), CSR along with AVX vectorization becomes a better choice in terms of SpMV and consequently the simulation performance.
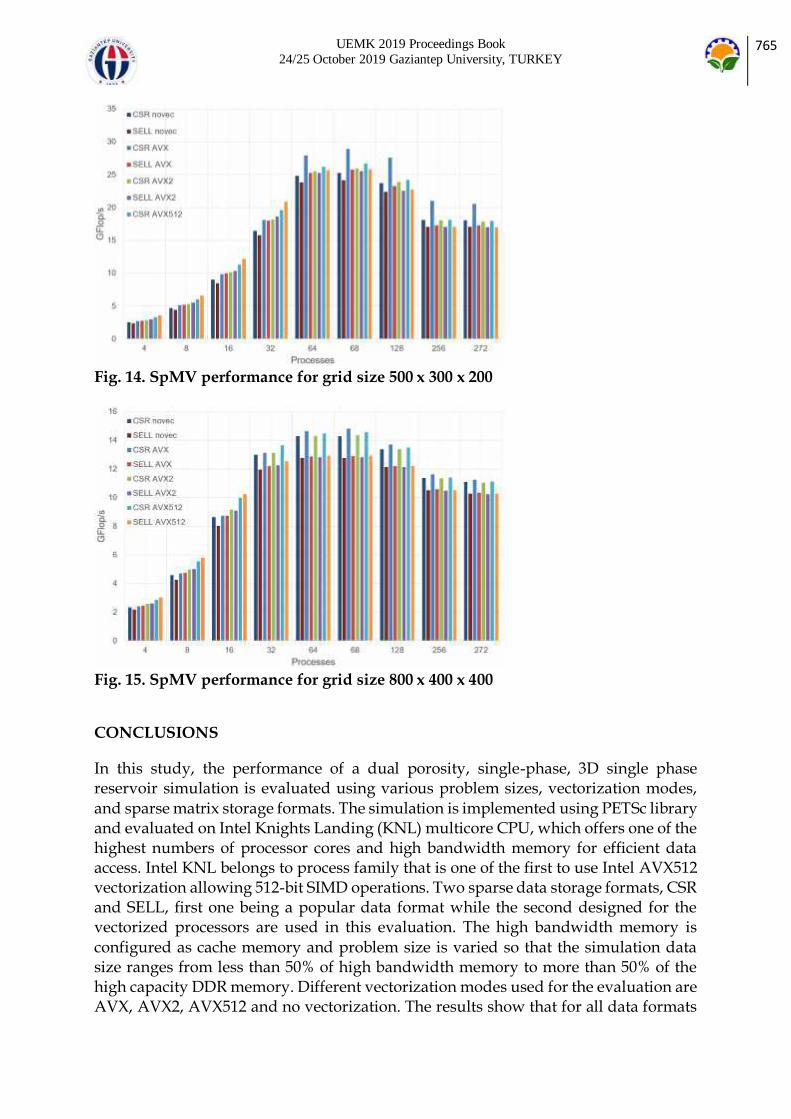
UEMK 2019 Proceedings Book
24/25 October 2019 Gaziantep University, TURKEY 765
Fig. 14. SpMV performance for grid size 500 x 300 x 200
Fig. 15. SpMV performance for grid size 800 x 400 x 400
CONCLUSIONS
In this study, the performance of a dual porosity, single-phase, 3D single phase reservoir simulation is evaluated using various problem sizes, vectorization modes, and sparse matrix storage formats. The simulation is implemented using PETSc library and evaluated on Intel Knights Landing (KNL) multicore CPU, which offers one of the highest numbers of processor cores and high bandwidth memory for efficient data access. Intel KNL belongs to process family that is one of the first to use Intel AVX512 vectorization allowing 512-bit SIMD operations. Two sparse data storage formats, CSR and SELL, first one being a popular data format while the second designed for the vectorized processors are used in this evaluation. The high bandwidth memory is
configured as cache memory and problem size is varied so that the simulation data size ranges from less than 50% of high bandwidth memory to more than 50% of the high capacity DDR memory. Different vectorization modes used for the evaluation are AVX, AVX2, AVX512 and no vectorization. The results show that for all data formats
UEMK 2019 Proceedings Book
24/25 October 2019 Gaziantep University, TURKEY 766
and vectorization modes, the best performance is achieved when the number of MPI processes is equal to the number of processor cores on KNL (68 cores in our case). Also, when the data size is less than 50% of high bandwidth memory capacity, SELL format along with AVX512 vectorization gives the best performance. Moreover, CSR format along with AVX vectorization shows the least performance variation when data size is varied up to high bandwidth memory capacity. CSR along with AVX vectorization is also the best performing combination for problem sizes exceeding 50% of the HBM capacity. For the case when simulation data size exceeds high bandwidth memory capacity, performance of SELL format degrades considerably compared with CSR format under all vectorization modes, with CSR along with AVX vectorization giving the best performance. In conclusion, performance of reservoir simulation on a multicore CPU given a sparse data storage format and vectorization mode is dependent on the problem size. While the vectorization friendly SELL format with AVX512 performs best for smaller problem sizes easily fitting into HBM, CSR with AVX vectorization is good choice for problem sizes with data approaching or exceeding the HBM capacity. Acknowledgments. The authors thank Professor Didem Unat at Koç University for her guidance and providing the resources used for this research. REFERENCES
ANL. (2019). Summary of Sparse Linear Solvers Available from PETSc [Internet]. Available from: https://www.mcs.anl.gov/petsc/documentation/linearsolvertable.html. Balay S, Abhyankar S, Adams M, Brown J, Brune P, Buschelman K, et al. (2019). PETSc Users Manual. Barenblatt, G.I., Zheltov, I.P., and Kochina, I.N. (1960). Basic concepts in the theory of seepage of homogeneous liquids in fissured rocks: Journal of Applied Mathematics, v. 24, 1286-1303. Couturier R, Domas S. (2012). Sparse systems solving on GPUs with GMRES. Journal of Supercomputing. De Souza, Grazione & Souto, Helio. (2014). Numerical Reservoir Simulation of Naturally Fractured Reservoirs. Presented at XXXV Ibero-Latin American Congress on Computational Methods in Engineering, At Fortaleza, Ceará, Brazil. De Swaan O., A. (1976). Analytic Solutions for Determining Naturally Fractured Reservoir Properties by Well Testing. Society of Petroleum Engineers. doi:10.2118/5346-PA.

UEMK 2019 Proceedings Book
24/25 October 2019 Gaziantep University, TURKEY 767
Dichiarante, A.M., Holdsworth, R.E., McCaffrey, K.J.W., Dempsey, E.D., Selby, D., Conway, A., and Wilson, R. (2016). A reassessment of the brittle deformation history, age and attribute analysis from the Orcadian Basin, Scotland: implications for offshore Devonian fractured reservoirs. Dongarra J. (2000). Sparse Matrix Storage Formats. Available from: http://www.netlib.org/utk/people/JackDongarra/etemplates/node372.html Gerami, S., Pooladi-Darvish, M., Morad, K. et al. (2007). Type Curves for Dry CBM Reservoirs With Equilibrium Desorption. Presented at the Petroleum Society's 8th CIPC/58th Annual Technical Meeting, Calgary, 12-14 June. Paper2007-011. Imber, J., Armstrong, H., Clancy, S., Daniels, S., Herringshaw, L., McCaffrey, K., Rodrigues, J., Trabucho-Alexandre, J., and Warren, C. (2014). Natural fractures in a United Kingdom shale reservoir analog, Cleveland Basin, northeast England, AAPG Bulletin, 98, 2411-2437. Jeffers J, Reinders J, Sodani A. (2016). Intel Xeon Phi Processor High Performance Programming: Knights Landing Edition [Internet]. Elsevier Science. Kazemi, H. (1969). Pressure Transient Analysis of Naturally Fractured Reservoirs with Uniform Fracture Distribution. Society of Petroleum Engineers. doi:10.2118/2156-A. Kazemi, H., Gilman, J.R. and Elsharkawy, A.M. (1992). Analytical and Numerical Solution of Oil Recovery From Fractured Reservoirs With Empirical Transfer Functions (includes associated papers 25528 and 25818). SPE Res Eng 7 (2): 219-227. http://dx.doi.org/10.2118/19849-PA. Kourtis K, Karakasis V, Goumas G, Koziris N. (2011). CSX: An Extended Compression Format for SpMV on Shared Memory Systems. In: Proceedings of the 16th ACM Symposium on Principles and Practice of Parallel Programming. New York, NY, USA: ACM. Lim, K.T., and Aziz, K. (1995). Matrix-fracture transfer shape factors for dual-porosity simulators. Journal of Petroleum Science and Engineering, v. 13, issue 3–4, 169-178. ISSN 0920-4105. https://doi.org/10.1016/0920-4105(95)00010-F. Liu W, Vinter B. (2015). CSR5: An Efficient Storage Format for Cross-Platform Sparse Matrix-Vector Multiplication. Minden V, Smith B, Knepley MG. (2013). Preliminary Implementation of PETSc Using GPUs: GPU Solutions to Multi-scale Problems in Science and Engineering [Internet]. Berlin, Heidelberg: Springer Berlin Heidelberg.
UEMK 2019 Proceedings Book
24/25 October 2019 Gaziantep University, TURKEY 768
Monakov A, Lokhmotov A, Avetisyan A. (2010). Automatically Tuning Sparse Matrix-Vector Multiplication for GPU Architectures: High Performance Embedded Architectures and Compilers. Berlin, Heidelberg: Springer Berlin Heidelberg. NVIDIA. (2019). cuSPARSE library. https://docs.nvidia.com/cuda/cusparse/index.html. Ranjbar, E. and Hassanzadeh, H. (2011). Matrix-fracture transfer shape factor for modeling flow of a compressible fluid in dual-porosity media. Adv. Water Resour. 34 (5): 627-639. http://dx.doi.org/10.1016/j.advwatres.2011.02.012. Rodriguez-Roman, J., & Camacho Velazquez, R. (2005). Decline Curve Analysis Considering Non-Laminar Flow in Two Porosity Systems. Society of Petroleum Engineers. doi:10.2118/74388-PA. Rupp K, Tillet P, Rudolf F, Weinbub J, Morhammer A, Grasser T, et al. (2016). ViennaCL-Linear Algebra Library for Multi- and Many-Core Architectures. SIAM Journal of Scientific Computing. Saad Y. (2003). Iterative Methods for Sparse Linear Systems, Second Edition. Society for Industrial and Applied Mathematics. Torcuk, M. A. (2013). Analytical solutions for multiple-matrix in fractured reservoirs: application to conventional and unconventional reservoirs. http://hdl.handle.net/11124/78950. Vuduc RW. (2003). Automatic Performance Tuning of Sparse Matrix Kernels. Ph.D. Thesis. Warren, J. E., & Root, P. J. (1963). The Behavior of Naturally Fractured Reservoirs. Society of Petroleum Engineers. doi:10.2118/426-PA. Wu, Yu-Shu & Pruess, Karsten. (2019). A Physically Based Numerical Approach for Modeling Fracture-Matrix Interaction in Fractured Reservoirs. Zhang. Z. (2015). PRODUCTION DATA ANALYSIS OF NATURALLY FRACTURED RESERVOIRS: A DENSITY-BASED APPROACH. Master’s Thesis, John and Willie Leone Family Department of Energy and Mineral Engineering, Graduate School of the Pennsylvania State University, Pennsylvania, United States of America. Zhang H, Mills RT, Rupp K, and Smith BF. (2018). Vectorized Parallel Sparse Matrix-Vector Multiplication in PETSc Using AVX-512. In: Proceedings of the 47th International Conference on Parallel Processing. New York, NY, USA.

UEMK 2019 Proceedings Book
24/25 October 2019 Gaziantep University, TURKEY 769
A STUDY ON THE INTERACTION BETWEEN CALIXARENE DERIVATIVES AND BOVINE SERUM ALBUMIN
Bahar YILMAZ Karamanoğlu Mehmetbey Üniverstesi [email protected] Mevlüt BAYRAKCI Karamanoğlu Mehmetbey Üniverstesi [email protected]
ABSTRACT: The interaction between water-soluble phosphate-derived calixarene compounds (pCLX4 and pCLX8) and bovine serum albumin (BSA) was investigated by emission and absorption spectrophotometry, Spectrophotometric results showed that pCLX4 and pCLX8 gradually quenched the fluorescence of BSA. This situation explained that there is an interaction between BSA and calixarene derivatives. And this interaction was shown that calixarene structures play an important role in the transport of protein-based drugs. Key words: Calixarene, BSA, Fluorescence, Absorbance, Emission KALİKSAREN TÜREVLERİ VE SIĞIR SERUM ALBÜMİNİ ARASINDAKİ ETKİLEŞİM ÜZERİNE BİR ÇALIŞMA
ÖZET: Suda çözünebilen fosfat türevli kaliksaren bileşikleri (pCLX4 ve pCLX8) ve sığır serum albümini (BSA) arasındaki etkileşim emisyon ve absorpsiyon spektrofotometresi ile araştırılmıştır. Spektrofotometrik sonuçlar, pCLX4 ve pCLX8'in BSA'nın floresansını yavaş yavaş söndürdüğünü göstermiştir. Bu durum BSA ve kaliksaren türevleri arasında bir etkileşim olduğunu açıkladı. Ve bu etkileşim, kaliksaren yapılarının protein temelli ilaçların taşınmasında önemli bir rol oynadığını göstermiştir. Anahtar sözcükler: Kaliksaren, BSA, Floresans, Absorbans, Emisyon GİRİŞ
Supramoleküler kimya, moleküller arasındaki ve içerisindeki etkileşimleri inceleyen bilim dalıdır. Son yıllarda başta fizik, kimya ve biyoloji alanları olmak üzere önemli bir yere sahiptir (Shinkai, 1993). Supramoleküler kimya, “moleküler reseptör” ve “substrat” olarak anılan supromoleküler türleri ele alır. Yani reseptör tarafından subratın bağlanması supramolekülleri oluşturur ve bağlanma prosesi molekülün yapısını doğrulamayı sağlar (Bayrakci, 2012). Makrosiklik bileşiklerin, köprülü yapıya sahip olmaları ve molekül içi boşluklar içermeleri reseptör olarak kullanılabilmelerini sağlar. Bu makrosiklik bileşikler arasında crown (taç) eterler, kriptantlar,

UEMK 2019 Proceedings Book
24/25 October 2019 Gaziantep University, TURKEY 770
siklodekstrinler ve kaliksarenler en fazla ilgi çekenlerdir (Bayrakci ve ark., 2011). Kolay türevlendirilebildiklerinden dolayı kaliksarenler en çok tercih edilen makrosiklik bileşiklerdir. Kaliksarenler, fenol ve formaldehitin bazik ortamda kondensasyonu ile oluşturulmaktadır. Ayrıca, değişik moleküllerle kompleks yapabilme özelliğine sahip, metilen köprüleriyle fenolik birimlerin birbirlerine bağlanmasını sağlayarak hidrofobik bir boşluk oluşturabilen makrosiklik bileşiklerdir (Ertul ve ark., 2010). Kaliksarenler doğal olarak suda çözünmezler ve sulu çözeltide meydana gelen substrat-bağlanma çalışmaları için uygun değildirler. Kaliksarenlerin kullanım alanlarını genişletmek için suda çözünen kaliksaren türevlerinin sentezlenmesi gereklidir. Suda çözünen kaliksarenler ilaç çözünürlüğü ve kontrollü ilaç salınımı gibi birçok alanda kullanılmaktadır. Bu nedenle suda çözünür fonksiyonel gruplar (fosfo, sülfo ve nitro gibi gruplar) ile kaliksaren molekülleri türevlendirilmektedir (Bayrakci ve ark., 2012). Çeşitli ilaçların dağılımının, serbest konsantrasyonunun ve metabolizmasının, kan akışındaki ilaç-protein etkileşimlerinden etkilenmektedir. Bu tip bir etkileşim kemoterapötik işlem sırasında ilacın stabilitesini ve toksisitesini de etkileyebilir. Serum albüminler plazmadaki en bol bulunan proteinlerdir. Dolaşım sisteminin başlıca çözünebilir protein bileşenleri olarak, birçok fizyolojik fonksiyona sahiptirler (Hu et al., 2005). Kolloid ozmotik kan basıncına katkıda bulunurlar ve temel olarak kan pH'ının korunmasından sorumludurlar. Ayrıca ilaçların yerleştirilmesinde ve etkinliğinde baskın bir rol oynamaktadırlar (Wang et al., 2007). Birçok ilaç ve biyoaktif moleküller, başta albümin proteini olmak üzere taşıyıcı olarak işlev gören diğer serum bileşenlerine bağlanabilir. Bu nedenle ilacın serum albümine olan afinitesini bilmek önemlidir. Spektroskopik çalışmalar, kimyasal ve biyolojik sistemlerin reaktivitesinin incelenmesi için güçlü birer yöntemdir ve bu yöntemlerle bir proteinin spektrumunu yüksek güvenilirlikle analiz etmek mümkündür (Hu et al., 2005). Bu çalışmada, BSA proteini ile kaliksaren türevleri arasındaki etkileşimin floresans ve absorbans spektrumu kullanılarak aydınlatılması amaçlanmaktadır.
YÖNTEM
Sentez
Kaliksarenlerin O-fosfonik asit türevlerinin sentezi, daha önceki literatür çalışmaları (Bayrakci, 2012) göz önünde bulundurularak sentezlendi ve karakterize edildi. Spektroskopik Çalışmalar
Molekül ve protein arasındaki etkileşimleri absorbsiyon ve emisyon çalışmaları ile incelemek için, BSA ile artan konsantrasyondaki fosfonatlı kaliksaren molekülünün absorbans ve emisyon ölçümleri alındı (shimadzu 1800, hitachi 7200). BULGULAR
Sentez ve Karakterizasyon

UEMK 2019 Proceedings Book
24/25 October 2019 Gaziantep University, TURKEY 771
Sentezi yapılan fosfanatlı kalikaren (pCLX[n]) moleküllerinin yapısal karakterizasyonu 1H-NMR ve FT-IR (ATR) ile aydınlatıldı.
Şekil 1. 25,26,27,28-Tetrakis(dihidroksifosfonoksi)-5,11,17,23-tetra-terbütilkaliks[4]are ve Oktakis-O-(dihidroksifosforil)-p-ter-bütilkaliks[8]aren Absorpsiyon ve Emisyon Çalışmaları
BSA ile farklı konsantrasyondaki pCLX4 ve pCLX8 arasındaki emisyon ve absorpsiyon çalışmaları su içerisinde oda sıcaklığında gerçekleştirildi ve sonuçlar şekil 2 ve şekil 3’de gösterildi. BSA proteinin absorbans ölçümlerinde 280 nm dalga boyunda gösterdiği pik pCLX4 ve pCLX 8 eklendiğinde kaybolmamış aksine daha da artmıştır. Bu durum pCLX[n] ile BSA arasındaki ilişkinin BSA'nın moleküler konformasyonunu değiştirmediğini, hidrojen bağ ve iyonik etkileşimin protein-molekül birleşimi için eşit derecede önemli güçlere sahip olduğunu öne sürmüştür (Wang et al., 2007).
Şekil 2. BSA Varlığında pCLX4, pCLX8 ve BSA ile Etkileşimlerinin Absorpsiyon Spektrumları Absorpsiyon spektrumlarındaki değişimleri destekleyebilmek amacıyla aynı karışımların emisyon spektrumları da alınmıştır. Şekil 3’de gösterildiği gibi 340 nm’de BSA proteini kuvvetli floresans spektrumu gösterirlerken, artan konsantrasyonda pCLX4 ve pCLX8 eklediğinde floresansın artan konsantrasyon ile kademeli olarak azaldığı ve kaybolduğu gözlenmiştir.

UEMK 2019 Proceedings Book
24/25 October 2019 Gaziantep University, TURKEY 772
Şekil 3. BSA Varlığında Farklı Konsantrasyondaki; a) pCLX4 ve b) pCLX8 Moleküllerinin Emisyon Spektrumları SONUÇ
İlaçların ya da aktif moleküllerin proteinlerle etkileşim çalışması başta eczane, farmakoloji ve biyokimya alanları olmak üzere birçok alanda önem taşımaktadır (Hu et al., 2005). Bu çalışmada, kaliksaren türevlerinin BSA ile etkileşimi, absorbans ve emisyon ölçümü içeren spektrofotometrik yöntemlerle incelenmiştir. Deney sonuçları, BSA moleküllerinin ikincil yapısının, pCLX4 ve pCLX8 varlığında değiştiğini göstermiştir. Ayrıca kaliksaren türevleri tarafından BSA'nın floresans özelliğinin söndürülmesi aralarında etkileşim olduğunu kanıtlamıştır. Sentezlenen bu kaliksaren türevlerinin, başta plazma proteinleri temelli ilaçlar olmak üzere benzer yapıdaki moleküllerin taşınmasında aktif olarak kullanılabileceği tespit edilmiştir. KAYNAKLAR
Bayrakcı, M. (2012). Suda çözünebilen kaliksfosfonatlarin sentezi, antibakteriyel özelliklerinin incelenmesi ve furosemit, niklosamit ve nifedipin gibi bioaktif moleküllerin çözünürleştirilmesinde kullanimi (Doctoral dissertation, Selçuk Üniversitesi Fen Bilimleri Enstitüsü). Bayrakcı, M., Ertul, S., & Yilmaz, M. (2011). Phase solubility studies of poorly soluble
drug molecules by using O-phosphorylated calixarenes as drug-solubilizing agents. Journal of Chemical & Engineering Data, 57(1), 233-239. Bayrakcı, M., Ertul, Ş., & Yılmaz, M. (2012). Solubilizing effect of the p-phosphonate calix [n] arenes towards poorly soluble drug molecules such as nifedipine, niclosamide and furosemide. Journal of Inclusion Phenomena and Macrocyclic Chemistry, 74(1-4), 415-
423. https://doi.org/ 10.1007/s10847-012-0135-7 Ertul, Ş., Bayrakcı, M., & Yilmaz, M. (2010). Removal of chromate and phosphate anion from aqueous solutions using calix [4] aren receptors containing proton switchable units. Journal of hazardous materials, 181(1-3), 1059-1065. https://doi.org/10.1016/j.jhazmat.2010.05.121 Hu, Y. J., Liu, Y., Shen, X. S., Fang, X. Y., & Qu, S. S. (2005). Studies on the interaction between 1-hexylcarbamoyl-5-fluorouracil and bovine serum albumin. Journal of Molecular Structure, 738(1-3), 143-147. https://doi.org/10.1016/j.molstruc.2004.11.062 Shinkai, S. (1993). Calixarenes-the third generation of supramolecules. Tetrahedron, 49(40), 8933-8968. https://doi.org/10.1016/S0040-4020(01)91215-3

UEMK 2019 Proceedings Book
24/25 October 2019 Gaziantep University, TURKEY 773
Wang, Y. Q., Zhang, H. M., Zhang, G. C., Tao, W. H., & Tang, S. H. (2007). Interaction of the flavonoid hesperidin with bovine serum albumin: A fluorescence quenching study. Journal of Luminescence, 126(1), 211-218.

UEMK 2019 Proceedings Book
24/25 October 2019 Gaziantep University, TURKEY 774
ELECTROCHEMICAL PROPERTIES OF CARBON SUPPORTED Cu2Mo6S8
NANOSTRUCTURES
Meriç KARAKIŞ, Karamanoglu Mehmetbey University, Faculty of Engineering, Department of Energy Systems Engineering, Karaman, Turkey Adem SARILMAZ, Karamanoglu Mehmetbey University, Faculty of Engineering, Department of Metallurgical and Materials Engineering, Karaman, Turkey Faruk ÖZEL, Karamanoglu Mehmetbey University, Faculty of Engineering, Department of Metallurgical and Materials Engineering, Karaman, Turkey Gamze KARANFİL, Karamanoglu Mehmetbey University, Faculty of Engineering, Department of Energy Systems Engineering, Karaman, Turkey, [email protected]
ABSTRACT: In this study, it is aimed to synthesize alternative, more economical and more efficient catalysts to the platinum catalyst which constitutes a large part of the proton exchange membrane (PEM) fuel cell cost and which has activation problems in the oxygen reduction reaction in the PEM fuel cell cathode electrode. For this purpose, the chevrel phases which exhibited remarkable electrocatalytic activities in the oxygen reduction reaction were synthesized as carbon supported and electrochemical properties were investigated to determine their use as catalyst in PEM fuel cell cathode reactions. Carbon supported-Cu2Mo6S8 chevrel phase catalysts were synthesized at high temperatures by solid state synthesis conditions. The synthesis experiments were performed at different temperatures and times to optimize the production parameters. Optimization studies revealed that the most suitable production parameters were 24 hours and 1000˚C. CV and RDE measurements were performed to investigate the use of Cu2Mo6S8 chevrel phase catalysts produced as PEM fuel cell cathode catalyst.
Key words: Energy, Catalyst, Chevrel phases, Cu2Mo6S8 Acknowledgments
This work is supported by Karamanoglu Mehmetbey University BILTEM (Scientific and Technological Research and Application Center) and TUBITAK (The Scientific and Technological Research Council of Turkey) under project number 118M662.

UEMK 2019 Proceedings Book
24/25 October 2019 Gaziantep University, TURKEY 775
INVESTIGATION OF THE EFFECT OF BREAD MOLD ON SOIL BASED MICROBIAL FUEL CELL
Gamze KARANFİL Karamanoglu Mehmetbey University, Faculty of Engineering, Department of Energy Systems Engineering, Karaman, Turkey, [email protected]
ABSTRACT: Microbial fuel cells (MFCs) have attracted a lot of attention as a mode of converting organic waste into electricity. In this study, a soil-based microbial fuel cell that generates bioelectricity by biodegradation of food waste is developed. Bread mold was used as organic waste. The electric properties of the soil based-MFC were investigated along with the influence of using of vermicompost. It is observed that the power and lifetime of the soil based-MFC was increased by using of vermicompost. This developed soil based-MFC is a simple cell to generate electricity from organic
waste.
Key words: Energy, Microbial Fuel Cell, Mold, Soil, Compost INTRODUCTION
Rapid urbanization has accrued the necessity for reliable and sustainable energy sources (Sophia and Sreeja, 2017). The energy generation technologies which uses the reliable and sustainable energy sources is required to overcome with the growing energy request, the depletion of fossil fuels and environmental pollution. These energy
generation technologies are related to natural energy sources as solar energy, wind energy and bio-energy (Wetser et al., 2015). Another problem that is as important as the energy is solid organic waste. Solid organic wastes represent an important resource of environmental pollution world-wide. From a global perspective, organic wastes should be seen as a valuable resource that can be profitable and that fits the concept of energy from waste (Khudzari et al, 2016). Like all fungi, molds produce energy by using heterotrophy from the organic matter they live in, not through photosynthesis. Typically, the molds secrete hydrolytic enzymes essentially from the hiphal ends. Microbial fuel cells (MFCs) convert the chemical energy stored in organic matter directly into electrical energy, thanks to the action of electrochemically active microorganisms (Castresana et al., 2019). There are some researches of MFCs to generate electricity from organic wastes, wastewaters, marine sediments and rice paddy fields. Besides, MFC in hybrid composting method by reutilizing kitchen waste as a raw material were proposed (Moqsud et al., 2013).
The aim of this study is to develop a soil based-microbial fuel cell that generates electricity through the usage of bread mold and to investigate the influence of using of vermicompost.
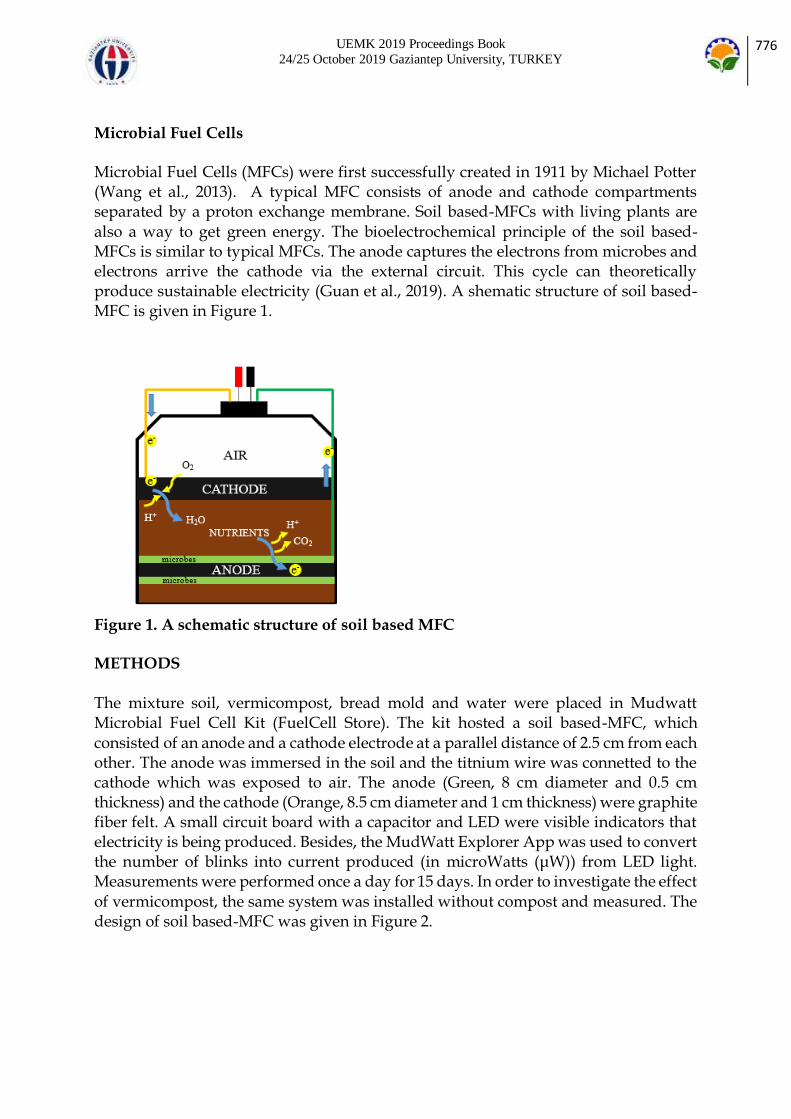
UEMK 2019 Proceedings Book
24/25 October 2019 Gaziantep University, TURKEY 776
Microbial Fuel Cells
Microbial Fuel Cells (MFCs) were first successfully created in 1911 by Michael Potter (Wang et al., 2013). A typical MFC consists of anode and cathode compartments separated by a proton exchange membrane. Soil based-MFCs with living plants are also a way to get green energy. The bioelectrochemical principle of the soil based-MFCs is similar to typical MFCs. The anode captures the electrons from microbes and electrons arrive the cathode via the external circuit. This cycle can theoretically produce sustainable electricity (Guan et al., 2019). A shematic structure of soil based-MFC is given in Figure 1.
Figure 1. A schematic structure of soil based MFC METHODS
The mixture soil, vermicompost, bread mold and water were placed in Mudwatt Microbial Fuel Cell Kit (FuelCell Store). The kit hosted a soil based-MFC, which consisted of an anode and a cathode electrode at a parallel distance of 2.5 cm from each other. The anode was immersed in the soil and the titnium wire was connetted to the cathode which was exposed to air. The anode (Green, 8 cm diameter and 0.5 cm thickness) and the cathode (Orange, 8.5 cm diameter and 1 cm thickness) were graphite fiber felt. A small circuit board with a capacitor and LED were visible indicators that electricity is being produced. Besides, the MudWatt Explorer App was used to convert the number of blinks into current produced (in microWatts (μW)) from LED light. Measurements were performed once a day for 15 days. In order to investigate the effect of vermicompost, the same system was installed without compost and measured. The design of soil based-MFC was given in Figure 2.

UEMK 2019 Proceedings Book
24/25 October 2019 Gaziantep University, TURKEY 777
Figure 2. The design of soil based-MFC
RESULTS AND FINDINGS
Figure 3 shows the changes in the power of the soil based-MFCs over the 15-day experiment. Several abrupt power changes were observed. The power drop phenomenon happened because the carbon source limited the metabolism of bacteria within the anaerobic zone of the soil based-MFC. In other saying, whenever the organic matters begin depleting, the electricity production would decrease due to the low microbial metabolism happening in the soil based-MFC (Khudzari et al., 2016). In order to determine the electrical production potential of bread mold, the soil based-MFC system was established only as soil and soil+vermicompost. However, neither of these soil based-MFC systems produced electricity. In addition, the same soil based-MFC system was established without the addition of compost to investigate the effect of vermicompost. The results showed that the non-composted soil based-MFC system produced lower power generation and did not work after 3 days. Both soil based-MFC systems started to work at the end of the 3rd day and the maximum power generation for composted and non-composted soil based-MFC systems for 15 days was 193 μW and 40 μW, respectively.
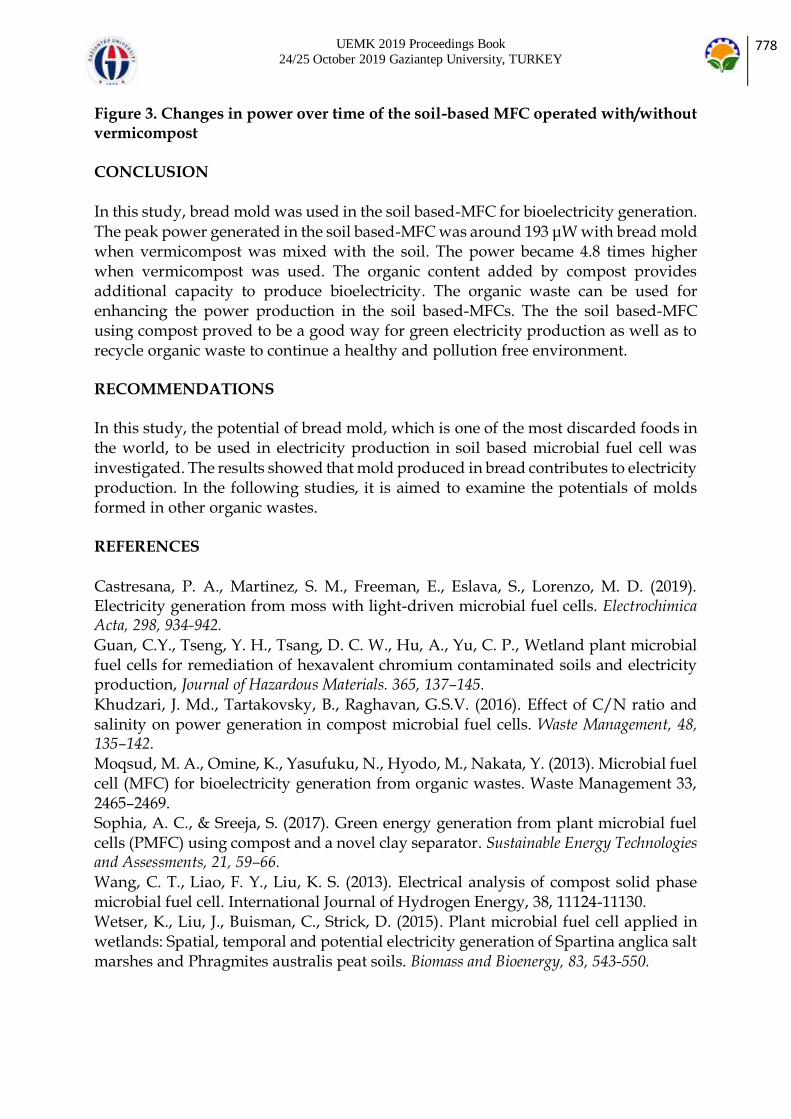
UEMK 2019 Proceedings Book
24/25 October 2019 Gaziantep University, TURKEY 778
Figure 3. Changes in power over time of the soil-based MFC operated with/without vermicompost
CONCLUSION
In this study, bread mold was used in the soil based-MFC for bioelectricity generation. The peak power generated in the soil based-MFC was around 193 μW with bread mold when vermicompost was mixed with the soil. The power became 4.8 times higher when vermicompost was used. The organic content added by compost provides additional capacity to produce bioelectricity. The organic waste can be used for enhancing the power production in the soil based-MFCs. The the soil based-MFC using compost proved to be a good way for green electricity production as well as to recycle organic waste to continue a healthy and pollution free environment. RECOMMENDATIONS
In this study, the potential of bread mold, which is one of the most discarded foods in the world, to be used in electricity production in soil based microbial fuel cell was investigated. The results showed that mold produced in bread contributes to electricity production. In the following studies, it is aimed to examine the potentials of molds formed in other organic wastes. REFERENCES
Castresana, P. A., Martinez, S. M., Freeman, E., Eslava, S., Lorenzo, M. D. (2019). Electricity generation from moss with light-driven microbial fuel cells. Electrochimica Acta, 298, 934-942.
Guan, C.Y., Tseng, Y. H., Tsang, D. C. W., Hu, A., Yu, C. P., Wetland plant microbial fuel cells for remediation of hexavalent chromium contaminated soils and electricity production, Journal of Hazardous Materials. 365, 137–145.
Khudzari, J. Md., Tartakovsky, B., Raghavan, G.S.V. (2016). Effect of C/N ratio and salinity on power generation in compost microbial fuel cells. Waste Management, 48, 135–142.
Moqsud, M. A., Omine, K., Yasufuku, N., Hyodo, M., Nakata, Y. (2013). Microbial fuel cell (MFC) for bioelectricity generation from organic wastes. Waste Management 33, 2465–2469. Sophia, A. C., & Sreeja, S. (2017). Green energy generation from plant microbial fuel cells (PMFC) using compost and a novel clay separator. Sustainable Energy Technologies and Assessments, 21, 59–66.
Wang, C. T., Liao, F. Y., Liu, K. S. (2013). Electrical analysis of compost solid phase microbial fuel cell. International Journal of Hydrogen Energy, 38, 11124-11130. Wetser, K., Liu, J., Buisman, C., Strick, D. (2015). Plant microbial fuel cell applied in wetlands: Spatial, temporal and potential electricity generation of Spartina anglica salt marshes and Phragmites australis peat soils. Biomass and Bioenergy, 83, 543-550.

UEMK 2019 Proceedings Book
24/25 October 2019 Gaziantep University, TURKEY 779
THE EFFECT OF DEEP EUTECTIC SOLVENT ON COPPER RECOVERY FROM
COPPER SMELTING SLAG
Mehmet Ali Topçu Karamanoğlu Mehmetbey University, Engineering Faculty, Metallurgical and Materials Engineering, Karaman, Turkey, [email protected] Aydın RÜŞEN Karamanoğlu Mehmetbey University, Engineering Faculty, Metallurgical and Materials Engineering, Karaman, Turkey, [email protected] ABSTRACT: Copper smelting slag which forms during the smelting stage of concentrated ore in pyrometallurgical copper production includes remarkable amount of copper. Up to now, copper recovery has been extracted from copper smelting slag with hydrometallurgical routes by using various leaching agents based on acids or bases. Considering the negative effect of these solvents on human health and environment, the search for new solvents with less environmental damage continues. Therefore, in this work, a new generation solvent was investigated for copper recovery from copper smelting slag. For this work, 50 mL of deep eutectic solvent was prepared by mixing choline chloride and urea with 1:2 molar ratio. Reaction duration in the range of 2, 8, 16, 32, 48 and 72 hours and solid-to liquid ratio in the range of 1/10, 1/20, 1/30 and 1/40 was chosen as experimental variable at 95 oC reaction temperature and 600 rpm stirring speed. According to the experimental results, copper recovery from smelting slag increased with increasing reaction duration in deep eutectic solvent and maximum copper recovery was obtained as 80.84% after 72 hours of leaching. Also,
experimental results showed that copper recovery increased with decreasing solid-to liquid ratio and highest copper recovery was achieved as 83.60% after leaching with 1/40 solid-to liquid ratio. Key words: Smelting Slag, Copper Recovery, Deep Eutectic Solvents, Hydrometallurgy INTRODUCTION
Sulphidic copper ores is generally used for copper production in pyrometallurgical production which includes concentration, smelting, converting and refining stages. In smelting stage, concentrated CuFeS2 is melted under neutral atmosphere at 1200 – 1300 oC and two liquid phases, namely matte with a high copper content and a huge amount of smelting slag with a 0.7 – 2.3% of copper content. (Gorai and Jana, 2003; Rüşen et al., 2013) Copper smelting slag contains large amount of iron oxide (FeO and Fe2O3) and silica (SiO2) phases. Expect the main phases, copper smelting slag includes small amount of Al2O3, CaO and MgO oxides and other metals such as Cu, Co, Zn and Ni. (Sridhar et. al., 1997; Davenport et. al., 2002). Due to the environmental risk and economic point of view, these copper smelting slags must be disposed (Ahmed et. al., 2012; Murari et al., 2015) Until today, many studies have been performed to recover

UEMK 2019 Proceedings Book
24/25 October 2019 Gaziantep University, TURKEY 780
metals from copper smelting slag by using hydrometallurgical and/or pyrometallurgical methods. Hydrometallurgical methods are frequently used when evaluating the copper smelting slag because these methods are relatively more economical and environmentaly friendly than pyrometallurgical method. (Arslan and Arslan, 2002; Yang et al., 2010; Zhai et al., 2011; Dimitrijević et al., 2017) However, due to the negative effects of acid-based solvents on human and environment, many studies have been started for environmentally sensitive solvents. Recently, Abbott et al., (2003) showed a new solvent, namely deep eutectic solvents which have extraordinary solving properties and prepared by two components which are cheap, renewable and biodegradable to form a eutectic mixture. Choline chloride is the most favourite component due to its low cost, biocompatibility and nontoxic structure. (Zhang et al. 2012) Nowadays, there is increasing interest in hydrometallurgical processes for DESs which prepared with ChCl and hydrogen bond donors such as urea, ethylene glycol and malonic acid due their low cost and dissolving properties. According to previous studies (Abbott et. al., 2009; Bakkar 2014), the solubility of metal oxides such as ZnO, Cu2O and PbO in electric arc furnace was quite high in DES based on ChCl and urea. Also, it is stated that DESs provide a suitable environment for the removal of metals from the leach liquor by electro-wining. A recent study on metal recovery by using the choline chloride-urea mixture was conducted by Rüşen and Topçu (2017). In their study on zinc and lead recovery from zinc-lead leach residues showed that zinc and lead recovery increased with increasing reaction temperature and zinc and lead recovery was obtained as 55% and 47%, respectively. In this study, the effect of reaction duration and solid-to liquid ratio on copper recovery from copper smelting slag was investigated by using a deep eutectic solvent. METHODS
Leaching and characterization experiments were performed by using copper smelting slag from Eti Bakır Inc., Turkey. Chemical analyses of copper smelting slag were
conducted by Inductively Coupled Plasma Mass Spectrometer (ICP – MS) in chemistry laboratory of Eti Bakır Inc. Mineralogical characterization of copper smelting was investigated by using X-Ray Diffractometer with Cu Kα radiation at 30 kV at a scanning rate of 0.4o min-1 at Karamanoğlu Mehmetbey University. Table 1. Chemical Composition of Copper Smelting Slag (wt.)
Elements FeTotal SiO2 Cu Zn Pb Al2O3
Amount (wt%)
36.7 36.1 0.88 3.3 0.1 2.2
According to the XRD analysis, the copper smelting slag was composed of mainly Fayalite (2FeO.SiO2) and magnetite (Fe3O4) phases. As stated previous studies (Rüşen et. al., 2012 Rüşen et. al., 2013; Rüşen et. al., 2016), copper is found in different structures as copper metallic copper, matte inclusions of various copper percentage

UEMK 2019 Proceedings Book
24/25 October 2019 Gaziantep University, TURKEY 781
and complex (Cu–Fe–Zn) sulphides. Also copper smelting slag was included small amount of Al2O3 and CaO.
Choline chloride (>98%) and urea (>99%) was used without purification to prepare deep eutectic solvent. Choline chloride and urea were mixed in a glass baker with stoichiometric eutectic molar ratio 1:2, respectively and heated slowly to 90 oC on hot plate until a homogenous colourless liquid was obtained. The prepared deep eutectic solvent was shown in Figure 1.
Figure 1. The Prepared Deep Eutectic Solvent and Leach Liquor Obtained After Leach Process at 95 oC Reaction Temperature, 1/20 Solid-to Liquid Ratio and 48 Hours. All leaching experiments were carried out by using constant volume of DES (50 ml) in closed three-necked glass flask on temperature controlled heater. Reaction duration
and solid-to liquid ratio was chosen as experimental variable. Reaction duration and solid-to liquid ratio was selected in the range of 2, 8, 16, 32, 48 and 72 hours, and 1/10, 1/20, 1/30 and 1/40 g/L, respectively. After leaching experiments, the solid and liquid parts were separated from each other by filtration system. The obtained leach liquor was diluted 0.1 M HCl and analyzed by using Perkin Elmer PinAccle 900T model Atomic Absorption Spectroscopy. As described before (Kılıçel and Karapınar, 2018), Cu hollow cathode lamps were used as radiation source. The most sensitive wavelengths (nm) and lamp current (mA) used for specification of the analytes were Cu 324.8 and 15. An air/acetylene flame was used for absorbance measurements of Cu. Diluted standard solutions were used to build calibration curve for method validation within linear range. Finally, the correlation coefficient was obtained as 0.9992571. RESULTS AND FINDINGS Effect of Reaction Duration
Effect of reaction duration on copper recovery from copper smelting slag with DES was investigated at 95 oC reaction temperature, 1/20 solid-to liquid ratio and 600 rpm stirring speed. Experimental results are shown in Fig 2.
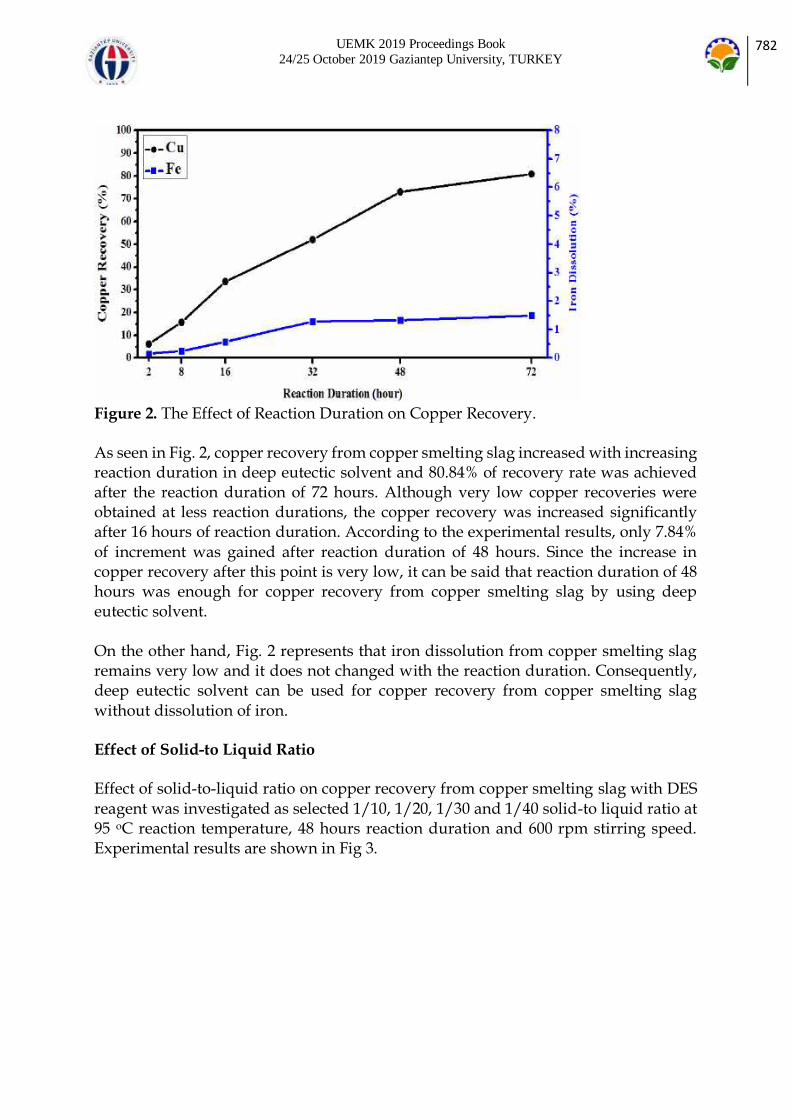
UEMK 2019 Proceedings Book
24/25 October 2019 Gaziantep University, TURKEY 782
Figure 2. The Effect of Reaction Duration on Copper Recovery.
As seen in Fig. 2, copper recovery from copper smelting slag increased with increasing reaction duration in deep eutectic solvent and 80.84% of recovery rate was achieved after the reaction duration of 72 hours. Although very low copper recoveries were obtained at less reaction durations, the copper recovery was increased significantly after 16 hours of reaction duration. According to the experimental results, only 7.84% of increment was gained after reaction duration of 48 hours. Since the increase in copper recovery after this point is very low, it can be said that reaction duration of 48 hours was enough for copper recovery from copper smelting slag by using deep eutectic solvent. On the other hand, Fig. 2 represents that iron dissolution from copper smelting slag remains very low and it does not changed with the reaction duration. Consequently, deep eutectic solvent can be used for copper recovery from copper smelting slag without dissolution of iron. Effect of Solid-to Liquid Ratio
Effect of solid-to-liquid ratio on copper recovery from copper smelting slag with DES reagent was investigated as selected 1/10, 1/20, 1/30 and 1/40 solid-to liquid ratio at 95 oC reaction temperature, 48 hours reaction duration and 600 rpm stirring speed. Experimental results are shown in Fig 3.

UEMK 2019 Proceedings Book
24/25 October 2019 Gaziantep University, TURKEY 783
Figure 3. The Effect of Solid-to Liquid Ratio on Copper Recovery. According to the experimental results, even significant copper recovery was obtained at high solid-to liquid ratio, copper recovery increased gradually with decreasing solid-to liquid ratio in DES solution. As seen in Fig. 3, approximately 70% of copper recovery was obtained at 1/10 of solid-to liquid ratio where 5 grams of smelting slag was added to 50 mL DES. After this point, 13.80% of a rising in copper recovery was
observed and the highest copper recovery was obtained as 83.60% at 1/40 of solid-to liquid ratio where 1.25 grams of smelting slag was added to %0 mL DES. As illustrated in Fig. 3, iron dissolution increased with decreasing solid-to liquid ratio and the highest iron dissolution was obtained 7.92% after leaching experiment at 1/40 of solid-to liquid ratio. Considering the economic effect and low iron dissolution, it can be said that 1/20 of solid-to liquid ratio is sufficient for copper recovery from copper smelting slag. CONCLUSIONS
In this study, use of a deep eutectic solvent formed with choline chloride and urea was investigated for copper recovery from copper smelting slag. According to the characterization studies, copper smelting slag includes huge amount of iron and silica. Apart from these metals, the slag consists of 0.8%Cu and 3.3% Zn. Fayalite including FeO and SiO2 was detected as the major mineralogical structure of copper smelting slag. Also, little amount of other oxides (Al2O3 and CaO) were determined. Before the leaching experiments, deep eutectic solvent was prepared successively. Leaching experiments showed that the higher reaction duration and lower solid-to liquid ratio has great effect on copper recovery. The highest copper recovery was obtained as 83.60% at 95 oC, 48 hours and 1/40 solid –to liquid ratio. But considering the economic effect, the leaching condition for copper recovery was proposed as 95 oC, 48 hours and 1/20 solid –to liquid ratio. ACKNOWLEDGEMENT

UEMK 2019 Proceedings Book
24/25 October 2019 Gaziantep University, TURKEY 784
The authors gratefully acknowledge the Karamanoğlu Mehmetbey University Scientific Research Projects (BAP) Coordinating Office for support with grant number KMU-BAP-17-M-18 REFERENCES
Abbott, A. P., Capper, G., Davies, D. L., Rasheed, R. K., & Tambyrajah, V. (2003). Novel solvent properties of choline chloride/urea mixtures. Chemical Communications, (1), 70-71. Abbott, A. P., Collins, J., Dalrymple, I., Harris, R. C., Mistry, R., Qiu, F., ... & Wise, W. R. (2009). Processing of electric arc furnace dust using deep eutectic solvents. Australian journal of chemistry, 62(4), 341-347.
Ahmed, I. M., Nayl, A. A., & Daoud, J. A. (2016). Leaching and recovery of zinc and copper from brass slag by sulfuric acid. Journal of saudi chemical society, 20, S280-S285. Arslan, C., & Arslan, F. (2002). Recovery of copper, cobalt, and zinc from copper smelter and converter slags. Hydrometallurgy, 67(1-3), 1-7. Bakkar, A. (2014). Recycling of electric arc furnace dust through dissolution in deep eutectic ionic liquids and electrowinning. Journal of hazardous materials, 280, 191-199. Davenport, W. G., King, M. J., Schlesinger, M. E., & Biswas, A. K. (2002). Extractive metallurgy of copper. Elsevier.
Dimitrijević, M., Urošević, D., Milić, S., Sokić, M., & Marković, R. (2017). Dissolution of copper from smelting slag by leaching in chloride media. Journal of Mining and Metallurgy B: Metallurgy, 53(3), 407-412.
Gorai, B., & Jana, R. K. (2003). Characteristics and utilisation of copper slag—a review. Resources, Conservation and Recycling, 39(4), 299-313. Kılıçel, F., & Karapınar, H. S. (2018). Determination of trace elements contents of some spice samples by using FAAS. Asian Journal of Chemistry, 30(7), 1551 – 1558. Murari, K., Siddique, R., & Jain, K. K. (2015). Use of waste copper slag, a sustainable material. Journal of Material Cycles and Waste Management, 17(1), 13-26.
Ruşen, A., Geveci, A., Topkaya, Y. A., & Derin, B. (2012). Investigation of effect of colemanite addition on copper losses in matte smelting slag. Canadian Metallurgical Quarterly, 51(2), 157-169. Rusen, A., Derin, B., Geveci, A., & Topkaya, Y. A. (2016). Investigation of Copper Losses to Synthetic Slag at Different Oxygen Partial Pressures in the Presence of Colemanite. JOM, 68(9), 2316-2322.
Rusen, A., Geveci, A., Topkaya, Y. A., & Derin, B. (2016). Effects of some additives on copper losses to matte smelting slag. JOM, 68(9), 2323-2331. Rusen, A., & Ali Topcu, M. (2017). Investigation of Various Metal Recoveries from Zinc Plant Leach Residue by Choline-Chloride Agent. Current Physical Chemistry, 7(4), 273-280. Sridhar, R., Toguri, J. M., & Simeonov, S. (1997). Copper losses and thermodynamic considerations in copper smelting. Metallurgical and Materials Transactions B, 28(2),
191-200.

UEMK 2019 Proceedings Book
24/25 October 2019 Gaziantep University, TURKEY 785
Yang, Z., Rui-lin, M., Wang-dong, N., & Hui, W. (2010). Selective leaching of base metals from copper smelter slag. Hydrometallurgy, 103(1-4), 25-29.
Zhai, X. J., Li, N. J., Zhang, X., Yan, F. U., & Jiang, L. (2011). Recovery of cobalt from converter slag of Chambishi Copper Smelter using reduction smelting process. Transactions of Nonferrous Metals Society of China, 21(9), 2117-2121. Zhang, Q., Vigier, K. D. O., Royer, S., & Jerome, F. (2012). Deep eutectic solvents: syntheses, properties and applications. Chemical Society Reviews, 41(21), 7108-7146.

UEMK 2019 Proceedings Book
24/25 October 2019 Gaziantep University, TURKEY 786
THE EFFECT OF REACTION TIME ON COPPER RECOVERY FROM ANODE SLIME BY USING BMIMBF4 (1-BUTYL-3-METHYLIMIDAZOLIUM TETRAFLUOROBORATE) IONIC LIQUID
Mehmet Ali TOPÇU Karamanoğlu Mehmetbey University, Department of Metallurgical and Material Engineering, Karaman, Turkey, [email protected] Aydın RÜŞEN Karamanoğlu Mehmetbey University, Department of Metallurgical and Material Engineering, Karaman, Turkey, [email protected] Özkan KÜÇÜK Şeyh Edebali University, Department of Metallurgical and Material Engineering, Bilecik, Turkey, [email protected]
ABSTRACT: In this study, the use of 1-butyl-3-methyl-imidazolium tetraflouroborate (BmimBF4) ionic liquid, a new environmentally sensitive solvent, is investigated for copper recovery from anode slime which have high amount of copper. The anode slime was supplied from a company where secondary sources uses to produce copper, and includes 23% Cu, 17% Pb and 20.5% Sn. The effect of reaction time was investigated in the range of 1 – 48 hours with leaching experiments conducted under conditions of %50 BmimBF4, 50 oC temperature and 1/20 g/mL solid/liquid ratio in the presence of BmimBF4. According to the preliminary results, although the copper
recovery increased slightly with increasing reaction time, the leaching efficiency was limited to 10%. Studies for the recovery of precious metal from anode slime with BF4 continue with investigation of the effects parameters such as temperature, ionic liquid concentration, solid/liquid ratio and oxidant addition in order to increasing leaching efficiency. Key words: Ionic Liquid, BmimBF4, Anode Slime, Leach, Copper Recovery BMİMBF4 (1-BÜTİL-3-METİL-İMİDAZOLYUM TETRAFLOROBORAT) İYONİK SIVISI KULLANILARAK ANOT ÇAMURUNDAN BAKIRGERİ KAZANIMINDA LİÇ SÜRESİNİN ETKİSİ
ÖZET: Bu çalışmada, yüksek bakır içeriğine sahip anot çamurlarından bakır metalini kazanmak için çevreye duyarlı yeni bir çözücü olan 1-bütil-3-metil-imidazolyum tetrafloroborat (BmimBF4) iyonik sıvısının kullanımı araştırılmaktadır. İkincil atıklardan üretim yapan bir firmadan tedarik edilen ve %23 Cu, %17 Pb, %20,5 Sn temel kimyasal kompozisyonuna sahip anot çamuru başlangıç malzemesi olarak kullanılmıştır. %50 BmimBF4 iyonik sıvı konsantrasyonu, 50oC sıcaklık ve 1/20 g/mL

UEMK 2019 Proceedings Book
24/25 October 2019 Gaziantep University, TURKEY 787
katı/sıvı oranı şartları altında yapılan deneylerde BmimBF4 varlığında bakır metalinin geri kazanımında sürenin etkisi 1 – 48 saat aralığında incelenmiştir. Elde edilen ilk sonuçlara göre reaksiyon süresinin artışıyla bakır kazanımı bir miktar artış gösterse de liç verimi %10 ile sınırlı kalmıştır. BmimBF4 ile anot çamurundan değerli metal kazanımına yönelik çalışmalar liç veriminin arttırılması amacıyla sıcaklık, iyonik sıvı konsantrasyonu, katı/sıvı oranı ve oksidant ilavesi gibi parametrelerin etkilerinin araştırılmasıyla devam etmektedir.
Anahtar sözcükler: İyonik Sıvı, BmimBF4, Anot Çamuru, Liç, Bakır Geri Kazanımı
GİRİŞ
Anot çamuru bakır üretim tesislerinde elektroliz aşamasında oluşan bir yan üründür. Bu atık yüksek oranda değerli metaller (Au, Ag, Cu, Se, Te ve platin grubu metaller)içerdiğinden bu atığın geri kazanımı ekonomik olarak önem arz etmektedir. Bu atıklar üzerine yapılan geri kazanım çalışmaları sadece pirometalurjik, sadece hidrometalurjik, veya piro-hidrometalurjik olarak her iki geri kazanım sürecini de içeren şekilde olabilmektedir. Anot çamuru içindeki bakır üretim sürecine bağlı olarak
metalik, oksitli, sülfürlü veya selenyum ve tellür ile karmaşık yapılar oluşturmuş halde bulunabilir. Ayrıca, elektroliz aşamasında hücreden uzaklaştırılırken yıkama şekline bağlı olarak %20’ye kadar suda çözünebilen bileşiklere sahip olabilir. Anot çamurunun değerlendirilmesinde ilk işlem olarak içerisinde yüksek oranda bulunan bakır sülfürik asit ile liç edilerek uzaklaştırılmaktadır. Sülfürik asitte çözünebilir formda bakır bileşikleri oluşturmak için anot çamuru genellikle 300 oC civarında oksitleyici kavurma işlemine tabii tutulur. Böylece, sülfürik asit ile liç işlemi sonrasında yapıda çözünmeden kalan zenginleştirilmiş değerli metaller daha sonra geri kazanılmak üzere “Dore metal” olarak adlandırılan bir alaşım haline getirilir. Bu genel geri kazanım metodu Dönmez vd. (1988) tarafından Sarkuysan Elektrolitik Bakır Sanayi ve Ticaret A.Ş.’den temin ettikleri anot çamuru için uygulanmıştır. H2SO4 çözeltisi kullanarak yapıdaki bakırı %99.67 oranında geri kazanan yazarlar, çözünürlüğe etki eden en önemli parametrelerin kavurma (300 oC) ve liç reaksiyonu (70 oC) sıcaklığının olduğunu belirtmişlerdir. Bakırın tamamına yakını anot çamurundan alındıktan sonra kalan katının Altın ve Gümüş gibi değerli metallerin kazanımı için uygun olduğunu bildirmişlerdir. Benzer şekilde, Amer (2003) 0,25 M H2SO4 çözeltisinde 85 oC ‘de 90 dk. liç işlemi sonunda yaklaşık %90 oranında bakır kazanılabileceğini bildirmiştir. Kılıç vd. (2013) Sarkuysan Elektrolitik Bakır Sanayi ve Ticaret A.Ş.’den temin ettikleri ağırlıkça %25 oranında bakır ve %4,68 oranında Selenyum içeren anot çamurundan bu iki metali kazanmak içinH2SO4 ortamında bakırsızlaştırma ve sonrasında NaOH çözeltisinde Selenyumun çözündürülmesini sağlayan iki kademeli hidrometalurjik prosedür uygulamışlardır. Bu çalışmada, en iyi
bakır kazanımını %94 oranında 2M H2SO4 çözeltisi içerisinde 2 L/dk oksijen akış hızında 80 oC de 120 dk. Boyunca liç ederek elde etmişlerdir.

UEMK 2019 Proceedings Book
24/25 October 2019 Gaziantep University, TURKEY 788
Yukarıda özetlenen çalışmalara bakıldığında, günümüzde anot çamurundan bakır geri kazanımı için uygulanan hidrometalurjik yöntemlerde çözücü olarak sülfürik asit (H2SO4) kullanıldığından çevresel etkiler başta olmak üzere birçok dezavantaja sahiptir. Öte yandan düşük buhar basıncı, elektrokimyasal kararlılık, tutuşmazlık, çözücülük ve termal kararlılık gibi birçok üstün özelliğe sahip “green solvent” olarak adlandırılan iyonik sıvılar araştırmacılar tarafından çeşitli cevher ve atıklardan metal kazanımı üzerine denenmeye başlanmış ve ilgi çekici sonuçlar elde edilmiştir. İyonik sıvıların ilk defa cevherlerden metal eldesi/kazanımı amacıyla kullanımı McCluscey vd. tarafından 2002 yılında yapılmış ve çözücü olarak 1-butil-3-metilimidazolyum tetraflor borat ([Bmim]BF4) iyonik sıvısının Fe(BF4)3 oksidantı varlığında kullanılmıştır. Çalışmada, kalkopirit cevherinden %90’a varan oranlarda bakır kazanımının 100 °C sıcaklıkta 8 saatlik liç sonrasında elde edilebileceği belirtilmiştir.2004 yılında Whitehead vd. (2004) tarafından gerçekleştirilen çalışmada 1-bütil-3-metil-imidazolyum hidrojen sülfat (bmim+HSO4
-) iyonik sıvısına tiyoüre ve oksidant olarak demir(III) sülfat eklenerek altın (Au) ve gümüş (Ag) kazanımı için seçici liç işlemi uygulanmıştır. Cevherden bakır kazanımı üzerine yapılan ilk çalışma ise yine Whitehead vd. (2007) tarafından 2007 yılında gerçekleştirilmiştir. Çeşitli iyonik sıvıları (1-alkil-3-metil-imidazolyum ve buna benzer türevlerini) sülfidik bakır, altın ve gümüş cevherlerinin liç edilmesi için kullanmışlar ve metallerin ekstrakt (çıkarım) verimliliğini sıcaklık, oksidant ve alkali zincir uzunluğu gibi çeşitli değişkenler için incelemişlerdir. Çözelti içindeki artan iyonik sıvı konsantrasyonu ve sıcaklık ile bakır çıkarım verimliliğinin %87’ye kadar çıkarılabileceğini ortaya koymuşlardır. Dong vd. (2009) tarafından yapılan bir çalışmada BmimHSO4 ve onun sulu çözeltileri ile kalkopirit konsantresi 50-90 oC aralığında liç işlemine tabii tutulmuş ve araştırmacılar, çözeltideki iyonik sıvı konsantrasyonunun %10’dan %100’e çıkarılması ile kazanılan bakır oranının %52’den %88’e kadar arttığını gözlemlemişlerdir. Huang vd. (2014) elektrik ve elektronik ekipmanlarında kullanılan ve ağırlıkça yaklaşık %20 bakır içeren baskılı devre kartlarındaki bakırı geri kazanmak için bu artık malzemeleri bmimHSO4 ile liç etmişlerdir. Deneysel verilerin ışığında neredeyse %100’e varan (%99,92) bakır kazanımıyla en uygun liç şartlarını; %80 (v/v) iyonik sıvı, 10 mL %30 H2O2, 1:25 (g/L) katı/sıvı oranı, 70 oC liç sıcaklığı ve 2 saat liç zamanı olarak belirlemişlerdir. Son yıllarda, Rüşen ve Topçu (2017, 2018) tarafından yapılan çalışmalarda ise %60 EmimHSO4 iyonik sıvı konsantrasyonu, 95oC sıcaklık, 2 saat süre ve 1/20katı/sıvı oranı (g/mL) şartları altında hiçbir oksidant ilavesi olmaksızın %50’nin üzerinde bakır geri kazanım oranı (Rüşen & Topçu 2017) elde edilmiş, [Bmim]HSO4 iyonik sıvısı ile %60iyonik sıvı konsantrasyonu, 50 oC sıcaklık, 2 saat süre ve 1/25 g/mLkatı/sıvı oranı şartlarında %87,52 bakır geri kazanımı değerine ulaşılmıştır. İyonik sıvılar ile cevher veya ikincil kaynaklardanbakır geri kazanımı üzerine gerçekleştirilen çalışmalara bakıldığında kısa alkil zincirli metil imidazolyum (1-butil-3met-imidazolyum; bmim+X-) temelli iyonik sıvıların su ile karışılabilirlik (hidrofobiklik) veyaviskozite gibi fiziksel özelliklerinin metal kazanımı açısından daha avantajlı olduğu belirtilmektedir. Bu sebeple, bu çalışmada kısa alkil zincir yapısına sahip olan ve daha önce anot çamuru üzerine herhangi bir uygulaması

UEMK 2019 Proceedings Book
24/25 October 2019 Gaziantep University, TURKEY 789
bulunmayan BmimBF4 iyonik sıvısı çözücü olarak tercih edilmiştir. Bu çalışmada, BmimBF4 iyonik sıvısının varlığında yüksek bakır içeriğine sahip anot çamurlarından bakır metalinin geri kazanımında sürenin etkisi 1 – 48 saat aralığında incelenmiştir. YÖNTEM
Bakır üretiminde oluşan atıklar içerisinde elektro-saflaştırma aşamasında ortaya çıkan bakır anot çamuru Altın, Gümüş, Bakır, Selenyum ve Tellür gibi değerli metalleri
içerdiğinden yüksek ekonomik değere sahip önemli endüstriyel atıklar arasında yer almakta olup altın, gümüş ve bakır açısından ikincil kaynak olarak görülmektedir. Bu çalışmada kullanılan anot çamuru ikincil atıklardan yola çıkarak bakır tel üretimi yapmakta olan bir işletmeden temin edilmiştir. Daha önceki çalışmalarda (Rüşen & Topçu 2017, 2018) gerçekleştirilen analizlere göre anot çamurunun temel kimyasal kompozisyonu%23 Cu, %17 Pb, %20,5 Sn’den oluşmaktadır. Mineralojik yapı analizine göre ise anot çamurunun ana fazlarını PbSO4, SnO2 ve CuO bileşikleri oluşturmaktadır. Bu bileşikler dışında BaSO4 ve SbAsO4 bileşiklerine de rastlanmıştır. Çalışmada kullanılan BmimBF4 (>% 99) Merck firmasından ticari olarak satın alınmış ve hacimsel olarak %50 saf su karıştırılarak deneylerde kullanılmıştır. 5 gram anot çamuru 100 mL çözücüye (%50 BmimBF4 - %50 saf su karışımı) ilave edilip 50 oC’de ve 600 rpm hızla karıştırma hızında 1 – 48 saat aralığındaki sürelerde liç işlemine tabii tutulmuştur. Filtrasyon sonrasında filtre keki ve zengin liç çözeltisi birbirinden ayrılmış ve elde edilen çözelti 0.1 M HC1 ile seyreltilmiştir. Zengin liç çözeltisi Perkin ElmerPinAccle 900T model atomik absorpsiyon spektroskopisi (AAS) kullanılarak içerdiği bakır miktarı tayin edilmiştir. BULGULAR
BmimBF4 iyonik sıvısının varlığında anot çamurlarından bakır metalinin geri kazanımında sürenin etkisi 1, 2, 4, 8, 12, 24, 30, 36 ve 48 saatlik liç deneyleri ile incelenmiştir. Yapılan deneylerde diğer parametreler; %50 BmimBF4 iyonik sıvı konsantrasyonu, 50oC sıcaklık, 1/20 g/mL katı/sıvı oranı ve 600 rpm karıştırma hızı olarak sabit tutulmuştur. Deneyler sonucunda elde edilen bakır geri kazanım oranları Şekil 1’de verilmiştir.

UEMK 2019 Proceedings Book
24/25 October 2019 Gaziantep University, TURKEY 790
Şekil 1. Reaksiyon süresinin anot çamurundan bakır geri kazanımı üzerine etkisi Şekil 1’den görüleceği üzere, deneysel çalışmalarda kullanılan %50 BmimBF4 iyonik sıvı konsantrasyonuna sahip çözeltinin anot çamuru içerisinde yaklaşık %23 oranında ve farklı formlarda (metalik, oksit ve kompleks halde) bulunan bakırı beklenen seviyede çözme yeteneğine sahip olmadığı anlaşılmaktadır. Anot çamurlarından bakırın geri kazanımına yönelik önceki çalışmalar (Rüşen & Topçu 2017, 2018) temel alındığında süre dışında liç sistemini etkileyen diğer parametrelerdeki (iyonik sıvı konsantrasyonu, sıcaklık ve katı/sıvı oranı) değişimin liç verimini doğrudan artıracak veya azaltacak yönde önemli etkilere sahip parametreler olduğu bilinmektedir. Özellikle iyonik sıvıların konsantrasyonlarındaki artışlar viskoziteyi arttırmakta iken sıcaklığın artışı çözelti viskozitesini azaltacak yönde etki etmektedir,bununla beraber her iki parametredeki artış bakır çözünürlüğünde bir artışa sebep olarak liç verimini yükseltebilmektedir. Bu sebeple, diğer parametrelerin incelenmesiyle beraber BmimBF4 varlığında bakır geri kazanım oranlarının artacağı öngörülmektedir. Literatürde BmimBF4’ün atıklardan metal geri kazanımı üzerine herhangi bir çalışmaya rastlanmamış olupcevherlerden metal ekstraksiyonu üzerine yapılmış çalışmalara nadiren rastlanmaktadır. Daha önce bahsedildiği üzere bu konuda literatüre giren ilk çalışma McCluscey vd. tarafından 2002 yılında yapılmış ve çözücü olarak 1-butil-3-metilimidazolyum tetraflor borat ([Bmim]BF4) iyonik sıvısının Fe(BF4)3 oksidantı varlığında kullanılmasıyla kalkopirit cevherinden %90’a varan oranlarda bakır kazanımının 100 °C sıcaklıkta 8 saatlik liç sonrasında elde edilebileceği belirtilmiştir. Bu sebeple, BmimBF4 iyonik sıvısı ile anot çamuru liçi deneylerinde çözeltiye farklı oksidantlarilave edilerek liç veriminin arttırılması yönünde çalışmalar yapılması önem arz etmektedir. Böylece, bakır geri kazanımında önemli oranlarda artış elde edilebileceği düşünülmektedir. Bu konudaki bir diğer çalışma 2007 yılında Whitehead vd. tarafından gerçekleştirilmiş olup BmimBF4 iyonik sıvısı sülfidik bakır, altın ve gümüş cevherlerinin liç edilmesi için kullanılmış ve metallerin ekstrakt (çıkarım) verimliliğini sıcaklık, oksidant ve alkali zincir uzunluğu gibi çeşitli değişkenler için incelemişlerdir. İyonik sıvılarda katyon değişkeni dışında bir diğer değişken grubunu da anyonlar oluşturmaktadır. Yapılan bu çalışmada, Cl, BF4, N(CN)2, HSO4 ve CH3SO3 anyonları Bmim katyonu ile kullanılmış ve metal extraksiyonlarında en iyi kazanımların sülfat (HSO4) anyonları ile yapılabileceği ifade edilmiştir. BmimBF4 iyonik sıvısının çözme kabiliyetlerinin bakır için sınırlı ancak altın için daha yüksek olduğunu belirtmişlerdir. Literatürde verilen sonuçlara dayanılarak, tarafımızdan yapılan çalışma kapsamında çözeltilerde yaptırılacak altın analizleri sonucunda geri kazanım verimlerinin bakıra oranla çok daha yüksek olması beklenmektedir. SONUÇ
Bu çalışmada, ikincil atıklardan bakır tel üretimi yapan bir firmadan tedarik edilen %23 Cu içerikli anot çamuru başlangıç malzemesi olarak kullanılarak BmimBF4
UEMK 2019 Proceedings Book
24/25 October 2019 Gaziantep University, TURKEY 791
çözücüsünün anot çamurundanbakır geri kazanımı üzerinereaksiyon süresinin etkisi 1 – 48 saat aralığında incelenmiştir. %50 iyonik sıvı konsantrasynu, 50oC reaksiyon sıcaklığı, 1/20 katı/sıvı oranı (g/mL) ve 600 rpm karıştırma hızında48 saat liç süresinde yapılan deney sonucunda %10 civarında bakır geri kazanımı elde edilebilmiştir. Bu düşük orandaki bakır kazanımın yükseltilebilmesi ve altın ve gümüş gibi diğer değerli metallerde yüksek geri kazanım oranlarına ulaşılabilmesi için başta oksidant ilavesi olmak üzere liç sistemini etkileyen diğer parametrelerin araştırılmasına devam edilmektedir. TEŞEKKÜR
Bu çalışma, Türkiye Bilimsel ve Teknolojik Araştırma Kurumu (TÜBİTAK) tarafından Tübitak-116M057 nolu projesi ile desteklenmiştir. KAYNAKLAR
Amer, A. M. (2003). Processing of copper anodic-slimes for extraction of valuable metals. Waste Management, 23(8), 763-770.
Dong, T., Hua, Y., Zhang, Q., & Zhou, D. (2009). Leaching of chalcopyrite with Brønsted acidic ionic liquid. Hydrometallurgy, 99(1-2), 33-38. Dönmez, B., Celik, C., Colak, S., & Yartaşi, A. (1998). Dissolution optimization of copper from anode slime in H2SO4 solutions. Industrial & engineering chemistry research, 37(8), 3382-3387.
Huang, J., Chen, M., Chen, H., Chen, S., & Sun, Q. (2014). Leaching behavior of copper from waste printed circuit boards with Brønsted acidic ionic liquid. Waste management, 34(2), 483-488.
Kilic, Y., Kartal, G., & Timur, S. (2013). An investigation of copper and selenium recovery from copper anode slimes. International Journal of Mineral Processing, 124, 75-82. Rogers, R. D. (2002). Ionic liquids: industrial applications to green chemistry. In ACS symposium series. American Chemical Society. Rüşen, A., & Topçu, M. A. (2017). Optimization of gold recovery from copper anode slime by acidic ionic liquid. Korean Journal of Chemical Engineering, 34(11), 2958-2965. Rüşen, A., & Topçu, M. A. (2018). Investigation of an alternative chemical agent to recover valuable metals from anode slime. Chemical Papers, 72(11), 2879-2891.
Whitehead, J. A., Lawrance, G. A., & McCluskey, A. (2004). ‘Green’leaching: recyclable and selective leaching of gold-bearing ore in an ionic liquid. Green Chemistry, 6(7), 313-315. Whitehead, J. A., Zhang, J., Pereira, N., McCluskey, A., & Lawrance, G. A. (2007). Application of 1-alkyl-3-methyl-imidazolium ionic liquids in the oxidative leaching of sulphidic copper, gold and silver ores. Hydrometallurgy, 88(1-4), 109-120.
UEMK 2019 Proceedings Book
24/25 October 2019 Gaziantep University, TURKEY 792
EFFECT OF TEOS AS CROSS-LINKER ON INTERFACE GFP EXPRESSED IN E.Coli/TiO2 AT BIO-BASED SOLAR CELLS
Numan ECZACIOGLU, Department of Bioengineering, Karamanoğlu Mehmetbey University, Karaman, Turkey, [email protected] Erdi AKMAN, Nanotechnology R&D Laboratory, Karamanoğlu Mehmetbey
University, Karaman, Turkey, [email protected] Yakup ULUSU, Department of Bioengineering, Karamanoğlu Mehmetbey University, Karaman, Turkey, [email protected] Savas SÖNMEZOĞLU, Department of Metallurgical and Materials Engineering, Karamanoğlu Mehmetbey University, Karaman, Turkey, [email protected]
ABSTRACT: The microorganisms coating surface of the photoanodes via using some connection molecules as an interfacial layer modification and optimization plays an important role for the solar cells to obtained efficiency and performance in the biogenic photovoltaic technologies area. In this work, genetically engineered E.coli cells which heterologously expressed the green fluorescent protein (GFP) were used as a semiconductor in the presence and absence of tetraethyl orthosilicate (TEOS) which is a linker interface. Bio-based solar cell (BSCs) application was carried out by combining TEOS with bio-sensitizer. The coating on photoanode surface with TEOS linked GFP expressed in E.coli cells, showed better performance than cells employing without-TEOS. Key words: Tetraethyl orthosilicate (TEOS) cross-linker, Green fluorescent protein (GFP), Bio-based solar cell (BSCs) INTRODUCTION
In recent years, lots of solar cell systems are continue to designed, made and modulate as a photovoltaic device by scientist to solve the energy consumption problem (Akman et al., 2020 and Akin et al., 2018). With increasing interest in carbon-neutral energy production, photovoltaic (PV) technology is gaining more attention as a potentially approach to sustainable energy production (Lewis, 2007). The use of light-sensitive materials (synthetic and natural) has been an important step in the development of photovoltaic materials and bio-based solar cell (BSCs) (Srivastava et al., 2018). Fabrication of dye-sensitive solar cells (DSSCs) using some synthetic molecules such as ruthenium complexes is an important milestone (Thavasi et al., 2009). Because the ruthenium complexes are toxic and expensive, the interest in BSCs developed using natural dye pigments has increased. Although natural dye pigments are low cost and

UEMK 2019 Proceedings Book
24/25 October 2019 Gaziantep University, TURKEY 793
environmentally friendly, they have disadvantages such as being complex in content, low in stability because of fast biodegradable (Mohammadpour et al., 2015). Nature contains a series of photoactive proteins that collect solar energy and synchronize their functions to make photosynthesis very efficient. Among these proteins green fluorescent protein (GFP), a natural light activated protein, photon-induced electron ejection by some light-activated proteins, holds high promise for BSCs (Acikgoz et al., 2014). It is easy and inexpensive to clone and express of the GFP in the E.coli BL21(DE3)plysE cells. And also, a-helix containing the chromophore is
located inside the barrel structure makes GFP very stable under a variety of conditions (Li et al., 1998). In this present study, we report the TEOS linked GFP expressed in E.coli BL21(DE3)plysE cells can be used for particularly effective at harvesting light to built highly efficient bio-solar cells. METHODS
Preparation of GFP/Cells Production of the GFP expressed in E.coli BL21(DE3)plysE was carried out by following our previously published literature procedure (Acikgoz et al., 2014). Briefly, the plasmid vector carrying GFP gene was transformed into the E.coli BL21(DE3)plysE competent cells using heat shock. Then the cells were grown and inducted with IPTG. After GFP containing cells were collected and suspended in Tris HCl buffer, they were used as a layer in solar cell. Preparation of TEOS solution
The gel solution was prepared by in-situ of TEOS with 0.11 mL tetraethyl orthosilicate, 0.15 mL ammonia in 5 mL ethanol. The solution was then stirred at room temperature for 2 hours. Solar cells assembly
The preparation of working electrodes, TiO2 paste and iodure-based redox electrolyte were manufactured in our previous studies (Akin et al., 2018 and Ozturk et al., 2017). After the TiO2 pastes are prepared these TiO2 electrodes were immersed in GFP/cells and TEOS/GFP/cells functionalized solution and kept at RT for 12 h. Then ten times spin-coating process (at 3000 rpm for 30 s) was carried out to cover the surface of the GFP/cells/TiO2 films with pure cells solution. In the next step, GFP/cells and TEOS/GFP/cells covered TiO2 electrode and Pt-CE were assembled into a sandwich type cell with a drop of I-/I3
- redox electrolyte (Akin et al., 2018). The solar cells layers shown in Figure 1. The difference between A and B is presence and absence of TEOS as a linker molecule on the GFP expressed in E.coli BL21(DE3)plysE surface.

UEMK 2019 Proceedings Book
24/25 October 2019 Gaziantep University, TURKEY 794
Figure 16. The solar cell layer; A. GFP expressed in E.coli BL21(DE3)plysE, B. TEOS linked GFP expressed in E.coli BL21(DE3)plysE RESULTS AND FINDINGS
Current density−voltage (J−V) curve of the devices are represented in Figure 2, and the resulting photovoltaic parameters are summarized in Table 1. E.coli+GFP and TEOS + E.coli+GFP devices under optimized fabrication conditions executed a PCE of 0.032 % and 0.074 %, respectively. The efficiency value of the TEOS + E.coli+GFP device was about more than twice better than that of the E.coli+GFP devices. Further, TEOS + E.coli + GFP device all photovoltaic parameters such as Jsc, Voc and FF were better than E.coli + GFP devices. These results show that TEOS linker material is suitable for bio-based solar cell applications.

UEMK 2019 Proceedings Book
24/25 October 2019 Gaziantep University, TURKEY 795
Figure 17. The J-V characteristics of the devices.
Table 1. Photovoltaic parameters of devices
Samples Voc (V) Jsc (mA/cm2) FF n (%)
E.coli+GFP 0.30 0.258 0.42 0.032
TEOS +E.coli+GFP
0.47 0.306 0.51 0.074
CONCLUSION
In conclusion, our results showed that surface treatment of TiO2 nanoparticle with TEOS could enhance the significant gains in efficiency in the TiO2/GFP expressed in E.coli BL21(DE3)plysE interface. This result shows that TEOS has the potential to be
considered as an efficient linkage molecule on the interface between GFP expressed in E.coli BL21(DE3)plysE and TiO2. REFERENCES
Acikgoz, S., Ulusu, Y., Akin, S., Sonmezoglu, S., Gokce, I., & Inci, M. N. (2014). Photoinduced electron transfer mechanism between green fluorescent protein molecules and metal oxide nanoparticles. Ceramics International, 40(2), 2943-2951. Akin, S., Ulusu, Y., Waller, H., Lakey, J. H., & Sonmezoglu, S. (2017). Insight into Interface Engineering at TiO2/Dye through Molecularly Functionalized Caf1 Biopolymer. ACS Sustainable Chemistry & Engineering, 6(2), 1825-1836.
Akman, E., Altintas, Y., Gulen, M., Yilmaz, M., Mutlugun, E., & Sonmezoglu, S. (2020). Improving performance and stability in quantum dot-sensitized solar cell through single layer graphene/Cu2S nanocomposite counter electrode. Renewable Energy, 145, 2192-2200.

UEMK 2019 Proceedings Book
24/25 October 2019 Gaziantep University, TURKEY 796
Lewis, N. S. (2007). Toward cost-effective solar energy use. Science, 315(5813), 798-801. Li, X., Zhao, X., Fang, Y., Jiang, X., Duong, T., Fan, C., ... & Kain, S. R. (1998). Generation of destabilized green fluorescent protein as a transcription reporter. Journal of Biological Chemistry, 273(52), 34970-34975. Mohammadpour, R., & Janfaza, S. (2015). Efficient nanostructured biophotovoltaic cell based on bacteriorhodopsin as biophotosensitizer. ACS Sustain Chem Eng 3: 809–813. Ozturk, T., Gulveren, B., Gulen, M., Akman, E., & Sonmezoglu, S. (2017). An insight into titania nanopowders modifying with manganese ions: A promising route for highly efficient and stable photoelectrochemical solar cells. Solar Energy, 157, 47-57.
Srivastava, S. K., Piwek, P., Ayakar, S. R., Bonakdarpour, A., Wilkinson, D. P., & Yadav, V. G. (2018). A biogenic photovoltaic material. Small, 14(26), 1800729. Thavasi, V., Lazarova, T., Filipek, S., Kolinski, M., Querol, E., Kumar, A., ... & Renugopalakrishnan, V. (2009). Study on the feasibility of bacteriorhodopsin as bio-photosensitizer in excitonic solar cell: a first report. Journal of nanoscience and nanotechnology, 9(3), 1679-1687.
UEMK 2019 Proceedings Book
24/25 October 2019 Gaziantep University, TURKEY 797
PRODUCTION OF GLASS FIBER REINFORCED PHOTOVOLTAIC COMPOSITE PANEL AND INVESTIGATION OF ITS ELECTRICAL PROPERTIES
Serkan ERDEM Firat University, Engineering Faculty, Department of Mechanical Engineering [email protected] Ahmet YILDIZ Firat University, Engineering Faculty, Department of Mechatronic Engineering [email protected] Mete Onur KAMAN Firat University, Engineering Faculty, Department of Mechanical Engineering [email protected] Mustafa GÜR Firat University, Engineering Faculty, Department of Mechanical Engineering [email protected]
ABSTRACT: In this study, flexible photovoltaic panel design was made by encapsulating photovoltaic modules using resin doped composite material and electrical properties were investigated. With this method, the photovoltaic modules are connected to each other by suitable interconnection technologies and taken into
the fiber reinforced composite material. Thus, instead of standard photovoltaic panel design; The design of photovoltaic panels suitable for the surfaces can be changed according to the location. With this study, instead of multi-layer different encapsulation of photovoltaic panels available in the market, composite coating was realized as a single block. After the encapsulation with laminated composite material, a certain degree of bending of the panel was achieved without damaging the photovoltaic modules due to the flexible properties of the coating obtained. In addition, the current, voltage, power and efficiency values of the flat and concave composite photovoltaic panel were designed and manufactured. The results showed that the resin doped composite material is suitable for encapsulation process, has superior performance in terms of module reliability and meets the requirements for electrical production. Key words: Photovoltaic panel, encapsulant, glass fiber, composite, electrical efficiency

UEMK 2019 Proceedings Book
24/25 October 2019 Gaziantep University, TURKEY 798
CAM FİBER TAKVİYELİ FOTOVOLTAİK KOMPOZİT PANEL ÜRETİMİ VE ELEKTRİKSEL ÖZELLİKLERİNİN İNCELENMESİ
ÖZET: Bu çalışmada reçine katkılı kompozit malzeme kullanılarak fotovoltaik modüllere kapsülleme yapılarak esnek fotovoltaik panel imalatı yapılmış ve elektriksel özellikleri incelenmiştir. Bu yöntemle fotovoltaik modüller uygun ara bağlantı teknolojileri ile birbirine bağlanarak reçine katkılı kompozit malzeme içerisine alınmıştır. Böylece standart fotovoltaik panel tasarımı yerine; montaj yerine göre değişebilen yüzeylere uygun fotovoltaik panellerin tasarımı gerçekleştirilmiştir. Yapılan bu çalışma ile piyasada mevcut olan fotovoltaik panellerde çok katmanlı farklı kapsülleme yerine tek blok halinde kompozit kaplama gerçekleştirilmiştir. Reçine katkılı kompozit malzeme ile kapsülleme yapıldıktan sonra elde edilen kaplamanın esnek özelliği nedeniyle fotovoltaik modüllere zarar verilmeden belli bir oranda panelin eğilmesi sağlanmıştır. Ayrıca, tasarımı ve imalatı gerçekleştirilen kapsüllenmiş kompozit düzlem levhaya konkav özelliği kazandırılmış fotovoltaik panelin elektriksel olarak akım, gerilim, güç ve verim değerleri belirlenmiştir. Elde edilen sonuçlar reçine katkılı kompozit malzemenin kapsülleme işlemi için uygun olduğu, modül güvenilirliği açısından üstün performanslara sahip olduğunu ve elektriksel üretim açısından gerekli şartları sağladığını göstermiştir.
Anahtar sözcükler: Fotovoltaik panel, kapsülleme, cam fiber, kompozit, elektrikel verimlilik GİRİŞ
Günümüzde ülkeler gerekli olan enerjilerini birincil enerji kaynağı olan kömür, gaz ve petrol şeklindeki fosil yakıtlar yoluyla sağlanmaktadır. Fosil yakıt kaynakları hızlı bir şekilde azalmakta, çevreye zarar vermekte ve küresel iklim değişikliğine neden olmaktadır. Bu nedenle yenilenebilir olmayan kaynaklardan sürdürülebilir yenilenebilir enerji kaynaklarına geçiş bir zorunluluk olarak karşımıza çıkmaktadır (Yıldız vd., 2019). Yenilenebilir enerji kaynakları güneş, rüzgar, biyokütle, jeotermal, deniz, hidroelektrik gibi enerjileri içeresine almakta olup, bunlar içerisinde güneş enerjisinin her yerde bulunması nedeniyle güneş enerjisi sistemleri önem kazanmaktadır. Bu bağlamda özellikle yenilenebilir enerji sistemlerinden güneş enerjisi ile elektrik üreten fotovoltaik pil sistemleri son yıllarda hızlı bir büyüme göstermiştir. Fotovoltaik piller güneş enerjisini doğrudan elektrik enerjisine dönüştüren sistemler olarak kullanılmaktadır (Yıldız and Dandıl, 2019). Fotovoltaik sistemlerin verimli ve uzun ömürlü olarak kullanımı önemli olup bu yönde yapılan çalışmalar son yıllarda artmıştır. Fotovoltaik modül yapımında uygun malzemelerin seçiminin verime etkisi ile ilgili çalışmalar yapılarak kullanılan malzemelerin verim üzerine etkisi araştırılmıştır. Bu doğrultuda fotovoltaik modül üzerine yapılan araştırmalardan bir bölümü de fotovoltaik modülünün performansına etki eden kapsülleme malzemesine odaklanmıştır. Fotovoltaik panellerin yapısal performansı, fotovoltaik hücrelerinin ve modüllerin dış çevrenin etkisinden izole eden koruyucu kaplama ile

UEMK 2019 Proceedings Book
24/25 October 2019 Gaziantep University, TURKEY 799
sağlanabilmektedir (Mickiewicz vd., 2011). Kaplamalardaki tasarım problemleri fotovoltaik panellerin ömürlerinin azalmasına neden olmaktadır. Bu nedenle fotovoltaik modüllerin kapsüllenmesi için farklı polimerler üzerinde araştırmalar yapılmıştır (Wohlgemuth and Cunningham, 2008, Chaturvedi vd., 2013). Fotovotovoltaik modüller, bir ön camdan arka tabakaya doğru bir düzene göre tasarlanmaktadır. Buna göre bir modül; ön cam, kapsülleme ve arka kapaktan oluşmaktadır (Şekil 1). Modül etrafına genellikle alüminyum bir çerçeve uygulanır.
Şekil 1. Fotovoltaik Modül Tasarım Düzeni (Kopecek and Libal, 2018)
Fotovoltaik panellerin gerçek çalışma koşullarında çalışması durumunda verim düşüşü ve panelin bozulmasına etki eden parametreler üzerine birçok çalışmalar yapılmıştır (Ndiaye vd., 2013, Ottersböcket vd., 2017). Panelin çalışması sırasındaki bozulmasına etki eden parametrelerden biri panelin arka yüzey kaplaması ile ilişkilidir. Arka tabaka ve kapsülleme hatası nedeniyle modüle nem nüfuz eder. Dış ortam koşullarında kapsüllemenin zarar görmesi önemli ölçüde güç kaybına neden olabilmektedir (Kempe vd., 2007). Fotovoltaik panellerde kullanılan malzemeye ve fotovoltaik sistemin çalışma şartlarına bağlı olarak kısa süre ve uzun süre içinde bozunmalar meydana gelmektedir. Son yıllarda fotovoltaik panellerdeki bozulmalar üzerine yapılan çalışmalarda fotovoltaik panelin uzun süre kullanılabilirliği ve maliyetler dikkate alınarak problem tespit edilmekte ve çözüm önerileri getirilmektedir. Fotovoltaik panellerde kullanılan kapsülleyici malzemenin renk bozulması üzerine de çalışmalar yapılmıştır (Munoz vd., 2011). Ayrıca arka tabakada oluşan boşluklar, kaplamadaki kusurlar, çatlaklar, modül lehim bağlantı ve eklem hataları da çalışılan diğer konular arasındadır (Dhere and Raravikar, 2001, Han vd., 2012). Araştırmalar fotovoltaik panellerdeki bozulmaların sıcak ve nemli iklim ile ilişkili olduğunu, ayrıca bu parametrelerin verim üzerinde de önemli etkilerinin olduğunu ortaya koymuştur (Gxasheka vd., 2005). Kempe (2006), fotovoltaik panellerin alt yüzeylerinde tabaka ile güneş pili arasındaki ara yüzeyde küçük su damlacıklarının oluşabileceğini, bu durumun ise korozyona neden olabileceğini ve hatta fotovoltaik panelin verimini ve ömrünü etkileyebileceğini ortaya koymuştur. Benzer şekilde arka yüzey kaplama kusurlarının fotovoltaik panelin ömür verimini etkilediğine yönelik çalışmalarda kaplamanın önemi vurgulanmıştır (Czanderna and Pern, 1996, Van Dyk vd., 2005). Bu çalışmada, dış ortam koşullarına uygun fotovoltaik modüllerden oluşan panellerin güvenli ve verimli bir şekilde kullanımını sağlayacak şekilde fotovoltaik modüllerden oluşan panellere reçine esaslı kompozit malzeme ile kapsülleme yapılmıştır. Yapılan tasarım sonucunda elde edilen esnek düzgün yüzeyli ve konkav fotovoltaik panellerin
Kenar bandı Çerçeve Cam
Kapsülleme Solar hücre
Arka kapak Kapsülleme Şerit

UEMK 2019 Proceedings Book
24/25 October 2019 Gaziantep University, TURKEY 800
dış ortam şartlarına bağlı olarak akım, gerilim, güç ve verim olarak elektriksel özelliği araştırılmıştır. YÖNTEM
Fotovoltaik modüllerin mekanik stabilitesini sağlamak ve panelin dış etkilere karşı korumasını sağlamak için modüllerin yüzeyleri uygun bir malzeme ile kaplanmaktadır. Bu çalışmada da 16 modülden oluşan fotovoltaik panelde modüllerin
seri şekilde elektriksel bağlanışı yapılmış ve fotovoltaik modüller reçine esaslı kompozit malzeme ile kapsüllenmiştir. Reçine esaslı kompozit malzeme teknolojisi savunma, otomotiv ve havacılık sektörlerinde son yıllarda artan bir oranla kullanılmaktadır (Marsh, 2003). Reçine esaslı matris malzemesi ile çapraz dokuma fiber kumaşlarının birleştirilmesi sonucu kaplamaya ısıl, mekanik ve elektriksel özellikler açısından büyük bir fayda sağlanır. Bu özellikleri nedeniyle fotovoltaik paneller için bu kapsülleyiciler, uzun ömürlü bir kaplama malzemesi olarak fotovoltaik teknolojisinde alternatif bir kaplama malzemesi olabilecektir. Elde edilen reçine esaslı kapsülleyiciler elastik bir özelliğe sahiptir. Benzer hacimli izotropik malzemelere göre hem daha hafif hem de daha mukavemetlidirler. İnce kesitleri nedeniyle eğilme yükü altında sehim davranışı sergilerler. Böylece esnek olmalarından dolayı montaj edilecek yere göre daha rahat uyum sağlayabilirler. Fotovoltaik Kompozit Panel Üretimi
Üretim vakum infüzyon yöntemiyle sıcaklık kontrollü kompozit üretim tezgâhında gerçekleştirilmiştir (Şekil 2).
Şekil 2. Sıcaklık Kontrollü Kompozit Üretim Tezgahı
Öncelikle tezgah üzerine, fotovoltaik kompozit panelin üretim sonrasında tezgah üzerinden rahatça ayrılabilmesini sağlayan ayırıcı film (release film) serilir (Şekil 3). Ayırıcı film ile tezgâha çift taraflı bant ile yapıştırılır. Ayırıcı film üzerine, birbirleriyle bağlantıları yapılmış olan hücreler güneşe bakacak olan yüzleri üretim tezgahına bakacak şekilde yerleştirilir. Güneş hücrelerinin üzerine dört tabaka 200 gr/m2 cam kumaşlar serilir (Şekil 4). Matris malzemesi olarak epoksi reçine kullanılmıştır.

UEMK 2019 Proceedings Book
24/25 October 2019 Gaziantep University, TURKEY 801
Şekil 3. Ayırıcı Film Üzerine Güneş Hücrelerinin Serilmesi
Şekil 4. Güneş Hücrelerinin Üzerine Cam Fiberlerin Serilmesi
Fotovoltaik kompozit panel üretildikten sonra panelin sarf malzemelerinden ayrılmasını sağlayacak olan soyma kumaşı (peel ply) kumaşların üzerine yerleştirilir. Daha sonra ise soyma kumaşı üzerine reçinenin rahatlıkla akmasını sağlayan infüzyon filesi (mesh) koyulur (Şekil 5).
Şekil 5. Güneş Hücrelerinin Üzerine Cam Fiberlerin Serilmesi

UEMK 2019 Proceedings Book
24/25 October 2019 Gaziantep University, TURKEY 802
Son olarak Şekil 6.a’da görüldüğü gibi çift taralı bant ile temas edecek şekilde vakum naylonu serilir ve sonunda vakum torbasına pompa yardımıyla reçine emdirilir (Şekil 6.b). Reçinenin donması için 24 saat beklenip soyma kumaşı ve ayırma filmi çıkarılarak fotovoltaik kompozit panel üretilmiş olur.
a) b) Şekil 6. Sisteme a)Vakum Naylonunun Yerleştirilmesi, b) Reçine Verilmesi
Fotovoltaik paneli oluşturan 16 adet polikristal 156 mm boyutlarında modüller kalaylı bakır şeritler ile yüksek sıcaklıkta lehimleme işlemi kullanılarak elektriksel olarak bağlanmıştır. Modüllerin birbirine bağlanması sırasında akım kaybını azaltacak şekilde modülleri panellere dönüştürürken enerji aktarım kaybını en aza indirecek şekilde mevcut çalışmalar da dikkate alınarak bağlantı gerçekleştirilmiştir (Söderström vd., 2013). Böylece uygun birleştirme yöntemiyle modüllerden oluşturulan panel cam fiber epoksi kompozit malzeme içerisine yerleştirilerek dış etkilere dayanıklı bir yapı oluşturulmuş ve yüzeye göre esneklik özelliği kazandırılmıştır (Şekil 7).
Şekil 7. Reçine Esaslı Kompozit Malzeme ile Kapsüllenmiş Fotovoltaik Panel
Uygulanan bu yöntem ile reçine esaslı kompozitin malzemenin kullanılması ile farklı sayıdaki modüllerden oluşturulan panele mekanik dayanım kazandırılmıştır. Böylece modüllerin tüm yüzeylerinin uygun bir şekilde kapsüllenmesi nedeniyle fotovoltaik

UEMK 2019 Proceedings Book
24/25 October 2019 Gaziantep University, TURKEY 803
panelin etkisi altında rüzgar, kar, yağmur, nem gibi dış yük kuvvetlerinden korumuş olunacak ve fotovoltaik panelin ömürleri uzayacaktır. Ayrıca, geliştirilen bu kapsülleme yöntemiyle çok sayıdaki modüllerden oluşan panellerin alüminyum bir çerçeveyle ve cam yüzey ile kaplanmasına gerek olmayacaktır. İlave olarak gemi, uçak, otomobil vb. araçların çeşitli eğik yüzeylerine uygun bir şekilde modüller kompozit ile kapsüllenerek, üretilen panellerin esnek ve kolay bir şekilde bu tip yüzeylere montajı sağlanabilecektir. Böylece ağırlık, montaj sistemi ve maliyetteki azalmalar ile mevcut çerçeveli kullanımlara göre daha rekabetçi bir çözüm oluşturulmuştur. Tablo 1. Fotovoltaik Modülün Teknik Özellikleri
Standart ışıma 1000 W/m2 Standart sıcaklık 25 °C Maksimum güç (Pmax) 4.5 W Maksimum güç akımı (Imp) 8.8 A Maksimum güç gerilimi (Vmp)
0.54 V
Serilerdeki modül sayısı 16
Şekil 8. Eğrisel Yüzeye Sahip (Konkav) Fotovoltaik Panel
Panelin oluşturulmasında kullanılan modüllerin teknik özellikleri Tablo 1 de verilmiştir. Reçine esaslı kompozit malzeme ile kapsüllenen fotovoltaik panel için güneş ışınımına bağlı olarak akım, gerilim, güç ve verim değerleri incelenmiştir. Bu amaçla panelin akım ve gerilim özelliklerini belirlenmek için Elazığ iklim şartlarında dış atmosferik koşullarda deneysel çalışmalar yapılmıştır. Panel üzerindeki deneyler 2019 Eylül ayı içerisinde gerçekleştirilmiştir. Panel Elazığ enlem açısı 38o’ye ayarlanmıştır. Esnek özelliğinden yararlanılarak panel, düzlem ve eğrisel yüzey (konkav) formatında kullanılmıştır (Şekil 8). Deneylerde güneş ışınım, dış hava sıcaklıkları, akım ve gerilim değerleri ölçülmüştür. Her iki panel için aynı
ışınım şiddeti dikkate alınarak ölçümler yapılmıştır. Fotovoltaik panelde yapılan deneylerde güneş ışınımı piranometre ve sıcaklık değerleri dijital termometre ile

UEMK 2019 Proceedings Book
24/25 October 2019 Gaziantep University, TURKEY 804
ölçülmüştür. Ayrıca fotovoltaik panelin akım-gerilim değerlerini tespit etmek için multimetre kullanılmıştır (Şekil 8). Fotovoltaik panelin üretebileceği maksimum güç; Pmax = Imax.Vmax (1) şeklinde ifade edilir (Yıldız and Dandıl, 2019). Burada Imax akım, Vmax ise maksimum güç için gerekli gerilimi ifade eder. Fotovoltaik panelin verimi ise aşağıdaki eşitlik ile tespit edilebilir. nc= (Imax.Vmax)/ (G.Ac) (2) G ölçülen güneş ışınım şiddeti (W/m2) ve AC güneş modüllerinin alanıdır (m2). BULGULAR
16 adet modülden oluşan fotovoltaik panelin reçine esaslı kompozit malzeme ile kaplanmasından sonra elde edilen esnek düz yüzeyli ve konkav yüzeyli paneldeki akım ve gerilim değerleri belirlenmiştir. Yapılan çalışmalardan 25 Eylül 2019 tarihinde ölçülen ışınım ve sıcaklık değerleri Şekil 9’ da verilmiştir. Şekilde çevre sıcaklılarının ve ışınımın öğlen saatlerinde maksimum değer aldığı görülmektedir.
Şekil 9. Dış Atmosfer Şartlarında Ölçülen Sıcaklık ve Işınım Değerleri
Aynı ışınım şartları altında düzlem ve konkav yüzeyli fotovoltaik panelin akım ve gerilim değerleri ölçülmüştür. Her iki yüzey için elde edilen değerlerden düz yüzeyli fotovoltaik panele göre konkav yüzey için yüzde mertebesinde daha fazla artış elde edilmiştir. Bu nedenle grafikte sadece konkav yüzey için ölçülen sonuçlar verilmiştir.
0
5
10
15
20
25
30
35
0
100
200
300
400
500
600
700
800
900
1000
08
:30
09:0
0
09:3
0
10:0
0
10:3
0
11:0
0
11:3
0
12:0
0
12:3
0
13:0
0
13:3
0
14:0
0
14
:30
15
:00
15:3
0
16:0
0
16:3
0
17:0
0
17:3
0
Sıc
ak
lık
(oC
)
Işın
ım (
W/m
2 )
Gün içi zaman (Saat)
Sıcaklık
Işınım
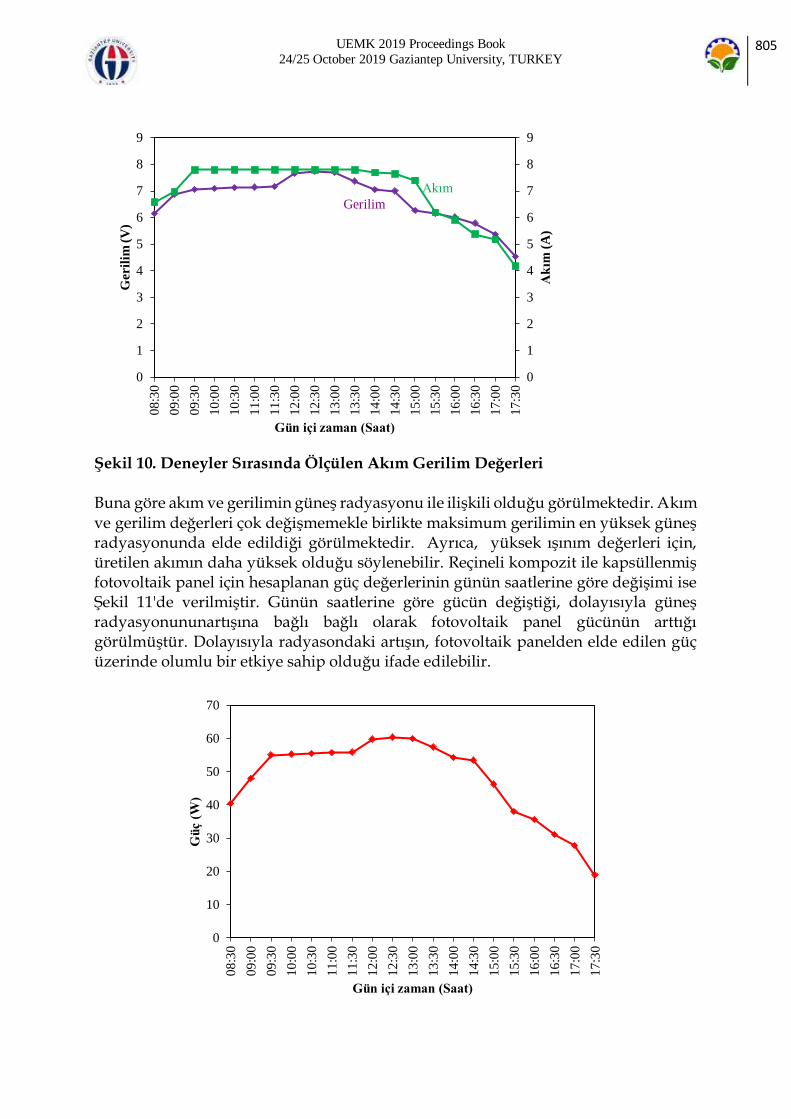
UEMK 2019 Proceedings Book
24/25 October 2019 Gaziantep University, TURKEY 805
Şekil 10. Deneyler Sırasında Ölçülen Akım Gerilim Değerleri
Buna göre akım ve gerilimin güneş radyasyonu ile ilişkili olduğu görülmektedir. Akım ve gerilim değerleri çok değişmemekle birlikte maksimum gerilimin en yüksek güneş radyasyonunda elde edildiği görülmektedir. Ayrıca, yüksek ışınım değerleri için, üretilen akımın daha yüksek olduğu söylenebilir. Reçineli kompozit ile kapsüllenmiş fotovoltaik panel için hesaplanan güç değerlerinin günün saatlerine göre değişimi ise Şekil 11'de verilmiştir. Günün saatlerine göre gücün değiştiği, dolayısıyla güneş radyasyonununartışına bağlı bağlı olarak fotovoltaik panel gücünün arttığı görülmüştür. Dolayısıyla radyasondaki artışın, fotovoltaik panelden elde edilen güç üzerinde olumlu bir etkiye sahip olduğu ifade edilebilir.
0
1
2
3
4
5
6
7
8
9
0
1
2
3
4
5
6
7
8
908:3
0
09
:00
09:3
0
10
:00
10:3
0
11:0
0
11:3
0
12:0
0
12:3
0
13:0
0
13:3
0
14:0
0
14:3
0
15:0
0
15
:30
16:0
0
16
:30
17:0
0
17:3
0
Ak
ım (
A)
Geril
im (
V)
Gün içi zaman (Saat)
Gerilim
Akım
0
10
20
30
40
50
60
70
08
:30
09
:00
09
:30
10
:00
10
:30
11
:00
11
:30
12
:00
12
:30
13
:00
13
:30
14
:00
14
:30
15
:00
15
:30
16
:00
16
:30
17
:00
17
:30
Gü
ç (
W)
Gün içi zaman (Saat)

UEMK 2019 Proceedings Book
24/25 October 2019 Gaziantep University, TURKEY 806
Şekil 11. Fotovoltaik Panelden Elde Edilen Güç
Şekil 12’ de fotovoltaik panelin günün saatlerine ve dolayısıyla güneş ışınımına bağlı olarak verim değişimini gösterilmiştir. Buna göre fotovoltaik panelin veriminin yüksek güneş ışınımında arttığı ve düşük radyasonda düştüğü görülmektedir.
Şekil 12. Fotovoltaik Panel Verimi
SONUÇ
Bu çalışmada, fotovoltaik modüller reçine esaslı kompozit malzeme ile kapsüllenmiş ve fotovoltaik panellerin oluşturulması için yeni bir yaklaşım getirilmiştir. Böylece geleneksel olarak oluşturulan tasarıma göre modülün kapsüllenmesi ile modülün alt ve üst bölgelerindeki tabakalar kullanılmamakta ve daha az malzeme ve işçilik ile gerekli tasarım sağlanmaktadır. Bu kapsülleme yöntemiyle üst bölgede cam kullanılmamakta ve alüminyum çerçeveye ihtiyaç duyulmamaktadır. Kapsülleme bir bütünlük içinde bir blok halinde yapıldığı için panel içerisine yağmur ve nem gibi problem oluşturacak etkenlerden de korunmuş olacaktır. Böylece tasarım ile fotovoltaik sistemlerin uzun ömürlü verimli ve ekonomik olarak çalışması sağlanacaktır. Ayrıca, bu yöntem ile panelin kullanacağı yüzeye göre modüller kapsülleneceği için eğri yüzeyler dahil olmak üzere her yüzeye uygun olarak kapsülleme yapılabilecektir. Ayrıca, kompozit malzemenin elastikiyeti nedeniyle panel levhası esnek yapıda olacak ve montaj yüzeyine uygun olarak belli bir oranda levhanın eğilmesine imkan olabilecektir.
0%
5%
10%
15%
20%
25%
30%
08
:30
09
:00
09
:30
10
:00
10
:30
11
:00
11
:30
12
:00
12
:30
13
:00
13
:30
14
:00
14
:30
15
:00
15
:30
16
:00
16
:30
17
:00
17
:30
Verim
Gün içi zaman (Saat)

UEMK 2019 Proceedings Book
24/25 October 2019 Gaziantep University, TURKEY 807
Ayrıca yapılan çalışmada, reçine esaslı kompozit malzeme ile kapsüllenmiş modüllerden düzgün yüzeyli ve konkav yüzeyli fotovoltaik panel oluşturulduktan sonra akım, gerilim, güç ve verim değerleri incelenmiştir. Günün saatlerine dolayısıyla güneş radyasununa bağlı olarak fotovoltaik panelden elde edilen elektriksel özelliklerde değişimler olmuştur. Güneş radyasyonundaki artış ile fotovoltaik panelde elde edilen güçte ve verimde artış olduğu görülmüştür. Konkav yüzeyli panelde elde edilen elektriksel özelliklerin düzgün yüzeyli panele göre çok az bir iyileşme olmakla birlikte bu değerlerin genel olarak birebirine yakın olduğu gözlenmiştir. Böylece fotovoltaik modüllerin çalışmada belirtildiği reçine esaslı bir kompozit malzeme ile kapsüllenmesi ile oluşturulan panellerin mevcut panellere göre daha kullanışlı, ekonomik, esnek yapılı ve sağlam yapılı olarak elektrik enerjisi üretiminde kullanılması mümkün olabilecektir. TEŞEKKÜR
Yazarlar solar hücrelerin temini ve birleştirmeleri konusunda yardımlarından dolayı Emre BAY, Ali Ekber AKYOL ve Mehmet EMLEK’e teşekkür eder. KAYNAKLAR
Chaturvedi, P., Hoex B., & Walsh, T.M. (2013). Broken metal fingers in silicon wafer solar cells and PV modules. Solar Energy Materials & Solar Cells, 108, 78-81.
Czanderna, A.W., & Pern, F.J. (1996). Encapsulation of PV modules using ethylene vinyl acetate copolymer as a pottant: A critical review. Solar Energy Materials and Solar Cells, 43(2), 101-181.
Dhere, N.G., & Raravikar, N.R. (2001). Adhesional shear strength and surface analysis of a PV module deployed in harsh coastal climate. Solar Energy Materials and Solar Cells, 67(1-4), 363-367. Gxasheka, A.R., Van Dyk, E.E., & Meyer, E.L. (2005). Evaluation of performance parameters of PV modules deployed outdoors. Renewable Energy, 30(4), 611-620. Han, X., Wang, Y., Zhu, L., Xiang, H., & Zhang, H. (2012). Mechanism study of the electrical performance change of silicon concentrator solar cells immersed in de-ionized water. Energy Conversion and Management, 53(1), 1-10
Kempe, M. D. (2006). Modeling of rates of moisture ingress into photovoltaic modules. Solar Energy Materials and Solar Cells, 90(16), 2720-2738. Kempe, M.D., Jorgensen, G.J., Terwilliger, G.J., McMahon, T.J., Kennedy, C.E., & Borek, T.T. (2007). Acetic acid production and glass transition concerns with ethylene-vinyl acetate used in photovoltaic devices. Solar Energy Materials & Solar Cells, 91, 315–329 Kopecek, R. & Libal, J. (2018). Towards large-scale deployment of bifacial photovoltaics. Nature Energy, l3, 443-446. Marsh, G., (2003). Next step for automotive materials, Materials Today, 6(4), 36-43.

UEMK 2019 Proceedings Book
24/25 October 2019 Gaziantep University, TURKEY 808
Munoz, M.A., Alonso-García, M.C., Vela, N., & Chenlo, F. (2011). Early degradation of silicon PV modules and guaranty conditions. Solar Energy, 85(9), 2264-2274.
Mickiewicz, R., Doble, B., Li, D., Christian, T., Lloyd, J., Stoke,s A., Voelker, C., Winte,r M., Ketola, B., Norris, A., & Shephard, N. (2011). Effect of encapsulation modulus on the response of PV modules to mechanical stress. Procedings of 26th European Photovoltaic Solar Energy Conference and Exhibition. Hamburg. Ndiaye, A., Charki, A., Kobi, A., Kébé, C.M.F., Ndiaye, P.A., & Sambou, V. (2013). Degradations of silicon photovoltaic modules: A literature review. Solar Energy, 96,
140-151. Ottersböck, B., Oreski, G., & Pinter, G. (2017). Comparison of different microclimate effects on the aging behavior of encapsulation materials used in photovoltaic modules. Polymer Degradation and Stability, 138, 182-191. Söderström, T., Papet, P., & Ufheil, J. (2013). Smart wire connection technology. In the 28th European Photovoltaic Solar Energy Conference.
Wohlgemuth, J. & Cunningham, D. (2008). Using accelerated tests and field data to predict module reliability and life time, Proceedings of 23rd European Photovoltaic Solar Energy Conference and Exhibition.Valencia.
Van Dyk, E. E., Chamel, J. B., & Gxasheka, A. R. (2005). Investigation of delamination in an edge-defined film-fed growth photovoltaic module. Solar Energy Materials and Solar Cells, 88(4), 403-411.
Yıldız, A., Dandıl, B., Çakmak, G. (2019). The effect on the efficiency of the photovoltaic panel used for the charging of mobile phones of the solar radiation in Elazig, Turkey. International Journal of Renewable Energy and Technology, 10(4), 301-314. Yıldız, A. & Dandıl, B. (2019). Investigation of the effect of panel temperature on effıciency of organic photovoltaic panel, OEMT’2019:4th International Organic Electronic Material Technology Conference, Dubai.
UEMK 2019 Proceedings Book
24/25 October 2019 Gaziantep University, TURKEY 809
ELEMENT ENRICHMENTS OF KARABOĞAZ FORMATION (ADIYAMAN) ORGANIC-RICH ROCKS
Veysi KOÇ Batman University, Graduate School of Natural and Applied Sciences, Geological Engineering [email protected] Derya KOCA Batman University, Faculty of Engineering-Architecture, Petroleum and Natural Gas Engineering [email protected]
ABSTRACT: Organic-rich rocks that are deposited in anoxic environment accumulate some of the minerals and elements that are of economic importance. In this study, the distributions and enrichments of organic matter, major and trace elements of organic-rich rocks Adıyaman region were investigated. 13 rock samples were collected from Karaboğaz Formation and pyrolysis analysis, ICP analysis and XRD analysis were performed on these rock samples. As a result of pyrolysis analysis, samples have a
carbonated lithology and are ranging from 0,76 to 7,09 % Corg, with a 2,72 % average. As a result of ICP analyzes, organic-rich limestone samples of Karabogaz Formation are enriched with Si, Ca, Na, P, Cr, Ni, Sc, Ba, Co, Rb, Sr, U, V, W, Mo, Cu, Pb, Zn, As, Cd, Sb, Hg and Se elements. Element enrichments of samples studied are compared with the element enrichments of Namibia (Africa) Coastal Shelf Sediments, Peruvian Shelf Sediments, Mediterranean and Black Sea Sapropels, Cenomanian/Turonian Gubbio Anoxic Sediments and Cenomanian/Turonian Demerara Anoxic Sediment. And consequently, Cr, P, Fe, Co, Sb, Zn, V, Cu, Ba, Pb and Zr were more enriched than other depositional environment. These element enrichments in Karaboğaz Formation samples is thought to be related to the redox conditions of the depositional environment, the Corg amount of rocks, and the various factors associated with the element relationship with Corg. Key words: Major and trace element enrichments, Karaboğaz Formation, organic matter, redox conditions, oil source rock

UEMK 2019 Proceedings Book
24/25 October 2019 Gaziantep University, TURKEY 810
KARABOĞAZ FORMASYONU (ADIYAMAN) ORGANİKÇE ZENGİN KAYAÇLARDA ELEMENT ZENGİNLEŞMELERİ
ÖZET: Anoksik ortam koşullarında depolanmış organikçe zengin sedimanter kayaçlar, ekonomik yönden önemli olan bazı mineral ve elementleri bünyesinde biriktirirler. Bu çalışmada Adıyaman bölgesi Karaboğaz Formasyonun organik maddece zengin kayaçlarının, organik madde içeriği, majör element ve iz element dağılımları ve zenginleşmeleri incelenmiştir. Arazi çalışması sırasında Karaboğaz Formasyonundan 13 adet kayaç numunesi alınmıştır. Bu kayaç numuneleri üzerinde Piroliz analizi, ICP analizi ve XRD analizi yapılmıştır. Yapılan bu analizler sonucunda Karaboğaz Formasyonu karbonatlı bir litolojiye sahip olduğu, % 0,76-7,09 arasında değişen ve ortalaması % 2,72 olan Corg olduğu belirlenmiştir. Karaboğaz Formasyonundan alınan organik maddece zengin kireçtaşı örnekleri üzerinde yapılan ICP analizi sonucunda, Si, Ca, Na, P, Cr, Ni, Sc, Ba, Co, Rb, Sr, U, V, W, Mo, Cu, Pb, Zn, As, Cd, Sb, Hg ve Se elementlerinin zenginleştikleri tespit edilmiştir. Zenginleşen ana ve iz elementler, anoksik-öksinik koşullarda depolanmış olan Namibya (Afrika) Kıyısal Şelfi Sedimanları, Peru Şelfi Sedimanları, Akdeniz ve Karadeniz Sapropelleri, Senomaniyen/Turoniyen Gubbio Anoksik Sedimanları ve Senomaniyen/Turoniyen Demerara Yükselimi Anoksik Sedimanlarına ait element zenginleşmeleri ile karşılaştırılmıştır. Bunun sonucunda Cr, P, Fe, Co, Sb, Zn, V, Cu, Ba, Pb ve Zr elementlerinin diğer ortamlara göre daha fazla zenginleşme gösterdikleri tespit edilmiştir. Karaboğaz Formasyonundaki bu element zenginleşmelerinin depolanma ortamının redoks koşullarına, kayaçların Corg miktarına, Corg ile element ilişkisine bağlı çeşitli faktörlerle ilişkili olduğu düşünülmektedir. Anahtar sözcükler: Ana ve iz element zenginleşmeleri, Karaboğaz Formasyonu, organik madde, redoks koşullar, petrol kaynak kaya
UEMK 2019 Proceedings Book
24/25 October 2019 Gaziantep University, TURKEY 811
AN APPLICATION AREA OF 4-D MATRIX
Celile YÜZBAŞI Gaziantep Üniversitesi [email protected] Doç.Dr. Necati Olgun Gaziantep Üniversitesi [email protected] ABSTRACT: In this study we will focus on 4-D matrices and their application. The operation of the tomography device which has an important place in the health sector as the application area of 4-D matrices was examined. Our aim is to be able to interpret the images of 4-D matrices taken at different time intervals on tomography, which is the field of application, with the help of 4-D matrices. For this purpose, we examined tomographies taken at different time intervals. Key words: matrix, tomography, matlab
4-D MATRİSLERİN BİR UYGULAMA ALANI
ÖZET: Biz bu çalışmada 4-D matrisler ve uygulama alanı üzerinde duracağız. 4-D matrislerin uygulama alanı olarak sağlık sektöründe önemli bir yeri bulunan tomografi cihazının işleyişi incelendi. Amacımız 4-D matrislerin uygulama alanı olan tomografi üzerindeki farklı zaman aralıklarında çekilmiş olan görüntülerini,4-D matrisler yardımıyla elde ettiğimiz sayısal değerler üzerinden yorum yapabilmektir. Bunun için de farklı zaman aralıklarında çekilmiş olan tomografileri inceledik
Anahtar sözcükler: matris, tomografi, matlab GİRİŞ
Matris, her alanda kullandığımız uygulama alanı çok geniş olan matematiksel bir kavramdır. Matematikte matris dikdörtgen bir sayılar tablosu, çarpılabilir soyut miktarlar tablosudur. Dizeyler daha çok doğrusal denklemleri tanımlamak, doğrusal dönüşümlerde çarpanların takibi ve iki parametreye bağlı verilerin kaydedilmesi amacıyla kullanılırlar. Dizeylerin toplanabilir, çıkartılabilir, çarpılabilir ve bölünebilir olmaları, doğrusal cebir ve dizey kuramının temel kavramı olmalarını sağlamıştır. Doğrusal denklemler sisteminin ilk matris kullanılarak açıklanıp çözülmesi özellikle kare matrislerle determinant kullanımı dahil M.Ö 300 – M.S 200 yılları arasında
yazılmış olan JİU ZHANG , SUAN SHU ( Matematik Sanatında Dokuz Bölüm ) adlı eserde bulunduğu anlaşılmıştır. Bundan sonra Matris kavramı 2000 yıl kadar sonra 1693’de ‘Seki Kowa’ adlı Japon matematikçi ve Batı Avrupa da ilk defa 1693’de Alman

UEMK 2019 Proceedings Book
24/25 October 2019 Gaziantep University, TURKEY 812
matematikçisi Leibniz tarafından ortaya atılmış ve ilk determinant kullanılarak pratik çözüm olarak Cramer ’in kuralı 1750’de Gabriel Cramer tarafından gösterilmiştir. Matris terimi isim olarak ilk defa J.J.Syvester adlı İngiliz matematikçisi tarafından kullanılmıştır.[Leon,, Kaplan ] Günlük hayattaki kullanım örnekleri: * 20 katlı ve her katında 5 daire bulunan bir apartmanda oturanların isimleri , 20x5 lik bir matris ile gösterilebilir. * Paralel ve meridyenler bir matris halinde gösterilip, her ülkenin konumu matrisle ifade edilebilir. Bu örnekler genişletilebilir. Örneğin : Bir sinemada, birinci sırada oturan insanların yerleri A ile gösterilir. Bunların baştan kaçıncı sırada oturduklarını ifade etmek için A’nın yanına 1,2,… sayıları getirilir. Bu koordinat olarak bilinir ama bunu a11 olarak gösterdiğimizde(ya da A1), 1. sıra 1. sütunda oturtan kişi olarak anlarız. Bütün salon bu şekilde bir matris haline getirilebilir. Bir sınıf, otopark, yani yer bulma kavramının gerekli olduğu durumlarda kullanılır. Tanım: ,*),( F bir cisim olsun. 4 - boyutlu 2*1*4*4 tipindeki bir matris F cismi
üzerinde aşağıdaki gibi tanımlanır:
4,3,2,1;4,3,2,1;4,3,2,1:4,3,2,1);(|)(2*1*4*4 lkjiaaM ijklijkl
olsun. Bu matrisin görüntüsü aşağıdaki gibi olacaktır.
4412431242124112
3412331232123112'
2412231222122112
1412131212121112
4411431142114111
3411331132113111
2411231122112111
1411131112111111
,
aaaa
aaaa
aaaa
aaaa
aaaa
aaaa
aaaa
aaaa
Şekil 1. UYGULAMA ALANI
Bu bölümde 4-D matrislerinin uygulama alanı üzerinde duracağız. Sağlık sektöründe önemli bir yer taşıyan tomografinin 4-D matrisler yardımıyla önceki ve sonraki alınan verilerini karşılaştırarak aynı anda çözüm almayı hedefledik. Öncesinde tomografinin işleyişine bir bakalım : Bilgisayarlı Tomografi
Bilgisayarlı tomografinin temel problemi, kesit boyunca geçen x-ışınlarından toplanan verileri kullanarak insan vücudunun bir kesitinin görüntüsünü resmetmektir. x-ışınları taramalarının analizi ile bir insan vücudunu kesitsel resmetmek görüntünün

UEMK 2019 Proceedings Book
24/25 October 2019 Gaziantep University, TURKEY 813
sayısal gösterimi için tutarsız lineer sisteme yol açar. x-ışınlarından toplanan veriler bir bilgisayar ile analiz edilir ve bu kesit bir video monitörde gösterilir.
Şekil 2. X-Işın Tomografisine Hazırlanan Bir Hasta (Anton ve Rorres,1994)
Şekil 3. Bir Hasta Kafatasının Bilgisayar Destekli Tomografi Görüntüsü (Anton ve Rorres,1994) Şekil 2. deki görüntü oluşumunda çıkan data işlenip, matris formuna dönüştürülüyor. Görüntüde oluşan değişimler Matlab programıyla inceleniyor. Matlab programı tomografi görüntüsündeki sorunlu bölgenin matris formatını farklı zaman aralıklarla kontrol etmemizi sağlayıp, değişim sonucu hakkında yorum yapmamızı sağlıyor. Matlab programı kullanılarak matrislerin arasındaki farkları, boyut olarak artmış, azalmış veya değişmemiş kararını veren kod;

UEMK 2019 Proceedings Book
24/25 October 2019 Gaziantep University, TURKEY 814
clear; clc; m=input('1.Matris Sütun Sayisi= ') n=input('1.Matris Satir Sayisi= ') for i=1:m; for j=1:n; a(i,j)=input('1.Matris Elemanlari= '); end end a=reshape(a,m,n) for l=1:m; r(l)=input('1.Matris Esitligi= '); end for v=1:m; for c=1:n; q(v,c)=input('2.Matris Elemanlari= '); end end q=reshape(q,v,c) for p=1:m; z(p)=input('2.Matris Esitligi= '); end b=r'; h=z'; o=[a b]; u=[q h]; k=rref(o); d=rref(u); for t=1:n; f(1,t)= k(t,end); f2(1,t)=d(t,end); end f f2 A1='Artmis %'; A2='Azalmis %'; A3='Degismemis %'; x=abs( ((f(1,1)-f2(1,1))/f(1,1))*100) y=abs( ((f(1,2)-f2(1,2))/f(1,2))*100) z=abs( ((f(1,3)-f2(1,3))/f(1,3))*100)

UEMK 2019 Proceedings Book
24/25 October 2019 Gaziantep University, TURKEY 815
if(x<3 && y<3 && z<3) disp(A3) else for t=1:n; if ( f(1,t) == f2(1,t) ) disp(A3) end if ( f(1,t) > f2(1,t) ) disp(A2) end if ( f(1,t) < f2(1,t) ) disp(A1) end end end ÖRNEK 1)

UEMK 2019 Proceedings Book
24/25 October 2019 Gaziantep University, TURKEY 816
Şekil 4. Hastadan alınan ilk data;
3294.144.139.57
3294.145.139.30
3297.775.183
Hastadan alınan sonraki data;
329.1235.128.56
329.125.128.20
3295.675.122
Alınan bu iki matrisleri Matlab koduna verdiğimiz zaman sonuç artmış olarak çıkıyor. ÖRNEK 2)

UEMK 2019 Proceedings Book
24/25 October 2019 Gaziantep University, TURKEY 817
Şekil 5. Hastadan alınan ilk data;
324.1136.225.13
325.2375.433.13
3256.1013.217
Hastadan alınan sonraki data;
3245.436.550.16
3265.1075.74.16
325.73.239
Alınan bu iki matrisleri Matlab koduna verdiğimiz zaman sonuç azalmış olarak çıkıyor. ÖRNEK 3)
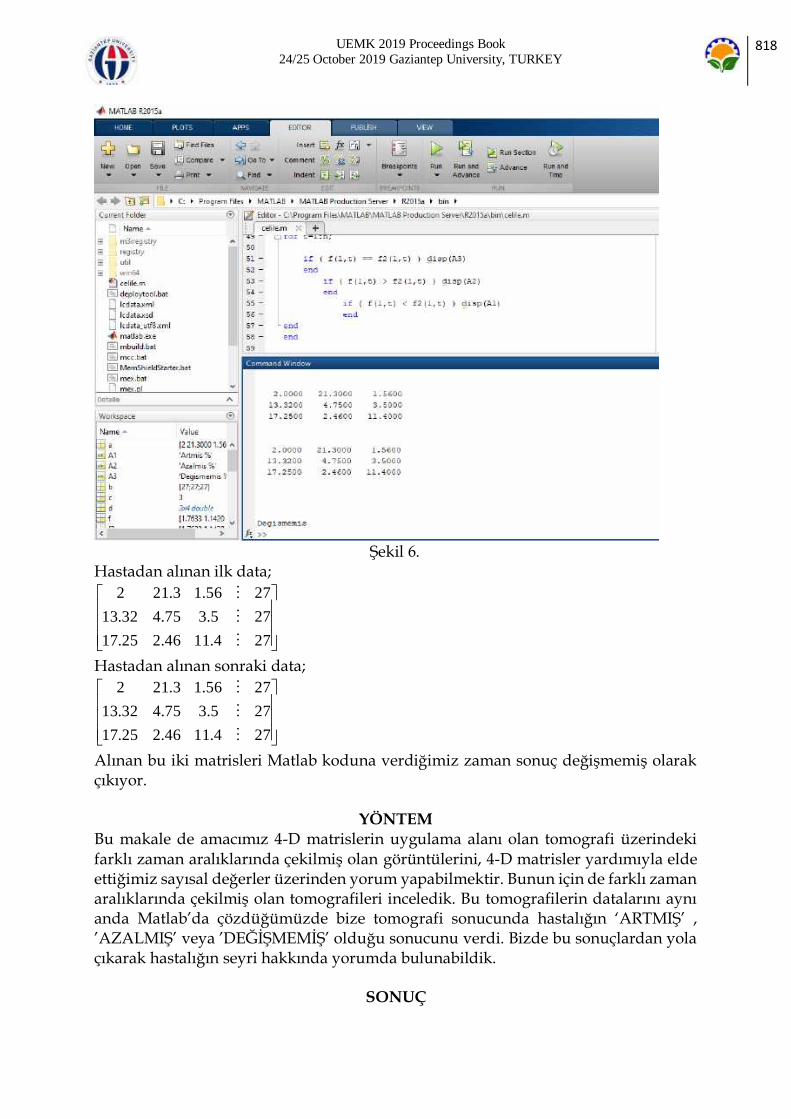
UEMK 2019 Proceedings Book
24/25 October 2019 Gaziantep University, TURKEY 818
Şekil 6. Hastadan alınan ilk data;
274.1146.225.17
275.375.432.13
2756.13.212
Hastadan alınan sonraki data;
274.1146.225.17
275.375.432.13
2756.13.212
Alınan bu iki matrisleri Matlab koduna verdiğimiz zaman sonuç değişmemiş olarak çıkıyor.
YÖNTEM
Bu makale de amacımız 4-D matrislerin uygulama alanı olan tomografi üzerindeki farklı zaman aralıklarında çekilmiş olan görüntülerini, 4-D matrisler yardımıyla elde ettiğimiz sayısal değerler üzerinden yorum yapabilmektir. Bunun için de farklı zaman aralıklarında çekilmiş olan tomografileri inceledik. Bu tomografilerin datalarını aynı anda Matlab’da çözdüğümüzde bize tomografi sonucunda hastalığın ‘ARTMIŞ’ , ’AZALMIŞ’ veya ’DEĞİŞMEMİŞ’ olduğu sonucunu verdi. Bizde bu sonuçlardan yola çıkarak hastalığın seyri hakkında yorumda bulunabildik.
SONUÇ

UEMK 2019 Proceedings Book
24/25 October 2019 Gaziantep University, TURKEY 819
Makalemizde çalıştığımız konuda sonuç olarak aldığımız yanıt : ‘ARTMIŞ’ , ‘AZALMIŞ’ veya ‘DEĞİŞMEMİŞ’ olup farklı zamanlarda çekilen tomografinin aynı anda çözümlenip yorum yapılabilir hale getirilmiş olmasıdır.
KAYNAKLAR
Anton H, Rorres C. Elementary Linear Algebra, Binder Ready Version: Applications Version. John Wiley & Sons; 1994 Nov 4. Kaplan, T. (2011). Lineer Denklem Sistemleri ve Uygulama Alanları . Yüksek Lisans Tezi , Atatürk Üniversitesi
Leon, Steven J., Ion Bica, and Tiina Hohn. Linear algebra with applications. New York: Macmillan, 1980. Works, Math. "Using Matlab." The Math Works Inc (1996).

UEMK 2019 Proceedings Book
24/25 October 2019 Gaziantep University, TURKEY 820
NEUTROSOPHIC DESICION TREE
Ahmed HATIP Gaziantep University [email protected] Necati OLGUN Gaziantep University [email protected]
ABSTRACT: In this research, we present neutrosophic decision-making, which is an extension of the classical decision-making process by expanding the data to cover the non-specific cases ignored by the classical logic which, in fact, supports the decision-making problem. The lack of information besides its inaccuracy is an important
constraint that affects the effectiveness of the decision-making process, and we will rely on the decision tree model, which is one of the most powerful mathematical methods used to analyze many decision-making problems where we extand it according to the neutrosophic logic by adding some indeterminate data (in the absence of probability) or by substituting the classical probabilities with the neutrosophic probabilities (in case of probability). We call this extended model the neutrosophic decision tree, which results in reaching the best decision among the available alternatives because it is based on data that is more general and accurate than the classical model. Key words: Decision-making process, Neutrosophic logic, Neutrosophic Decision-making, Neutrosophic Expected Monetary Value (NEMV). INTRODUCTION
In our life, there is three kinds of logic. The first is classical logic which is gives the form "true or false, 0 or 1" to the values. The second is fuzzy logic was first advanced by Dr. Lotfi Zadeh in 1960s. It recognize more than true and false values, which are considered simple. With fuzzy logic, propositions can be represented with degrees of truth and falseness. And the third is neutrosophic logics which is an extension fuzzy logic in which indeterminacy is included I. Since the world is full of indeterminacy, the Neutrosophic found their place into contemporary research. Neutrosophic Science means development and applications of Neutrosophic Logic / Set / Measure / Integral / Probability etc. and their applications in any field. It is possible to define the Neutrosophic Measure and consequently the Neutrosophic Integral and Neutrosophic Probability in many ways, because there are various types of indeterminacies, depending on the problem we need to solve. Indeterminacy is different from randomness. Indeterminacy can be caused by physical space materials and type of construction, by items involved in the space, or by other factors. Florentin Smarandanche introduced the notion of neutrosophy as a new branch of philosophy in 1980. After he introduced the concept of neutrosophic logic and

UEMK 2019 Proceedings Book
24/25 October 2019 Gaziantep University, TURKEY 821
neutrosophic set where each proposition in neutrosophic logic is approximated to have the percentage of truth in a subset T, the percentage of indeterminacy in subset I and the percentage of falsity in a subset F where T, I, F are subset of [-,0,1,+] so that
this neutrosophic logic is called an extension of fuzzy logic especially to intuitionistic fuzzy logic. For more explanation, we can give these simple examples: First Example of Indeterminacy: If there are two candidates A and B for presidency, and the probability that A wins is 0.46, it does not mean that the probability that B wins is 0.54 , since there may be blank votes (from the voters not choosing any candidate) or black votes (from the voters that reject both candidates). For example, the probability that B wins could be 0.45 , while the difference 1-0.46-0.45=0.09 would be the probability of blank and black votes together. Therefore we have a neutrosophic probability: NP(A)=(0.46, 0.09, 0.045). Second Example of Indeterminacy: If a meteorology center reports that the chance of rain tomorrow is 60%, it does not mean that the chance of not raining is 40%, since there might be hidden parameters (weather factors) that the meteorology center is not aware of. There might be an unclear weather, for example, cloudy and humid day, that some people can interpret as rainy day and others as non-rainy day. The ambiguity arouses indeterminacy. Third Example of Indeterminacy: Probability in a soccer game. Classical probability is incomplete, because it computes for a team the chance of winning, or the chance of not winning, nut not all three chances as in neutrosophic probability: winning, having tie game, or losing. Fourth Example of Indeterminacy: An urn with two types of votes: A-ballots and B-ballots, but some votes are deteriorated, and we can’t determine if it’s written A or B. Therefore, we have indeterminate votes. In many practical applications, we may not even know the exact number of indeterminate votes, of A-ballots, or of B-ballots. Therefore, the indeterminacy is even bigger In fact neutrosophic sets is the generalization of classical sets, neutrosophic groups, neutrosophic ring, neutrosophic fields, neutrosophic vector spaces … etc. Using the idea of neutrosophic theory, Vasantha Kanadasamy and Florentin Samarandanche studied neutrosophic algebraic structures in by inserting an indeterminate element I in the algebraic structure and then combine (I) with each element of the structure with respect to corresponding binary operation. The indeterminate element I is such that if * is ordinary multiplication I * I = I 2= I, I * I … * I = In= I and I-1 the inverse of I is not defined and hence does not exist. Moreover, if * is ordinary addition, then I * I … * I =nI for nϵI [1]. They call it neutrosophic element
and the generated algebraic structure. Is then termed as neutrosophic algebraic structure. In 1995, Florentin Smarandache introduced the "neutrosophic set theory" to handle the indeterminate and inconsistent information that exist commonly in real situations. Neutrosophic logic has wide applications in science, engineering, politics, economics, etc. Therefore, neutrosophic structures are very important and a broad area of study.

UEMK 2019 Proceedings Book
24/25 October 2019 Gaziantep University, TURKEY 822
By doing this, we move from the classical form that gives a determinant value of benefits to the neutrosophic form that doesn’t do that, but gives a range of expected values of benefits. NEUTROSOPHIC DESCION TREE
We know from the definition of the Classical Decision Tree that it is a graphic in the form of a tree gives options and is used in choosing options in the case of one scale. Its root starts from the left and its branches spreads into the right showing the options and the possibilities of the natural cases (events). It is considered to be a suitable method to make a decision if one is not sure, and it is one of the strong mathematical methods that is used analyzing many problems. The Neutrosophic Decisions Tree is the Classical Decision Tree with adding some indetermination to the data or by exchanging the classical probabilities with neutrosophical probabilities. Building the neutrosophic tree of decisions without including the probabilities is considered to be a suitable option when the decision makers don’t have enough information that can make them estimate the probability of the events that built up the tree of decisions. It is also suitable at analyzing the best or the worst options away from probabilities. This theory agrees with the concept of the classical tree of decision. However, what the neutrosophic logic adds to the tree of decision without probabilities is that the expected benefit that matches each option, which is usually evaluated by the decision makers according to their expertise or by related skills, will be evaluated more accurately and generally with less possible mistakes. From another side, we may see that the expected values of the benefits whether good or bad are agreed on by some experts but others disagree. Therefore, the best solution to face this problem that absolutely affects the quality of the taken decision is to take the expected benefits with adding and reducing a value range between (0) and another determinate value, for example (a). (0) which represents the minimum value in this range means that there is no disagreement on the expected values among the experts or with the decision makers. (a) Which represents the maximum value in this range means that there is a disagreement among the experts or between them and the decision makers about the expected values of benefits and (a) is the highest estimated value. Therefore, we will present the expected value of benefits with adding and reducing the range [0,a] not forgetting that all the various opinions about the expected values will be contained in the [0,a] range. So that, the expected value of benefits will become
a range of values containing all the opinions. For example, we can consider three options d1, d2 and d3 by the best and the worst expectations as it is clarified in the following table: Table1. The worst expectations
High turnout
Low turnout

UEMK 2019 Proceedings Book
24/25 October 2019 Gaziantep University, TURKEY 823
A, B, C, D, E, F : Represents the determinate part of the expected values. i1 , i2 , i3 , i4 , i5 ,i6 : Represents the indeterminate part of the expected part.
Therefore, analyzing the tree of neutrosophic decisions from the tree of classical decisions when studying the Optimistic and Pessimistic and The Caution Approach for choosing the best alternative. CONCLUSION
Dealing with the samples of the decision making process according to the Neutrosophic logic provides us with a comprehensive and complete study for the problem that we are studying. So that, we don’t miss any data just because it is undetermined clearly. This makes us to choose the best option . The existence of indeterminacy in the problem actually affects the process of taking the suitable decision. Therefore, the undetermined values can’t be ignored/neglected while studying in order to get more accurate results that leads us to the best options. Nowadays, the classical logic is not sufficient to deal with all the data that we study. Therefore, we had to expand the data of the study and name it accurately to get more real possibilities and, therefore, make decision more accurate. And here appears the role of the Neutrosophic logic that generalizes the classical logic and gives us a wider
horizon in interpreting the data of the study and expand it and then make correct decisions with the least possible mistakes. REFERENCES
[1] W.B. Vasantha Kandasamy and F. Smarandache. Neutrosophic Rings, Hexis, Phoenix, Arizona, 2006. URL: http://fs.gallup.unm.edu/NeutrosophicRings.pdf. [2] L. A. Zadeh. Fuzzy Sets. Inform. Control 8, 1965. [3] A. Kharal. A Neutrosophic Multicriteria Decision Making Method , National University of Sciences and Technology (NUST), Islamabad, Pakistan,2011.
1d 1A i 2B i
2d 3C i 4D i
3d 5E i 6F i
0, : 1,2,3,4,5,6k ki a k

UEMK 2019 Proceedings Book
24/25 October 2019 Gaziantep University, TURKEY 824
[4] p. Majumdar. Neutrosophic Sets and its applications to Decision Making, computational intelligence for big data analysis , Adaptation , leaning and optimization , vol19 , springer , Cham .pp 97-115, 2015. [5] S. Pramanik, sh. Dalapati, sh. Alam and T. Kumar Roy. TODIM method for group decision making under bipolar neutrosophic set environment, pons asbl, 2018. [6] F. Smarandache. Introduction to Neutrosophic measure neutrosophic integral and neutrosophic probability, Sitech – Education, 2013. [7] A. A. Salama and F. Smarandache. Neutrosophic Crisp Set Theory, Education Publishing, Columbus, 2015.
UEMK 2019 Proceedings Book
24/25 October 2019 Gaziantep University, TURKEY 825
USE OF TEA WASTE BASED ADSORBENTS FOR THE REMOVAL OF CATIONIC DYE FROM AQUOUS SOLUTIONS
Ayten ATEŞ Department of Chemical Engineering, Engineering Faculty, Sivas Cumhuriyet University, Sivas, Turkey [email protected] Tülay OYMAK Department of Analytical Chemistry, Faculty of Pharmacy, Sivas Cumhuriyet University, Sivas, Turkey [email protected] Yasemin MERT
Department of Chemical Engineering, Engineering Faculty, Sivas Cumhuriyet University, Sivas, Turkey [email protected]
ABSTRACT: Raw tea waste (RTW) was activated by microwave irradiation (RTW-A-
MW) and pyrolyzed at 500 oC in N2 (RTW-A-P500) in the presence of phosphoric acid. RTW, RTW-A-MW and RTW-A-P500 were tested as adsorbent for the adsorption of methylene blue (MB) from aqueous solution. The effect of factors on adsorption efficiency and potential mechanism was carried out. Adsorption capacity of MB onto adsorbents with the MB concentration, contact time and increasing pH were studied. The adsorption efficiency for three adsorbents with contact time increased and reached a stable state within 120 min. Whereas the Langmuir isotherm model was found to be the best isotherm models to elucidate the adsorption mechanism of acid activated samples, the Freundlich isotherm model described well for RTW. The maximum adsorption capacities calculated by the Langmuir model for RTW, RTW-A-MW and RTW-A-P500 were 142.8, 41.6 and 53.8 mg g−1, respectively. The adsorption capacity of RTW is higher than activated ones, which might be due to its cellulosic content. Key words: Raw tea waste, acid activation, pyrolysis, methylene blue, adsorption. SULU ÇÖZELTİLERDEN KATYONIK BOYA GİDERİMİNDE ÇAY ATIĞI TEMELLİ ADSORBENTLERİN KULLANIMI
ÖZET: Ham çay atığı (HÇ), fosforik asit varlığında mikrodalga ışınımı ile (HÇ-A-MW) aktive ve N2 atmosferinde 500 ° C'de piroliz (HÇ-A-P500) edilmiştir. HÇ, HÇ-A-MW ve HÇ-A-P500 örneklerinin her biri, metilen mavisinin (MM) sulu çözeltiden adsorpsiyonu için adsorbent olarak test edilmiştir. Adsorpsiyon çalışma koşullarının adsorpsiyon etkinliğine ve mekanizmasına etkisi incelenmiştir. Adsorbentlerin MM adsorpsiyon kapasitesi, MM derişimi, temas süresi ve pH artışı ile arttı. Üç adsorbent

UEMK 2019 Proceedings Book
24/25 October 2019 Gaziantep University, TURKEY 826
için adsorpsiyon verimi artan adsorpsiyon süresi ile arttı ve 120 dakika sonra stabil kaldı. Langmuir izoterm modeli, asitle aktive edilmiş HÇ örneklerinin adsorpsiyon mekanizmasını açıklamak için en iyi izoterm modeli oluştururken, Freundlich izoterm model HÇ örneği için iyi uyum göstermiştir. Langmuir modeli ile belirlenmiş HÇ, HÇ-A-MW ve HÇ-A-P500 örnekleri için maksimum MM adsorpsiyon kapasiteleri sırasıyla 142.8, 41.6 ve 53.8 mg g-1‘dır. HÇ’in yüksek adsorpsiyon kapasitesi, yapısında yer alan selülozun varlığın bir sonucu olabilmektedir.
Anahtar sözcükler: Ham çay atığı, asit aktivasyonu, piroliz, metilen mavisi, adsorpsiyon
GİRİŞ
Tarımsal artıklardan ve su bitkilerinden elde edilen biyokütle, bol, ucuz ve sürdürülebilir bir hammadde olup, yüksek enerji içeriği ile enerji kaynağı olarak umut vaat etmektedir (Islam, Benhouria, Asif ve Hameed, 2015) . Biyokütleyi enerjiye dönüştürmek için biyokimyasal ve termokimyasal teknikler yaygın olarak kullanılmakta olup, termokimyasal yöntemler daha yüksek verime ve tam olmayan dönüşüme sahip olduğundan çok daha etkilidir (Tripathi, Sahu ve Ganesan, 2016). Bu nedenle, katı karbonlu bir biyokömür üretmek için oldukça ılımlı bir sıcaklıkta oksijence sınırlı atmosferde hidrotermal karbonizasyon ve piroliz gibi termokimyasal yöntemlere odaklanılmaktadır. Düşük maliyetli biyokütlenin biyokömüre dönüşümü, katı atık giderimi ile birlikte enerji üretimine de katkı sağlamaktadır. Üretilen biyokömürler toprak kalitesini artırmak için de kullanılabilmektedir (Lee, Cheng, Wong ve Wang, 2018). Üretilen biyokömürün yapısal özellikleri ve gözenek karakteristikleri, fonksiyonel aktif merkezleri ve yüksek hidrofobiklik özellikleri, biyokömürün boyalar (Sewu, Boakye ve Woo, 2017), fenoller (Zheng ve diğerleri, 2017), ağır metaller (Zhou ve diğerleri, 2016), böcek ilaçları (Vithanage, Mayakaduwa, Herath, Ok ve Mohan, 2016) ve antibiyotik kirleticileri (Lonappan, Rouissi, Kaur Brar, Verma ve Surampalli, 2018) etkin ve verimli bir şekilde gideriminde adsorbent olarak kullanımına imkan sağlamaktadır. Özellikle, biyokömürün aktif merkez doğası ve karakteristikleri, uygulanan kimyasala, ısıl muamele sıcaklığına, gaz akış hızına ve termokimyasal dönüşüm teknoloji ile ilişkilidir (Tan ve diğerleri, 2015).
Talaş (G. Ding, Wang, Chen ve Zhao, 2016), yabani otlar (Güzel, Sayğılı, Akkaya Sayğılı, Koyuncu ve Yılmaz, 2017), mısır sapları (Lian ve diğerleri, 2016) ve ceviz ağacı ahşabı (Z. Ding ve diğerleri, 2016) gibi bitki atıklarından üretilen biyokömürler metilen mavisi (MM) gibi tehlikeli katyonik boyaları atık sudan uzaklaştırmak için etkin, ekonomik ve çevresel olarak güvenli adsorbentler olarak kullanılabilmektedir. Özellikle, baskın selüloz yapısına sahip lignoselülozik bitkisel kaynaklardan üretilen biyokömürler, adsorbent olarak etkili bir kullanıma sahiptir(Ahmed, Okoye, Hummadi ve Hameed, 2019).
UEMK 2019 Proceedings Book
24/25 October 2019 Gaziantep University, TURKEY 827
Çay atığı, çay hasadının yanlış yapılması sonucu yüksek miktarda üretilmekte olup, bu atık farklı alanlarda kullanılabilir. Bunlardan biri de, sulu çözeltilerden kirlilikleri uzaklaştırmak için etkin bir adsorbent olarak kullanımıdır (Nasuha, Hameed ve Din, 2010). Çay atığı ile boya endüstrisi atık suyunun arıtımı daha önce, farklı çalışmalarda incelenmiştir(Hameed, 2009; Liu, Fan ve Li, 2018; Nasuha ve Hameed, 2011; Uddin, Islam, Mahmud ve Rukanuzzaman, 2009). Ayrıca, çay atıklarından üretilmiş
biyokömürün adsorpsiyon kabiliyeti asit ile muamele edilerek artırılmakla birlikte mikrodalga (MW) ışınımı teknolojisinin uygulanması çok umut verici sonuçlar verebilmektedir (Ania, Parra, Menéndez ve Pis, 2005). Bu nedenle, son zamanlarda, mikrodalga enerjisi hem araştırma hem de endüstriyel işletmelerde birçok uygulama alanında yaygın bir şekilde kullanmaktadır. Mikrodalga enerjisinin kullanılması karbonlu malzemelerin özelliklerini çok değiştirmesine rağmen, biokütleden üretilmiş biyokömür üzerine mikrodalganın etkisi üzerine az çalışma bulunmaktadır. Nabais ve ark.(2004) aktif karbon elyaflarının mikrodalga ısıtma vasıtasıyla yüzey kimyası modifikasyonu üzerinde çalışmış ve bunun çok etkili bir yöntem olduğunu bildirmiştir (Nabais, Carrott, Carrott ve Menéndez, 2004). Biyokütleden biyokömür üretimi ile ilgili literatürde birçok çalışma rapor edilmiş olmasına rağmen, fosforik asit varlığında mikrodalga enerjisi ile işleme tabi tutulmuş atık çaydan hazırlanan biyokömür ile ilgili herhangi bir çalışma bulunmamaktadır. Bir aktivasyon ajanı olarak fosforik asit, lignoselülozik ürünlerden kirletmeyen özellik ve suya ekstraksiyonla eliminasyon kolaylığı gibi bazı avantajlar sunmaktadır (Puziy, Poddubnaya, Martínez-Alonso, Suárez-García ve Tascón, 2005; Suárez-García, Martínez-Alonso ve Tascón, 2002). Girgis ve El-Hendawy (2002) fosforik asidin parçacık şişmesi ve biyolojik kütlenin kısmen çözülmesi, bağ parçalanması ve termal bozunmaya dirençli yeni polimerik yapıların yeniden düzenlenmesi ile botanik yapı üzerinde fiziksel ve kimyasal değişiklikler yaptığını rapor etmiştir (Girgis ve El-Hendawy, 2002). H3PO4'in bir kimyasal aktive edici ajan olarak kullanılması durumunda, gözenek boyutu dağılımlarının daha heterojen olacağı belirtilmiştir (Molina-Sabio ve Rodríguez-Reinoso, 2004). Ayrıca, üretilen biyokömürün özellikleri, H3PO4 derişimine, adsorplama oranına ve aktivasyon için kullanılan gaz türü gibi hazırlanma koşullarına güçlü bir şekilde bağlı olduğu rapor edilmiştir.
Bu nedenle çalışmada, ham çay atığı fosforik asit varlığında mikrodalgada aktive edilmiş ve fosforik asit varlığında 500 oC’de piroliz edilmiştir. Ham çay atığı, mikrodalgada aktive edilmiş çay atığı ve piroliz edilmiş çay atığı detaylı olarak karakterize edilmiş ve üç örnek metilen mavisinin sulu çözeltilerden uzaklaştırılmasında test edilmiştir. Örneklerin adsorpsiyon kapasitesi üzerine, çözeltilerin başlangıç pH değerinin, başlangıç metilen mavisi derişiminin ve temas süresinin etkisi belirlenmiş ve değerlendirilmiştir.
YÖNTEM

UEMK 2019 Proceedings Book
24/25 October 2019 Gaziantep University, TURKEY 828
Malzemeler
Ham çay atığı (HÇ), Karadeniz Bölgesi Salarha-Rize'de bulunan bir çay fabrikasından elde edilmiştir. HÇ ilk önce 0.25 mm ila 0.5 mm arasında değişen partikül boyuna öğütüldü ve gece boyunca 80 °C'de bir fırında kurutuldu. HÇ, ağırlık olarak yaklaşık % 3.8 kül, % 7.2 nem ve % 70.3 uçucu madde içermesine ek olarak % 18.6 sabit karbon, % 31.0 holoselüloz, % 25.6 lignin, % 13.9 özütleyici ve %2.0 yağ içermektedir (Uzun, Apaydin-Varol, Ateş, Özbay ve Pütün, 2010).
Metilen mavisi (MM) için bir stok çözeltisi hazırlanmış ve istenilen derişimdeki MM, bu stok çözeltiden distile su ile seyreltme ile hazırlanmıştır. Çözeltilerin başlangıç pH’ı HCl ve NaOH çözeltileri ile Chebios 640 Lab pH metre kullanılarak ayarlanmıştır. Ham Çayın Asit Aktivasyonu, Pirolizi ve Karakterizasyonu
Ham çayın H3PO4 ile asit aktivasyonu için, 2 g HÇ, bir teflon beher içinde 6 g ağırlıkça % 85 H3PO4 (Merck) ile karıştırılmış ve 30 saniye süreyle mikrodalga (MW) (Cem Mars 6) radyasyonu ile muamele edilmiştir. MW ekipmanının giriş gücü 900 W ve kullanılan mikrodalga frekansı 2,45 GHz’dir Asit içinde MW muamelesinden sonra, numune 80 °C'de fırında kurutulmuştur. Elde edilen aktive edilmiş HÇ örneği, HÇ-A-MW olarak kısaltıldı, burada A, fosforik asidi göstermektedir. Benzer olarak, H3PO4
ile HÇ 3:1 oranında karıştırılmış ve 500 °C'de Protherm fırında saf N2 (80 cm3 min-1) akışı altında 1 saat boyunca piroliz edilmiştir. Bu örnek HÇ-A-P500 olarak kısaltılmış olup, burada A piroliz sırasında asidin varlığını göstermektedir. Fosforik asit varlığında üretilen tüm numuneler, fosfat türlerinin uzaklaştırılması için birkaç kez distile suyla yıkanmıştır. Örneklerin element bileşimleri (C, H, N, S ve O) taramalı elektron mikroskobu (SEM, TESCON, MIRAIII) üzerine yerleştirilmiş bir enerji dağıtıcı spektrofotometre (EDS) (Oxford Inst. INCA) ile belirlenmiştir. Numunelerin X ışını kırınımı (XRD) desenleri, monokromotografik olmayan Cu Kα1 radyasyonu (40 kV, 40 mA, λ = 1.5Å) kullanılarak bir RigakuSmartLab X-ışını difraktometresine kaydedildi. Tarama 2θ’ın 5-65 ° aralığında yapıldı. Tüm numunelerin yüzey morfolojileri EDS (Oxford Inst. INCA) ile donatılmış bir emisyon taramalı elektron mikroskobu (TESCON-Mira III XMU) kullanılarak incelendi. Brunauer-Emmett-Teller (BET) spesifik yüzey alanları (SBET), toplam gözenek hacimleri ve gözenek çapları bir gaz sorpsiyon analiz cihazı (AUTOSORB 1C, QuantachromeCorp.,) kullanılarak tayin edilmiştir. Adsorpsiyon Deneyleri HÇ, HÇ-A-MW ve HÇ-A-P500 örneklerinin MM adsorpsiyonu çalışmaları kesikli
deney sistemde gerçekleştirilmiştir. MM adsorpsiyonunda; çözelti başlangıç pH (4-10)’ı, MM başlangıç derişimi ve adsorpsiyon süresi parametrelerinin etkileri incelenmiştir. Adsorpsiyon işleminin ardından çözelti içerisindeki MM derişimi, UV spektrofotometresinde (Shimadzu UV-1800) 664 nm dalga boyunda ölçülmüştür. Adsorbentin denge durumunda adsorpladığı MM adsorpsiyon kapasitesi (qe) ve % adsorplama yüzdesi Eşitlik 1 ve Eşitlik 2 kullanılarak hesaplanmıştır.
( )o ee
C C Vq
m
[1]
Uzaklaştırma yüzdesi;
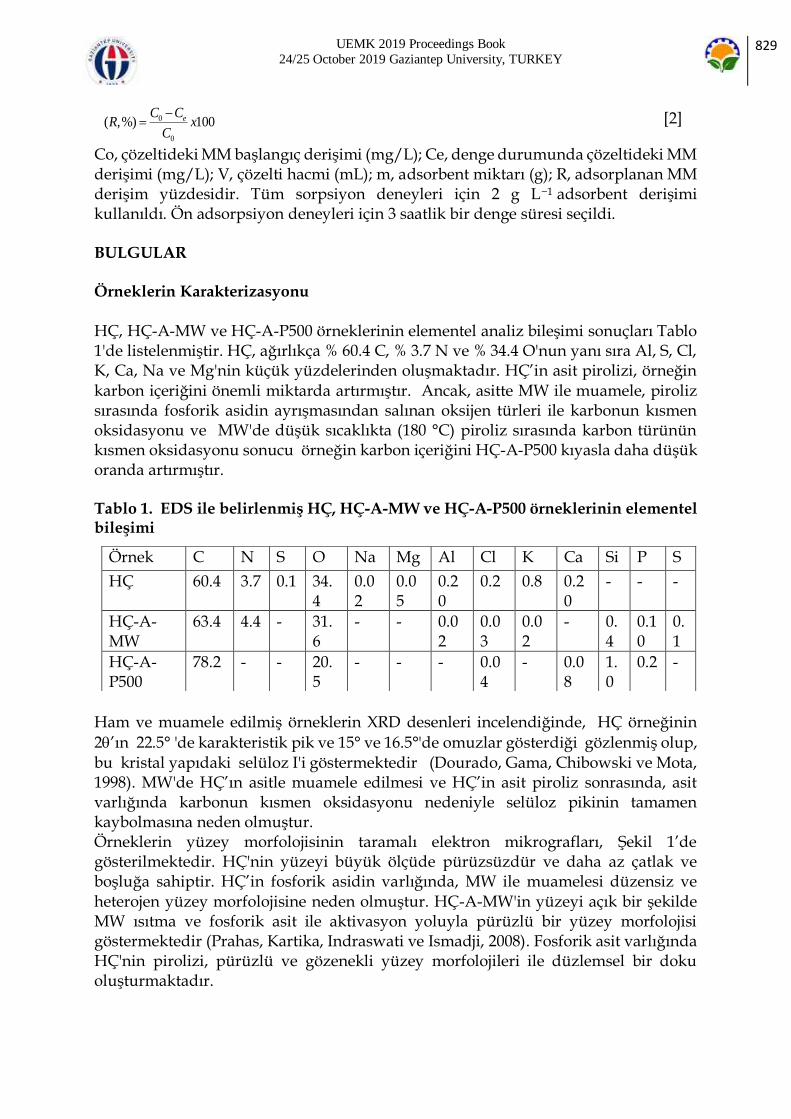
UEMK 2019 Proceedings Book
24/25 October 2019 Gaziantep University, TURKEY 829
0
0
( ,%) 100eC CR x
C
[2]
Co, çözeltideki MM başlangıç derişimi (mg/L); Ce, denge durumunda çözeltideki MM derişimi (mg/L); V, çözelti hacmi (mL); m, adsorbent miktarı (g); R, adsorplanan MM derişim yüzdesidir. Tüm sorpsiyon deneyleri için 2 g L−1 adsorbent derişimi kullanıldı. Ön adsorpsiyon deneyleri için 3 saatlik bir denge süresi seçildi. BULGULAR Örneklerin Karakterizasyonu
HÇ, HÇ-A-MW ve HÇ-A-P500 örneklerinin elementel analiz bileşimi sonuçları Tablo 1'de listelenmiştir. HÇ, ağırlıkça % 60.4 C, % 3.7 N ve % 34.4 O'nun yanı sıra Al, S, Cl, K, Ca, Na ve Mg'nin küçük yüzdelerinden oluşmaktadır. HÇ’in asit pirolizi, örneğin
karbon içeriğini önemli miktarda artırmıştır. Ancak, asitte MW ile muamele, piroliz sırasında fosforik asidin ayrışmasından salınan oksijen türleri ile karbonun kısmen oksidasyonu ve MW'de düşük sıcaklıkta (180 °C) piroliz sırasında karbon türünün kısmen oksidasyonu sonucu örneğin karbon içeriğini HÇ-A-P500 kıyasla daha düşük oranda artırmıştır. Tablo 1. EDS ile belirlenmiş HÇ, HÇ-A-MW ve HÇ-A-P500 örneklerinin elementel bileşimi
Ham ve muamele edilmiş örneklerin XRD desenleri incelendiğinde, HÇ örneğinin
2’ın 22.5° 'de karakteristik pik ve 15° ve 16.5°'de omuzlar gösterdiği gözlenmiş olup, bu kristal yapıdaki selüloz I'i göstermektedir (Dourado, Gama, Chibowski ve Mota, 1998). MW'de HÇ’ın asitle muamele edilmesi ve HÇ’in asit piroliz sonrasında, asit varlığında karbonun kısmen oksidasyonu nedeniyle selüloz pikinin tamamen kaybolmasına neden olmuştur. Örneklerin yüzey morfolojisinin taramalı elektron mikrografları, Şekil 1’de gösterilmektedir. HÇ'nin yüzeyi büyük ölçüde pürüzsüzdür ve daha az çatlak ve boşluğa sahiptir. HÇ’in fosforik asidin varlığında, MW ile muamelesi düzensiz ve heterojen yüzey morfolojisine neden olmuştur. HÇ-A-MW'in yüzeyi açık bir şekilde MW ısıtma ve fosforik asit ile aktivasyon yoluyla pürüzlü bir yüzey morfolojisi göstermektedir (Prahas, Kartika, Indraswati ve Ismadji, 2008). Fosforik asit varlığında HÇ'nin pirolizi, pürüzlü ve gözenekli yüzey morfolojileri ile düzlemsel bir doku oluşturmaktadır.
Örnek C N S O Na Mg Al Cl K Ca Si P S
HÇ 60.4 3.7 0.1 34.4
0.02
0.05
0.20
0.2 0.8 0.20
- - -
HÇ-A-MW
63.4 4.4 - 31.6
- - 0.02
0.03
0.02
- 0.4
0.10
0.1
HÇ-A-P500
78.2 - - 20.5
- - - 0.04
- 0.08
1.0
0.2 -

UEMK 2019 Proceedings Book
24/25 October 2019 Gaziantep University, TURKEY 830
Örneklerin N2 adsorpsiyonu -desorpsiyonu izotermlerinden ve gözenek boyut dağılım eğrilerinden belirlenen yüzey alanı ve gözenek özellikleri Tablo 2’de gösterilmiştir. HÇ örneğinin yüzey alanı ve ortalama gözenek çapı sırasıyla 10.4 m2g-1 ve 55.6 Å’dir. HÇ’ın asit varlığında pirolizi, ortalama gözenek çapının azalmasıyla artan mikro-gözeneklilik nedeniyle yüzey alanını önemli miktarlarda arttırmaktadır. Bununla birlikte, asit varlığında MW ile aktivasyon, gözenek özelliklerinin önemsiz değişikliklerle, HÇ-A-MW’in yüzey alanını hafifçe arttırmaktadır. Literatürde (Hoseinzadeh Hesas, Wan Daud, Sahu ve Arami-Niya, 2013), atıkların asit aktivasyonunun, yapısal bozulma ve yüzeyde defektlerin oluşumuyla homojen olmayan mikro yapı oluşumuyla homojen olmayan mikroyapı ile yüzey alanında önemli miktarda artışa neden olduğu rapor edilmiş olup bu çalışmada asidin varlığı mikro yapıyı önemli miktarda artırmıştır. Tablo 2. Örneklerin yüzey alanı ve gözenek boyut dağılımı.
Örnek SBETa (m2g−
1) VToplam
b (cm3 g− 1)
VMikro (cm3 g− 1)
Dp (Å) c
HÇ 10.4 0.03 0.004 55.6
HÇ-A-P500 931 1.08 0.374 23.4
HÇ-A-MW 18.5 0.02 0.005 19.2 a Çok noktalı BET ile belirlenmiş yüzey alanı; b P/Po = 0.99’da hesaplanmış toplam
yüzey alanı; cDR ile ortalama gözenek çapı. Adsorpsiyon Sonuçları pH’ın etkisi
HÇ, MÇ-A-MW ve HÇ-A-P500 adsorbentlerinin MM adsorpsiyonu üzerine çözelti başlangıç pH değerlerinin etkisi Şekil 2’de gösterilmiştir. Maksimum MM uzaklaştırma yüzdesi, HÇ için pH=6, HÇ-A-MW ve HÇ-A-P500 için pH=8 bulunmuştur. Çözelti pH ile MM giderim yüzdesi arasındaki ilişki MM ve adsorbentler arasındaki elektrostatik etkileşimle ilişkilendirilebilir (El-Shafey, Ali, Al-Busafi ve Al-Lawati, 2016). MM’nin adsorpsiyonunda adsorbentin zeta potansiyeli önemli bir işleve sahiptir. HÇ ve HÇ-A-MW’in izoelektrik nokta değerlerindeki pH değerlerinin değeri 1.5 iken, HÇ-A-P500 örneğinin değeri pH=2’de bulunmuş olup, izoelektrik noktanın üzerinde adsorbent yüzeyleri negatif olarak yüklenmekte olup, katyonik MB moleküllerini adsorplayabilmektedirler.
Adsorpsiyon izotermleri
pH incelemesi sonucunda, adsorpsiyon izotermi incelemesi pH=8 değerinde gerçekleştirilmiştir. Şekil 3’de gösterilen adsorpsiyon süresine bağlı olarak derişim verilerine Langmuir, Freundlich ve Temkin modelleri uygulanmıştır. Model denklemleri aşağıda listelenmiştir.
Langmuir sioterm denkleminin doğrusallaştırılmış denklemi Ce
qe=
1
bqm+
Ce
qm (3)

UEMK 2019 Proceedings Book
24/25 October 2019 Gaziantep University, TURKEY 831
Freundlich izotherm denklemi doğrusal şekli lnqe =ln kF+ (1/n) lnCe (4) Temkin izoterm denkleminin doğrusal şekli
qe =RT
bTlnKT +
RT
bTlnCe (5)
Denklem (3)-(5)’de Ce dengedeki derişimi (mg L−1); qe denge süresinde adsorpsiyon kapasitesi (mg g−1); qm maksimum adsorpsiyon kapasitesi (mg g−1); b is adsorpsiyon kapasitesi ile ilgili Langmuir sabiti; kF Freundlich sabiti (L mg−1); n adsorpsiyon “şiddeti”; KT denge bağlanma sabiti (L mg−1); bT Temkin izoterm sabiti; R ideal gaz sabiti (8.314J mol−1 K−1); T sıcaklık (K); BT=RT/bT adsorpsiyon ısısı terimi (J mol−1). Üç adsorpsiyon izoterm modelinin deneysel verilere uygulamasını sonucu bulunan parametreler ve regresyon katsayıları sonuçları Tablo 3’de gösterilmiştir. Regresyon katsayıları değerlerine göre, HÇ için Freundlich model ve asitte MW aktivasyon ve
piroliz sonucu üretilen örneklerde ise Langmuir izoterm model deneysel verileri daha iyi tanımlamaktadır. İzotermler, MM’nin aktive edilmiş HÇ örneklerinde tek konum mekanizması ile yürüdüğünü göstermektedir. Langmuir izoterminden bulunan 1/n değeri her üç adsorbent için de 0.5’den küçük olup bu, MM’nin yüzeyde kolayca adsorplandığını göstermektedir. Temkin izoterm model, adsorbatın yüzey kaplama hızı azaldıkça, adsorpsiyon ısısının azaldığını varsaymaktadır (Kallel ve diğerleri, 2016). Temkin izoterm model elektrostatik etkileşim ile gerçekleşen kimyasal adsorpsiyonu tanımlamakta olup, HÇ ve HÇ-A-MW örnekleri için yüksek R2 değeri ile deneysel verilere uyum göstermektedir. BT değerlerinin 8 kJ/mol’den düşük olması, MM adsorpsiyonun yüzeyde fiziksel adsorpsiyon ile yürüdüğünü göstermektedir. Tablo 3. MM uzaklaştırması için adsorbentlerin adsorpsiyon izoterm sabitleri
Örnek Langmuir Freundlich Temkin
qm (mg g-1)
b (Lmg-1)
R2 kF
((mg g−1) (mg L−1)−n)
n R2 bT
(J mol-1) AT
(L g-1)
R2
HÇ 142.8 0.04 0.952 14.3 1.9 0.988 39.3 0.14 0.995
HÇ-A-MW 41.6 0.16 0.977 2.8 3.4 0.958 4.8 0.86 0.959
HÇ-A-P500 53.8 0.10 0.999 14.3 3.8 0.944 9.4 289.4 0.826
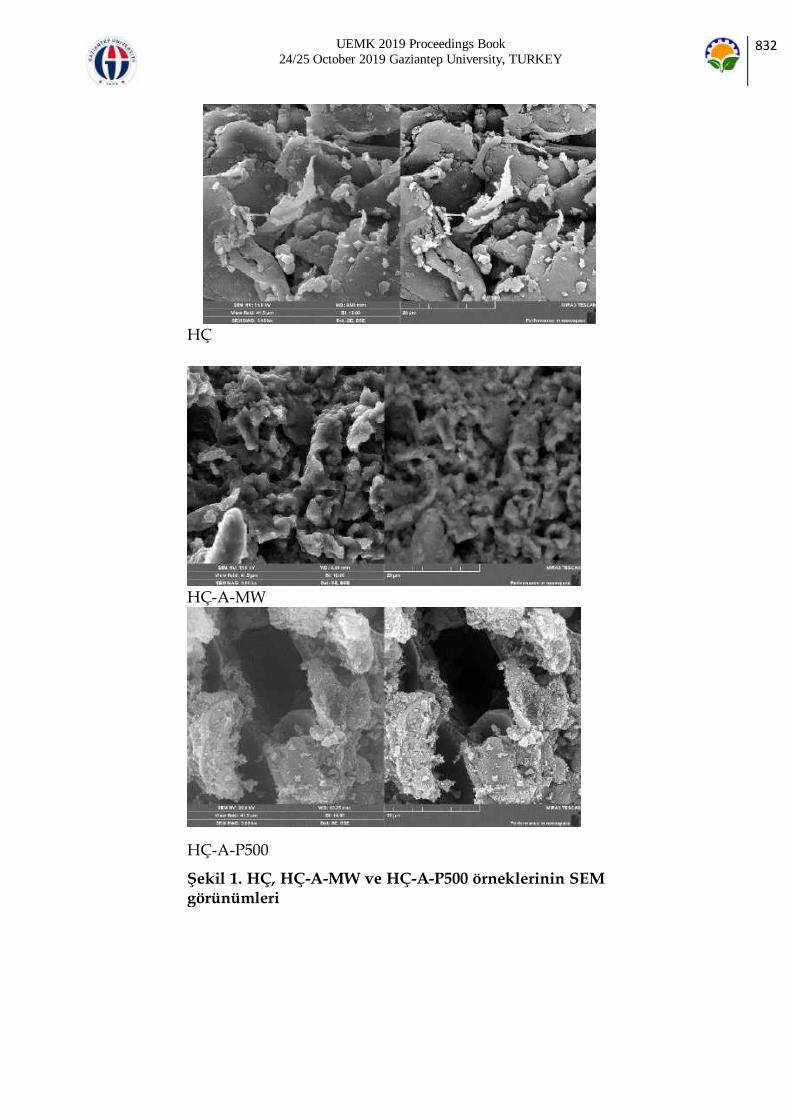
UEMK 2019 Proceedings Book
24/25 October 2019 Gaziantep University, TURKEY 832
HÇ
HÇ-A-MW
HÇ-A-P500
Şekil 1. HÇ, HÇ-A-MW ve HÇ-A-P500 örneklerinin SEM görünümleri

UEMK 2019 Proceedings Book
24/25 October 2019 Gaziantep University, TURKEY 833
(a) HÇ
(b)HÇ-A-MW
HÇ-A-P500
Şekil 2. Farklı pH değerlerinde adsorpsiyon yüzdesinin fonksiyonu olarak adsorbentlerin MM uzaklaştırma yüzdeleri
-
10
20
30
40
50
60
70
80
90
100
0 10 20 30 40 50 60 70
% M
M u
zakl
aştı
rma
[-]
Adsorpsiyon süresi [dk]
pH 5 pH 6 pH 7pH 8 pH 9 pH 10
0
10
20
30
40
50
60
70
80
90
100
0 10 20 30 40 50 60 70
% M
M u
zakl
aştı
rma
[-]
Adsorpsiyon süresi [dk]
pH 5 pH 6 pH 7
pH 8 pH 9 pH 10
0
10
20
30
40
50
60
70
80
90
100
0 10 20 30 40 50 60 70
% M
M u
zakl
aştı
rma
[-]
Adsorpsiyon süresi [dk]
pH 4 pH 6 pH 7
pH 8 pH 9 pH 10

UEMK 2019 Proceedings Book
24/25 October 2019 Gaziantep University, TURKEY 834
HÇ
HÇ-A-P500
HÇ-A-P500 Şekil 3. MM başlangıç derişimin fonksiyonu olarak adsorpsiyon süresi ile adsorbentlerin % MM uzaklaştıra yüzdeleri
SONUÇ
40
50
60
70
80
90
100
0 20 40 60 80 100 120 140
% M
M u
zakla
ştır
ma
[-]
Adsorpsiyon süresi [dk]
25 mg/L
50 mg/L
100 mg/L
40
50
60
70
80
90
100
0 20 40 60 80 100 120 140
% M
M u
zakla
ştır
ma
[-]
Adsorpsiyon süresi [dk]
25 mg/L
50 mg/L
100 mg/L
40
50
60
70
80
90
100
0 20 40 60 80 100 120 140
% M
M u
zakla
ştır
ma
[-]
Adsorpsiyon süresi [dk]
25 mg/L
50 mg/L
100 mg/L

UEMK 2019 Proceedings Book
24/25 October 2019 Gaziantep University, TURKEY 835
Ham çay (HÇ) örneğinin fosforik asit varlığında mikrodalga (MW) ile aktive edilmiş ham çay (HÇ-A-MW) ve 500 oC’de pirolizi ile üretilmiş biyokömür örnekleri üretilmiştir. MW aktivasyonu HÇ’in karbon içeriğinde ve yüzey alanında artışa neden olmaktadır. Benzer olarak, HÇ’in asit varlığında pirolizi karbon içeriğini artırırken, yapıda mikro gözeneklerin oluşumuyla, yüzey alanında yüksek miktarda artışa neden olmuştur. XRD sonuçları, HÇ’in yapısındaki selülozun MW’de asit aktivasyonu ve asit piroliz ile amorf karbona dönüştüğünü göstermiştir. Örneklerin metilen mavisi (MM)
adsorpsiyon sonuçlarına göre, Langmuir izoterminden sağlanan maksimum adsorpsiyon kapasitesi HÇ için 142. 8 mg g-1 bulunmuştur. HÇ-A-MW ve HÇ-A-P500 örneklerinin maksimum adsorpsiyon kapasiteleri sıra ile 41.6 ve 53.8 mg g-1 olarak bulunmuştur. HÇ örneğinin yüksek adsorpsiyon kapasitesi, yapısında yer alan selüloz ve ligninin varlığının bir sonucu olabilmektedir. HÇ-A-P500 örneğinin yüksek yüzey alanının aksine düşük MM adsorpsiyon kapasitesi, MM molekülerinin gözeneklere difüzyon probleminin olmasının bir sonucu olabilmektedir. TEŞEKKÜR
Bu çalışma Sivas Cumhuriyet Üniversitesi Bilimsel Araştırma Fonu (M-657) tarafından desteklenmiştir. KAYNAKLAR
Ahmed, M. J., Okoye, P. U., Hummadi, E. H. ve Hameed, B. H. (2019). High-performance porous biochar from the pyrolysis of natural and renewable seaweed (Gelidiella acerosa) and its application for the adsorption of methylene blue. Bioresource Technology. doi:10.1016/j.biortech.2019.01.054 Ania, C. O., Parra, J. B., Menéndez, J. A. ve Pis, J. J. (2005). Effect of microwave and conventional regeneration on the microporous and mesoporous network and on the adsorptive capacity of activated carbons. Microporous and Mesoporous Materials. doi:10.1016/j.micromeso.2005.06.013 Ding, G., Wang, B., Chen, L. ve Zhao, S. (2016). Simultaneous adsorption of methyl red and methylene blue onto biochar and an equilibrium modeling at high concentration. Chemosphere. doi:10.1016/j.chemosphere.2016.08.037 Ding, Z., Wan, Y., Hu, X., Wang, S., Zimmerman, A. R. ve Gao, B. (2016). Sorption of lead and methylene blue onto hickory biochars from different pyrolysis temperatures: Importance of physicochemical properties. Journal of Industrial and Engineering Chemistry. doi:10.1016/j.jiec.2016.03.035 Dourado, F., Gama, F. M., Chibowski, E. ve Mota, M. (1998). Characterization of cellulose surface free energy. Journal of Adhesion Science and Technology, 12(10), 1081–
1090. doi:10.1163/156856198X00740 El-Shafey, E. I., Ali, S. N. F., Al-Busafi, S. ve Al-Lawati, H. A. J. (2016). Preparation and characterization of surface functionalized activated carbons from date palm leaflets and application for methylene blue removal. Journal of Environmental Chemical

UEMK 2019 Proceedings Book
24/25 October 2019 Gaziantep University, TURKEY 836
Engineering, 4(3), 2713–2724. doi:10.1016/j.jece.2016.05.015 Girgis, B. S. ve El-Hendawy, A. N. A. (2002). Porosity development in activated carbons obtained from date pits under chemical activation with phosphoric acid. Microporous and Mesoporous Materials, 52(2), 105–117. doi:10.1016/S1387-1811(01)00481-4 Güzel, F., Sayğılı, H., Akkaya Sayğılı, G., Koyuncu, F. ve Yılmaz, C. (2017). Optimal oxidation with nitric acid of biochar derived from pyrolysis of weeds and its application in removal of hazardous dye methylene blue from aqueous solution. Journal of Cleaner Production. doi:10.1016/j.jclepro.2017.01.029
Hameed, B. H. (2009). Spent tea leaves: A new non-conventional and low-cost adsorbent for removal of basic dye from aqueous solutions. Journal of Hazardous Materials. doi:10.1016/j.jhazmat.2008.04.019 Hoseinzadeh Hesas, R., Wan Daud, W. M. A., Sahu, J. N. ve Arami-Niya, A. (2013). The effects of a microwave heating method on the production of activated carbon from agricultural waste: A review. Journal of Analytical and Applied Pyrolysis. doi:10.1016/j.jaap.2012.12.019 Islam, M. A., Benhouria, A., Asif, M. ve Hameed, B. H. (2015). Methylene blue adsorption on factory-rejected tea activated carbon prepared by conjunction of hydrothermal carbonization and sodium hydroxide activation processes. Journal of the Taiwan Institute of Chemical Engineers, 52, 57–64. doi:10.1016/j.jtice.2015.02.010
Kallel, F., Chaari, F., Bouaziz, F., Bettaieb, F., Ghorbel, R. ve Chaabouni, S. E. (2016). Sorption and desorption characteristics for the removal of a toxic dye, methylene blue from aqueous solution by a low cost agricultural by-product. Journal of Molecular Liquids, 219, 279–288. doi:10.1016/j.molliq.2016.03.024
Lee, D. J., Cheng, Y. L., Wong, R. J. ve Wang, X. D. (2018). Adsorption removal of natural organic matters in waters using biochar. Bioresource Technology. doi:10.1016/j.biortech.2018.04.016 Lian, F., Cui, G., Liu, Z., Duo, L., Zhang, G. ve Xing, B. (2016). One-step synthesis of a novel N-doped microporous biochar derived from crop straws with high dye adsorption capacity. Journal of Environmental Management. doi:10.1016/j.jenvman.2016.03.043 Liu, L., Fan, S. ve Li, Y. (2018). Removal behavior of methylene blue from aqueous solution by tea waste: Kinetics, isotherms and mechanism. International Journal of Environmental Research and Public Health. doi:10.3390/ijerph15071321 Lonappan, L., Rouissi, T., Kaur Brar, S., Verma, M. ve Surampalli, R. Y. (2018). An insight into the adsorption of diclofenac on different biochars: Mechanisms, surface chemistry, and thermodynamics. Bioresource Technology.
doi:10.1016/j.biortech.2017.10.039 Molina-Sabio, M. ve Rodríguez-Reinoso, F. (2004). Role of chemical activation in the development of carbon porosity. Colloids and Surfaces A: Physicochemical and Engineering Aspects içinde . doi:10.1016/j.colsurfa.2004.04.007 Nabais, J. M. V., Carrott, P. J. M., Carrott, M. M. L. R. ve Menéndez, J. A. (2004). Preparation and modification of activated carbon fibres by microwave heating. Carbon içinde . doi:10.1016/j.carbon.2004.01.033 Nasuha, N. ve Hameed, B. H. (2011). Adsorption of methylene blue from aqueous solution onto NaOH-modified rejected tea. Chemical Engineering Journal.

UEMK 2019 Proceedings Book
24/25 October 2019 Gaziantep University, TURKEY 837
doi:10.1016/j.cej.2010.11.012 Nasuha, N., Hameed, B. H. ve Din, A. T. M. (2010). Rejected tea as a potential low-cost adsorbent for the removal of methylene blue. Journal of Hazardous Materials, 175(1–3),
126–132. doi:10.1016/j.jhazmat.2009.09.138 Prahas, D., Kartika, Y., Indraswati, N. ve Ismadji, S. (2008). Activated carbon from jackfruit peel waste by H3PO4 chemical activation: Pore structure and surface chemistry characterization. Chemical Engineering Journal, 140(1–3), 32–42. doi:10.1016/j.cej.2007.08.032 Puziy, A. M., Poddubnaya, O. I., Martínez-Alonso, A., Suárez-García, F. ve Tascón, J. M. D. (2005). Surface chemistry of phosphorus-containing carbons of lignocellulosic origin. Carbon. doi:10.1016/j.carbon.2005.06.014 Sewu, D. D., Boakye, P. ve Woo, S. H. (2017). Highly efficient adsorption of cationic dye by biochar produced with Korean cabbage waste. Bioresource Technology, 224, 206–213. doi:10.1016/j.biortech.2016.11.009 Suárez-García, F., Martínez-Alonso, A. ve Tascón, J. M. D. (2002). Pyrolysis of apple pulp: Chemical activation with phosphoric acid. Journal of Analytical and Applied Pyrolysis. doi:10.1016/S0165-2370(01)00160-7
Tan, X., Liu, Y., Zeng, G., Wang, X., Hu, X., Gu, Y. ve Yang, Z. (2015). Application of biochar for the removal of pollutants from aqueous solutions. Chemosphere. doi:10.1016/j.chemosphere.2014.12.058 Tripathi, M., Sahu, J. N. ve Ganesan, P. (2016). Effect of process parameters on production of biochar from biomass waste through pyrolysis: A review. Renewable and Sustainable Energy Reviews. doi:10.1016/j.rser.2015.10.122 Uddin, M. T., Islam, M. A., Mahmud, S. ve Rukanuzzaman, M. (2009). Adsorptive removal of methylene blue by tea waste. Journal of Hazardous Materials, 164(1), 53–60.
doi:10.1016/j.jhazmat.2008.07.131 Uzun, B. B., Apaydin-Varol, E., Ateş, F., Özbay, N. ve Pütün, A. E. (2010). Synthetic fuel production from tea waste: Characterisation of bio-oil and bio-char. Fuel, 89(1), 176–184. doi:10.1016/j.fuel.2009.08.040 Vithanage, M., Mayakaduwa, S. S., Herath, I., Ok, Y. S. ve Mohan, D. (2016). Kinetics, thermodynamics and mechanistic studies of carbofuran removal using biochars from tea waste and rice husks. Chemosphere. doi:10.1016/j.chemosphere.2015.11.002
Zheng, H., Guo, W., Li, S., Chen, Y., Wu, Q., Feng, X., … Chang, J. S. (2017). Adsorption of p-nitrophenols (PNP) on microalgal biochar: Analysis of high adsorption capacity and mechanism. Bioresource Technology. doi:10.1016/j.biortech.2017.05.025 Zhou, L., Liu, Y., Liu, S., Yin, Y., Zeng, G., Tan, X., … Huang, X. (2016). Investigation of the adsorption-reduction mechanisms of hexavalent chromium by ramie biochars of different pyrolytic temperatures. Bioresource Technology, 218, 351–359. doi:10.1016/j.biortech.2016.06.102.

UEMK 2019 Proceedings Book
24/25 October 2019 Gaziantep University, TURKEY 838
SYNHESIS AND CHARACTERIZATION OF ZnO PARTICLES
Ayten ATEŞ Department of Chemical Engineering, Engineering Faculty, Sivas Cumhuriyet University, Sivas, Turkey [email protected] ABSTRACT: A novel and easy route for preparing different size particles of zinc oxide is a mild sol–gel synthesis. ZnO particles were prepared by reacting zinc acetate dihydrate with NaOH in water at 50−60 °C and at varied pH (4, 6 and 9). The ZnO samples were characterized by scanning electron microscopy (SEM), X-ray diffraction (XRD) analysis and N2 adsorption-desorption. pH and calcination temperature during preparation of ZnO affected significantly its particle size. ZnO particles synthesised involved mostly wurtzite structure as well as amorphous crystal structure. Surface areas of ZnO prepared are close to commercial ZnO. The surface area of ZnO prepared at pH 4 is higher than those of samples synthesised at higher pH values due to formation of micropores. ZnO prepared at pH 9 has particles with 20- 50 µm as well as aggregation of small crystallites (almost 10 µm). At higher calcination temperature (> 250 oC), no aggregation occurs and tiny single crystallite particles are obtained. Key words: ZnO, sol- gel, calcination, pH ZnO PARTİKÜLLERİNİN SENTEZİ VE KARAKTERİZASYONU
ÖZET: Farklı boyutlardaki çinko oksit parçacıklarını hazırlamak için yeni ve kolay bir yol ılımlı koşullarda sol-jel sentez yöntemidir. ZnO partikülleri, çinko asetat dihidratın NaOH ile sulu çözeltisinde 50−60 °C'de ve çeşitli pH (4, 6 ve 9) değerlerinde reaksiyonu ile hazırlanmıştır. . ZnO örnekleri taramalı elektron mikroskobu (SEM), X-ışını kırınımı (XRD) analizi ve N2 adsorpsiyonu-desorpsiyonu ile karakterize edilmiştir. ZnO'nun hazırlanması sırasında pH ve kalsinasyon sıcaklığı, partikül büyüklüğünü önemli ölçüde etkilemektedir. Sentezlenen ZnO partikülleri, çoğunlukla wurtzite yapısının yanı sıra amorf kristal yapısını da içerir. Hazırlanan ZnO örneklerinin yüzey alanları ticari ZnO'ya yakındır. pH 4'te hazırlanan ZnO'nun yüzey alanı, mikro gözeneklerin oluşumu nedeniyle daha yüksek pH değerlerinde sentezlenen örneklerden daha yüksektir. pH 9'da hazırlanan ZnO, 20-50 µm
partiküllerin yanı sıra küçük kristallerin ( 10 µm) agregasyonuna sahiptir. Daha yüksek kalsinasyon sıcaklığında (> 250 oC), topaklaşma oluşmamakta ve küçük tek kristalli partiküller elde edilmektedir
Anahtar sözcükler: ZnO, sol-jel, kalsinasyon, pH
GİRİŞ

UEMK 2019 Proceedings Book
24/25 October 2019 Gaziantep University, TURKEY 839
Çinko oksit (ZnO) yüksek yüzey alanı, yüksek elektron haraketliliği ve yüksek hassasiyet gibi üç eşsiz özelliğe ile ilgi çekmektedir. ZnO çok önemli II-VI yarı iletkenlerinden biri olarak bilinmekte olup, teknolojinin farklı alanlarında geniş bir şekilde uygulanmaktadır (Turgut, Duman ve Keskenler, 2015). ZnO partikülleri, katalizör uygulamalarına ek olarak güneş hücreleri, gaz sensörleri, anistatik kaplamalar, uzay endüstrisi gibi yaygın araştırma ve endüstriyel uygulamalar için gerekli olan optik, elektrik ve manyetik özelliklere sahiptir (Stefan, Ghica, Nistor, Maraloiu ve Plugaru, 2017). Farklı boyut ve şekillerde ZnO'nun hazırlanması literatürde rapor edilmiştir (Eilers ve Tissue, 1995; Hu ve diğerleri, 2001; Jézéquel, Guenot, Jouini ve Fiévet, 1995; Milošević ve Uskoković, 1993; Nishizawa ve Yuasa, 1998; Zhou, Deng, Yi ve Liu, 1999). Nano boyutlu ZnO partiküllerini sentezlemek için çeşitli yöntemler rapor edilmektedir (Babu ve Hong, 2015). Örneğin gaz yoğunlaşması, poliol ortamında hidroliz, polimerik prekürsör yöntemi, aerosol sprey pirolizi, hidrotermal yöntem, sol-jel işlemi ve katı hal mikrodalga ayrışma yöntemi (Eilers ve Tissue, 1995; Hu ve diğerleri, 2001; Jézéquel ve diğerleri, 1995; Milošević ve Uskoković, 1993; Nishizawa ve Yuasa, 1998; Zhou ve diğerleri, 1999) şeklinde sıralanabilir . Bu yöntemlerden, sol-jel yöntemi yüksek yüzey alanlı parçacık üretmek, stokiometrinin mükemmel kontrolü, bileşim modifikasyonu, düşük maliyetli bir proses, ucuz ekipman gerekliliği gibi imkanla sunduğundan dolayı tercih edilmiştir (Aydin, El-Nasser, Aydin, Al-Ghamdi ve Yakuphanoglu, 2015; Wang ve diğerleri, 2015). Bu çalışmada farklı pH (4, 5 ve 9) değerlerinde çinko asetat dihidratın NaOH ile sulu çözeltisinde 50−60 °C'de sol-jel yöntemi ile ZnO partikülleri sentezlenmiş ve XRD, N2 adsorpsiyonu- desorpsiyonu ve SEM yöntemleri ile karakterize edilmiştir. YÖNTEM
ZnO’in Hazırlama Yöntemi
1 M NaOH’in 5 ml, 0. 1 M ZnAc2.2H2O’in 25 ml’e eklenmiştir. HNO3 ile pH 4 ve 6’ ya ayarlanmıştır. Bir örnek ise doğal pH’ında (pH=9.2) bırakılmıştır. 60 Co’de karışım1 saat karıştırılmıştır. Örnekler oda sıcaklığında 7 gün boyunca kurumaya bırakılmıştır. Kurumuş örnekler 250 oC’de 5 saat kalisne edilmiştir. ZnO’in Karakterizasyonu
Sentezlenmiş ZnO örneklerinin kristal yapısı X-ışını kırınımı (XRD) (Rigaku SmartLab ) ile analiz edilmiştir. ZnO örneklerinin yüzey alanı, gözenek hacmi ve gözenek boyut dağılımı yüksek çözünürlüklü yüzey alanı ölçüm cihazında (Quantachrome, AUTOSORB 1C) 77 K’de belirlenmiştir. Adsorpsiyon öncesinde örneklere 150 oC’de 1.3 Pa’a ulaşıncaya kadar vakum uygulanmıştır. Bu koşullarda örnek 8 saat tutulmuştur. Yüzey alanı, gözenek hacmi ve mikro gözenek hacmi sırayla çok noktalı BET (Brunauer, Emmett and Teller), t- plot ve DR (Dubinin–Radushkevic) yöntemleri ile belirlenmiştir. Gözenek boyut dağılımı ise Kelvin denklemini temel alan Barrett, Joyner, Halenda (BJH) yöntemi ile belirlenmiştir. Toplam gözenek hacmi (VT), adsorpsiyonun ve desorpsiyonun aynı anda gerçekleştiği nokta olana P/Po = 0.99’da

UEMK 2019 Proceedings Book
24/25 October 2019 Gaziantep University, TURKEY 840
adsorplanmış hacim olarak alınmıştır. Tüm örnekler aynı yöntemlere göre analiz edilmiştir. ZnO örneklerinin yüzey morfolojisi taramalı elektron mikroskobu (SEM, TESCAN, MIRA 3) ile örneklerin altın kaplaması sonucu görüntülenmiştir. BULGULAR
ZnAc2.2H2O ve NaOH kullanılarak sol- jel yöntemi ile farklı pH’larda ZnO katalizörleri sentezlenmiş ve 250 oC’de kalsine edilmiştir. Ticari ve sol-jel ile sentezlenmiş katalizörlerin XRD görünümleri Şekil 1’de verilmiştir. Ticari ile karşılaştırıldığında, sentezlenmiş ZnO’in pH’a bağlı olmaksızın pik şiddetleri düşük ve ticari ZnO’e ek bazı pikler gözlenmektedir. Pik şiddetleri kalsinasyon sıcaklığın 500 oC’e çıkarılmasıyla artırılabilir ve aynı zamanda yapıdaki bazı eser pikler de artan kalsinasyon sıcaklığı ile azaltılabilir. ZnO’in erime sıcaklığının düşük olması nedeniyle, düşük sıcaklıkta kalsine edilmiştir. Ayrıca, MDI-Jade (MDI-Jade 6) programı ile yapılan faz analizleri, ZnO partikülleri, çoğunlukla wurtzite kristal yapısına sahip olduğunu göstermiştir. Ticari ve sol- jel ile üretilmiş farklı pH’da hazırlanmış ve 250 oC’de kalsine edilmiş ZnO örneklerininn N2 adsorpsiyonu-desorpsiyonu izotermi ve diferansiyel gözenek boyut dağılımı Şekil 2’de verilmiştir. İzotermlerden hesaplanmış yüzey alanı, gözenek hacmi ve ortalama gözenek çapı verileri Tablo 1’de listelenmiştir. pH’a bağlı olmaksızın her üç örneğin de N2 adsorpsiyonu-desorpsiyonu izotermi ve ticari ZnO’e benzerlik göstermektedir. Yüzey alanları da ticari ZnO’e yakındır. Tablo 1’den görülebileceği gibi pH artışı gözenek çapının artmasına neden olarak yüzey alanında azalmaya neden olmaktadır.
Şekil 1. Ticari ve sol- jel ile üretilmiş farklı pH’da hazırlanmış ve 250 oC’de kalsine edilmiş ZnO katalizörlerinin XRD görünümleri
10 20 30 40 50 60
Şid
de
t [a
.u]
2θ [o]
Ticari ZnO
pH=9.2
pH=6.0
pH=3.9

UEMK 2019 Proceedings Book
24/25 October 2019 Gaziantep University, TURKEY 841
Tablo 1. Ticari ve sol- jel ile üretilmiş farklı pH’da hazırlanmış ve 250 oC’de kalsine edilmiş ZnO örneklerinin yüzey alanı, gözenek hacmi ve ortalama gözenek çapı.
a Çok noktalı BET yöntemi kullanılarak hesaplanmış yüzey alanı; bP/Po = 0.99’da adsorplanmış hacim; c DFT ile belirlenmiş ortalama gözenek çapı.
Şekil 2. Ticari ve sol- jel ile üretilmiş farklı pH’da hazırlanmış ve 250 oC’de kalsine edilmiş ZnO örneklerinin N2 adsorpsiyonu-desorpsiyonu izotermi ve diferansiyel gözenek boyut dağılımı
0
2
4
6
8
10
12
14
16
18
20
0.0 0.2 0.4 0.6 0.8 1.0
Adso
rpla
nm
ış ha
cim
[cm
3g
-1]
Bağıl basınç [P/Po] [-]
Ticari ZnO
ZnO- pH=3.9
ZnO-pH=6.0
ZnO-pH=9.2
0.0E+0
1.0E-4
2.0E-4
3.0E-4
4.0E-4
5.0E-4
6.0E-4
7.0E-4
8.0E-4
9.0E-4
5.0 50.0
Dv(r
)[cm
3/Å
/g]
Gözenek çapı (d) [Å]
Ticari- ZnO
ZnO-pH=9.2
ZnO-pH=6.0
ZnO-pH=3.9
Örnek
SAa (m2.g-1)
VTb
(cm3.g-1) Dc (Å)
Ticari ZnO 9.7 0.04 167
ZnO-pH=9.2 7.1 0.07 213
ZnO-pH=6.0 8.7 0.02 49.8
ZnO-pH=3.9 13.4 0.02 -

UEMK 2019 Proceedings Book
24/25 October 2019 Gaziantep University, TURKEY 842
Çözeltinin doğal sentezlenmiş pH değerinde (pH=9) ZnO örneğinin SEM görüntüsü Şekil 3’de gösterilmiştir. XRD verileri ile birlikte değerlendirildiğinde, ZnO örneği tam olarak kristallenmemiş olup, yapıda amorf yapılar bulunmaktadır. Bu nedenle pH 4 değerinde sentezlenmiş örnekte nano boyutlu tam kristallinmiş yapı gözlenmiş olup, bu yapı kalsinasyon sıcaklığının 350 oC’e artışı ile daha da belirginleşmektedir.
Şekil 3. Çözelti doğal pH değerinde sentezlenmiş ZnO örneğinin SEM görüntüsü
SONUÇLAR
Sol-jel yöntemi kullanılarak NaOH kullanılarak çinko asetat dihidrattan hekzagonal wurtzite faz yapısına sahip ZnO örneği sentezlenmiştir. XRD ve SEM sonuçları, hekzagonal wurtzite kristal yapısındaki ZnO partikülleri pH 6’da ve 350 oC’de 5 saat kalsinasyon ile gerçekleşmektedir. TEŞEKKÜR
Çalışma Sivas Cumhuriyet Üniversitesi Bilimsel Araştırma Fonu (CUBAP) (M-742) ve TUBITAK (213M398)’ın desteği ile gerçekleştirilmiş olup, her iki kuruma desteklerinden dolayı teşekkür ederim. KAYNAKLAR
Aydin, H., El-Nasser, H. M., Aydin, C., Al-Ghamdi, A. A. ve Yakuphanoglu, F. (2015). Synthesis and characterization of nanostructured undoped and Sn-doped ZnO thin films via sol-gel approach. Applied Surface Science içinde (C. 350, ss. 109–114). doi:10.1016/j.apsusc.2015.02.189

UEMK 2019 Proceedings Book
24/25 October 2019 Gaziantep University, TURKEY 843
Babu, E. S. ve Hong, S. K. (2015). Effect of indium concentration on morphology of ZnO nanostructures grown by using CVD method and their application for H2 gas sensing. Superlattices and Microstructures, 82, 349–356. doi:10.1016/j.spmi.2015.02.029
Eilers, H. ve Tissue, B. M. (1995). Synthesis of nanophase ZnO, Eu2O3, and ZrO2 by gas-phase condensation with cw-CO2 laser heating. Materials Letters, 24(4), 261–265. doi:10.1016/0167-577X(95)00112-3 Hu, J. Q., Ma, X. L., Xie, Z. Y., Wong, N. B., Lee, C. S. ve Lee, S. T. (2001). Characterization of zinc oxide crystal whiskers grown by thermal evaporation. Chemical Physics Letters. doi:10.1016/S0009-2614(01)00720-5
Jézéquel, D., Guenot, J., Jouini, N. ve Fiévet, F. (1995). Submicrometer zinc oxide particles: Elaboration in polyol medium and morphological characteristics. Journal of Materials Research, 10(1), 77–83. doi:10.1557/JMR.1995.0077 Milošević, O. ve Uskoković, D. (1993). Synthesis of BaTiO3 and ZnO varistor precursor powders by reaction spray pyrolysis. Materials Science and Engineering: A, 168(2), 249–
252. doi:10.1016/0921-5093(93)90736-X Nishizawa, H. ve Yuasa, K. (1998). Preparation of highly oriented ZnO thin film under hydrothermal conditions. Journal of Materials Science Letters.
doi:10.1023/A:1006601831316 Stefan, M., Ghica, D., Nistor, S. V., Maraloiu, A. V. ve Plugaru, R. (2017). Mn 2+ ions distribution in doped sol–gel deposited ZnO films. Applied Surface Science, 396, 1880–
1889. doi:10.1016/j.apsusc.2016.02.167 Turgut, G., Duman, S. ve Keskenler, E. F. (2015). The influence of Y contribution on crystallographic, topographic and optical properties of ZnO: A heterojunction diode application. Superlattices and Microstructures, 86, 363–371.
doi:10.1016/j.spmi.2015.08.002 Wang, L. W., Wu, F., Tian, D. X., Li, W. J., Fang, L., Kong, C. Y. ve Zhou, M. (2015). Effects of Na content on structural and optical properties of Na-doped ZnO thin films prepared by sol-gel method. Journal of Alloys and Compounds, 623, 367–373. doi:10.1016/j.jallcom.2014.11.055 Zhou, Z., Deng, H., Yi, J. ve Liu, S. (1999). New method for preparation of zinc oxide whiskers. Materials Research Bulletin. doi:10.1016/S0025-5408(99)00183-X.

UEMK 2019 Proceedings Book
24/25 October 2019 Gaziantep University, TURKEY 844
EFFECT OF AGITATION ON THE PROCESS OF BI METHANIZATION OF SLUDGE FROM LOW-TEMPERATURE WASTEWATER TREATMENT PLANTS
Soukaina AITLAHYANE
Laboratoire génie de l’Environnement, Faculté des sciences et techniques, Université Sultan Moulay Slimane, Béni Mellal
Laboratoire génie de l’Environnement, Equipe de recherche Hydr gie traitement olo et épuration des eaux et changement climatiques, Ecole Hassania des Travaux Publics, [email protected]
Zehor AITYACINE
Laboratoire génie de l’Environnement, Faculté des sciences et techniques, Université Sultan Moulay Slimane, Béni Mellal, [email protected]
Brahim LEKHLIF
Laboratoire génie de l’Environnement, Equipe de recherche Hydrologie traitement et épuration des eaux et changement climatiques, Ecole Hassania des Travaux Publics. [email protected]
Hafida HANINE
Laboratoire de biointerface et biofilm Faculté des sciences et techniques, Université Sultan Moulay Slimane, Béni Mellal, Morocco. [email protected]
ABSTRACT: Wastewater treatment is one of the major environmental problems, particularly in developing countries such as Morocco. Their discharge into the natural environment has negative impacts on water resources and the environment. They are therefore purified to reduce the concentration of the main pollutants. Often biological remediation is used when wastewater contains biodegradable organic pollutants. This generally leads to treated water that can be discharged into the environment reused, or used as wastewater sludge. In the case of domestic or municipal water, this sludge has a fermentable character, which can have negative impacts on the environment especially when it is discharged directly into the environment. This sludge is subjected to various aerobic or anaerobic treatments to reduce the fermentable fraction. Anaerobic treatment seems more attractive because it makes it possible to eliminate organic matter, produce biogas and compost at the same time.

UEMK 2019 Proceedings Book
24/25 October 2019 Gaziantep University, TURKEY 845
In this work, an experimental study was conducted on the anaerobic digestion of sewage sludge in two reactors at ambient temperature, operating with and without agitation, in order to evaluate the effect of the latter on the biological process.
Keywords: Bio-methanization, ambient temperature, agitation, sludge, COD, pH.
INTRODUCTION
Some solid wastes have a fermentable organic fraction which is an environmental problem. Their injection in the environment could be a real threat. Nevertheless, this organic character can be used wisely, by valorizing its potential in value-added products when subjected to anaerobic biological treatment, which, in addition to reducing negative effects (emission of bad odors, methane, mercaptans, etc.), makes it possible to produce biogas and sludge mineralization for soil amendment. This solid waste includes sludge from wastewater treatment plants. They are often disposed of in landfills or dumped into the natural environment. In Morocco, their quantity is estimated at 435.600 tones /year (Elamin s. d.), and have a fermentable organic fraction between 50% and 70% (eva bouille s. d.) ;this is a good source for anaerobic biogas production, consisting mainly of methane 60 to 75%(eva bouill e. d.), the equivalent of 128,000 tons of CH4 per year . The anaerobic biological bio-methanization treatment takes place in four stages (Figure 1). The first step is the hydrolysis of organic matter, such as proteins, fats, cellulose and starch.... These polymers such as amino acids, fatty acids and simple sugars are broken down into monomers.

UEMK 2019 Proceedings Book
24/25 October 2019 Gaziantep University, TURKEY 846
Figure 1. Diagram of the trophic chain of methanogenesis and its different stages (Moletta, 1993)
The second step is acidogenesis, during which the hydrolytes are oxidized to organic acids (e. g. lactates), alcohol (ethanol) or volatile fatty acids (propionate, butyrate and valerate).
In the third step, the resulting acidogenesis compounds are transformed into methane precursor products: acetic acid, carbon dioxide (CO2) and hydrogen (H2).
The fourth step biomethanization, which is done by two ways. One, it called hydrogenotrophic using hydrogenotrophic bacteria that draw their needs from the couple H2/CO2. These Bacteria get their energy from the reduction of carbon dioxide by hydrogen to produce methane according to the following reaction
4H2 + CO2 → CH4 + 2H2O (Reaction 1)
The other way called acetoclast where the strict anaerobic bacteria known as acetates, which extract their needs from the acetates, use acetate as their only carbon source (Reaction 2).
CH3COOH → CH4 + CO2 (Reaction 2)
The anaerobic process is a complex process Controlled by physico-chemical conditions such as the nature of the substrate, temperature, pH, agitation, etc. for instance, psychophilic digestion is optimal between in a temperature range around 6and 15°C, while mesophilic digestion in a range between 30-35°; for thermophilic anaerobic digestion, it is favored and most effective in temperatures above 45° because the reaction is accelerated by heat. However, anaerobic digestion is often used at mesophilic conditions, a compromise between performance and energy costs due to heating and especially because of its greater stability (LASKRI Nabila , Dépollution des déchets riches en matière organique (boues de station d’épuration et déchets d’abattoir) Par digestion anaérobie s. d.).
The anaerobic fermentation takes place in a pH range between 5.5 and 8 for all phases. For the acidogenesis phase, it is between 5.5 and 6.5 (Souza et al. 2012), for acetogenesis, it is near neutrality .For methanogens, the pH range is between 6 and 8 (Gourdon s. d.).

UEMK 2019 Proceedings Book
24/25 October 2019 Gaziantep University, TURKEY 847
Agitation plays an important role in the anaerobic metabolic process. It ensures a good mixture, which improves the contact between the purifying bacteria and the sludge (Borole et al. 2006). Many studies have shown the importance of agitation on the fermentation process ; in the first hand JOHAN LINDMARK (Lindmark, Eriksson, et Thorin 2014) evaluated the effect of mixing by comparing tress régimes of mixing 150 RPM, 25 RPM and continuous mixing ; The results show that the biogas production is better with a speed of 25 RPM which reaches 240 Nml , while the speed of 150 RPM give a lower production of biogas ; the author found that strong agitation inhibits the anaerobic fermentation process.
In the second hand HAJJI(Hajji et Rhachi 2016) studied the influence of agitation on biogas production by comparing two reactors with and without agitation; he found a biogas production rate of a reaches a value of about 0.61m3/for a reactor of 40 rpm, then in the reactor without agitation the final volume of the final biogas is reduced to reduce up to 62%, most of these methanisation plants operate at temperatures of 37 or 55 °C, however MINDELE UKONDALEMBA(Ukondalemba et al. 2016) studied an anaerobic digestion with recirculation (type of agitation) of juice in the hydrolysis phase and acidogens at an ambient temperature of 25°C, results showed that 83% of the COD transformed into biogas.
This study aimed at studying the biomethanization of sludge from a wastewater treatment plant at ambient temperature. The objective is to evaluate the effect of agitation (agitated versus no agitated reactors) on the anaerobic biological process by comparing two identical reactors.
MATERIEL AND METHODS
Origin and characterization of the substrate
The sludge samples collected from a sludge wastewater treatment plant of the ONEE ("National Office of Water and Electricity ") of BOUREREG in Rabat-Morocco. This station receives discharges at an average rate = 86.4 m3/d, and a peak flow rate = 259.2 m3/d; these discharges have the following characteristics: COD = 15.1 Kg/d, BOD5 = 9.0 Kg/d, mean TSS = 16.2 Kg/d. It is a station that produces between 7 kg/d to 10 m3/d of fresh liquid sludge in the open air on drying beds and then stocked.
Before their use, the dry sludge (Picture 1) was crushed and screened to generate small particles for better homogenization of the medium. To do this, the samples were spread on rectangular plates covered with filter paper, in the open air, then ground and sieved to obtain a homogeneous powder with a grain size of less than 2mm.

UEMK 2019 Proceedings Book
24/25 October 2019 Gaziantep University, TURKEY 848
Sludge characterization
Before use, the dry sludge (Picture 1) was crushed and sieved to obtain a homogeneous powder with a grain size of less than 2mm. Masses of 5 g of these sludge are added to 125 ml of distilled water. The mixture is then agitated every 15 min and then rested every 15 min for one hour (Imane s. d.) .
The mixture is recovered to determine the following parameters:
- The hydrogen potential (pH) is measured by using a multi-Parameter probe.
- The suspended matter has a centrifugation method,
- The electrical conductivity,
- Dissolved oxygen,
- Organic matter
- The chemical oxygen demand (COD) was determined according to the standard method (AFNOR T-101)[12]
- Metal measurement: ICP-AES
Batch digester operation
The experimental system (Figure 2) used for the anaerobic digestion of sludge consists of two opaque plastic tanks each with a volume of 30 L. Each tank was filled with 1,350 kg of dry sludge at a rate of (50 g/L). The tests were conducted at an average ambient temperature of 18°C for 40 days. In the reactor, agitation is ensured by using a mechanically controlled agitation motor with a speed of 40 rpm (Kalloum, Khelafi, et Djaafri s. d.).
The follow-up was made by daily samples of 50 ml from the reactors. The test was run during the month of February.

UEMK 2019 Proceedings Book
24/25 October 2019 Gaziantep University, TURKEY 849
Figure 2 . Reactor for methanogenic digestion
RESULTS AND FINDINGS
Physical and Chemical Characteristics of Sludge
Table 1 presents the characteristics of the sludge from the BOUREGREGREG wastewater treatment plant.
Table 1 . Physical and chemical characteristics of the sludge from the BOUREGREGREG wastewater treatment plant
pH Electrical conductivity (mS/cm)
Temperature (°C)
Dryness COD (gO2/l)
Dry volatile matter (DVC)
Dissolved oxygen O2 mg/l
6,82
2,74
18
89,03%
10,89
63%
8,72
Elements Cd Ca Cr Cu Fe K Mg
Mn
Na Ni Zn Co P Pb Ba Al
Concentrations
3,023
71720
28,65
157,7
15470
1301
8808
252,4
1087
18,65
1652
4,077
-- 138,5
518,6
7125

UEMK 2019 Proceedings Book
24/25 October 2019 Gaziantep University, TURKEY 850
These results show that the sludge has a COD of 10.89 g/l, and contains a number of metals of significant concentrations, in this case Ca (71720 mg/L), Fe (15470 mg/L), Mg (8808 mg/L), Al (7125 mg/L) and to a lesser extent K (1301 mg/L), Na (1087 mg/L) and Zn (1652 mg/L). The organic matter content is 63%. The typology of this sludge is similar to that of domestic or municipal wastewater treatment plants (Choo-Kun s. d.) (Mehrez, Kalloum, et Khelifi s. d.) .
The evolutions of the different parameters of monitoring are presented in Figure 3. The analysis of some parameters shows differences indicating different kinetics of the biomethanization process in the two reactors.
The Temperature Variation
The temperature data shows a same trend between the two samples. The values vary between 15°C and 20°C. However, it is noted that temperature was higher in the agitated reactor.
The pH Variation
The pH profile shows two phases: the first probably corresponding to the hydrolysis and acetogenesis phase; the pH increases from 6.82 to 5.8 in the unagitated bioreactor and from 6.82 to 6.2 in the agitated bioreactor (Zhai et al. 2015) (Kalloum, Khelafi, et
Djaafri s. d.), the second corresponding to the biomethanization phase; the pH increases from 5.8 to 6.5 in the unagitated bioreactor and from 6.2 to 7.5 in the agitated bioreactor. The agitated bioreactor has good pH conditions. This can be explained by a better use of volatile fatty acids (VFAs) by heterotrophic bacteria following their contact with the substrate enhanced by agitation process , as was highlighted by many authors (Mehrez, Kalloum, et Khelifi s. d.)(Monou et al. 2009). It can also be explained by the effects of agitation in favour of the emission of gases formed during the various stages of anaerobic fermentation, including in particular acidic materials: CO2, volatile fatty acids, H2S, etc. The partial hydrogen pressure is particularly important in the process. Excessively high hydrogen content prevents the conversion of intermediate products from being converted. As a result, organic acids accumulate and prevent the formation of methane (Wandrey et Aivasidis , 1983 Zur Reaktionstechnik der anaeroben Fermentation.pdf s. d.) ; Hydrogen sulphide has an inhibiting effect on methane formation. The inhibition thresholds encountered in methanogenic bacteria
Unit ppm
ppm
ppm
ppm
ppm
ppm
ppm
ppm
ppm
ppm
ppm
ppm
ppm
ppm
mg/L
mg/L

UEMK 2019 Proceedings Book
24/25 October 2019 Gaziantep University, TURKEY 851
vary according to the type of substrate and physicochemical conditions and range from 50 to 1000 mg/L.
The Variation of COD
The COD decreases for both bioreactors. This decrease is relatively more significant for the agitated bioreactor. The abatement rates achieved after 40 days are 60% and
81% respectively for the unagitated and agitated bioreactors. This difference is probably due to agitation, which on the one hand allows the organic matter and the purifying microorganisms present in solution to be mixed, as pointed out HAOQIN ZHOU AND ZHIYOU (Zhou et Wen - 2019 - Solid-State Anaerobic Digestion for Waste Manageme.pdf s. d.), and on the other hand to facilitate the liberation and disengagement that can remain trapped in the solid raw material HAOQIN ZHOU AND ZHIYOU (Zhou et Wen - 2019 - Solid-State Anaerobic Digestion for Waste Manageme.pdf s. d.), such as hydrogen formed during the acetogenesis step and H2S which can be generated by sulfate-reducing bacteria, both inhibitors of bacterial activity and particular for methanogenic bacteria with respect to hydrogen).
The work done by S. KALLOUM (Kalloum et Iddou - Utilisation du procédé de la digestion anaérobie p.pdf s. d.) by using manual agitation showed a significant reduction in the COD of sludge to conclude that anaerobic digestion is an efficient s method for the reduction of organic pollution and that the most of the organic matter that is present in the digester is biodegradable. SAMANTHA CRISTINA PINHO (Pinho et al. 2004) has confirmed that the agitation rate plays an important role in the solubilization of suspended organic matter. As well as the acceleration of the degradation of the COD in suspension. The same results were reported by I. MEHREZ (Mehrez, Kalloum, et Khelifi s. d.) T. Ahmed (Ahmed et al. s. d.) .
Variation of dissolved oxygen
The dissolved oxygen concentration values reflect the correct performance of anaerobic digestion in both bioreactors. By the third day, this concentration decreases below the value required for anaerobic conditions. It then reaches an average concentration of 0.3 mg/l. this value is comparable to what is being reported by other authors (Botheju - 2011 - Oxygen Effects in Anaerobic Digestion – A Review.pdf s. d.).
Variation of Conductivity
Electrical conductivity data showed an increase throughout the anaerobic fermentation process. This could be due to the appearance of small species of high ionic mobility and/or mineralization of the environment. This is more pronounced in the case of the agitated bioreactor. EL HAFIANE (el hafiane. d.) reported that

UEMK 2019 Proceedings Book
24/25 October 2019 Gaziantep University, TURKEY 852
conductivity increases from the inlet to the outlet of the reactor, indicating progressive mineralization of the medium.

UEMK 2019 Proceedings Book
24/25 October 2019 Gaziantep University, TURKEY 853
CONCLUSIONS
The comparative psychrophilic anaerobic fermentation tests between two unagitated and agitated bioreactors have shown conclusive results regarding the role of agitation.
Indeed, the monitoring parameters: pH, COD, temperature, conductivity highlighted the effect of agitation. The anaerobic fermentation processes are to the advantage of the agitated reactor. The agitation promotes the homogenization of the reactor and a good mixing between the substrate and the purifying bacteria. It also makes it possible to break the layer of solid products that can float on the surface of the solution and thus prevent the escape of certain gases such as AGV, CO2, H2, H2S, which by their presence also make the medium acid and/or inhibit the activity of certain bacteria including methanogenic bacteria.
REFERENCE
Ahmed, TAHRI et al. « PRODUCTION DE BIOGAZ A PARTIR DU DECHET DE LA POMME DE ». : 6.
Borole, Abhijeet P et al. 2006. « Methane Production in a 100-L Upflow Bioreactor by Anaerobic Digestion of Farm Waste ». Applied Biochemistry and Biotechnology 129: 10.
Botheju - 2011 - «Oxygen Effects in Anaerobic Digestion – A Review.pdf ».
UEMK 2019 Proceedings Book
24/25 October 2019 Gaziantep University, TURKEY 854
Choo-Kun, Marlène. « Intégration de la méthanisation des boues dans une filière alternative de traitement des eaux usées basée sur le procédé A/B: Vers la station d’épuration à énergie positive ». : 171.
EL HAFIANE, «Performances d’un système anaérobie à deux phases dans.pdf ».
Elamin, Pr AFILAL Mohamed. « Potentiel des déchets organiques et valorisation énergétique au Maroc ». : 12.
Eva BOUILLE 2004. « VA ». http://hmf.enseeiht.fr/travaux/CD0405/beiere/4/html/binome3/boue_met.htm (18 juillet 2019).
Gourdon, R. « Aide à la définition des déchets dits biodégradables, fermentescibles, méthanisables, compostables ». : 153.
Hajji, A, et M Rhachi. 2016. « Effet de l’agitation sur la digestion anaérobie des déchets ménagers et assimilés en régime mésophile ». : 8.
Imane, Melle HAMDANI. « Gestion des boues des stations d’épuration au Maroc : Quantification, caractérisation et options de traitement et de valorisation ». : 116.
Kalloum et Iddou -« Utilisation du procédé de la digestion anaérobie p.pdf ».
Kalloum, S, M Khelafi, et M Djaafri. « Etude de l’influence du pH sur la production du biogaz à partir des déchets ménagers ». : 5.
LASKRI Nabila , «Dépollution des déchets riches en matière organique (boues de station d’épuration et déchets d’abattoir) Par digestion anaérobie ».
Lindmark, Johan, Per Eriksson, et Eva Thorin. 2014. « The Effects of Different Mixing Intensities during Anaerobic Digestion of the Organic Fraction of Municipal Solid Waste ». Waste Management 34(8): 1391‑97. https://linkinghub.elsevier.com/retrieve/pii/S0956053X14001469 (19 juillet 2019).
Mehrez, I, S Kalloum, et O Khelifi. « Study of Biogas Production from Lagooning Sludge by Anaerobic Digestion ». : 6.
Monou, M., N. Kythreotou, D. Fatta, et S.R. Smith. 2009. « Rapid Screening Procedure to Optimise the Anaerobic Codigestion of Industrial Biowastes and Agricultural Livestock Wastes in Cyprus ». Waste Management 29(2): 712‑20. https://linkinghub.elsevier.com/retrieve/pii/S0956053X0800189X (30 juillet 2019).
Pinho, Samantha Cristina et al. 2004. « Influence of the Agitation Rate on the Treatment of Partially Soluble Wastewater in Anaerobic Sequencing Batch Biofilm Reactor ». Water Research 38(19): 4117‑24. https://linkinghub.elsevier.com/retrieve/pii/S0043135404004129 (30 juillet 2019).
Souza, Milena Alves de et al. 2012. « Anaerobic Bio-Digestion of Concentrate Obtained in the Process of Ultra Filtration of Effluents from Tilapia Processing Unit ». Revista Brasileira de Zootecnia 41(2): 242‑48. http://www.scielo.br/scielo.php?script=sci_arttext&pid=S1516-35982012000200002&lng=en&tlng=en (19 juillet 2019).

UEMK 2019 Proceedings Book
24/25 October 2019 Gaziantep University, TURKEY 855
Ukondalemba, Léonard Mindele et al. 2016. « [ VALORIZATION OF ORAGANIC HOUSEHOLD WASTE AND SEPTIC TANK SLUDGE BY ANAEROBIC DIGESTION ] ». 20(2): 10.
Eva BOUILLE 2004. « Valorisation des boues de la station d’épuration en biogaz ». http://hmf.enseeiht.fr/travaux/CD0405/beiere/4/html/binome3/biogaz.htm (18 juillet 2019).
Wandrey et Aivasidis , 1983 « Zur Reaktionstechnik der anaeroben Fermentation.pdf ».
Zhai, Ningning et al. 2015. « Effect of Initial PH on Anaerobic Co-Digestion of Kitchen Waste and Cow Manure ». Waste Management 38: 126‑31. https://linkinghub.elsevier.com/retrieve/pii/S0956053X15000082 (19 juillet 2019).
Zhou et Wen - 2019 - «Solid-State Anaerobic Digestion for Waste Manageme.pdf ».

UEMK 2019 Proceedings Book
24/25 October 2019 Gaziantep University, TURKEY 856
TREND ANALYSIS OF MONTHLY MEAN STREAMFLOW DATA WITH
MANN-KENDALL AND INNOVATIVE ŞEN METHOD IN PAMUKLUK RIVER
DILAVER BRIDGE STATION
Yavuz AVŞAROĞLU
Harran University, Faculty of Engineering, Civil Engineering Department
Veysel GÜMÜŞ
Harran University, Faculty of Engineering, Civil Engineering Department
Oğuz ŞİMŞEK
Harran University, Faculty of Engineering, Civil Engineering Department
ABSTRACT: In this study, the trend of monthly mean streamflow values of D26A008 streamflow gauge station (named as " Pamukluk Deresi Dilaver Köprüsü”) in Tigris Basin, which is one of the most important basin of Turkey, is determined by non-parametric Mann-Kendall and Innovative Trend Analysis (ITA) methods. Trend slopes are determined by Sen's trend slope method. The results of the study show that according to Mann-Kendall test, a significant decreasing trend in March and a significant increasing trend in August are detected. The highest decreasing slope is calculated as -1.0765 m3/s/decade in March with Sen’s slope method. According to ITA method, generally there is no change in low streamflow values, but a decreasing trend is observed in average and high streamflow values. Also, the result of ITA analysis for the monthly and annual mean streamflow values, generally increasing trends are determined in October, November, August and September, and generally decreasing trend is observed In April, May and June.
Key words: Tigris basin, trend analysis, Mann-Kendall method, Innovative Trend Analysis

UEMK 2019 Proceedings Book
24/25 October 2019 Gaziantep University, TURKEY 857
PAMUKLUK DERESİ DİLAVER KÖPRÜSÜ İSTASYONU AKIM DEĞERLERİNİN MANN-KENDALL VE YENİLİKÇİ ŞEN YÖNTEMLERİYLE TREND ANALİZİ
ÖZET: Bu çalışmada, Türkiye’nin en önemli havzalarından biri olan Dicle Havzası’nda bulunan D26A008 numaralı “Pamukluk Deresi Dilaver Köprüsü” akım gözlem istasyonuna ait aylık ortalama akım değerlerinin trendi parametrik olmayan Mann-Kendall testi ve Yenilikçi Şen yöntemi (Innovative Trend Analysis-ITA) ile belirlenmiştir. Trend eğimleri Sen’in trend eğim metodu ile belirlenmiştir. Çalışma sonucunda, Mann-Kendall testine göre, mart ayında azalan, ağustos ayında ise artan yönde anlamlı trend varlığına rastlanmıştır. Sen’in trend eğim metoduna göre elde en yüksek azalma miktarı, mart ayında -1.0765 m3/s/10yıl olarak bulunmuştur. ITA yöntemine göre düşük akım değerlerinde genel olarak bir değişim olmadığı, ancak orta ve yüksek akım değerlerinde bir azalma eğilimi gözlenmiştir. Aylık ve yıllık ortalama akım değerlerine göre ise ekim, kasım, ağustos ve eylül aylarında genel olarak artan yönde; nisan, mayıs ve haziran aylarında ise genel olarak azalan yönde bir eğilim görülmüştür.
Anahtar sözcükler: Dicle havzası, trend analizi, Mann-Kendall yöntemi, Yenilikçi Şen yöntemi
GİRİŞ
Sera gazı emisyonları düzenli bir şekilde artmakta ve küresel ısınma ile hidrolojik ve meteorolojik olaylar üzerinde iklim değişikliğinin etkisi belirgin bir şekilde görülmektedir. Taşkın ve kuraklık gibi olağanüstü durumlara karşı su yönetiminde
önlemler alabilmek için hidrolojik ve meteorolojik verilerin eğilimlerinin bilinmesi gerekmektedir. Hidro-meteoroloji verilerin eğilimlerinin belirlenesinde parametrik olmayan yani veri setinin herhangi bir dağılıma uyma zorunluluğu aramayan testlerin başında gelen Mann-Kendall (MK) (Mann, 1945, Kendall, 1975) dünyada farklı bölgelerde sıklıkla kullanılmaktadır (Yenigün ve ark, 2008, Gocic ve Trajkovic, 2013; Ahmad ve ark., 2015; Ahmadi ve ark., 2018; Hadi ve Tombul, 2018, Gümüş, 2019 ). Bu testin yanında trendlerin eğimlerinin belirlenmesinde yine parametrik olmayan Sen'in trend eğim metodu da (Sen, 1968) kullanılmaktadır (Yenigün ve ark, 2008, Gümüş, 2019).
Öte yandan, Şen (2012) tarafından önerilen 1: 1 düz çizgi (45 °) yapısı ile kullanılan Yenilikçi Şen yöntemi (Innovative Trend Analysis-ITA) yöntemi, diğer trend yöntemlerinden farklı olarak monotonik trend değeri vermek yerine daha açıklayıcı bir yaklaşım ortaya koymaktadır. Son yıllarda sıklıkla kullanılana bu yöntem verilerin trendlerini değer bazlı ve grafiksel olarak ortaya koymaktadır. Örneğin, Sonali ve

UEMK 2019 Proceedings Book
24/25 October 2019 Gaziantep University, TURKEY 858
Kumar (2013), ITA yöntemi dahil olmak üzere farklı trend analizi yöntemlerini kullanarak Hindistan'daki sıcaklık trendlerini tespit etmiştir. Ayrıca, Saplıoğlu ve ark. (2014), Türkiye'nin batı Akdeniz havzasındaki akımları, Dabanlı ve ark. (2016) ise Türkiye'deki Ergene havzasındaki hidro-meteorolojik kayıtların trendlerini Mann-Kendall testi ve ITA yöntemleri ile belirlemişlerdir.
Bu çalışma kapsamında, Dicle Havzası’nda yer alan D26A008 numaralı “Pamukluk Deresi Dilaver Köprüsü” istasyonuna ait aylık akım verileri kullanılarak aylık ve yıllık ortalama değerlerin parametrik olmayan Mann-Kendall ve sonuçları grafiksel olarak veren ITA yöntemine göre yapılmıştır. Ayrıca trend eğimleri Sen’in trend eğim metoduna göre belirlenmiştir.
ÇALIŞMA ALANI
Bu çalışmada Dicle Havzası’nda bulunan ve DSİ (Devlet Su İşleri) tarafından işletilen D26A008 numaralı “Pamukluk Deresi Dilaver Köprüsü” isimli akım gözlem istasyonuna ait aylık ortalama akım verileri kullanılarak trend analizi yapılmıştır
(Şekil 1). Kullanılan bu istasyona ait veri aralığı 1974-2015 yılları arasında olup, istasyon 40°14'0" (D) - 37°40'0" (K) koordinatlarında bulunmaktadır. D26A008 istasyonu 702 m yükseklikte bulunmakta ve 648 km2’lik bir yağış alanını temsil etmektedir.
Şekil 1. Çalışma Alanı
UEMK 2019 Proceedings Book
24/25 October 2019 Gaziantep University, TURKEY 859
YÖNTEM
Hidrolojik büyüklükler (yağış, akış) zaman içinde rasgele değişen karakterde olduğundan sürekli bir azalma veya artma eğiliminin araştırılması özel yöntemler kullanmayı gerektirir (Helsel ve Hirsch, 1992).
Veri setinin herhangi bir dağılıma uyma zorunluluğu olmaması nedeniyle, parametrik olmayan testlerin kullanılması parametrik testlere oranla daha uygundur. Parametrik olmayan trend testlerinin uygulanabilmesi için ise zaman serisinin iç bağımlılığının yani seri korelasyonun olmaması gerekmektedir. Von Storch ve Navarra (1995) trend varlığını belirlemek için kullanılacak testi uygulanmadan önce iç bağımlılığın zaman serisinden kaldırılması için “pre-whitening” yöntemini önermektedir. Bu çalışma kapsamında Salas (1980) tarafından önerilen yöntem ile iç bağımlılık etkisi giderilmiştir.
İç bağımlılık etkisi giderilmiş akım verilerine Mann-Kendall (Mann, 1945; Kendall, 1948) ve ITA (Şen, 2012) yöntemleri ile trend analizi yapılmış, trend eğimleri Sen’in trend eğim metoduna (Sen, 1968) göre belirlenmiştir.
BULGULAR
Diyarbakır-Mardin yolunun 8. km'sinde bulunan ve DSİ tarafından işletilen D26A008 numaralı istasyonun, 1974-2015 yılları arasındaki 42 yıla ait akım değerlerinin aylık zamansal değişimleri Şekil 2’de verilmiştir. Buna göre mart ayı, akımın en fazla geldiği ay olarak, ağustos ayı ise akımın en az geldiği ay olduğu görülmektedir. Ayrıca D26A008 numaralı istasyonumuzda ekim, kasım, haziran, temmuz, ağustos ve eylül aylarında, ölçüm alınan derenin kuru olduğu, yani akım değerinin 0 olduğu yıllar
belirlenmiştir. Buna göre, en fazla kuru yıl 14 yıl ile ağustos ayında, en yüksek akım değeri 18.76 m3/s ile 1976 yılının nisan ayında ölçülmüştür. Ayrıca Şekil 2’ye göre, en yüksek doğrusal eğim -0.145 ile mart ayında, en düşük eğim değeri ise 0.0003 ile temmuz ayında belirlenmiştir.
Trend analizi yapılmadan önce akımlarda iç bağımlılık etkisinin belirlenebilmesi için Salas ve ark. (1980) tarafından önerilen yöntem ile iç bağımlılığın olup olmadığı belirlenmiş ve iç bağımlılık belirlenen verilerde iç bağımlılık etkisi giderilmiştir. Salas ve ark. (1980) yöntemine göre elde edilen seri korelasyon değerlerinin veriler için dağılımı Şekil 3’te verilmiştir. Buna göre, D26A008 istasyonunda ağustos ve eylül aylarında iç bağımlılık belirlenmiş ve iç bağımlılık etkisi giderilmiştir. Tablo 1’de, iç bağımlılık etkisi giderilmiş verilere ait parametrik olmayan Mann-Kendall yöntemiyle elde edilen trend analizi sonuçları ile, Sen’in trend eğim metodu ile elde edilen trend eğimleri verilmiştir. Aynı sonuçların grafiksel gösterimleri Şekil 4’te verilmiştir. Buna

UEMK 2019 Proceedings Book
24/25 October 2019 Gaziantep University, TURKEY 860
göre, mart ayında %95 güven aralığında azalan, ağustos ayında ise artan yönde anlamlı trend varlığına rastlanmıştır. Nisan ayında ise sadece Mann-Kendall yöntemine göre ve %90 güven aralığında azalan yönde trend belirlenmiştir.
Şekil 2. Akım Değerlerinin Zamansal Değişimi
Tablo 1. Trend Analizi Sonuçları

UEMK 2019 Proceedings Book
24/25 October 2019 Gaziantep University, TURKEY 861
Dönem Mann-Kendall
(Z)
Trend Eğimi (m3/s/yıl)
Anlamlı Trend
Ekim 1.395 0.00043 Yok
Kasım 0.954 0.00164 Yok
Aralık -0.249 -0.00236 Yok
Ocak 0.022 0.00155 Yok
Şubat 0.195 0.00514 Yok
Mart -2.233 -0.10765 Var (↓) %95
Nisan -1.647 -0.04411 Var (↓) %90
Mayıs -1.062 -0.00610 Yok
Haziran -0.932 -0.00073 Yok
Temmuz 1.048 0.00006 Yok
Ağustos 2.242 0.00009 Var (↑) %95
Eylül 1.001 0.00017 Yok
Yıllık Ort. -0.650 -0.00866 Yok
Şekil 5’te ise Sen’in trend eğim metoduna göre, aylara göre elde edilen trend eğim değerleri 10 yıllık sürede değişimi verilmiştir. Buna göre 10 yıllık en yüksek azalma miktarı, mart ayında -1.0765 m3/s olarak bulunmuş ve bu değerin elde edilen doğrusal trend değerleri ile paralel olduğu belirlenmiştir.
Akım değerlerinin trendinin belirlenmesi için parametrik olmayan Mann-Kendall yönteminin yanında ITA yöntemi de kullanılmıştır. Bu bağlamda, tüm akım değerlerinin ITA yöntemine göre sonuçları Şekil 6’da verilmiştir. Buna göre, yaklaşık olarak 0-5 m3/s arasında olan düşük akım değerlerinde genel olarak bir değişim olmadığı, ancak 5-12 m3/s arasındaki orta akım değerlerinde ve 12-20 m3/s arasındaki yüksek akım değerlerinde bir azalma eğilimi gözlenmektedir.
Şekil 3. Seri Korelasyon Sonuçları

UEMK 2019 Proceedings Book
24/25 October 2019 Gaziantep University, TURKEY 862
Şekil 4. Akım Değerlerinin Trend Analizi Sonuçları
Şekil 5. Akım Değerlerinin Trend Eğim Değerleri
Şekil 6. Tüm akım değerlerinin ITA yöntemi ile trend analizi
Şekil 7’de ITA yöntemine göre aylık akım değerlerinin analizi verilmiştir. Buna göre, ekim, kasım, ağustos ve eylül aylarında genel olarak artan yönde; nisan, mayıs ve haziran aylarında ise genel olarak azalan yönde bir eğilim görülmüştür. Şekil 7’ye göre, aralık ayında 3 m3/s’nin, ocak ayında 4 m3/s, şubat ayında 6 m3/s üstündeki
değerlerde bir artma, mart ayında 5 m3/s‘nin üzerindeki değerlerde ise bir azalma eğilimi belirlenmiştir. Temmuz ayı ve yıllık ortalama için genel olarak akım değerleri 45o’lik çizgi üzerinde olduğu, yani herhangi bir trend varlığının olmadığı sonucuna varılmıştır.
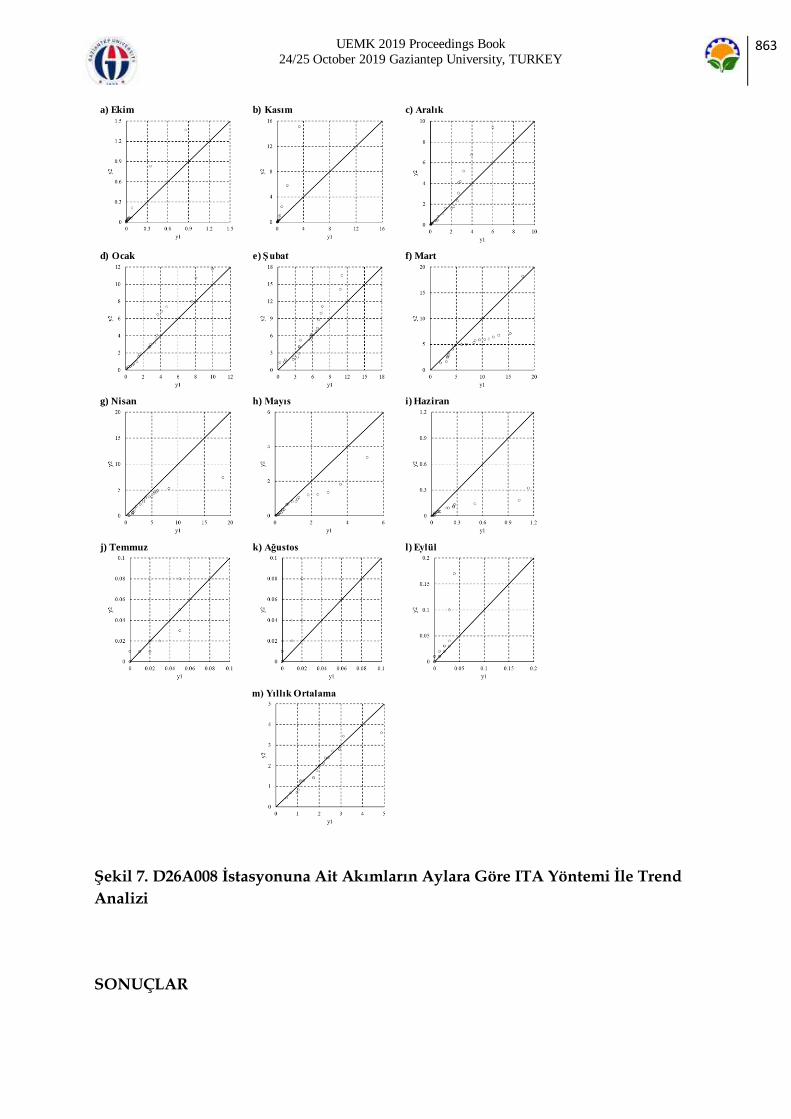
UEMK 2019 Proceedings Book
24/25 October 2019 Gaziantep University, TURKEY 863
Şekil 7. D26A008 İstasyonuna Ait Akımların Aylara Göre ITA Yöntemi İle Trend
Analizi
SONUÇLAR
a) Ekim
b) Kasım
c) Aralık
d) Ocak
e) Şubat
f) Mart
g) Nisan
h) Mayıs
i) Haziran
j) Temmuz
k) Ağustos
l) Eylül
m) Yıllık Ortalama
UEMK 2019 Proceedings Book
24/25 October 2019 Gaziantep University, TURKEY 864
Bu çalışmada Dicle Havzası’nda yer alan D26A008 numaralı “Pamukluk Deresi Dilaver Köprüsü” istasyonuna ait aylık akım verileri kullanılarak, aylık ve yıllık ortalama değerlerin trend analizi parametrik olmayan Mann-Kendall ve ITA yöntemlerine göre yapılmıştır. Ayrıca trend eğimleri Sen’in trend eğim metoduna göre belirlenmiş ve elde edilen sonuçlar aşağıda kısaca özetlenmiştir. Buna göre;
En yüksek doğrusal eğim -0.145 ile mart ayında, en düşük eğim değeri ise 0.0003
ile temmuz ayında belirlenmiştir.
Akımlarda iç bağımlılığın olup olmadığı belirlenmiş ve iç bağımlılık belirlenen verilerde iç bağımlılık etkisi giderilmiştir.
MK yöntemine göre, mart ayında %95 güven aralığında azalan, ağustos ayında ise artan yönde anlamlı trend varlığına rastlanmıştır. %90 güven aralığında ise nisan ayında azalan yönde anlamlı trend varlığına rastlanmıştır.
Sen’in trend eğim metoduna göre elde edilen eğim değerleri incelendiğinde 10 yıllık en yüksek azalma miktarı mart ayında -1.0765 m3/s olarak bulunmuş ve bu değerin elde edilen doğrusal trend değeri ile paralel olduğu belirlenmiştir.
ITA yöntemine göre tüm akım değerleri beraber değerlendirildiğinde yaklaşık olarak 0-5 m3/s arasında olan düşük akım değerlerinde genel olarak bir değişim olmadığı, ancak 5-12 m3/s arasındaki orta akım değerlerinde ve 12-20 m3/s arasındaki yüksek akım değerlerinde bir azalma eğilimi gözlenmiş, aylık ve yıllık ortalama değerler ayrı ayrı değerlendirildiğinde ise ekim, kasım, ağustos ve eylül aylarında genel olarak artan yönde; nisan, mayıs ve haziran aylarında ise genel olarak azalan yönde bir eğilim görülürken temmuz ayı ve yıllık ortalama için genel olarak akım değerleri 45o’lik 1:1 çizgisi üzerinde olduğu, yani herhangi bir trend varlığının olmadığı sonucuna varılmıştır.
TEŞEKKÜR
Bu çalışma Harran Üniversitesi Bilimsel Araştırma Projeleri Koordinasyon Birimi (HÜBAP) tarafından desteklenmiştir (Proje No:18196).
KAYNAKLAR
Ahmad, I., Tang, D., Wang, T., Wang, M. & Wagan, B. (2015). Precipitation trends over time using Mann–Kendall and Spearman's rho tests in Swat River basin, Pakistan. Advances
in Meteorology, 2015, 1–15.
Ahmadi, F., Nazeri Tahroudi, M., Mirabbasi, R., Khalili, K. & Jhajharia, D. (2018). Spatiotemporal trend and abrupt change analysis of temperature in Iran. Meteorological Applications, 25(2), 314–321.

UEMK 2019 Proceedings Book
24/25 October 2019 Gaziantep University, TURKEY 865
Gocic, M. & Trajkovic, S. (2013). Analysis of changes in meteorological variables using Mann–Kendall and Sen's slope estimator statistical tests in Serbia. Global and Planetary
Change, 100, 172–182.
Gumus, V. (2019). Spatio‐temporal precipitation and temperature trend analysis of the Seyhan–Ceyhan River Basins, Turkey. Meteorological Applications, 26(3), 369-384.
Hadi, S.J. & Tombul, M. (2018). Long‐term spatiotemporal trend analysis of precipitation and temperature over Turkey. Meteorological Applications, 25, 445–455.
Helsel, D. R., & Hırsch, R. M. (1992). Statistical methods in water resources (Vol. 49). Elsevier.
Kendall, M. G. (1948). Rank correlation methods, Griffin: London, England. 160s.
Mann, H. B. (1945). Econometrica: Journal of the Econometric Society: 245-259.
Salas, J. D., Delleur, J.W., Yevjevich, V.M. & Lane, W.L. (1980). Applied Modeling of Hydrologic Time Series, Water Resources Publications: Littleton, Colorado, USA, 484s
Sen, P. K. (1968). Estimates of the regression coefficient based on Kendall's tau. Journal of the American statistical association, 63(324): 1379-1389.
Şen, Z. (2012). Innovative trend analysis methodology. Journal of Hydrologic Engineering,
17(9): 1042-1046.
Von Storch, H. & Navarra, A. (1995). Analysis of Climate Variability-Applications of Statistical Techniques. Springer-Verlag, New York; 334s.
UEMK 2019 Proceedings Book
24/25 October 2019 Gaziantep University, TURKEY 866
CARBON FOOTPRINT ANALYSIS OF A RESIDENTIAL BUILDING
Adem ATMACA
Energy Systems Engineering, Faculty of Engineering, University of Gaziantep, 27310 Gaziantep, Turkey, [email protected]
ABSTRACT: It is important to evaluate the regional environmental impacts and related carbon footprint (CFP) of residential buildings globally. This paper contains a review of the related studies by assessing the construction materials, maintenance of the building, and destruction stages in a 50-year of life cycle. It is seen that, the emissions of the buildings should be decreased by around 10% by the implementation of some basic low-carbon strategies. The results show that the emissions considerably depend on the behavioral factors of residents of a country.
Keywords; CO2 emissions, construction sector, energy analysis, environmental asssessment.
1. INTRODUCTION
The carbon dioxide emissions in the World have increased dramatically. Energy efficiency in construction sector has been one of the most important issue about climate change problem (Christopher and Weber, 2008). Energy consumption in buildings in EU reduced by 9.2% between 2001-2011. However, energy use in residential buildings in Turkey has been raised by around 50% in this period. Around 32% of the energy is consumed by buildings in Turkey.
Calculating the CFP in a life cycle perspective is very important. Environmental effects must be calculated over lifetime including all sub components effecting energy consumption of a housing.
Present studies are mostly dealing with the energy and CO2 emissions related to the manufacturing of building materials, the use stage and demolition of the constructions.

UEMK 2019 Proceedings Book
24/25 October 2019 Gaziantep University, TURKEY 867
2. LITERATURE REVIEW
There are many LCA studies all around the world (Fava, 2006; Buyle et al., 2013).
Ceullar and Azapagic (2012) focused on buildings in the United Kingdom. LC phases are measured, containing construction of the building, operation and destruction after 50 years. They found that the operational stage has the biggest impact to the amount of energy use.
There are important studies about constructions in Taiwan (Liu, 2019). They calculated the energy consumption of a hose 33.01 kWh per m2 year. The day-to-day energy use is the largest contributor to the CFP, and has the highest CFP at about 60.7% of the total.
The literature survey is summarized in Table 1.
Table 1
The studies around the World.
Ref. Place Year Type
Emissions
(kg CO2/m2/year)
Embodied energy
(GJ/m2/year)
Cumulative energy
(GJ/m2/year)
Newton et al. (2000)
UK 80 - - 5.2 115
Adalberth et al. (2001)
Sweden 50 Residential 30 2.2-9.8 21.9-32.7
Suzuki & Oka (1998)
Japan 40 Residential 110.7 - -

UEMK 2019 Proceedings Book
24/25 October 2019 Gaziantep University, TURKEY 868
Thormark (2002)
Sweden 50 Residential - 7.2 74.5
Mithraratne & Vale (2004)
New Zealand
100 Residential - 4.8 47.6
Winistorfer et al. (2005)
USA 75 Residential - 2.2 37.1
Itard (2007) China 50 Residential - - 200
Holden & Gjerde (2007)
New Zealand
50 Residential - 10.7 214
Citherlet and
Defaux (2007)
Switzerland - Residential 10-27 - 0.58
Fay et al. (2008)
Australia 50 Residential - 14.1 470
Kellenberger and
Althaus (2009)
Switzerland 80 Residential - - 43.1
Perkins et al. (2009)
Australia 60 Residential 7-20 - 362.4
Blengini (2009)
Italy 40 Residential 67 - 0.99
Deng et al. (2011)
China 50 Residential 63.3 4.3 115.2
Iyer and Wong (2012)
Australia 50-100 Commercial 131 - 39.1

UEMK 2019 Proceedings Book
24/25 October 2019 Gaziantep University, TURKEY 869
Gong et al. (2012)
China 50 Residential 150 - 17.8
Asdrubali et al. (2013)
Italy 50 Residential 53.5 - -
Bastos et al. (2014)
Portugal 75 Residential 12-19.7 62-66 190-352
Stephan and Stephan (2014)
Lebanon 50 Residential - 18.8 544
Giordano et al. (2015)
Italy 50 Residential - 6.4 26
Atmaca & Atmaca (2015)
Turkey 50 Residential 79 6.3 145-264
Dong and Ng (2015)
Hong Kong - Residential 12.7 - -
Roh et al., (2016)
Korea 50 Residential 50.6 - -
Motuzien˙e et al.,
(2016)
Lithuania 100 Residential 28.6 - 72.2
Pal et al., (2017)
Japan 50 Residential 24.8 - -
Andrić et al., (2017)
Portugal 50 Residential - - 24.84
Estokova et al. (2017)
Slovakia 100 Residential 36.2 5.67 -

UEMK 2019 Proceedings Book
24/25 October 2019 Gaziantep University, TURKEY 870
Roh and Tae (2018)
Korea 50 Residential 49.4 - -
Bojana et al. (2019)
Sweden 100 Residential 2 - -
The CO2 emissions in worldwide are presented Table 2. The average values for emissions in Asia and Europe are 65.9 and 31.2 kgCO2 per m2 per year.
Table 2
Worldwide CFP values.
Continent Reference Country Life cycle CFP
(kgCO2/m2/year)
America Marceau and Gajda (2002)
USA 100 32
Lippke et al. (2004) USA 75 32.2
Norman et al. (2006) Canada 50 92.5
Ortiz Rodriguez (2010) Columbia 50 32.7
Average 38.7
Asia Deng et al. (2011) China 50 63.3
Gong et al. (2012) China 50 150

UEMK 2019 Proceedings Book
24/25 October 2019 Gaziantep University, TURKEY 871
Dong and Ng (2015) Hong Kong 50 12.4
Roh et al. (2016) Korea 50 50.6
Roh and Tae (2018) Korea 50 49.4
Pal et al. (2017) Japan 50 24.8
Suzuki and Oka (1998) Japan 40 110.7
Average 65.9
Europe Adalberth et al. (2001) Sweden 50 30
Asif et al. (2007) Scotland 50 16
Citherlet and Defaux (2007) Switzerland 50 18.5
Bribian et al. (2009) Spain 48 35
Estokova et al. (2017) Slovakia 100 36.2
Bojana et al. (2019) Sweden 100 2

UEMK 2019 Proceedings Book
24/25 October 2019 Gaziantep University, TURKEY 872
Ceullar & Azapagic (2012) UK 50 69.9
Gustavsson & Joelsson (2012) Sweden 50 12.6
Asdrubali et al. (2013) Italy 50 53.5
Average 31.2
Oceania Perkins et al. (2009) Australia 60 13.5
Iyer & Wong (2012) Australia 50-100 124.7
Average 69.1
World Average 43.9

UEMK 2019 Proceedings Book
24/25 October 2019 Gaziantep University, TURKEY 873
3. RESULTS
This paper is about the life cycle energy consumption and carbon footprint evaluation of constructions. CFP in different stages of the construction is shown in Figure 2.
Fig. 2. CFP in different stages of the construction.
Life cycle CO2 emissions of a construction should be prevented by reducing the operating energy considerably.
Decreasing the requirements for daily energy consumption is the most important aspect.
The cumulative carbon foot print of the construction callculated to be around 60 tonCO2 per year.
It is found that the life-cycle CO2 emissions of the building constructed in Turkey is about 30% higher than the average CO2 emissions of residential buildings constructed in European countries.
The carbon foot print of building elements found to be around 6 tonCO2/year. This value is about 10% of total value.
The investigations showed that CFP of a building notably depends on the behavioral factors of the habitants of a country.
UEMK 2019 Proceedings Book
24/25 October 2019 Gaziantep University, TURKEY 874
REFERENCES
Adalberth, K., Almgreen, A., Petersen, E.H., 2001. Life cycle assessment of four multifamily buildings. Int. J. Low Energy Sustain. Build. 2,1–21
Adalberth, K.,1997a. Energy use during the life cycle of buildings: a method,
Build.Environ. 32(4),317–320.
Adalberth, K.,1997b. Energy use during the life cycle of single unit dwellings: examples, Build. Environ 32(4),321–329.bcit
Andrić, I., Pina, A., Ferrão, P., Fournier, J., Lacarrière, B., Corre, O.L., 2017. Assessing the feasibility of using the heat demand-outdoor temperature function for a long-term district heat demand forecast. Energy Procedia 140,486-494.
Asdrubali, F., Baldassarri, C., Fthenakis, V., 2013. Life cycle analysis in the construction sector: guiding the optimization of conventional Italian buildings. Energy Build 64,73–
89.
Asif, M., Muneer T., Kelley R., 2007. Life cycle assessment: a case study of a dwelling home in Scotland. Building and Environment 42,1391–1394.
Aste, N., Adhikari R.S., Buzzetti M.,2010. Beyond the EPBD: the low energy residential settlement Borgo Solare. Appl Energy 87(2),629–42.
Atmaca, A., Atmaca, N.,2016a. Comparative life cycle energy and cost analysis of post-disaster temporary housings. Applied Energy 171,429–443.
Atmaca, A., Atmaca, N., 2016b. Determination of correlation between specific energy consumption and vibration of a raw mill in cement industry. Anadolu University Journal of Science and Technology A- Applied Sciences and Engineering 17(1),209-219.
Atmaca, A., Yumrutaş, R., 2015. The effects of grate clinker cooler on specific energy consumption and emissions of a rotary kiln in cement industry. International Journal of Exergy 18(3),367-386.
Atmaca, A., 2018. Sustainable life span prediction of shelters constructed in refugee camps in Turkey. Energy, Ecology and Environment 3(1),5-12.

UEMK 2019 Proceedings Book
24/25 October 2019 Gaziantep University, TURKEY 875
Atmaca, A., Atmaca, N., 2015. Life cycle energy (LCEA) and carbon dioxide emissions (LCCO2A) assessment of two residential buildings in Gaziantep, Turkey. Energy Build 102,417–431.
Atmaca, N., Atmaca, A., Aljumaili, M., Özçetin, A.İ., 2018. Strength and shrinkage properties of self-compacting concretes incorporating waste PVC dust. The International Journal of Energy & Engineering Sciences 3(1),47-57.
Bastos, J., Batterman, S.A., Freire, F., 2014. Life-cycle energy and greenhouse gas analysis of three building types in a residential area in Lisbon. Energy and Buildings 69,344–353.
Blengini, G.A., 2009. Life cycle of buildings, demolition and recycling potential: a case study in Turin, Italy. Build Environ 44,319–330.
Bojana, P., Myhren, J.A., Zhang, X, Wallhagen, M., Eriksson, O., 2019. Life Cycle Assessment of Building Materials for a Single-family House in Sweden. Energy Procedia 158,3547–3552.
Buyle, M., Braet, J., Audenaert, A.,2013. Life cycle assessment in the construction sector: a review. Renewable & Sustainable Energy Reviews 26,379–88.
Chau, C.K., Yik, F.W.H., Hui, W.K., Liu, H.C., Yu, H.K., 2007. Environmental impacts of building materials and building services components for commercial buildings in Hong Kong. Journal of Cleaner Production 15,1840–1851.
Christopher, L., Weber, H.S.,2008. Quantifying the global and distributional aspects of American household carbon footprint. Ecological Economics 66,379-391.
Chulsukon, P. 2002. Development and analysis of a sustainable low energy house in a hot and humid climate, Ph.D. Thesis. TX, USA: Texas A &M University, College Station.
Citherlet, S., Defaux, T., 2007. Energy and environmental comparison of three variants of a family house during its whole life span. Build Environ 42,591–598.
Cuellar-Franca, R.M., Azapagic, A., 2012. Environmental impacts of the UK residential sector: life cycle assessment of houses. Build Environ 54,86–99.
Deng, W., Prasad, D., Osmond, P., Li, F.T., 2011. Quantifying life cycle energy and carbon footprints of China's residential small district. Coll Publ 6(4),96–111

UEMK 2019 Proceedings Book
24/25 October 2019 Gaziantep University, TURKEY 876
Dodoo, A., Gustavsson, L., Sathre, R., 2011. Building energy-efficiency standards in a life cycle primary energy perspective. Energy Build 43(7),1589–97.
Dong, Y., Ng, S.T., 2015. A life cycle assessment model for evaluating the environmental impacts of building construction in Hong Kong. Building and Environment 89,183–191.
Estokova, A., Vilcekova, S., Porhincak, M., 2017. Analyzing embodied energy, global warming and acidification potentials of materials in residential buildings. Procedia Engineering 180,1675 – 1683.
Fava, J.A., 2006. Will the next 10 years be as productive in advancing life cycle approaches as the last 15 years? Int J Life Cycle Assess 11,6–8.
Fay, R., Treloar, G., Iyer-Raniga, U., 2008. Life-cycle energy analysis of buildings: a case study. Building Research and Information 28,31–41.
Giordano, R., Serra, V., Tortalla, E., Valentini, V., Aghemo, C., 2015. Embodied Energy and Operational Energy Assessment in the Framework of Nearly Zero Energy Building and Building Energy Rating. Energy Procedia 78,3204–9.
Gong, X., Nie, Z., Wang, Z., Cui, S., Gao, F., Zuo, T., 2012. Life cycle energy consumption and carbon dioxide emission of residential building designs in Beijing: a comparative study. J Ind Ecol 4,576–587.
Gustavsson, L., Joelsson, A., 2010. Life cycle primary energy analysis of residential buildings. Energy Build 2,210–220
Holden, G., Gjerde, M., 2007. Urban Sustainability: Comparative Value of Building-Top Apartments. In International Conference on Whole Life Urban Sustainability and its Assessment.
Itard, L., 2007. Comparing environmental impacts from energy and materials embodied in buildings and used during their service life. Proceedings of Building Simulation 3-6 September, Beijing, China,1954–1961.
Iyer, R.U., Wong, J.P.C., 2012. Evaluation of whole life cycle assessment for heritage buildings in Australia. Build Environ 47,138–149.
Kahhat, R., Crittenden, J., Sharif, F., Fonseca, E., Li, K., Sawhney, A., Zhang, P., 2009. Environmental impacts over the life cycle of residential buildings using different exterior wall systems. J Infrastruct Syst 15(3),211–21.

UEMK 2019 Proceedings Book
24/25 October 2019 Gaziantep University, TURKEY 877
Kellenberger, D., Althaus, H., 2009. Relevance of simplifications in LCA of building components. Build Environ 44(4),818–25.
Keoleian, G., Blanchard, S., Reppe, P., 2001. Life-cycle energy, costs, and strategies for improving a single-family house, J. Ind. Ecol. 4(2),135–156.
Koezjakov, A., Urge-Vorsatz, D., Crijns-Graus, W., van den Broek, M., 2018. The relationship between operational energy demand and embodied energy in Dutch residential buildings, Energy & Buildings 165,233–245.
Lippke, B., Wilson, J., Perez-Garcia, J., Bowyer, J., Meil, J., 2004. CORRIM: life-cycle environmental performance of renewable building materials. For Prod J 54(6),8–19.
Liu, HY., 2019. Building a dwelling that remains carbon-neutral over its lifetime: A case study in Kinmen. Journal of Cleaner Production 208,522-529.
Liu, H.Y., 2017. From Low Carbon Building to No Carbon House -Low to No- Use of a Single family House in Kinmen as an Example. Article in Chinese and English. Angle Publishing, Taipei, Taiwan.
Manish, K.D., 2017. Life cycle embodied energy analysis of residential buildings: A review of literature to investigate embodied energy parameters. Renewable and Sustainable Energy Reviews 79,390–413.
Marceau, M.L., Gajda, J., 2002. Partial environmental life cycle inventory of an insulating concrete form house compared to a wood frame house. Portland cement association research & development SERIAL No. 2464.
Mithraratne, N., Vale, B., 2004. Life cycle analysis model for New Zealand houses. Build Environ 39(4),483–92.
Monteiro, H., Freire, F., 2011. Environmental life-cycle impacts of a single-family house in Portugal: assessing alternative exterior walls with two methods. Gazi Univ. J. Sci. 24(3),527–534.
Monteiro, H., Freire, F., 2012. Life cycle assessment of a house with alternative exterior walls: comparison of three impact assessment methods. Energy Build. 47,575–583.
Motuzien˙e, V., Rogoˇza, A., Lapinskien˙e, V., Vilutien˙e, T., 2016. Construction solution for energy efficient single-family house based on its life cycle multi-criteria analysis: A case study. Journal of Cleaner Production 112,532–541.

UEMK 2019 Proceedings Book
24/25 October 2019 Gaziantep University, TURKEY 878
Newton, P., Tucker, S., Ambrose, M., 2000. Housing form, energy use and greenhouse gas emission. In: Williams K, Burton E, Jenks M, editors. Achieving Sustainable Urban form, 2000. London: SPON Press.
Norman, J., MacLean, H.L., Asce, M., Kennedy, C.A., 2006. Comparing high and low residential density: life-cycle analysis of energy use and greenhouse gas emissions. J Urban Plan Dev. 32,10–21.
Ortiz-Rodríguez, O., Castells, F., Sonnemann, G., 2010. Life cycle assessment of two dwellings: one in Spain, a developed country, and One in Colombia, a country under development. Sci Total Environ 408(12),2435–43.
Pal, S.K., Takano, A., Alanne, K., Siren, K., 2017. A life cycle approach to optimizing carbon footprint and costs of aresidential building. Building and Environment 123,146-162.
Perkins, A., Hamnett, S., Pullen, S., Zito, R., Trebilcock, D., 2009. Transport, housing and urban form: the life cycle energy consumption and emissions of city centre apartments compared with suburban dwellings. Urban Policy Res 27(4),377–96.
Roh, S., Tae, S., Suk, S.J., Ford, G., Shin, S., 2016. Development of a building life cycle carbonemissions assessment program (BEGAS 2.0) for Korea׳s green building index certi-fication system. Renew Sustain Energy Rev 53,954–65.
Roh, S., Tae, S., 2017. An integrated assessment system for managing life cycle CO2emis-sions of a building. Renewable and Sustainable Energy Rev 73,265–75.
Scheuer, C., Keoleian, G.A., Reppe, P., 2003. Life cycle energy and environmental performance of a new university building: modeling challenges and design implications. Energy Build 35,1049–1064.
Shukla, A., Tiwari, G.N., Sodha, M.S., 2009. Embodied energy analysis of adobe house. Renew Energy 34(3),755–61
Stephan, A., Stephan, L., 2014. Reducing the total life cycle energy demand of recent residential buildings in Lebanon. Energy 74,618–37.
Suzuki, M., Oka, T., 1998. Estimation of life cycle energy consumption and CO2 emission of office buildings in Japan. Energy Build 28.
Thormark, C., 2002. A low energy building in a life cycle its embodied energy, energy need for operation and recycling potential. Build. Environ. 4,429–435.

UEMK 2019 Proceedings Book
24/25 October 2019 Gaziantep University, TURKEY 879
Treloar, G.J., Fay R., Ilozor, B., Love, P., 2001. Building materials selection: greenhouse strategies for built facilities. Facilities 3,139–150.
Utama, A., Gheewala S.H., 2009. Indonesian residential high rise buildings: a life cycle energy assessment. Energy Build 41(11),1263–8.
Verbeeck, G., Hens, H., 2010. Life cycle inventory of buildings: a contribution analysis. Build Environ 45(4),964–7.
Winistorfer, P., Chen, Z., Lippke, B., Stevens N., 2005. Energy consumption and greenhouse gas emissions related to the use, maintenance, and disposal of a residential structure. Wood Fiber Sci 37,128–39.
Xing, S., Xu, Z., Jun, G., 2008. Inventory analysis of LCA on steel and concrete construction office buildings. Energy Build 7,1188–1193.
Yalcintas, M., Akkurt, S., 2005. Artificial neural networks applications in building energy predictions and a case study for tropical climates. Int J Energy Res 29,891–901.
Yohanis, Y.G., Norton B., 2002. Life-cycle operational and embodied energy for a generic single-storey office building in the UK. Energy 27(1),77–92.

UEMK 2019 Proceedings Book
24/25 October 2019 Gaziantep University, TURKEY 880
EVALUATION OF FIN DESIGN IN TERMS OF HEAT TRANSFER IN PLATE HEAT EXCHANGERS
Doğan Engin ALNAK
Sivas Cumhuriyet University, Technology Fac., Automotive Eng. Dept.
Koray KARABULUT
Sivas Cumhuriyet University, Sivas Vocational High Sch., Electric and Energy Dept.
ABSTRACT: In plate heat exchangers, the use of fins is an important application to increase the turbulance of the flow and the heat transfer surface area. In the present study, heat transfer enhancements of circular and triangle fins with fin heigth of 2 mm and pressure drops have been numerically investigated in plate heat exchangers. The fins are mounted on the flat plate channel. The numerical computations have been carried out by solving a steady, three-dimensional Navier-Stokes equation and an energy equation by using Ansys-Fluent software program. Air has been employed as working fluid. The study has been performed at Re=400 and inlet temperatures, inlet velocities of cold and hot air are fixed as 300 K, 600 K and 1.338 m/s, 0.69 m/s,
respectively. This study displays new fin geometries for plate fin heat exchangers and the employed fin types in this work to increase the heat transfer rate have not still been researched in the reached literature. The results represent that while an increment with 4.18% is obtained in cold fluid temperature for plate heat exchanger with circular fin according to flat plate duct at counter flow, this enhancement value is 4.77% for plate heat exchanger with triangle fin. The heat transfer augments and turbulence kinetic energy (TKE) variations for different fin heights and also velocity, temperature and pressure contour distributions have been analyzed for parallel and counter flow arrangements.
Key words: plate heat exchanger, fin, heat transfer
PLAKALI ISI DEĞİŞTİRİCİLERDE KANATÇIK TASARIMININ
ISI TRANSFERİ AÇISINDAN DEĞERLENDİRİLMESİ

UEMK 2019 Proceedings Book
24/25 October 2019 Gaziantep University, TURKEY 881
ÖZET: Plakalı ısı değiştiricilerde, kanatçık kullanımı akışın türbülansını ve ısı transfer yüzey alanını artırmak açısından önemli bir uygulamadır. Bu çalışmada, plakalı ısı değiştiricilerde 2 mm kanatçık yükseklikli dairesel ve üçgen kanatçıkların ısı transferi artışları ve basınç düşüşleri sayısal olarak incelenmektedir. Kanatçıklar, düz plakalı kanala yerleştirilmektedir. Sayısal hesaplamalar, Ansys-Fluent bilgisayar programının kullanılmasıyla zamandan bağımsız, üç boyutlu Navier-Stokes ve enerji denklemlerinin çözülmesiyle yapılmıştır. Çalışma akışkanı olarak hava kullanılmıştır. Çalışma, Re=400’de gerçekleştirilmekte olup giriş sıcaklıkları, soğuk ve sıcak havanın giriş hızları sırasıyla 300 K, 600 K ve 1.338 m/s, 0.69 m/s olarak sabit alınmıştır. Bu çalışma, plakalı ısı değiştiricileri için yeni kanatçık geometrilerini sergilemektedir ve ısı transferini artırmak için kullanılan kanatçık tipleri ulaşılan literatürde henüz araştırılmamıştır. Sonuçlar, ters akışta kanatçıksız kanala göre dairesel kanatçıklı plakalı ısı değiştiricisinde soğuk akışkan sıcaklığında %4.18’ lik bir artış elde edildiğini gösterirken, bu artış değeri üçgen kanatçıklı plakalı ısı değiştiricisi için %4.77 olmaktadır. Farklı kanatçık yükseklikleri için ısı transferi artışları ve türbülans kinetik enerji (TKE) değişimleri ve ayrıca hız, sıcaklık ve basınç konturü dağılımları parallel ve ters akış düzenlemeleri için analiz edilmiştir.
Anahtar sözcükler: plakalı ısı değiştiricisi, kanatçık, ısı transferi
GİRİŞ
Sınırlı enerji kaynakları ve artan çevre kirliliği günümüzde enerjinin tasarruflu ve verimli kullanılmasına yönelik çalışmaların artırılmasını gerekli kılmaktadır. Enerji tasarrufu, başta insan olmak üzere teknik bir problemdir. Teknik problemler ise teknolojik bakımdan bilinmekte olup bu problemlerin üstesinden gelmek için sistematik bir yaklaşım geliştirilmesi gereklidir. Bu amaçla, konuyla ilgili araştırmacılar enerjiyi daha faydalı kullanabilecek yeni makineler tasarlamakta veya var olan makinelerde iyileştirme çalışmaları yapmaktadırlar. Bu sayede, enerjinin maliyeti düşmekle birlikte hem kaynakların kullanım süreleri uzamakta hem de çevre kirliliğine olan olumsuz katkı azalmaktadır (Karabulut, 2011).
Birçok mühendislik uygulamasında önemli ve çok karşılaşılan işlemlerden birisi de farklı sıcaklıklarda iki veya daha çok akışkan arasındaki ısı değişimidir. Bu değişimin yapılabilmesi için gerekli olan cihaz, termik santrallarda, kimya endüstrisinde, iklimlendirmede, taşıtlarda ve elektronik cihazlar vb. gibi birçok alanda kullanılan ısı değiştiricisidir (Shah,1981). Isı değiştiricilerinde ısı transferini artırmak için genellikle kullanılan yöntemlerden birisi kanatçıklar yani genişletilmiş yüzeyler kullanılmasıdır. Kanatçıklı yüzeyler sayesinde yüzey alanı ve akışın türbülansı artırılarak taşınımla ısı ve kütle transferi artırılmış olur. Kanatçıklı yüzeylerin en önemli kullanım alanları olarak ise gaz türbini motorlarındaki türbin kanatçıklarının soğutulması ve üretim

UEMK 2019 Proceedings Book
24/25 October 2019 Gaziantep University, TURKEY 882
tesislerindeki çeşitli ısı değiştiricileri gösterilebilir. Bununla birlikte, kanatçıkların gerektiği şekilde kullanılmaması ısı geçişini artırmak yerine azaltıcı etki gösterebilir. Bu nedenle, kanatçık malzemesinin türünün, yüzeye monte biçiminin ve özellikle şeklinin ısı transferini artıracak şekilde değerlendirilmesi gerekmektedir. Bu amaçla, plakalı ısı değiştiricilerde ısı transferi ve akış yapılarını değerlendirmek için birçok deneysel ve sayısal çalışma yapılmıştır. Tauscher ve Mayinger (1991) yaptıkları çalışmada plaka tipi ısı değiştiricilerde, çeşitli kurulumlarla oluşturdukları genişletilmiş yüzeylerle ısı aktarımının artırılmasını laminer ve düşük türbülanslı akış şartlarında deneysel ve sayısal olarak incelemişlerdir. Çalışmada, kanatçıkların türbülans oluşturucu etkisi nedeniyle ısı aktarımının arttığı gözlemlenirken, artış için en uygun kurulum belirlenerek, deneysel sonuçların sayısal sonuçlarla uyumu ayrıca incelenmiştir. Lee ve ark. (2001) laminer akış şartlarında plakalı ısı değiştiricisi kanallarının optimum şekillendirilmesi ve düzenlenmesi üzerine çalışmışlardır. Uzaklık, hacim, açı ve eğim olmak üzere bu çalışmada dört adet boyutsuz geometrik parametre kullanmışlardır. Ayrıca, plakalı ısı değiştiricilerinin basınç düşüşü ve ısı transfer özelliklerini de incelemişlerdir. Buyruk ve Karabulut (2017), 2 mm kanatçık yükseklikli 30o ve 60o kanatçık açılı ve akışa dik yatay yönde 10 mm ötelenmiş dikdörtgensel kanatçıkların ısı transferi potansiyeli ve basınç düşüşü özelliklerini sayısal olarak incelemişlerdir. Farklı bir çalışmada Buyruk ve Karabulut (2013), 4 mm kanatçık yüksekliği ve yatay eksenle arasında 30o ve 90o olmak üzere farklı kanatçık açılarına sahip plakalı kanatçıklı ısı değiştiricileri için ısı transferi artışını sayısal olarak değerlendirmişlerdir. Wang ve ark. (2009) düz ve tırtıklı kanatçıklara sahip plakalı ısı değiştiricileri için akış ve ısı transferi özelliklerinin analizini gerçekleştirmişlerdir. Düşük Reynolds sayıları için her iki kanatçıklı ısı değiştiricileri için sayısal simülasyonlar FLUENT bilgisayar programı kullanılarak yapılmıştır. Gupta ve ark. (2009), sayısal olarak üçgen kanatçıklı plakalı tip bir ısı değiştiricisinde ısı transferi artışı için bir çift kanatçık tip vorteks üretecini kullanarak ısı değiştirgecinin akış yapısı ve performans özelliklerini araştırmışlardır. Ayrıca, kanatçık çiftinin yüksekliklerini değiştirerek, ısı transferi artış oranına etkisini belirlemişlerdir. Zhu ve Li (2008) dikdörtgen, çubuk, oluklu ve dalgalı olmak üzere dört kanatçık tipi için laminer akış rejiminde, kanatçık kalınlığını da dikkate alarak akış yapısı ve ısı transferi üzerinde ısıl giriş ve çıkış etkilerini üç boyutlu sayısal olarak değerlendirmişlerdir. Buyruk ve Karabulut (2018) iç zikzak-düz-dış zikzak ve dış zikzak-düz-dış zikzak olmak üzere farklı geometrik şekillere ve 2 mm kanatçık yükseklikli ve yatayla 10 mm kaydırılmış düzene ve 30o ve 90o kanatçık açılı plakalı ısı değiştiricilerinin ısı transferi ve basınç düşüşü performanslarını araştırmışlardır. Ters akış durumunda kanatçıksız kanalla karşılaştırıldığında dış zikzak-düz-dış zikzak kanatçıklı plakalı ısı değiştiricisi için ısı transferinde %10’luk artış elde edilirken, 90o kanatçık açılı ısı değiştiricisinde ise %8’ lik bir artış elde etmişlerdir.
Literatürde ulaşılan çalışmalar değerlendirildiğinde, plakalı ısı değiştiricilerindeki kanatçık düzenlemelerinin ısı transferini iyileştirdiği görülmektedir. Bununla birlikte, hem bu çalışmada incelenen kanatçık şekillerinin henüz değerlendirilmediği hem de enerji verimliliğinin artırılmasının öneminin daha iyi anlaşıldığı günümüzde kanatçık üzerine daha yoğun araştırmalar yapılması gerekliliği göz önünde bulundurularak bu

UEMK 2019 Proceedings Book
24/25 October 2019 Gaziantep University, TURKEY 883
çalışmada özgün kanatçık şekilleri değerlendirilmiştir. Bu amaçla, düz kanala yerleştirilen dairesel ve üçgen kanatçıkların plakalı ısı değiştiricilerinin ısı transferi, kanal içerisindeki akış yapısı, türbülans kinetik enerji değişimleri ve basınç düşüşü özellikleri sayısal olarak incelenmiştir. Çalışmada ayrıca, kanatçık yüksekliğinin soğuk akışkan sıcaklığı üzerindeki etkisi de değerlendirilmiştir. Bununla birlikte, farklı Re sayılarının Nu sayısı üzerindeki etkisi araştırılırken hız, sıcaklık ve basınç konturu dağılımları görselleştirilmiştir.
YÖNTEM
Sayısal çalışma üç boyutlu, zamandan bağımsız, birleşik (iletim ve taşınım) ısı transferi yaklaşımıyla çözülmüştür. Birleşik ısı transferi analizini çözmek için sonlu hacimler yöntemi (FLUENT programı) kullanılmıştır.
Kullanılan kanatçıklar, laminer akışta türbülansa neden olduğundan sayısal hesaplamalarda seçilen kanatçıklı geometriler için standart k-ε türbülans modelinin uygun olduğu belirlenmiş ve kullanılmıştır.
Geometri boyunca akış ve ısı transferinin çözümlemesi, zamandan bağımsız olarak kütlenin, momentumun ve enerjinin korunumu kanunlarından elde edilen kısmi türevli denklemlerin çözümlenmesi esasına dayanmaktadır (Wang ve ark. 2009; Fluent, 2003).
Süreklilik denklemi
0u v w
x y z
(1)
Momentum
x momentum denklemi
2 2 2
2 2 2
u u u p u u uu v w
x y z x x y z
(2)
y momentum denklemi
2 2 2
2 2 2
v v v p v v vu v w
x y z y x y z
(3)
z momentum denklemi
2 2 2
2 2 2
w w w p w w wu v w
x y z z x y z
(4)
Enerji denklemi

UEMK 2019 Proceedings Book
24/25 October 2019 Gaziantep University, TURKEY 884
2 2 2
2 2 2
p
T T T k T T Tu v w
x y z c x y z
(5)
Bu denklemlerde, ρ yoğunluk, μ dinamik viskozite, p basınç, k ısıl iletkenlik, T sıcaklık, cp özgül ısı ve u,v,w ise sırasıyla x, y ve z yönlerindeki hızlardır.
Kullanılan standart k-ε türbülans modelinde, k türbülans kinetik enerji, ε disipasyon terimi ve viskoz kaybolma terimi kullanılmaktadır.
Daimi akış için türbülans kinetik enerjisi denklemi
t t t
t
k k k
uk vk wk k k k
x y z x x y y z z
s s s
(6)
Türbülans viskozitesi
2
. .t
kC
(7)
Türbülans kinetik enerji
2 2 2' ' '1
2k u v w (8)
Viskoz kaybolma terimi
2 22
2u v v u
x y x y
(9)
Türbülans kinetik enerji kaybolma denklemi
2
1 2
t t t
t
u v wC C
x y z x x y y z z k k
s s s
(10)
Cµ , C1ε , C2ε , σk ve σε katsayıları sabit olup Cµ = 0.09, C1ε = 1.44, C2ε = 1.92, σk=1 ve σε
=1.3’dür.
Reynolds sayısı
hV .DRe (11)
Burada, Dh kanalın hidrolik çapıdır.
( . )
( . ) c 2
h
2
4A 4 H WD
P 2 H W (12)
Ac kanalın kesit alanı, P ise kanalın çevre uzunluğudur.
Sınır şartı ve Nusselt sayısı aşağıdaki şekilde verilmiştir.
s
yüzey
dTk h T T
dn
ve
. hh D
Nuk
(13)
h yüzey ısı taşınım katsayısıdır.
Basınç düşüşü aşağıdaki şekilde hesaplanabilir

UEMK 2019 Proceedings Book
24/25 October 2019 Gaziantep University, TURKEY 885
.. .
2
m
L
h
VLP f
D 2
(14)
LP akış yönünde kanaldaki basınç düşüşü, f ise sürtünme faktörüdür.
Kanat malzemesinin ısıl iletkenliği kanal boyunca ısıl değişimi etkilediğinden ısı transferini artırmada kanatçık malzemesinin seçimi önemli bir faktördür. Bu nedenle, kanal malzemesi olarak yüksek ısıl iletkenliğe sahip, ucuz ve hafif olan alüminyum seçilmiştir. Kanatçıkların kanal yüzeyi ile bir bütün olarak üretildiği varsayılarak, kanatçıklar ve yüzey arasındaki ısıl direnç ihmal edilmiştir.
Şekil 1'de üç boyutlu düz kanal geometrisinin perspektif görünüşü gösterilmekte iken, Şekil 2a ve Şekil 2b'de ise sırasıyla sayısal hesaplamalarda kullanılan dairesel ve üçgen kanatçıklı modellere ait dikdörtgensel kanal geometrileri gösterilmektedir. Ayrıca, bu şekiller üzerinde sınır şartları da belirtilmiştir. Şekil 2a ve Şekil 2b'de kanatçıkların daha iyi görselleştirilebilmesi için kanalların ters çevrilmiş görüntüsü gösterilmektedir.

UEMK 2019 Proceedings Book
24/25 October 2019 Gaziantep University, TURKEY 886
Geometrik özellikler olarak, kanatçık şekli: dairesel ve üçgen kanatçık yüksekliği (e): 2 ve 4 mm, kanatçık aralığı (b): 20 mm, kanatçık genişliği (a): 2 mm, kanal boyu (L): 300 mm, kanal genişliği (W): 150 mm, üst kanal yüksekliği (H1): 5 mm, alt kanal yüksekliği (H2): 10 mm, katı yüzey kalınlığı (t): 2 mm, Reynolds sayısı: 200, 400, 750, 1000, sıcak akışkan sıcaklığı (Th): 600 K, soğuk akışkan sıcaklığı (Tc): 300 K, sıcak hava giriş hızı (Vh): 1.338 m/s, soğuk hava giriş hızı (Vc): 0.69 m/s’ dir.

UEMK 2019 Proceedings Book
24/25 October 2019 Gaziantep University, TURKEY 887
Çalışma, belirtilen şu sınır şartları altında yapılmıştır: a) akış üç boyutlu, zamandan bağımsız ve laminerdir, b) kullanılan akışkan sıkıştırılamazdır, c) kanatçık ve kanal malzemesi olarak alüminyum kullanılmıştır, d) tabakalar arası ısıl temas tamdır, e) kanalın alt ve üst bölümü için kullanılan akışkan havadır, f) akışkanın ısıl özellikleri sabittir, g) hem akışkan hem de katı malzeme için ısı üretimi söz konusu değildir.
BULGULAR VE SONUÇLAR
Şekil 3’ de sunulan çalışma, Buyruk ve Karabulut, (2018) ve Kayatas ve Ilbas (2005) tarafından yapılan çalışmalarla karşılaştırılmıştır. Şekil 3’ den de görülebildiği gibi çalışmanın sonuçları birbirleriyle uyumlu olup, bu nedenle sunulan çalışmanın doğru ve kabul edilebilir olduğu söylenebilmektedir. Bununla birlikte, çalışmada görülen sıcaklık farklılıklarının ağ yapısından kaynaklandığı öngörülmektedir.
Sunulan çalışmanın ağ bağımsızlık testinin sonuçları, soğuk akışkanın sıcaklık değişimi dikkate alınarak b=20 mm, e=2 mm ve Re=1000 için dairesel kanatçıklı kanal için Şekil 4’ de verilmektedir. Akışkanın sıcaklık değişimi, kanal kesitinde 1,510.466 adet ağ elemanının olduğu durumla, 1,661.512 adet ağ elemanının olduğu durum karşılaştırıldığında aradaki farkın %0.02’ den daha az olduğu görülmüştür. Bu nedenle, kanal kesitinde toplam 1,510.466 adet ağ elemanının yeterli olduğu sonucuna varılmıştır. Bununla birlikte, çalışmada üçgen kanatçıklı kanal için 1,511.822 adet ağ elemanı kullanılırken, düz kanal için bu değer 1,380.371’ dir.

UEMK 2019 Proceedings Book
24/25 October 2019 Gaziantep University, TURKEY 888
Şekil 5’ de düz kanal, 2 mm kanatçık yüksekliği (e) ve 20 mm kanatçık aralığına (b) sahip dairesel ve üçgen kanatçıklı kanallar için kanal boyunca sıcak akışkanın sıcaklık değişimleri gösterilmektedir. Paralel akış için girişte sıcak ve soğuk akışkan arası sıcaklık farkının yüksek olması nedeniyle yaklaşık 0.23 m kanal mesafesine kadar sıcak akışkanın sıcaklık değerleri ters akışa göre daha düşük değerlerdedir. Bununla birlikte, bu mesafeden sonra (L=0.23 m) ters akış için akışkanlar arası sıcaklık farkı artmakta ve paralel akışa göre daha düşük sıcak akışkan sıcaklık değerleri elde edilmektedir. Kanal girişi ve çıkışı arasındaki sıcaklık farkı değerlendirildiğinde; ters akışta, paralel akışa göre sıcak akışkan için daha düşük sıcaklık değerleri elde edilmektedir. Bu durum, ısı transferinin ters akışta daha fazla olması nedeniyledir. Dairesel kanatçıklı kanal için 600 K sıcaklıkta kanala giriş yapan sıcak akışkan, 516.11 K sıcaklık değeri ile kanaldan çıkış yaparken bu değer ters akış için 512.83 K olmaktadır. Kanatçıksız düz kanalda ise kanal çıkışında sıcak akışkan paralel akışta

UEMK 2019 Proceedings Book
24/25 October 2019 Gaziantep University, TURKEY 889
539 K değerinde iken, ters akış için ise 538.4 K olmaktadır. Sıcaklıktaki bu azalma değeri, aynı zamanda kanatçığın ısı transferini artırmadaki önemini göstermektedir.
Kanal boyunca düz, dairesel ve üçgen kanatçıklı kanallara ait soğuk akışkanın sıcaklık değişimleri paralel ve ters akış için Şekil 6’ da verilmektedir. Üçgen kanatçıklı kanalda, dairesel kanatçıklı kanala göre akışkanda daha fazla türbülans etkisi oluşturulması nedeniyle her iki akış yönü için daha yüksek soğuk akışkan çıkış sıcaklık değerlerine ulaşılmaktadır. Bununla birlikte, paralel akışta kanatçıksız kanala göre dairesel kanatçıklı kanalda soğuk akışkan sıcaklığında %4’ lük bir artış elde edilirken, üçgen kanatçık için bu artış değeri %4.57 olmaktadır. Ters akış durumunda ise bu artış değeri, dairesel kanatçıklı kanal için %4.18 iken, üçgen kanatçıklı kanal için %4.77’dir.
Şekil 7a, b’ de sırasıyla paralel ve ters akışta soğuk akışkana ait kanal yüzeyi boyunca Re=400 ve Re=1000 için Nu sayısının değişimi gösterilmektedir. Paralel akışta kanal
çıkışına doğru, sıcak ve soğuk akışkanlar arası sıcaklık farkının azalması nedeniyle Nu sayısı kanal çıkışına doğru azalmaktadır. Bununla birlikte, ters akışta ise kanal girişine doğru sıcaklık farkının artması sonucu Nu sayısı değerleri kanal girişine doğru artış

UEMK 2019 Proceedings Book
24/25 October 2019 Gaziantep University, TURKEY 890
göstermektedir. Artan Re sayısı değerleriyle ısı transferindeki iyileşme nedeniyle her iki akış yönü için de Nu sayısı değerlerinde artış gözlemlenmektedir. Ayrıca, Re sayısının 400 değerinde her üç kanal şekli için kanal girişlerinde görülen noktasal Nu sayısı artışının gelişen ısıl sınır tabaka nedeniyle olduğu düşünülmektedir. Bunun yanı sıra, en yüksek Nu sayısı değerlerine düz kanala kanatçık eklenmesiyle birlikte elde edilen akış karışmasının daha fazla olduğu üçgen kanatçıklı kanalda ulaşılmaktadır.
Şekil 8‘de paralel ve ters akış için dairesel kanatçıklı kanalda kanatçık yüksekliği değişiminin (e=2 mm ve e=4 mm) soğuk akışkanın sıcaklık değişimi üzerindeki etkisi verilmektedir. Artan kanatçık yüksekliği ile hem ısı transfer yüzey alanı hem de akışın türbülansı artmaktadır. Bu nedenle, daha yüksek soğuk akışkan sıcaklık değerleri elde edilmektedir. Ters akışta e=4 mm kanatçık yüksekliği için soğuk akışkanın kanaldan çıkış sıcaklığı, e=2 mm’ ye göre %2.75 daha fazladır.
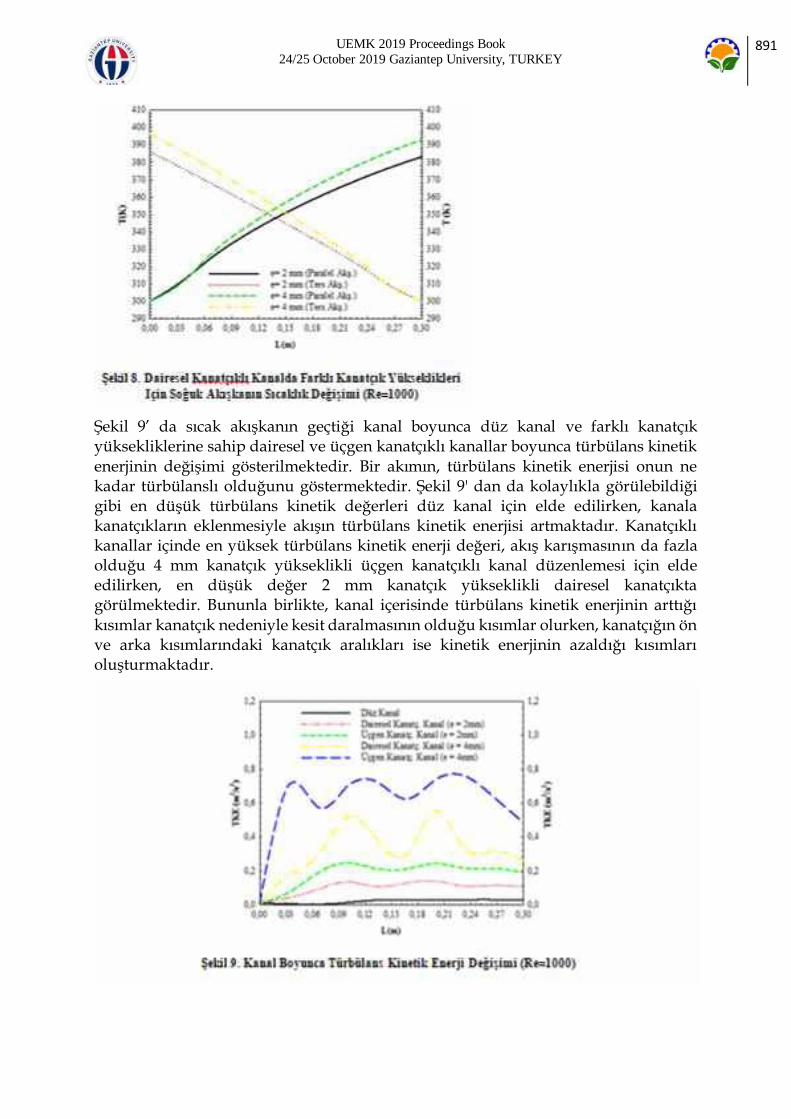
UEMK 2019 Proceedings Book
24/25 October 2019 Gaziantep University, TURKEY 891
Şekil 9’ da sıcak akışkanın geçtiği kanal boyunca düz kanal ve farklı kanatçık yüksekliklerine sahip dairesel ve üçgen kanatçıklı kanallar boyunca türbülans kinetik enerjinin değişimi gösterilmektedir. Bir akımın, türbülans kinetik enerjisi onun ne kadar türbülanslı olduğunu göstermektedir. Şekil 9' dan da kolaylıkla görülebildiği gibi en düşük türbülans kinetik değerleri düz kanal için elde edilirken, kanala kanatçıkların eklenmesiyle akışın türbülans kinetik enerjisi artmaktadır. Kanatçıklı kanallar içinde en yüksek türbülans kinetik enerji değeri, akış karışmasının da fazla olduğu 4 mm kanatçık yükseklikli üçgen kanatçıklı kanal düzenlemesi için elde edilirken, en düşük değer 2 mm kanatçık yükseklikli dairesel kanatçıkta görülmektedir. Bununla birlikte, kanal içerisinde türbülans kinetik enerjinin arttığı
kısımlar kanatçık nedeniyle kesit daralmasının olduğu kısımlar olurken, kanatçığın ön ve arka kısımlarındaki kanatçık aralıkları ise kinetik enerjinin azaldığı kısımları oluşturmaktadır.

UEMK 2019 Proceedings Book
24/25 October 2019 Gaziantep University, TURKEY 892
Şekil 10’ da sırasıyla düz kanal, dairesel kanatçıklı ve üçgen kanatçıklı kanallara ait paralel ve ters akış olmak üzere kanal boyunca hız dağılımları gösterilmektedir. Düz kanala göre, özellikle kanatçıklı kanallarda hız değişiminin daha fazla olduğu kontur dağılımından görülebilmektedir. Bununla birlikte, kanatçıklara çarparak duran akışkan, kanatçığın alt kısmı boyunca hızlanarak kanatçık aralıklarına ve kanalın alt kısmına doğru yönlenmektedir. Bunun yanı sıra, üçgen kanatçıklı kanallarda, dairesel kanatçıklı kanallara göre kanatçık aralıklarında daha yüksek akışkan hız değerleri elde edilmektedir. Ayrıca, ters akış durumunda paralel akışa göre kanal sonunda akışkanlar arası sıcaklık farkı daha fazla olduğundan moleküler hareketlenme nedeniyle kanal sonunda daha yüksek hız değerleri elde edilmektedir.
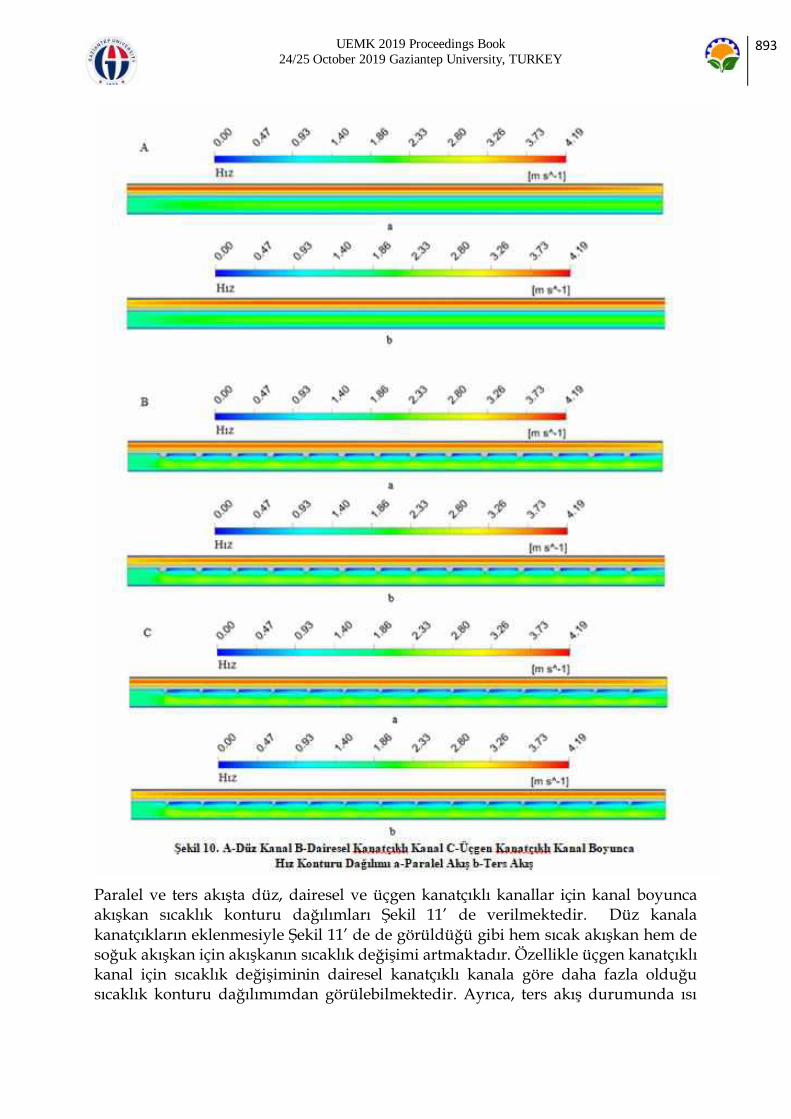
UEMK 2019 Proceedings Book
24/25 October 2019 Gaziantep University, TURKEY 893
Paralel ve ters akışta düz, dairesel ve üçgen kanatçıklı kanallar için kanal boyunca akışkan sıcaklık konturu dağılımları Şekil 11’ de verilmektedir. Düz kanala kanatçıkların eklenmesiyle Şekil 11’ de de görüldüğü gibi hem sıcak akışkan hem de soğuk akışkan için akışkanın sıcaklık değişimi artmaktadır. Özellikle üçgen kanatçıklı kanal için sıcaklık değişiminin dairesel kanatçıklı kanala göre daha fazla olduğu sıcaklık konturu dağılımımdan görülebilmektedir. Ayrıca, ters akış durumunda ısı

UEMK 2019 Proceedings Book
24/25 October 2019 Gaziantep University, TURKEY 894
transferinin daha fazla olması akışkanların sıcaklık değişiminin daha fazla olmasını sağlamaktadır.
Şekil 12’ de düz, dairesel ve üçgen kanatçıklı kanallara ait paralel ve ters akışta kanal boyunca basınç konturu dağılımları sergilenmektedir. Akışkanların kanal boyunca basınç değişimi artmakla birlikte, kanatçıkların olduğu kanallarda daha fazla basınç değişimi elde edildiği basınç konturu dağılımlarından görülebilmektedir. Bu durum kanatçıkların akışa karşı oluşturdukları direnç sebebiyledir.

UEMK 2019 Proceedings Book
24/25 October 2019 Gaziantep University, TURKEY 895

UEMK 2019 Proceedings Book
24/25 October 2019 Gaziantep University, TURKEY 896
Tablo 1’ de Re=1000 değerinde b=20 mm ve e=2 mm için kanatçıkların bulunduğu sıcak akışkanın geçtiği kanal boyunca akışkanın basınç düşüşü değişimleri gösterilmektedir. Kanatçıklar, ısı transferi değerini artırırken akışa karşı direnç oluşturdukları için kanal boyunca basınç düşüşünü artırmaktadırlar. Her iki kanatçık

UEMK 2019 Proceedings Book
24/25 October 2019 Gaziantep University, TURKEY 897
tipi için de kanatçıksız düz kanala göre daha yüksek basınç düşüşü değerleri elde edilmektedir ki bu da gereksinim duyulan pompalama gücünü artırıcı etki yapmaktadır. Bu nedenle, plakalı ısı değiştiricilerde kanatçık kullanımıyla ısı transferi artırılırken basınç düşüşü etkisi de göz önünde bulundurulmalıdır.
Tablo 1. Plakalı Isı Değiştiricilerin Basınç Düşüşleri
Kanal Tipi ΔP (Pa)
Düz 3.215
Dairesel Kanatçıklı 7.205
Üçgen Kanatçıklı 8.632
SONUÇ
Bu çalışmada, dairesel ve üçgen kanatçıklı kanallara sahip ısı değiştiricilerinin ısı transferi, akış yapısı ve basınç düşüşü özellikleri üç boyutlu, zamandan bağımsız ve sayısal olarak çözülmüştür. Sayısal çalışma, ANSYS-FLUENT bilgisayar programının kullanılmasıyla gerçekleştirilmiştir. Çalışmada ayrıca kanatçık yüksekliğinin etkisi de dikkate alınmış ve paralel ve ters akış şartları altında kanal boyunca hız, sıcaklık ve basınç dağılımı konturları incelenmiştir. Kanatçıklar, kanal içerisinde ısı transferi yüzeylerini artırmalarının yanı sıra akışın türbülansını da artırmaktadırlar. Bu nedenle, çalışmada farklı kanatçık tiplerine sahip kanalların farklı kanatçık yüksekliklerinde türbülans kinetik enerji değişimleri de değerlendirilmiştir. Ayrıca, çalışmada düşük Re sayılarında kanatçıkların ısı transferi ve basınç düşüşü üzerindeki etkilerinin belirlenmesi amaçlanmıştır. Kanatçıklı kanalların basınç değişimi değerleri incelendiğinde türbülans kinetik enerji değeri fazla olan üçgen kanatçıklı kanalın daha fazla basınç düşüşüne sebep olduğu görülmüştür.
Ayrıca, çalışmada artan Re sayısı değerleriyle ısı transferindeki iyileşme nedeniyle her iki akış yönü için de Nu sayısı değerlerinde artış gözlemlenmektedir. Bunun yanı sıra, en yüksek Nu sayısı değerlerine düz kanala kanatçık eklenmesiyle birlikte elde edilen akış karışmasının daha fazla olduğu üçgen kanatçıklı kanalda ulaşılmaktadır. Artan kanatçık yüksekliği ile hem ısı transfer yüzey alanı hem de akışın türbülansı artmaktadır. Bu nedenle, daha yüksek soğuk akışkan sıcaklık değerleri elde
edilmektedir. Ters akışta e=4 mm kanatçık yüksekliği için soğuk akışkanın kanaldan çıkış sıcaklığı, e=2 mm’ ye göre %2.75 daha fazladır. Bununla birlikte, paralel akışta kanatçıksız kanala göre dairesel kanatçıklı kanalda soğuk akışkan sıcaklığında %4’ lük bir artış elde edilirken, üçgen kanatçık için bu artış değeri %4.57 olmaktadır. Ters akış durumunda ise bu artış değeri, dairesel kanatçıklı kanal için %4.18 iken, üçgen kanatçıklı kanal için %4.77’dir.
Bununla birlikte, hem bu çalışmada incelenen kanatçık şekillerinin henüz değerlendirilmediği hem de enerji verimliliğinin artırılmasının öneminin daha iyi

UEMK 2019 Proceedings Book
24/25 October 2019 Gaziantep University, TURKEY 898
anlaşıldığı günümüzde kanatçık üzerine daha yoğun araştırmalar yapılması gerekliliği göz önünde bulundurularak bu çalışmada özgün kanatçık şekilleri değerlendirilmiştir. Sonuç olarak, elde edilen bu verilerin ışığında bu çalışmadaki kanatçıkların plakalı ısı değiştiricilerin tasarımında ve optimizasyonunda doğrudan kullanılabileceği düşünülmektedir.
KAYNAKLAR
ANSYS Inc. (2003). ANSYS FLUENT User’s Guide, Fluent, ANSYS Press, Netherland.
Buyruk, E., Karabulut, K., Karabulut, Ö. O. (2013). Three-dimensional numerical investigation of heat transfer for plate fin heat exchangers, Heat and Mass Transfer, 49, 817-826.
Buyruk, E., Karabulut, K. (2017). Plakalı kanatçıklı ısı değiştiricilerde kanat açısının ısı transferine olan etkisinin üç boyutlu sayısal olarak incelenmesi, Çukurova Üniversitesi Mühendislik Mimarlık Fakültesi Dergisi, 32, 49-62.
Buyruk, E., Karabulut, K. (2018). Enhancement of heat transfer for plate fin heat exchangers considering the effects of fin arrangements, Heat Transfer Engineering, 39, 1392-1404.
Gupta, M., Kasana, K. S., Vasudevan, R. (2009). A numerical study of the effect of flow structure and heat transfer of a rectangular winglet pair in a plate fin heat exchangers, Journal of Mechanical Engineering Science, 223, 2109-2215.
Karabulut, Ö, O. (2011). Kanatçıklı yüzeylerde ısı aktarımının üç boyutlu sayısal olarak incelenmesi, Sivas Cumhuriyet Üniversitesi, Fen Bilimleri Enstitüsü, Yüksek Lisans Tezi, 156s.
Lee, K., Kim, W., Si, J. (2001). Optimal shape and arrangement of staggered pins in the channel of a plate heat exchanger, International Journal of Heat and Mass Transfer, 44,
1373–1378.
Shah, R.K. (1981). Classification of heat exchangers in heat exchangers, thermo-hydraulic fundamentals and design, S. Kakaç, A.E Berges and F. Mayinger (Ed.), Wiley, New York.
Tausher, R., Mayinger, F. (1991). Heat transfer enhancement ın a plate heat exchanger with rib-roughened surfaces. Heat Transfer Enhancement of Heat Exchangers, 207-221.
Wang, Y. Q., Dong, Q. W., Liu, M. S., Wang, D. (2009). Numerical study on plate fin heat exchangers with plain fins and serrated fins at low reynolds number, Chemical Engineering&Technology, 32, 1219-1226.
Zhu, Y. H., Li, Y. Z. (2008). Three dimensional numerical ınvestigation on the laminar flow and heat transfer in four basic fins of plate fin heat exchangers, Transactions of ASME Journal of Heat Transfer, 130, 1-8.
UEMK 2019 Proceedings Book
24/25 October 2019 Gaziantep University, TURKEY 899
INVESTIGATION OF HEAT TRANSFER FROM HEATED SURFACES BY USING IMPINGING AIR JET
Koray KARABULUT
Sivas Cumhuriyet University, Sivas Vocational High Sch., Electric and Energy Dept.
Doğan Engin ALNAK
Sivas Cumhuriyet University, Technology Fac., Automotive Eng. Dept.
ABSTRACT: In this study, it is aimed to investigate the heat transfer from microchips used in computers by using impingement air jet. The cooling of surfaces with copper plate having different surface patterns as reverse circle, reverse triangle and rampart and constant heat flux of 1000 W/m2 in rectangular ducts has been numerically investigated by using air jet and the optimum pattern has been determined among three shapes in terms of heat transfer. Numerical calculations have been carried out to solve Navier Stokes and enrgy equations by k-ε turbulance model as three dimensional and steady using Ansys-Fluent program. While the side, lower and upper surfaces of the rectangular ducts where the pattern surfaces are in it have been adiabatic, the constant heat flux has been only applied to the patterned surfaces. Air with 300 K inlet temperature has been used as the jet fluid. The jet-plate distance (H/Dh) evaluated in the study is 4, 6 and 12, and the range of Re numbers used is 4000-10000. When the results obtained have been compared with the numerical and experimental results of the study in the literature, they have been found to be in agreement with each other. The results have been shown as mean Nu number and surface temperature variations
for different patterned surfaces. Furthermore, streamline and temperature distribution contours of the jet flow along the channel have been analyzed. It has been determined that the mean Nu number value obtained at Re=8000 and H/Dh=12 for the reverse patterned surfaces has been 21.9% higher than that obtained for the rampart surface.
Key words: impinging air jet, microchip cooling, heat transfer
ÇARPAN HAVA JETİ KULLANILARAK ISINMIŞ YÜZEYLERDEN OLAN ISI TRANSFERİNİN İNCELENMESİ
UEMK 2019 Proceedings Book
24/25 October 2019 Gaziantep University, TURKEY 900
ÖZET: Bu çalışmada, bilgisayarlarda kullanılan mikroçiplerden olan ısı transferinin çarpan hava jeti kullanılarak araştırılması amaçlanmıştır. Dikdörtgen kesitli kanallar içerisindeki ters daire, ters üçgen ve sur şeklinde olmak üzere farklı yüzey desenlerine ve 1000 W/m2 sabit ısı akısına sahip bakır plakalı yüzeylerin çarpan hava jeti kullanılarak soğutulması sayısal olarak incelenerek, üç desen arasında ısı transferi bakımından en uygun olanı belirlenmiştir. Sayısal hesaplamalar, üç boyutlu ve zamandan bağımsız olarak Navier Stokes ve enerji denklemlerinin k-ε türbülans modeli ile Ansys-Fluent programı kullanılarak çözülmesiyle yapılmıştır. Desenli yüzeylerin içerisinde bulunduğu dikdörtgen kesitli kanalların yan, alt ve üst yüzeyleri adyabatik iken yalnızca desenli yüzeylere sabit ısı akısı uygulanmıştır. Jet akışkanı olarak 300 K giriş sıcaklıklı hava kullanılmıştır. Çalışmada değerlendirilen jet-plaka arası uzaklık (H/Dh) 4, 6 ve 12 olup, kullanılan Re sayısı aralığı ise 4000-10000’ dir. Ulaşılan sonuçlar, literatürde bulunan çalışmanın sayısal ve deneysel sonuçlarıyla karşılaştırıldığında birbirleriyle uyum içerisinde oldukları görülmüştür. Sonuçlar, farklı desenli yüzeyler için ortalama Nu sayısı ve yüzey sıcaklık değişimleri olarak gösterilmiştir. Ayrıca, jet akışın kanal boyunca akım çizgisi ve sıcaklık dağılımı konturları analiz edilmiştir. Ters daire desenli yüzeyler için Re=8000 ve H/Dh=12’ de elde edilen ortalama Nu sayısı değerinin, sur desenli yüzey için elde edilenden %21.9 daha fazla olduğu belirlenmiştir.
Anahtar sözcükler: çarpan hava jeti, mikroçip soğutma, ısı transferi
GİRİŞ
Elektronik sistemlerin uygun şekilde tasarımı ve güvenli çalışma şartlarının sağlanabilmesinde ısı transferinin çok büyük bir önemi vardır. Mikroelektroniklerin keşfedilmesi ile elektronik elemanların hacminin küçülmesi, daha hızlı devreler ve artan kapasite ile elektronik devrelerin ısı üretim miktarı artmıştır. Bunun sonucu olarak, yalnızca hava soğutması kullanılarak yeterli ve gerekli soğutma performansının sağlanamayacağı belirlenmiştir. Bununla birlikte, yüksek ısı akılı elektronik elemanların soğutulmasında çarpan hava jetlerinin kullanılması ısı transferinin artışı yönünde etki etmektedir (Narumanchi ve ark., 2003; Kercher ve ark., 2003). Konu ile ilgili olarak yapılan çalışmalar incelendiğinde, Popovac ve Hanjalic (2007) yaptıkları çalışmada ısıtılmış kübik bir plakanın soğutulmasında çarpan jet akışın etkisini araştırmışlardır. Bunun yanı sıra, merkez noktası küp etrafı olmak üzere akış yapılarını incelemişler ve küpün soğutulması ile çevresindeki akış yapıları arasında doğrudan bir bağlantı olduğunu saptamışlardır. Carlomagno ve Ianiro (2014) çarpan jet akış yapısı ve ısı transferi üzerinde Re sayısı ve jet plaka arası uzaklığının değişiminin etkisini incelemişlerdir. Bunun için parçacık görüntülemeli hız ölçüm tekniğinden (PIV) faydalanmışlardır. Bununla birlikte, PIV sonuçlarını ileri hesaplama yöntemleriyle de kıyaslamışlardır. Alnak ve ark. (2018) ısıtılmış üçgen desenli yüzeylerin türbülanslı akış koşulları altında hava jeti akışı ile soğutulmasını sayısal

UEMK 2019 Proceedings Book
24/25 October 2019 Gaziantep University, TURKEY 901
olarak incelemişlerdir. Sabit jet plaka arası uzaklıkta Nu sayısı üzerinde Re sayısı etkisinin oldukça fazla olduğunu belirlemişlerdir. Bir diğer çalışmalarında, Alnak ve ark. (2019) sabit ısı akılı dikdörtgen desenli yüzeylerin çarpan hava jeti ile soğutulmasını analiz etmişlerdir. Boyutsuz jet plaka arası uzaklığın (H/Dh) 4 olduğu durum için Re sayısının 4000’ den 10000’ e artışı ile ortalama Nu sayısında %59.28’ lik artış sağlamışlardır. Bu çalışmalardan farklı olarak yapılan diğer araştırmalarda ise, aynı sınır şartlarında bulunan çarpan hava jeti etkisi altındaki sur ve dikdörtgen desenlere ve ters daire ve düz daire desenlere sahip farklı bakır plakalı yüzeylerin ısı transferi ve akış özellikleri birbirleriyle kıyaslanarak sonuçları analiz edilmiştir (Karabulut ve Alnak, 2019; Karabulut, 2019). Belarbi ve ark. (2018) kişisel bilgisayar işlemcisinin soğutma performansında iyileşme sağlamak amacıyla dikdörtgen kesitli mini kanallı soğutucu bloğun hava jeti çarpması altındaki ısıl ve aerodinamik performanslarını deneysel olarak incelemişler ve en iyi soğutma performansının Y/D=0.606 (jet yüksekliği/çap) oranında elde edildiğini gözlemlemişlerdir.
Bu çalışmada da gelişmiş teknolojinin en küçük elemanı olup, özellikle bilgisayar sistemlerinde yoğun olarak karşılaştığımız mikroçiplerin soğutma performanslarının iyileştirilmesini araştırmak amacıyla bir tarafı açık, üç tarafı kapalı dikdörtgen kesitli kanallar içerisindeki ters daire, ters üçgen ve sur şeklinde olmak üzere üç farklı desene sahip bakır plakalı yüzeylerin çarpan hava jeti ile soğutulmasının sayısal olarak incelenmesi gerçekleştirilmiş olup, birbirleriyle kıyaslanarak üçünün kullanılması halinde ısı transferi bakımından en uygun geometrik desen yapısının bulunması amaçlanmıştır. Sayısal inceleme, zamandan bağımsız, üç boyutlu enerji ve Navier-Stokes denklemlerinin k-ε türbülans modeli ile Ansys-Fluent bilgisayar programının
kullanılarak çözülmesiyle yapılmıştır. Sunulan çalışmada, literatürde var olan çalışmalar göz önüne alınarak, 50x200 mm boyutlarında ve jet-plaka arası uzaklığın etkisini değerlendirmek amacıyla farklı kanal yüksekliklerinde dikdörtgen kesitli kanallar kullanılmış olup, çarpan jet akışkanı olarak ise 300 K kanal giriş sıcaklığına sahip hava kullanılmıştır. Sayısal hesaplamalarda kullanılan jet akışkanı olan havanın kinematik viskozitesi ν=15.89 10-6 m2/s, yoğunluğu ρ=1.1614 kg/m3, özgül ısısı cp=1.007 kj/kgK, ısı iletim katsayısı k=26.3 10-3 W/mK olarak alınmıştır. Jet-desenli plakalar arası uzaklıklar (H/Dh), ters daire, ters üçgen ve sur olmak üzere desenlerin geometrik şekilleri ve jet akışkanı olan havanın kanala giriş hızları (Re sayısı) değişken parametreler olarak değerlendirilmiştir. Tüm incelemelerde, desenli yüzeyler sabit 1000 W/m2’ lik ısı akısıyla ısıtılmaktadır. Çalışılan jet Re sayısı aralığı 4000-10000 iken jet plaka arası uzaklıkları ise 4, 6 ve 12Dh’ dır. Ayrıca, sunulan çalışma, literatürde var olan çalışmanın sayısal ve deneysel sonuçları ile kıyaslanmış ve sonuçların birbirleriyle uyumlu ve tutarlı oldukları belirlenmiştir. Elde edilen sonuçlar, ters daire, ters üçgen ve sur olmak üzere üç farklı desenli yüzeyin her biri için ortalama Nu sayısı ve yüzey sıcaklık değişimleri olarak sunulmuş ve birbirleriyle kıyaslanarak değerlendirilmiştir. Bununla birlikte, çalışmada jet akışın kanal boyunca sıcaklık, akım çizgisi konturu dağılımları da analiz edilmiştir.
YÖNTEM
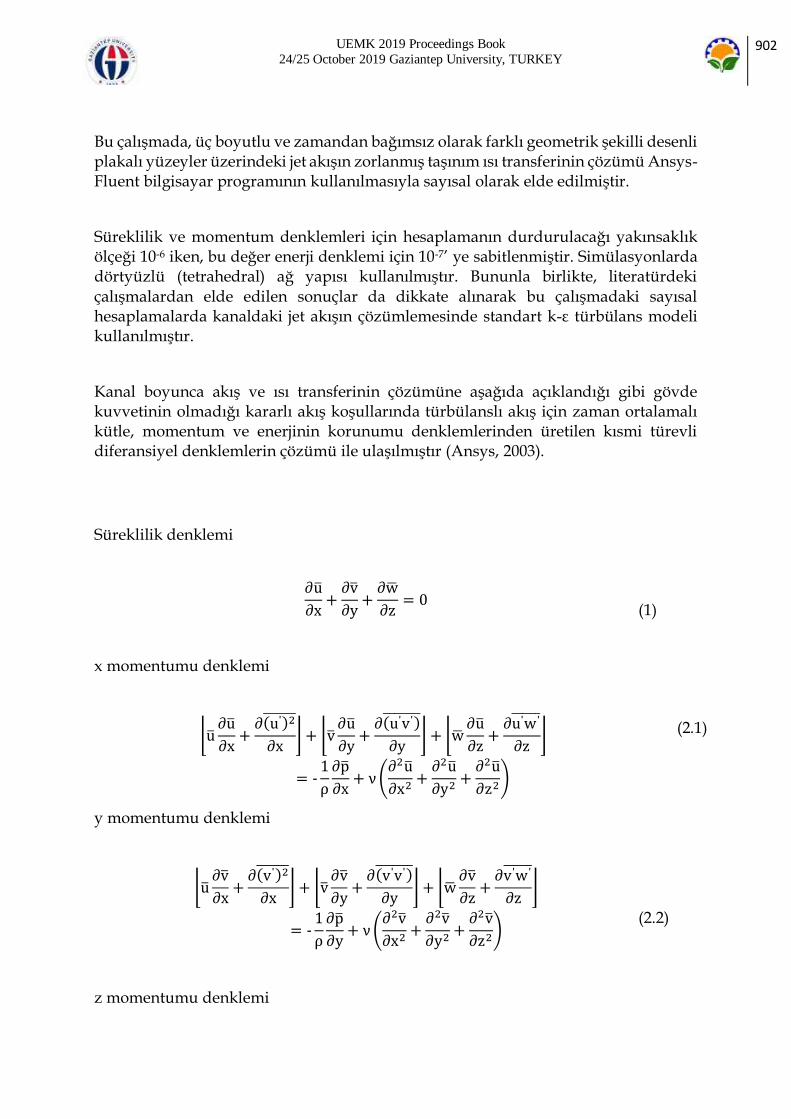
UEMK 2019 Proceedings Book
24/25 October 2019 Gaziantep University, TURKEY 902
Bu çalışmada, üç boyutlu ve zamandan bağımsız olarak farklı geometrik şekilli desenli plakalı yüzeyler üzerindeki jet akışın zorlanmış taşınım ısı transferinin çözümü Ansys-Fluent bilgisayar programının kullanılmasıyla sayısal olarak elde edilmiştir.
Süreklilik ve momentum denklemleri için hesaplamanın durdurulacağı yakınsaklık ölçeği 10-6 iken, bu değer enerji denklemi için 10-7’ ye sabitlenmiştir. Simülasyonlarda dörtyüzlü (tetrahedral) ağ yapısı kullanılmıştır. Bununla birlikte, literatürdeki çalışmalardan elde edilen sonuçlar da dikkate alınarak bu çalışmadaki sayısal hesaplamalarda kanaldaki jet akışın çözümlemesinde standart k-ε türbülans modeli kullanılmıştır.
Kanal boyunca akış ve ısı transferinin çözümüne aşağıda açıklandığı gibi gövde kuvvetinin olmadığı kararlı akış koşullarında türbülanslı akış için zaman ortalamalı kütle, momentum ve enerjinin korunumu denklemlerinden üretilen kısmi türevli diferansiyel denklemlerin çözümü ile ulaşılmıştır (Ansys, 2003).
Süreklilik denklemi
∂u
∂x+∂v
∂y+∂w
∂z= 0
(1)
x momentumu denklemi
⌊u∂u
∂x+∂(u')2
∂x⌋ + ⌊v
∂u
∂y+∂(u'v')
∂y⌋ + ⌊w
∂u
∂z+∂u'w'
∂z⌋
= -1
ρ
∂p
∂x+ ν(
∂2u
∂x2+∂2u
∂y2+∂2u
∂z2)
(2.1)
y momentumu denklemi
⌊u∂v
∂x+∂(v')2
∂x⌋ + ⌊v
∂v
∂y+∂(v'v')
∂y⌋ + ⌊w
∂v
∂z+∂v'w'
∂z⌋
= -1
ρ
∂p
∂y+ ν(
∂2v
∂x2+∂2v
∂y2+∂2v
∂z2)
(2.2)
z momentumu denklemi

UEMK 2019 Proceedings Book
24/25 October 2019 Gaziantep University, TURKEY 903
⌊u∂w
∂x+∂(w')2
∂x⌋ + ⌊v
∂w
∂y+∂(w'v')
∂y⌋ + ⌊w
∂w
∂z+∂w'w'
∂z⌋
= -1
ρ
∂p
∂z+ ν(
∂2w
∂x2+∂2w
∂y2+∂2w
∂z2)
(2.3)
burada u', v', w' ortalama dalgalı hız bileşenleridir (m/s).
Enerji denklemi
⌊u∂T
∂x+ v
∂T
∂y+ w
∂T
∂z⌋ +
∂(u'T')
∂x+∂(v'T')
∂y+∂(w'T')
∂z= (
k
ρcp)(∂2T
∂x2+∂2T
∂y2+∂2T
∂z2)
(3)
Eşitlik 1, 2 ve 3’ de ρ yoğunluk (kg/m3), ν kinematik viskozite (m2/s), p basınç (N/m2), k ısıl iletkenlik (W/m K), T ortalama sıcaklık (K), cp akışkanın özgül ısı kapasitesi (J/kgK), u, v, w x, y ve z koordinatlarındaki ortalama hız bileşenlerini belirtmektedir (m/s).
Daimi akış türbülans kinetik enerjisi denklemi
∂(ρuk')
∂x+∂(ρvk')
∂y+∂(ρwk')
∂z
=∂
∂x(µtσk
∂k'
∂x) +
∂
∂y(µtσk
∂k'
∂y) +
∂
∂z(µtσk
∂k'
∂z) + µtϕ-ρε
(4)
Türbülans viskozitesi
µt = Cµ'ρk'2
ε
(5)
Çalışmada kullanılan k-ε türbülans modelindeki, ε türbülans dağılımı (m2/s3), k
türbülans kinetik enerji (m2/s2) ve viskoz yayılım terimini (m2/s3) göstermektedir.
Türbülans kinetik enerji
k' =1
2(u'2 + v'2 + w'2 )
(6)
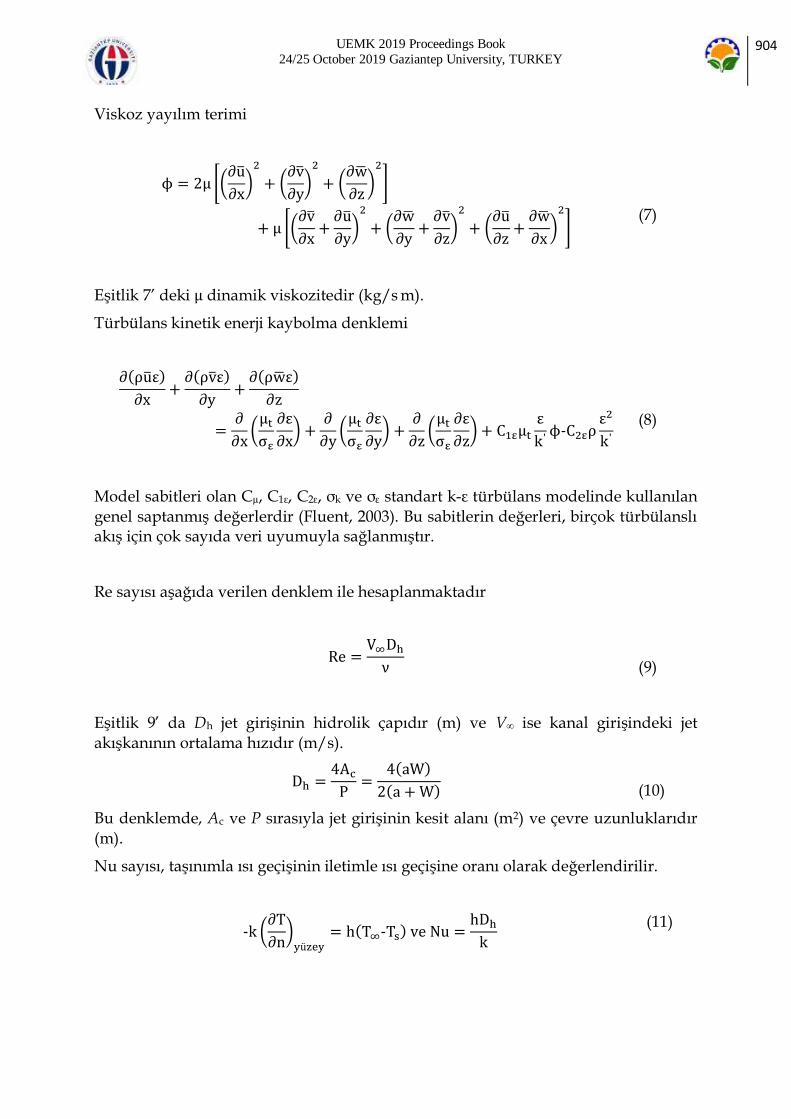
UEMK 2019 Proceedings Book
24/25 October 2019 Gaziantep University, TURKEY 904
Viskoz yayılım terimi
ϕ = 2µ [(∂u
∂x)2
+ (∂v
∂y)2
+ (∂w
∂z)2
]
+ µ [(∂v
∂x+∂u
∂y)2
+ (∂w
∂y+∂v
∂z)2
+ (∂u
∂z+∂w
∂x)2
]
(7)
Eşitlik 7’ deki µ dinamik viskozitedir (kg/s m).
Türbülans kinetik enerji kaybolma denklemi
∂(ρuε)
∂x+∂(ρvε)
∂y+∂(ρwε)
∂z
=∂
∂x(µtσε
∂ε
∂x) +
∂
∂y(µtσε
∂ε
∂y) +
∂
∂z(µtσε
∂ε
∂z) + C1εµt
ε
k'ϕ-C2ερ
ε2
k'
(8)
Model sabitleri olan Cµ, C1ε, C2ε, σk ve σε standart k-ε türbülans modelinde kullanılan genel saptanmış değerlerdir (Fluent, 2003). Bu sabitlerin değerleri, birçok türbülanslı akış için çok sayıda veri uyumuyla sağlanmıştır.
Re sayısı aşağıda verilen denklem ile hesaplanmaktadır
Re =V∞Dhν
(9)
Eşitlik 9’ da Dh jet girişinin hidrolik çapıdır (m) ve V∞ ise kanal girişindeki jet akışkanının ortalama hızıdır (m/s).
Dh =4AcP=
4(aW)
2(a +W)
(10)
Bu denklemde, Ac ve P sırasıyla jet girişinin kesit alanı (m2) ve çevre uzunluklarıdır
(m).
Nu sayısı, taşınımla ısı geçişinin iletimle ısı geçişine oranı olarak değerlendirilir.
-k (∂T
∂n)yüzey
= h(T∞-Ts) ve Nu =hDhk
(11)
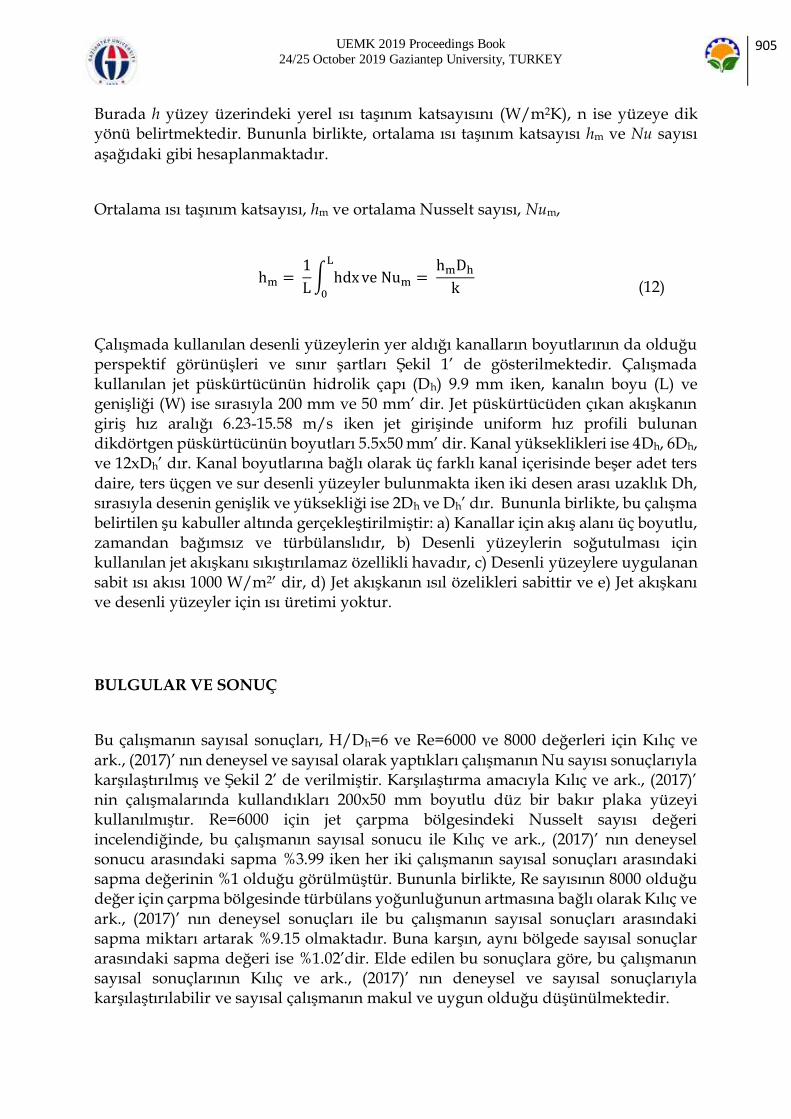
UEMK 2019 Proceedings Book
24/25 October 2019 Gaziantep University, TURKEY 905
Burada h yüzey üzerindeki yerel ısı taşınım katsayısını (W/m2K), n ise yüzeye dik yönü belirtmektedir. Bununla birlikte, ortalama ısı taşınım katsayısı hm ve Nu sayısı
aşağıdaki gibi hesaplanmaktadır.
Ortalama ısı taşınım katsayısı, hm ve ortalama Nusselt sayısı, Num,
hm = 1
L∫ hdxL
0
ve Num = hmDhk
(12)
Çalışmada kullanılan desenli yüzeylerin yer aldığı kanalların boyutlarının da olduğu perspektif görünüşleri ve sınır şartları Şekil 1’ de gösterilmektedir. Çalışmada kullanılan jet püskürtücünün hidrolik çapı (Dh) 9.9 mm iken, kanalın boyu (L) ve genişliği (W) ise sırasıyla 200 mm ve 50 mm’ dir. Jet püskürtücüden çıkan akışkanın giriş hız aralığı 6.23-15.58 m/s iken jet girişinde uniform hız profili bulunan dikdörtgen püskürtücünün boyutları 5.5x50 mm’ dir. Kanal yükseklikleri ise 4Dh, 6Dh, ve 12xDh’ dır. Kanal boyutlarına bağlı olarak üç farklı kanal içerisinde beşer adet ters daire, ters üçgen ve sur desenli yüzeyler bulunmakta iken iki desen arası uzaklık Dh, sırasıyla desenin genişlik ve yüksekliği ise 2Dh ve Dh’ dır. Bununla birlikte, bu çalışma belirtilen şu kabuller altında gerçekleştirilmiştir: a) Kanallar için akış alanı üç boyutlu, zamandan bağımsız ve türbülanslıdır, b) Desenli yüzeylerin soğutulması için kullanılan jet akışkanı sıkıştırılamaz özellikli havadır, c) Desenli yüzeylere uygulanan sabit ısı akısı 1000 W/m2’ dir, d) Jet akışkanın ısıl özelikleri sabittir ve e) Jet akışkanı ve desenli yüzeyler için ısı üretimi yoktur.
BULGULAR VE SONUÇ
Bu çalışmanın sayısal sonuçları, H/Dh=6 ve Re=6000 ve 8000 değerleri için Kılıç ve ark., (2017)’ nın deneysel ve sayısal olarak yaptıkları çalışmanın Nu sayısı sonuçlarıyla karşılaştırılmış ve Şekil 2’ de verilmiştir. Karşılaştırma amacıyla Kılıç ve ark., (2017)’ nin çalışmalarında kullandıkları 200x50 mm boyutlu düz bir bakır plaka yüzeyi kullanılmıştır. Re=6000 için jet çarpma bölgesindeki Nusselt sayısı değeri incelendiğinde, bu çalışmanın sayısal sonucu ile Kılıç ve ark., (2017)’ nın deneysel sonucu arasındaki sapma %3.99 iken her iki çalışmanın sayısal sonuçları arasındaki sapma değerinin %1 olduğu görülmüştür. Bununla birlikte, Re sayısının 8000 olduğu değer için çarpma bölgesinde türbülans yoğunluğunun artmasına bağlı olarak Kılıç ve ark., (2017)’ nın deneysel sonuçları ile bu çalışmanın sayısal sonuçları arasındaki sapma miktarı artarak %9.15 olmaktadır. Buna karşın, aynı bölgede sayısal sonuçlar arasındaki sapma değeri ise %1.02’dir. Elde edilen bu sonuçlara göre, bu çalışmanın sayısal sonuçlarının Kılıç ve ark., (2017)’ nın deneysel ve sayısal sonuçlarıyla karşılaştırılabilir ve sayısal çalışmanın makul ve uygun olduğu düşünülmektedir.

UEMK 2019 Proceedings Book
24/25 October 2019 Gaziantep University, TURKEY 906
Desenli yüzeylerin ortalama Nu sayısı üzerinde ağ sayısının etkisini belirlemek
amacıyla H/Dh=4 ve Re=4000’ de desenli yüzeyler için yapılan ağ bağımsızlık testleri sonucunda sırasıyla ters daire ve sur desenli yüzeyler için 3,338.659 ve ters üçgen desenli yüzey için ise 3,476.017 adet ağ elemanının yeterli olduğu belirlenmiştir.
Şekil 1. (a)-Ters daire (b)-Ters üçgen (c)-Sur Desenli Yüzeylere Sahip Kanalların Perspektif Görünüşleri
Şekil 2. Sunulan Çalışmanın Sonuçlarının Kılıç ve ark. (2017)’ nın Sonuçlarıyla Karşılaştırılması
a b
c

UEMK 2019 Proceedings Book
24/25 October 2019 Gaziantep University, TURKEY 907
Ters daire, ters üçgen ve sur desenli bakır plakalı yüzeylere ait ortalama Nu sayısının H/Dh=6 ve 12 için farklı Re sayılarına göre değişimi sırasıyla Şekil 3A, B ve C’ de gösterilmektedir. Her üç desenli yüzey için beşer adet olmak üzere kanal girişlerinden çıkışlarına doğru eşit uzaklık ve boyutlarda desenler bulunmaktadır. Şekil 3 A, B ve C’ deki ortalama Nu sayıları beş farklı desenin her biri için tüm yüzey boyunca elde edilen ortalama değerlerdir. Her üç desenli yüzeyin olduğu kanalda desenlerin sol alt taraflarında oluşan yeniden dolaşım bölgeleri jet akışı yönlendirmektedir. Buna bağlı olarak, en yüksek ortalama Nu sayısı değerleri Desen 2 için elde edilmektedir. Ayrıca, akışın desenli yüzeyler üzerindeki ve desen aralarındaki hareketine paralel olarak en yüksek ortalama Nu sayısı değerlerine ters daire desenli yüzeyler üzerinde ulaşılırken, en düşük Nu sayısı değerlerine sur desenli yüzeylerde ulaşılmaktadır. H/Dh=12 ve Re=8000 için ters daire desenli yüzeyler için ortalama Nu sayısı değeri ters üçgen desenli yüzeylerden %3.09 daha fazla iken ters üçgen desenli yüzeyler için sur desenli yüzeylere göre bu değerin %21.97 daha fazla olduğu tespit edilmiştir. Aynı zamanda, Re sayısının artışına bağlı olarak Nu sayısı değerlerinde artışlar elde edilmektedir. Bunun yanı sıra, jet etkisinin ve buna bağlı olarak kanal içerisindeki türbülans etkisinin azalması nedeniyle en düşük Nu sayısı değerlerine her üç desen şekli için de Desen 5’ de ulaşılmaktadır. Bununla birlikte, jet plaka arası uzaklığın (H/Dh) artışı, jet akışın yüzeyler üzerindeki etkisinin azalmasına neden olarak soğutma etkisini azaltmaktadır. H/Dh=6 ve Re=8000 için ters daire desenli yüzeyler için elde edilen Nu sayısı değeri, sur desenli yüzeyden %22.6 daha fazla iken aynı Re sayısı değerinde H/Dh=12 için bu değer %21.9 değerine düşmektedir.
Şekil 4A, B ve C’ de sırasıyla ters daire, ters üçgen ve sur desenli yüzeylere ait olmak
üzere farklı Re sayılarında ve H/Dh uzaklıklarında desenlerin ortalama yüzey sıcaklıklarının değişimleri gösterilmektedir. Sıcaklık değerleri kıyaslandığında en yüksek yüzey sıcaklık değerleri sur desenli yüzey için elde edilirken, en düşük yüzey sıcaklık değerlerine ise ters daire desenli yüzeylerde ulaşılmaktadır. Bununla birlikte, H/Dh oranının artması hem jet akışın yüzeyler üzerindeki etkisinin hem de kanal içerisindeki türbülans etkisinin azalmasına neden olarak yüzey sıcaklık değerlerini artırmaktadır. Ayrıca, ters daire ve ters üçgen desenli yüzeyler için H/Dh=6’ da kanal içerisinde meydana gelen yeniden dolaşım bölgelerinin jet akışı yönlendirmesi nedeniyle Desen 1 ile olan temasının azalması sonucu düşük Re sayılarında (4000, 6000) Desen 5’ e göre daha yüksek sıcaklık değerleri elde edilmektedir.

UEMK 2019 Proceedings Book
24/25 October 2019 Gaziantep University, TURKEY 908
Şekil 3. A-Ters daire B-Ters üçgen C-Sur Desenli Yüzeylerde H/Dh (a)-6 (b)-12 İçin
Desen Yüzeyleri Boyunca Ortalama Nu Sayısının Re Sayısı İle Değişimi
Şekil 5A, B ve C’ de H/Dh=4 ve Re=4000 için sırasıyla ters daire, ters üçgen ve sur desenli yüzeylere sahip kanallardaki a-akım çizgisi ve b-sıcaklık dağılımı konturları gösterilmektedir. Şekillerden de görülebileceği gibi kanalların sol alt taraflarında
(a) (b)
3-A 3-A
(a)
3-B
(b)
3-B
(a)
3-C
(c)
3-C

UEMK 2019 Proceedings Book
24/25 October 2019 Gaziantep University, TURKEY 909
birinci desenlerin yanında oluşan yeniden dolaşım bölgesi jet akışı ikinci desene doğru yönlendirmektedir. Bununla birlikte, jet akışın desen aralıklarına giremediği ve özellikle kanal sonuna doğru desenli yüzeylerden ayrıldığı kısımlarda yeniden dolaşım bölgeleri oluşmaktadır. Bu kısımlar, hareketliliğin azaldığı ve akışın kendi içinde akış sirkülasyonunu sürdürdüğü kısımlardır. Bu nedenle, sıcaklık konturu dağılımlarından da görülebileceği gibi bu kısımlarda sıcaklık değerleri artış göstermektedir.
(a)
4-A
(b)
4-A
(a)
4-B
(b)
4-B

UEMK 2019 Proceedings Book
24/25 October 2019 Gaziantep University, TURKEY 910
Şekil 4. A-Ters Daire B-Ters Üçgen C-Sur Desenli Yüzeylerde H/Dh (a)-6 (b)-12 İçin
Desen Yüzeyleri Boyunca Ortalama Sıcaklığın Re Sayısı İle Değişimi
Şekil 5 A-Ters Daire B-Ters Üçgen C-Sur Desenli Yüzeyler İçin (a)-Akım Çizgisi
(b)-Sıcaklık Konturu Dağılımları
SONUÇ
Bu çalışmada bir tarafı açık, üç tarafı kapalı dikdörtgen kesitli kanallar içerisindeki ters
daire, ters üçgen ve sur şeklindeki desenlere sahip bakır plakalı yüzeylerin çarpan
hava jeti ile soğutulması sayısal olarak incelenmiştir. Buna göre, çalışmadan elde
edilen sonuçlar aşağıdaki gibi özetlenmiştir:
(a)
4-C
(b)
4-C
(a5-A
Re=4000 (b)
H/Dh=
5-A
(a
H/Dh=
Re=4000 5-B
(b)
H/Dh=
5-B
H/Dh=
(a5-C
Re=4000
H/Dh=
5-C (b
H/Dh=4

UEMK 2019 Proceedings Book
24/25 October 2019 Gaziantep University, TURKEY 911
Genel itibariyle, Re sayısının artışıyla Nu sayısı artmakla birlikte özellikle Desen 1 için yeniden dolaşım bölgelerinin jet akışı yönlendirmesine bağlı olarak Nu sayısı değerlerinde dalgalanmalar görülebilmektedir. Ayrıca, yeniden dolaşım bölgeleriyle jet akışın yönlenmesi sonucu her üç desenli yüzey için en yüksek Nu sayısı değerlerine Desen 2 için ulaşılmaktadır. Bununla birlikte, en yüksek ortalama Nu sayısı değerlerine ters daire desenli yüzeyler üzerinde ulaşılırken, en düşük Nu sayısı değerleri ise sur desenli yüzeyler için elde edilmektedir.
Sıcaklık değerleri kıyaslandığında en yüksek yüzey sıcaklık değerlerine sur desenli yüzeylerde görülürken, en düşük yüzey sıcaklık değerlerine ise ters daire desenli yüzeylerde ulaşılmaktadır. Jet akışın desen aralıklarına giremediği ve özellikle kanal sonuna doğru desenli yüzeylerden ayrıldığı kısımlarda yeniden dolaşım bölgeleri oluşmaktadır. Sıcaklık konturu dağılımlarından da görülebileceği gibi bu kısımlarda sıcaklık değerleri artış göstermektedir.
Sonuç olarak, jet akışıyla desenli yüzeyler üzerindeki ısı transferi jet akışın Re sayısına, H/Dh oranına ve özellikle desenli yüzeylerin geometrik şekillerine önemli ölçüde bağlıdır. Bununla birlikte, bu çalışmada kullanılan yüzey geometrilerinin mikroçip gibi çeşitli elektronik devrelerde kullanılabilecek yüzey geometrileri düşünülerek tasarlandığından bu gibi elektronik tasarımların soğutma uygulamalarında kullanım alanlarının olabileceği düşünülmektedir.
KAYNAKLAR
ANSYS Inc. (2003). ANSYS FLUENT User’s Guide, Fluent, ANSYS Press, Netherland.
Alnak, D.E., Karabulut, K., Koca, F. (2018). Desenli yüzeylerde hava jeti akışı için taşınım isı transferi ve akış özelliklerinin incelenmesi, Geleceğin dünyasında bilimsel ve mesleki çalışmalar, Ekin basım yayın dağıtım, (s.191-217). Bursa-Türkiye.
Alnak, D. E., Karabulut, K., Koca, F. (2019). Investigation of heat transfer from heated square patterned surfaces in a rectangular channel with an air jet impingement. European Journal of Engineering and Natural Sciences (EJENS), 3, 78-86.
Belarbi, A. A., Beriache, M., Bettahar, A. (2018). Experimental study of aero-thermal heat sink performances subjected to impinging air flow. International Journal of Heat and Technology, 36, 1310-1317.
Carlomagno, G. M., Ianiro. A. (2014). Thermo-fluid-dynamics of submerged jets impinging at short nozzle-to-plate distance: a review. Experimental Thermal and Fluid Science, 58, 15-35.

UEMK 2019 Proceedings Book
24/25 October 2019 Gaziantep University, TURKEY 912
Karabulut, K., Alnak, D.E. (2019). Değişik şekilde tasarlanan isıtılmış yüzeylerin hava jeti çarpmalı soğutulmasının araştırılması. Pamukkale Üniversitesi Mühendislik Bilimleri Dergisi, Baskıdaki makale, PAJES-58812. doi: 10.5505/pajes.2019.58812.
Karabulut, K. (2019). Heat transfer improvement study of electronıc component surfaces usıng air jet impıngement. Journal of Computational Electronics, Article in Press, doi: 10.1007/s10825-019-01387-3.
Kercher, D. S., Lee, J. B., Brand, O., Allen, M. G., Glezer, A. (2003). Microjet cooling devices for thermal management of electronics. IEEE Transactions on Components and Packaging Technologies, 26, 359-366.
Kılıç, M., Çalışır, T., Başkaya, S. (2017). Experimental and numerical study of heat transfer from a heated flat plate in a rectangular channel with an impinging air jet. Journal of Brazilian Society of Mechanical Sciences and Engineering, 39, 329-344.
Narumanchi, S. V. J., Amon, C.H., Murthy, J.Y. (2003). Influence of pulsating submerged liquid jets on chip-level thermal phenomena. Journal of Electronic Packaging, 125, 354-361.
Popovac, M., Hanjalic, K. (2007). Large-eddy simulation of flow over a jet impinged wall mounted cube in a cross stream. International Journal of Heat and Fluid Flow, 28,
1360-1378.

UEMK 2019 Proceedings Book
24/25 October 2019 Gaziantep University, TURKEY 913
DESIGN OF EFFICIENT HEAT INTEGRATION BY PINCH AND EXERGY HYBRID METHODOLOGY
Ozben KUTLU
Ege University, Department of Chemical Engineering
Zehra OZCELIK
Ege University, Department of Chemical Engineering
ABSTRACT: Energy efficiency has been taken a crucial attention by growth in energy demand, and economic crisis across the globe. In energy-intensive industrial sectors such as petrochemical industry and cement plant, more realistic process integration is required. Pinch and exergy are suggested as two powerful analytical methods among efficient process integrations. Pinch analysis is used into a general methodology for design of thermal processes, whereas exergy analysis is a tool that has been widely used to analyze the energy efficiency of industrial processes. The hybrid methodology of these analyses considers heat integration including other forms of recoverable exergy. However, different analysis techniques were applied to various industrial applications. In this study, the analysis techniques of the hybrid methodology applications were investigated, and a case study in the petrochemical plant was presented to demonstrate the efficiency of the hybrid methodology. As a result of the potential scenario, the external heating duty required could be completely eliminated by increasing in number of heat exchanger. Even though the average exergetic efficiency of whole heat exchangers is calculated as 73%, the applicability of scenario
is significantly related with the economic evaluation of process.
Key words: energy efficiency, pinch analysis, exergy, process integration, heat exchanger network
INTRODUCTION
Nowadays, process integration (PI) is crucial methodology to use energy and water efficiently. It can be applied at both grassroots design of process and retrofitting the existing facility. Waste sources (energy, process water or wastewater) can be identified

UEMK 2019 Proceedings Book
24/25 October 2019 Gaziantep University, TURKEY 914
according to minimum area, equipment and utility, and their recovering potential is determined. PI can be undertaken with following aims;
Minimize energy consumption,
Increase production yield,
Reduce operating problems,
Increase plant controllability,
Enable the plant flexibility with respect to the plan,
Minimize undesirable plant emissions.
Pinch analysis being a part of PI, is a thermodynamic approach. Even though beginning of Pinch analysis applications were aimed in energy saving in industry, nowadays it has been employed to solve general waste problems by using both heat and mass integration (Klemes et al., 2018). In the process of heat integration, energy demand and source is matched up (Linnhoff and Flower, 1978), and Heat Exchanger Network (HEN) is created by including multiple heat exchanger. Whereas HEN at grassroots design permits the freest choice in the design options and equipment dimensions, its aim at existing facility is both the improvement of capacity, product quality and safety, and the decrease in the operating costs and emissions by using
available utility.
Heat integration consist of four phase; these are data extraction, targeting, initial design and optimization. In the first phase (data extraction), process streams and utilities is identified and divided by hot and cold streams. Hot process stream is defined for a stream being cooled forward to the outlet, while cold process stream stands for a stream being heated. In the second phase (targeting), minimum number of equipment, heat transfer area and optimum heat recovery are calculated in accordance with utility consumption. After that, the utility exchangers are placed on the streams, and then a heat exchanger network that satisfies the previously defined performance target, is established. In the last phase, the maximum energy recovery obtaining from third phase is economically simplified and improved according to minimum temperature difference (ΔTmin). As a results of high ΔTmin, the energy cost increases while investment cost decreases (Akgun and Ozcelik, 2017). For that reason, economical trade-offs should be taken into account during ΔTmin selection.
A graphical technique, i.e. T-H diagram, is carried out for determining heat cascade. The Composite Curves (T-H diagram) are generated by dividing the temperature axis into intervals depending on the supply and target temperatures of hot and cold streams, and to add together the heat load in each temperature interval (Gundersen, 2013). The curve identifies energy targets and Pinch point where the design is starting from. The design includes several principles that offer guidance in constructing a feasible and near optimal HEN. Whereas there is an endothermic zone with a heat deficit above the pinch point, an exothermic zone where cooling is needed presents below the point (Zoughaib, 2017). Furthermore, Pinch point divides the heat exchanger network into two distinct regions (heat source and sink), and therefore the heat does

UEMK 2019 Proceedings Book
24/25 October 2019 Gaziantep University, TURKEY 915
not transfer across the Pinch point. Loops should also be avoided in the heat integration system.
One of the disadvantage of the Pinch analysis is to remain unsolvable for threshold problems that are considerable common in applications. Moreover, the pinch analysis cannot be applicable, if a system consists of not only heat exchangers. Exergy analysis is a much more powerful thermodynamic tool in these cases (Wall and Gong, 1996). Contrary to energy, exergy is exempt from the law of conservation. In reality, exergy input consistently exceeds exergy output owing to exergy destruction, i.e. irreversibility. (Cengel and Boles 1994). Since exergy analysis can identify quality of the energy, it enables to make complex thermodynamic systems operates more efficiently (Ahmadi et al., 2018). Therefore, combination of pinch and exergy analysis could be an appropriate tool for simultaneous study of heat and power. Even though previous applications were carried out in Combined Heat and Power systems, several methods and approaches have been developed. In this study, the analysis techniques of the hybrid methodology applications were summarized, and a case study in the petrochemical plant was presented to demonstrate the efficiency of the hybrid methodology.
HYBRID INDUSTRIAL APPLICATIONS
Pinch analysis deals with the quantity and quality of energy and targets to reduce the loss of energy. The power of using second law insights to prescribe improved designs in HEN, and the advantage of this approach over pinch technology has been clearly demonstrated (Wall and Gong, 1999).
Exergy Composite Curve (ECC) as a novel diagram where its axes are Carnot factor and enthalpy was introduced in the late 20th century (Umeda and Harada, 1979; Linnhoff and Dhole, 1992). After that, a new methodology referred to as Extended Pinch Analysis and Design (ExPAnD) was developed by a team at the Norwegian University of Science and Technology (Klemes et al. 2018). This study presented a procedure for utilizing pressure-based exergy at sub-ambient cooling (Aspelund et al., 2007). After following this study, ECC was improved again, and then the temperature-based exergy component in setting exergy targets was focused. For a constant heat capacity flow rate, mCp, the difference of exergy of a fluid between two state was derived as following equation (1);
(1)
In a new Exergy Pinch Analysis, the exergetic temperatures (Tex) at the equation replaced in time as the Carnot factor (Marmolejo-Correa and Gundersen, 2013). In recent years, a new numerical approach called the Exergy Problem Table Algorithm

UEMK 2019 Proceedings Book
24/25 October 2019 Gaziantep University, TURKEY 916
(Ex-PTA) for exergy targets was eventually proposed by Hamsani et al. (2017). In the light of these information, some different techniques applied for various pinch and exergy analysis in industrial applications was summarized in Table 1. While researches about hybrid methodology have been going on day by day, it is foreseen that a direction of growing interest is tending to the Work and Heat Exchanger Network– WHEN synthesis (Klemes et al. 2018).

UEMK 2019 Proceedings Book
24/25 October 2019 Gaziantep University, TURKEY 917
Table 1. Some techniques applied for various pinch and exergy analysis (Bandyopadhyay et al. 2019)
Reference Technique applied Application
Umeda et al. (1979) Heat availability diagram
A basic chemical processing system comprising of a reactor subsystem and a distillation subsystem
Ishida and Kawamura (1982)
Enthalpy-direction factor diagram
Methanol synthesis, steam power generation system
Linnhoff and Dhole (1992)
Exergy Composite Curve (ECC) and Exergy Grand Composite Curve (EGCC)
Ethylene production process
Dhole and Zheng (1995)
Combined Pinch and Exergy Representation (CPER)
Closed cycle gas turbine (CCGT) system
Homsak and Glaviic (1995)
Temperature vs. power availability diagram
Evaporative process with two pressure exchangers
Staine and Favrat (1996)
Extended Composite Curves
Combined-cycle power plant
Sorin and Paris (1997) PA integrated with exergy load distribution method
Hydrogen production by methane reforming
Feng and Zhu (1997) Temperature level (U)-
enthalpy (H) diagram Combined power plant
Anantharaman et al. (2006)
Energy level Composite Curves
Methanol synthesis process
Aspelund et al. (2007) Extended Pinch Analysis and Design (ExPAnD)
Liquefaction of natural gas to LNG
Ataei and Yoo (2010) Combined Pinch and Exergy Analysis (CPEA)
Steam power plant
Ghorbani et al. (2012) Exergy Grand Composite Curve (EGCC)
Refrigeration cycle in NGL recovery plant
Marmolejo-Correa and Gundersen (2012)
Exergetic temperature approach
LNG processes
Arriola-Medellín et al. (2014)
Exergy Composite Curve (ECC)
Steam power plant
Thibault et al. (2015)
Combining Pinch and Exergy Analysis in parallel step through MILP algorithm
Brewery process

UEMK 2019 Proceedings Book
24/25 October 2019 Gaziantep University, TURKEY 918
Ghannadzadeh and Sadeqzadeh (2017b)
Exergy aided Pinch Analysis
Chlorine-caustic soda production process
Bühler et al. (2018) PA and Exergy Analysis applied separately
Milk processing factory
Rashidi and Yoo (2018) Exergy-Pinch (EXPA) Analysis
Kalina power-cooling cycle
Hamsani et al. (2018)
Exergy Problem Table Algorithm (Ex-PTA) - Extended Pinch Analysis and Design (ExPAnD)
Low temperature heat exchanger network
Mehdizadeh-Fard (2018)
Combined Pinch and Exergy Analysis (CPEA)
Natural gas refinery
Mehdizadeh-Fard (2019)
PA followed by Advanced Exergy Analysis (AEA)
Natural gas refinery
Some of the most recent combined pinch and exergy analysis were carried out in a steam power plant (Arriola-Medellin et al., 2014); chemical production plant (Ghannadzadeh and Sadeqzadeh, 2017a; Burre et al. 2019); methanation process in coal-gas industry (Wang et al., 2019); and diesel hydrotreating unit (Bandyopadhyay et al 2019). The results of the hybrid methodology for some industrial applications was summarized in Table 2.

UEMK 2019 Proceedings Book
24/25 October 2019 Gaziantep University, TURKEY 919
Table 2. Results of exergy and pinch analysis for some industrial applications (Klemes et al. 2018)
Reference Application Results
Ghorbani et al. 2012 Natural gas liquids recovery plant
Refrigeration exergy efficiency increased from 26% to 28%, with a 170 kWe reduction in work
Modarresi et al. 2012 Bioethanol production
Increased heat integration up to 45MW
Arriola-Medellin et al. 2014 Steam power plant
Identified power efficiency increase from 29.48% to 30.30%
Kamalinejad et al. 2014 Liquefied Natural Gas Cycle
Shaft work reduced from 1479.36 kJ/kg to 1158.8 kJ/kg
Ghannadzadeh and Sadeqzadeh 2017a Ethylene oxide production
Minimum cold utility requirement reduced from 602MW (normal Heat Pinch) to 578MW (Heat and Exergy Pinch)
Ghannadzadeh and Sadeqzadeh 2017b Chlorine-caustic soda production
process
Total cold energy reduced from 13.0 MW to
0.4 MW
Mehdizadeh Fard 2018 Natural Gas refinery
78% improvement in exergetic efficiency and a 36% reduction in energy consumption
DESCRIPTION of CASE STUDY
As a petrochemical plant, ethylene oxide/ethylene glycol plant was investigated with respect to minimum energy requirement (MER) and minimization of utility usage (Gündoğdu and Ceylan, 2016). The annual capacity of plant is 89,000 tonnes, and main raw materials are ethylene, oxygen, and methane. Furthermore, process water, demineralized water, process air, nitrogen, steam, and cooling water was used as auxiliary substances. In the process, ethylene and pure oxygen are firstly mixed and passed through a multitubular catalytic reactor to produce ethylene oxide selectively. Than ethylene oxide and water are reacted at high pressure due to produce ethylene glycols, mainly monoethylene and diethylene glycols. The plant can be investigated at five sections; (1) ethylene oxide reaction and recovery (2) ethylene oxide purification,

UEMK 2019 Proceedings Book
24/25 October 2019 Gaziantep University, TURKEY 920
(3) glycol reaction and dehydration, (4) glycol purification and (5) glycol bleed recovery section. The simplified flowsheet of one section is shown in Figure 1 (Petkim, 2011). For the case study, the heat exchangers, reboilers, heaters, condensers and coolers in whole process were involved in pinch analysis. The external cold and hot utilities required are calculated as 53253.74 kW and 50483.36 kW, respectively. While a lot of reboiler and condenser are used, only three heat exchanger exist in entire plant. The recovered energy from these exchangers is found as 39457.71 kW that is about 38% of total utilities.
Figure 1. Simplified flowsheet of ethylene oxide reaction (Petkim, 2011)
As a result, fourteen hot and fourteen cold process streams were defined for HEN. The supply (Ts) and target temperatures (TT) of process streams were shown in Table 3. At the beginning of alternative HEN design, the problem table for these streams was extracted by using mass flow rates, supply temperatures (Ts) and target temperatures (TT). Then, the heat capacity flow rates (CP) and heat loads of all streams (ΔH) were calculated by following equations;
CP = m*Cp (2)
ΔH = CP*∆T (3)
Table 3. Problem table of case study
Streams CP (kW/K) Ts (0C) TT (0C) Streams CP (kW/K) Ts (0C) TT (0C)
Hot 1 104.79 260 110 Cold 1 104.81 53 152

UEMK 2019 Proceedings Book
24/25 October 2019 Gaziantep University, TURKEY 921
Hot 2 22.50 109 69 Cold 2 6.25 109 110
Hot 3 5.97 98 85 Cold 3 6.71 109 110
Hot 4 2.67 53 45 Cold 4 421.5 38 107
Hot 5 424.50 140 71 Cold 5 3.29 140 141
Hot 6 2.66 140 40 Cold 6 32.19 140 141
Hot 7 8.09 126 38 Cold 7 0.72 140 141
Hot 8 0.83 35 21 Cold 8 1.36 53 54
Hot 9 0.80 35 21 Cold 9 111.98 94 190
Hot 10 44.98 229 179 Cold 10 68.42 171 172
Hot 11 67.54 229 180 Cold 11 26.55 169 170
Hot 12 9.77 71 50 Cold 12 111.02 171 172
Hot 13 7.44 125 40 Cold 13 6.25 170 171
Hot 14 0.70 120 40 Cold 14 10.83 172 173
RESULTS AND FINDINGS
Figure 2. Composite and grand composite curves
Whereas the optimum value for ΔTmin is generally selected in the range of 3 to 40 °C, it is unique for each network (Keshavarzian et al., 2015). In this case study, ∆Tmin was assumed as 20°C, and then the composite curve and grand composite curve were drawn by using cascade algorithm (Figure 2). There is no heat transfer between streams at 250°C, and therefore the pinch point was found as 250°C. On the other hand,
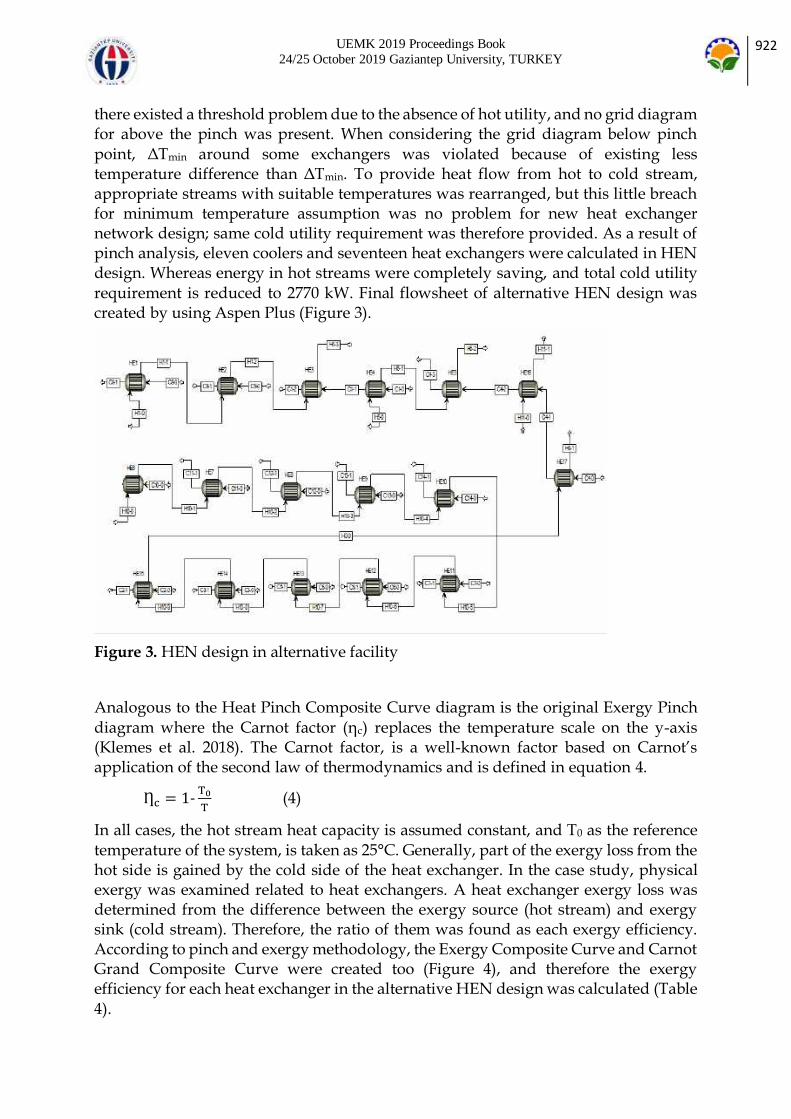
UEMK 2019 Proceedings Book
24/25 October 2019 Gaziantep University, TURKEY 922
there existed a threshold problem due to the absence of hot utility, and no grid diagram for above the pinch was present. When considering the grid diagram below pinch point, ΔTmin around some exchangers was violated because of existing less temperature difference than ΔTmin. To provide heat flow from hot to cold stream, appropriate streams with suitable temperatures was rearranged, but this little breach for minimum temperature assumption was no problem for new heat exchanger network design; same cold utility requirement was therefore provided. As a result of pinch analysis, eleven coolers and seventeen heat exchangers were calculated in HEN design. Whereas energy in hot streams were completely saving, and total cold utility requirement is reduced to 2770 kW. Final flowsheet of alternative HEN design was created by using Aspen Plus (Figure 3).
Figure 3. HEN design in alternative facility
Analogous to the Heat Pinch Composite Curve diagram is the original Exergy Pinch
diagram where the Carnot factor (ηc) replaces the temperature scale on the y-axis (Klemes et al. 2018). The Carnot factor, is a well-known factor based on Carnot’s application of the second law of thermodynamics and is defined in equation 4.
Ƞc = 1-T0
T (4)
In all cases, the hot stream heat capacity is assumed constant, and T0 as the reference temperature of the system, is taken as 25°C. Generally, part of the exergy loss from the hot side is gained by the cold side of the heat exchanger. In the case study, physical exergy was examined related to heat exchangers. A heat exchanger exergy loss was determined from the difference between the exergy source (hot stream) and exergy sink (cold stream). Therefore, the ratio of them was found as each exergy efficiency. According to pinch and exergy methodology, the Exergy Composite Curve and Carnot Grand Composite Curve were created too (Figure 4), and therefore the exergy efficiency for each heat exchanger in the alternative HEN design was calculated (Table 4).

UEMK 2019 Proceedings Book
24/25 October 2019 Gaziantep University, TURKEY 923
Figure 4. Exergy Composite Curve and Carnot Grand Composite Curve
Table 4. Exergy and Exergetic Efficiency Data for alternative HEN design
∆E (kW) ex ∆E (kW) ex
HEX-1 2.35 83.99 HEX-11 0.47 38.23
HEX-2 873.12 81.80 HEX-12 0.32 98.17
HEX-3 190.57 86.07 HEX-13 0.31 83.15
HEX-4 710.86 49.81 HEX-14 0.05 98.57
HEX-5 1363.21 75.43 HEX-15 0.96 75.54
HEX-6 48.90 51.16 HEX-16 1231.04 0.59
HEX-7 0.25 98.06 HEX-17 334.62 41.00
HEX-8 0.01 99.98
HEX-9 0.41 87.80
HEX-10 0.01 99.84
As a result of the combination of pinch and exergy analysis, total exergy loss is reduced from 5007 kW to about 4752 kW, and the average exergetic efficiency of HEN is calculated as 73 %. At this point, fifth heat exchanger has the highest exergy loss (1364 kW), and it causes to about 29% of the total exergy loss. As looking at the efficiency of this exchanger, it is observed that it has moderate exergetic efficiency among the exchangers.

UEMK 2019 Proceedings Book
24/25 October 2019 Gaziantep University, TURKEY 924
Other high exergy loss (1231 kW) occurs in sixteenth exchanger, which connects eleventh hot stream to fourth cold stream. While its exergy loss results in approximately 26% of the total exergy loss, the lowest exergetic efficiency in HEN is also observed sixteenth exchanger (0.59%). This is a crucial problem, and so it should certainly be interfered to this exchanger for providing less exergy loss. Possible solutions to prevent undesirable loss may be to change the configuration of heat exchanger or thickness of isolation.
CONCLUSION
After the improvement, more energy was recovered and exergy losses were minimized. The number of heat exchangers were increased to seventeen. Whereas energy in hot streams were completely saving, and energy saving cold was calculated as 95%. By using this retrofitting, exergy was saved by the rate of 5%, too. When hot utility requirement was eliminated completely by increasing heat exchanger numbers, the importance of retrofitting for existing plant was therefore presented. Because the improvement of 5% for a plant at this capacity leads to the increase in annual profit, similar retrofitting alternatives should also be taken into account.
REFERENCES
Ahmadi, M.H., Alhuyi Nazari, M., Sadeghzadeh, M., et al. (2018) Thermodynamic and economic analysis of performance evaluation of all the thermal power plants: A review. Energy Sci Eng. :1–36. https://doi.org/10.1002/ese3.223
Akgun, N., Ozcelik, Z. (2017) Debottlenecking and Retrofitting by Pinch Analysis in a Chemical Plant. American Journal of Energy Engineering 5(5): 39–49. doi: 10.11648/j.ajee.20170505.13
Anantharaman, R., Abbas, O.S., Gundersen, T., (2006). Energy Level Composite Curvesda new graphical methodology for the integration of energy intensive processes. Appl. Therm. Eng. 26 (13), 1378–1384 DOI: 10.1016/j.applthermaleng.2005.05.029
Arriola-Medellín, A., Manzanares-Papayanopoulos, E., Romo-Millares, C., (2014). Diagnosis and redesign of power plants using combined pinch and exergy analysis. Energy 72, 643–651, https://doi.org/10.1016/j.energy.2014.05.090
Aspelund, A., Berstad, D.O., Gundersen, T. (2017) An Extended Pinch Analysis and design procedure utilizing pressure based exergy for subambient cooling. Appl. Therm. Eng. 27:2633–49 https://doi.org/10.1016/j.applthermaleng.2007.04.017
Ataei, A., Yoo, C., (2010). Combined pinch and exergy analysis for energy efficiency optimization in a steam power plant. Int. J. Phys. Sci. 5 (7), 1110–1123

UEMK 2019 Proceedings Book
24/25 October 2019 Gaziantep University, TURKEY 925
Bandyopadhyay, Alkilde, O.F., Upadhyayula, S. (2019) Applying pinch and exergy analysis for energy efficient design of diesel hydrotreating unit, Journal of Cleaner
Production 232: 337–349 https://doi.org/10.1016/j.jclepro.2019.05.277
Bühler, F., Nguyen, T.V., Jensen, J.K., Holm, F.M., Elmegaard, B., (2018). Energy, exergy and advanced exergy analysis of a milk processing factory. Energy 162, 576–592. https://doi.org/10.1016/j.energy.2018.08.029
Burre, J., Bongartz, D., Mitsos, A., (2019) Production of Oxymethylene Dimethyl Ethers from Hydrogen and Carbon Dioxide—Part II: Modeling and Analysis for OME3–5, Ind. Eng. Chem. Res. 58:5567−5578 https://doi.org/10.1021/acs.iecr.8b05577.
Cengel, Y.A., Boles, M.A. (1994) Thermodynamics: An Engineering Approach, McGraw-Hill, 2nd Edition, 388-391.
Dhole, V.R., Zheng, J.P., (1995). Applying combined pinch and exergy analysis to closed-cycle gas turbine system design. J. Eng. Gas Turbines Power 117, 47–52 https://doi.org/10.1115/1.2812780
Feng, X., Zhu, X.X., (1997). Combining pinch and exergy analysis for process modifications. Appl. Therm. Eng. 17 (3), 249–261 https://doi.org/10.1016/S1359-4311(96)00035-X
Ghannadzadeh, A., Sadeqzadeh, M. (2017a) Combined pinch and exergy analysis of an ethylene oxide production process to boost energy efficiency toward environmental sustainability, Clean Techn. Environ. Policy 19:2145–2160 https://doi.org/10.1007/s10098-017-1402-5.
Ghannadzadeh, A., Sadeqzadeh, M. (2017b) Exergy aided pinch analysis to enhance energy integration towards environmental sustainability in a chlorine-caustic soda production process. Appl Therm Eng 125:1518–29. https://doi.org/10.1016/j.applthermaleng.2017.07.052
Ghorbani B, Salehi GR, Ghaemmaleki H, Amidpour M, Hamedi MH. (2012) Simulation and optimization of refrigeration cycle in NGL recovery plants with exergy-pinch analysis. J Nat Gas Sci Eng;7:35–43. https://doi.org/10.1016/j.jngse.2012.03.003
Ghorbani, B., Salehi, G.R., Ghaemmaleki, H., Amidpour, M., Hamedi, M.H., (2012). Simulation and optimization of refrigeration cycle in NGL recovery plants with exergy-pinch analysis. J. Nat. Gas Sci. Eng. 7, 35–43.
https://doi.org/10.1016/j.jngse.2012.03.003
Gundersen, T., (2013) Heat Integration: Targets and Heat Exchanger Network Design, in Handbook of Process Integration (PI), Woodhead Publishing, Editor: Jiří J. Klemeš, 129-167.
Gündoğdu, G., Ceylan, Z. (2016) Exergo-Pinch application on a petrochemical plant, Ege University, Department of Chemical Engineering Diploma Project.
Hamsani, M.N., Liew, P.Y., Walmsley, T.G. (2017) A new numerical approach for exergy targets and losses determination in sub-ambient processes. Chem. Eng. Trans. 61:1225–31. https://doi.org/10.3303/CET1761202

UEMK 2019 Proceedings Book
24/25 October 2019 Gaziantep University, TURKEY 926
Hamsani, M.N., Walmsley, T.G., Liew, P.Y., Wan Alwi, S.R. (2018) Combined Pinch and exergy numerical analysis for low temperature heat exchanger network. Energy 153:100–12. https://doi.org/10.1016/j.energy.2018.04.023
Homsak, M., Glavic, P., (1996). Pressure exchangers in pinch technology. Comput. Chem. Eng. 20 (6-7), 711–715 https://doi.org/10.1016/0098-1354(95)00204-9
Ishida, M., Kawamura, K., (1982). Energy and exergy analysis of a chemical process system with distributed parameters based on the enthalpy-direction factor diagram. Ind. Eng. Chem. Process Des. Dev. 21 (4), 690–695 https://doi.org/10.1021/i200019a025
Kamalinejad M, Amidpour M, Naenian MM. (2014) Optimal synthesis of cascade refrigeration in liquefied natural gas cycles by pinch-exergy. Journal of Oil, Gas and Petrochemical Technology 1:29–44 DOI: 10.22034/JOGPT.2014.4779
Keshavarzian, S., Verda, V., Colombo, E., Razmjoo, P. (2015) Fuel saving due to pinch analysis and heat recovery in a petrochemical company. Proceedings of ECOS 2015 - The 28th International Conference on Efficiency, Cost, Optimization, Simulation and Environmental Impact of Energy Systems, June 30-July 3, Pau, France.
Klemeš, J.J., Varbanov, P.S., Walmsley, T.G., Jia, X. (2018) New directions in the implementation of Pinch Methodology (PM), Renewable and Sustainable Energy Reviews
98: 439–468, https://doi.org/10.1016/j.rser.2018.09.030
Linnhoff, B., Dhole, V.R. (1992) Shaftwork targets for low-temperature process design. Chem. Eng. Sci. 47(8):2081–2091 https://doi.org/10.1016/0009-2509(92)80324-6
Linnhoff, B., Flower, JR., (1978) Synthesis of Heat Exchanger Networks. II. Evolutionary Generation of Networks with Various Criteria of Optimality, AIChE J; 24
(4): 633–642 https://doi.org/10.1002/aic.690240412
Marmolejo-Correa, D., Gundersen, T., (2012). A new procedure for the design of LNG processes by combining Exergy and Pinch Analyses. In: The 25th International Conference on Efficiency, Cost, Optimization and Simulation of Energy Conversion Systems and Processes, vol. 24.
Marmolejo-Correa, D., Gundersen, T., (2013) New graphical representation of exergy applied to low temperature process design. Ind Eng Chem Res, 52:7145–56. https://doi.org/10.1021/ie302541e
Mehdizadeh Fard M, Pourfayaz F, Mehrpooya M, Kasaeian AB. (2018) Improving energy efficiency in a complex natural gas refinery using combined pinch and advanced exergy analyses. Appl Therm Eng 137:341–55.
https://doi.org/10.1016/j.applthermaleng.2018.03.054
Mehdizadeh-Fard, M., Pourfayaz, F., (2019). Advanced exergy analysis of heat exchanger network in a complex natural gas refinery. J. Clean. Prod. 206, 670–687 https://doi.org/10.1016/j.jclepro.2018.09.166
Modarresi A, Kravanja P, Friedl A. Pinch and exergy analysis of lignocellulosic ethanol, biomethane, heat and power production from straw. Appl Therm Eng 43:20–8. https://doi.org/10.1016/j.applthermaleng.2012.01.026

UEMK 2019 Proceedings Book
24/25 October 2019 Gaziantep University, TURKEY 927
Petkim (2011) Operating education book of ethylene oxide/ethylene glycol (EO/EG) plant, 1–126.
Rashidi, J., Yoo, C., (2018). Exergy, exergo-economic, and exergy-pinch analyses (EXPA) of the kalina power-cooling cycle with an ejector. Energy 155, 504–520 https://doi.org/10.1016/j.energy.2018.04.178
Sorin, M., Paris, J., (1997). Combined exergy and pinch approach to process analysis. Comput. Chem. Eng. 21, S23–S28 https://doi.org/10.1016/S0098-1354(97)87473-X
Staine, F., Favrat, D., (1996). Energy integration of industrial processes based on the pinch analysis method extended to include exergy factors. Appl. Therm. Eng. 16 (6),
497–507 https://doi.org/10.1016/1359-4311(95)00036-4
Thibault, F., Zoughaib, A., Pelloux-Prayer, S., (2015). A MILP algorithm for utilities predesign based on the Pinch Analysis and an exergy criterion. Comput. Chem. Eng. 75,
65–73. https://doi.org/10.1016/j.compchemeng.2014.12.010
Umeda, T., Harada, T., Shiroko, K. A. (1979) A thermodynamic approach to the synthesis of heat integration systems in chemical processes. Comput Chem Eng 3(1–4):273–282 https://doi.org/10.1016/0098-1354(79)80046-0
Wall, G., Gong, M. (1999) Exergy Analysis Versus Pinch Technology, Efficiency, Costs,
Optimization, Simulation and Environmental Aspects of Energy Systems (ECOS’96), June 25-27, STOCKHOLM, 451–455.
Wang, C, Guang, C, Zhang, Z.S., Gao, J., (2019) Design and optimization of heat exchange network and exergy analysis for methanation process of coal-gas, Latin American Applied Research 49 (1):47-54.
Zoughaib, A. (2017) Energy Integration of Continuous Processes: From Pinch Analysis to Hybrid Exergy/Pinch Analysis, in From Pinch Methodology to Pinch-Energy
Integration of Flexible Systems, ISTE Press – Elsevier, 1-53.