Embed Size (px)
Citation preview
PICTORIAL REVIEW
Comparison of CT and MR imaging in ischemic stroke
Josef Vymazal & Aaron M. Rulseh & Jiří Keller &
Ladislava Janouskova
Received: 19 December 2011 /Accepted: 3 July 2012 /Published online: 29 September 2012# The Author(s) 2012. This article is published with open access at Springerlink.com
AbstractBackground Cerebrovascular disease represents a majorsource of global mortality and morbidity. Imaging examina-tions play a critical role in the management of strokepatients, from establishing the initial diagnosis to determin-ing and guiding further treatment.Methods In this article, current CT and MRI methodsemployed in the management of stroke patients arereviewed, with an emphasis on ischemic stroke.Results The advantages and disadvantages of these techni-ques are discussed, a number of cases emphasizing keypoints are presented, and a comparison between modernCT and MRI techniques is outlined.Conclusion The major drawback of CT is the high radiationdose, while in MRI it is the more complicated and time-consuming aspect of the examination.
Main Messages• Cerebrovascular disease represents a major source ofglobal mortality and morbidity
• Imaging examinations play a critical role in the manage-ment of stroke patients
• The penumbra may be seen with both CT and MRI;however, this concept may be overly simplistic
• The major drawback of CT is the high radiation dose,while MRI is a more complicated examination
Keywords Cerebrovascular stroke . Magnetic resonanceimaging . Computed tomography, spiral . Perfusion imaging
Introduction
Cerebrovascular disease represents a major source of globalmortality, with over 6 million deaths documented annually,and is the second leading cause of death in all incomegroups worldwide, exceeded only by ischemic heart disease[1]. In addition to being a leading source of mortality,cerebrovascular disease is also a significant cause of mor-bidity. As many as 50 % of stroke survivors do not regainfunctional independence, and 20 % require institutional care3 months after stroke onset [2].
Stroke, or cerebrovascular accident, is characterised bythe onset of neurological symptomatology that most oftenincludes hemiparesis, aphasia or hemianopia (paraparesis isnot typical for stroke and suggests an ischemic lesion in thespinal cord or other non-ischemic etiology). The onset maybe sudden or discovered after arousal, and may be accom-panied by headache, vomiting, vertigo or loss of conscious-ness. Stroke can be generally classified as ischemic orhemorrhagic. Treatment strategies for these two subtypesof stroke are markedly different, and the early diagnosis of
J. Vymazal :A. M. Rulseh : J. Keller : L. JanouskovaDepartment of Radiology, Na Homolce Hospital,Prague, Czech Republic
J. VymazalDepartment of Neurology, 1st Medical Faculty,Charles University in Prague,Prague, Czech Republic
A. M. Rulseh1st Medical Faculty, Charles University in Prague,Prague, Czech Republic
J. Keller3rd Medical Faculty Prague, Charles University in Prague,Prague, Czech Republic
J. Vymazal (*)Na Homolce Hospital,Roentgenova 2,15030 Prague 5, Czech Republice-mail: [email protected]
Insights Imaging (2012) 3:619–627DOI 10.1007/s13244-012-0185-9
stroke as well as determination of the subtype is an impor-tant early step in stroke management.
Hemorrhagic stroke, or intracerebral hemorrhage, repre-sents 10–15 % of stroke cases. Although the incidence ofthis type of stroke is low, it is associated with significantmorbidity and mortality. Up to 38 % of patients that expe-rience hemorrhagic stroke will die within 30 days [3], andapproximately half of survivors will remain dependent onothers for activities of daily living [4]. Ischemic stroke ismore common, representing approximately 85 % of allstroke cases, and has a much lower 30-day mortality rateat approximately 12 % [2]. Morbidity in ischemic strokemay also be severe and is highly dependent upon timelydiagnosis and initiation of treatment. An ischemic lesionmay also undergo hemorrhagic transformation. This isespecially typical for infarction caused by venous occlusion.When hemorrhagic infarction is detected, occlusion of thevenous (sinus) system should be considered. Additionally,transient ischemic attack (TIA) may occur, which involvesfocal neurological deficit that resolves within 24 h.Although self-limited, TIA may complicate the diagnosisof ischemic stroke. A TIA is also a strong short-term riskfactor for stroke, as up to 20 % of patients that have a TIAwill suffer a stroke within 90 days [2].
The expression “time is brain” relates to the time-dependent outcome in stroke management, and reflects thefact that the final infarct volume in ischemic stroke isdependent not only on regional cerebral blood flow (rCBF,ml/100 mg/min), but also on the length of time that rCBFhas been reduced. There have been efforts to establishcertain rCBF thresholds for functional and irreversibleimpairment in brain ischemia. Generally, rCBF<50 is con-sidered hypoperfusion, with oligemia occupying the 20–50range, and ischemia <20. The border between oligemia andischemia is that point at which functional impairment man-ifests, called the functional threshold, and has been experi-mentally determined in a number of controlled animalstudies [5, 6]. The point at which functional impairmentbecomes irreversible impairment, or infarction, is more dif-ficult to define clearly and is related to the depletion ofintracellular ATP and the subsequent loss of membraneintegrity. The threshold for infarction may also be modulatedby additional factors, such as changes in glucose metabolismleading to an increase of lactate, the influx of Ca2+ ions intothe cell and the release of excitatory amino acids [7]. Recently,the role of glutamate in the development of the final ischemicvolume has been emphasised. The release of large amounts ofglutamate may lead to cortical spreading depression (CSD)and peri-infarct depolarizations (PID) that further tax theenergy capabilities of ischemic cells [8, 9]. It has been exper-imentally proven that during the first 3 h after ischemia, eachdepolarization increases the infarct volume by roughly 20 %[10]. Conversely, a history of TIA has been shown in some
studies to impart a certain degree of neuroprotection, likelygained as a lasting adaptive cellular response to ischemia[11, 12].
Regardless of modulating factors, the development ofirreversible ischemia remains highly time dependent. AnrCBF of 17–18 may be reversible at durations approachinginfinity, while an rCBF<9 likely represents the lower borderof reversibility within an interventional time frame that isrealistically achievable in the clinical setting [13]. The zonepositioned between the functional threshold and the infarc-tion threshold is called the penumbra, and is considered tobe the volume of ischemic tissue that can potentially besalvaged if reperfused. As time elapses, the infarctionthreshold increases and the penumbra decreases in volume.In more practical terms, while an rCBF of <9 will in manycases lead to infarction within 20–30 min, at 60 min thethreshold may be an rCBF<12, and at 45 min<14. There-fore, the successful management of ischemic stroke isdependent upon establishing the diagnosis and initiatingtreatment as quickly as possible.
Thrombolytic agents are the treatment of choice in ische-mic stroke, within certain limits. Although temporal guide-lines for the administration of these agents vary by countryand region, 3 h from the known onset of clinical manifes-tations to the time of treatment is universally considered asafe and effective interval. Preconditions for thrombolytictreatment include, but are not limited to, the exclusion ofhemorrhage and the demonstration of salvageable tissue.Therefore, characterisation of the penumbra plays a vitalrole in the workup of ischemic stroke. Additionally, charac-terization of the penumbra may allow a more individualisedtreatment approach. The 3-h interval between manifestationand treatment was arrived at following large randomisedtrials and may in some cases be too restrictive [14, 15]. Ithas been shown that patients with certain perfusion charac-teristics may benefit from thrombolytic treatment beyondthe 3-h window [16–19]. Ideally, studies such as thesewould enable clinicians to make treatment decisions basedupon objective findings unique to the patient rather thanarbitrary time constraints. This would be of obvious benefitto the large group of patients that present with an unknowntime of onset. However, there are many pitfalls and con-founders that complicate relying solely on imaging findings,as will be discussed below.
Imaging
A number of clinical tests have been developed over theyears to help determine the presence of stroke [e.g., 20, 21].Although these tests may aid in the initial triage of acuteneurological patients, they cannot match the sensitivity andspecificity of an imaging examination, nor is there any
620 Insights Imaging (2012) 3:619–627
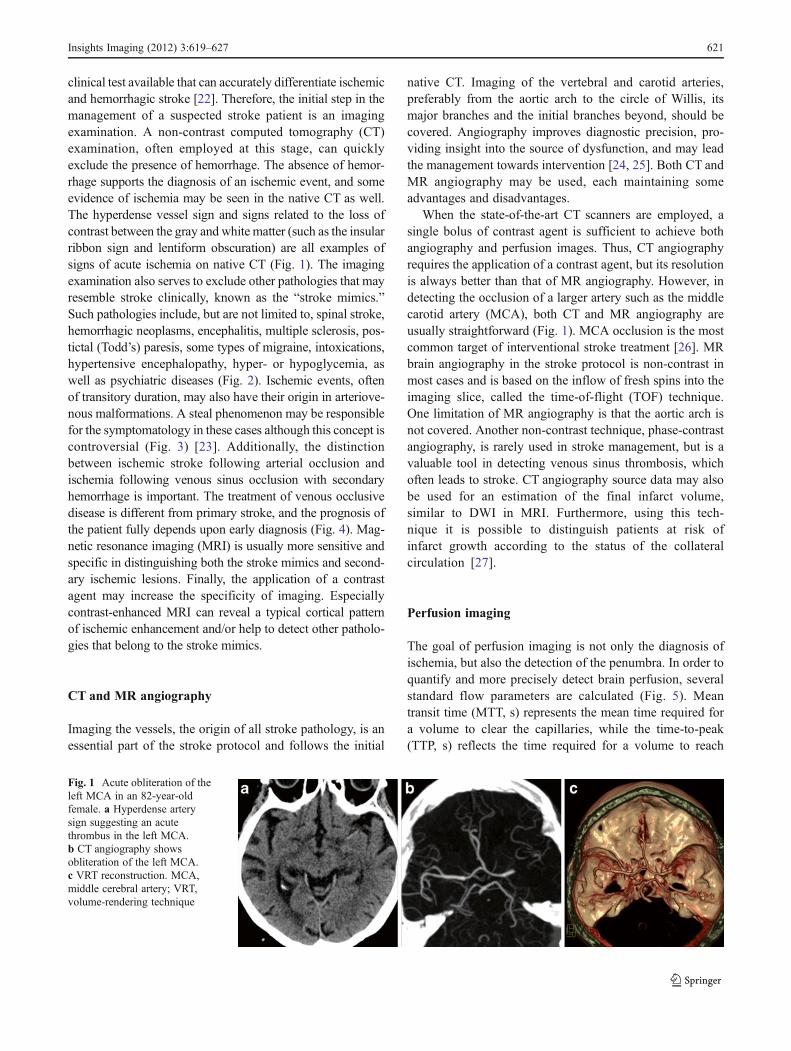
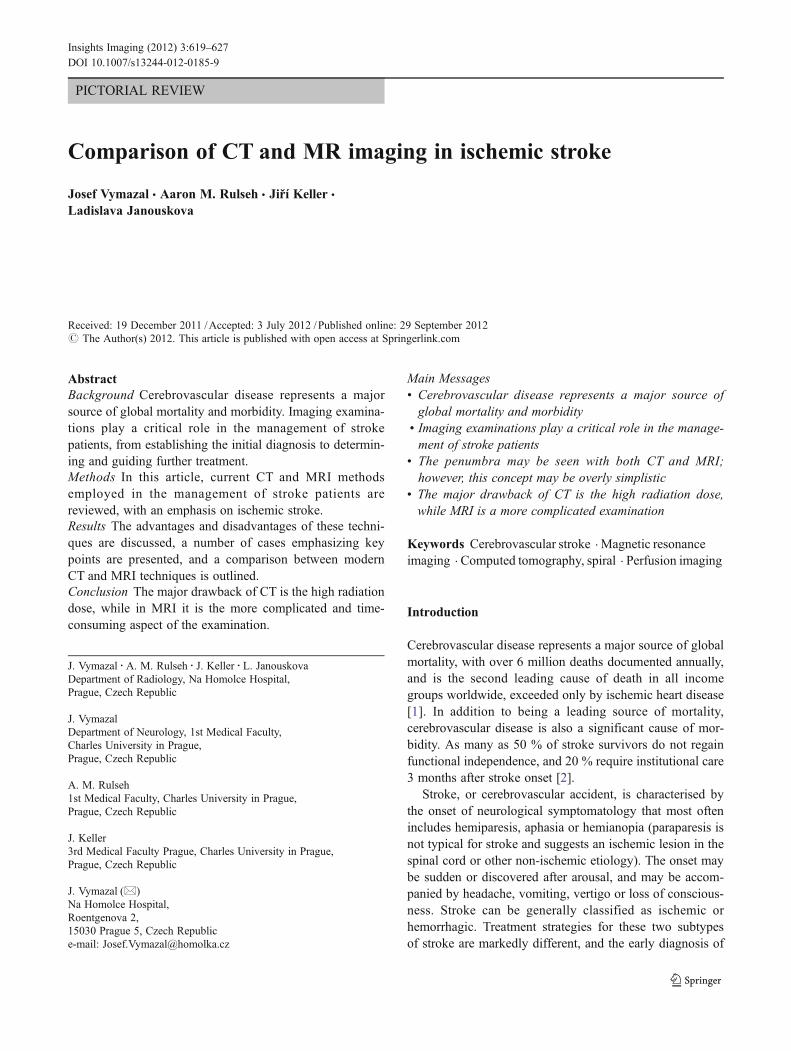
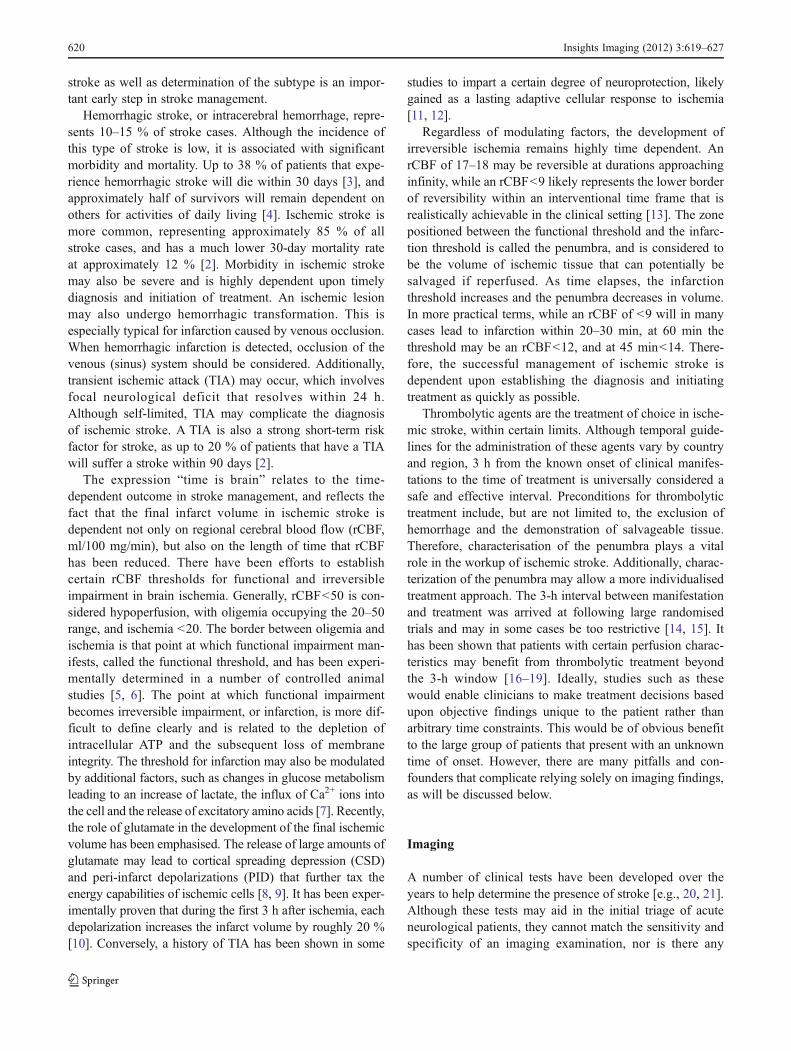
clinical test available that can accurately differentiate ischemicand hemorrhagic stroke [22]. Therefore, the initial step in themanagement of a suspected stroke patient is an imagingexamination. A non-contrast computed tomography (CT)examination, often employed at this stage, can quicklyexclude the presence of hemorrhage. The absence of hemor-rhage supports the diagnosis of an ischemic event, and someevidence of ischemia may be seen in the native CT as well.The hyperdense vessel sign and signs related to the loss ofcontrast between the gray and white matter (such as the insularribbon sign and lentiform obscuration) are all examples ofsigns of acute ischemia on native CT (Fig. 1). The imagingexamination also serves to exclude other pathologies that mayresemble stroke clinically, known as the “stroke mimics.”Such pathologies include, but are not limited to, spinal stroke,hemorrhagic neoplasms, encephalitis, multiple sclerosis, pos-tictal (Todd’s) paresis, some types of migraine, intoxications,hypertensive encephalopathy, hyper- or hypoglycemia, aswell as psychiatric diseases (Fig. 2). Ischemic events, oftenof transitory duration, may also have their origin in arteriove-nous malformations. A steal phenomenon may be responsiblefor the symptomatology in these cases although this concept iscontroversial (Fig. 3) [23]. Additionally, the distinctionbetween ischemic stroke following arterial occlusion andischemia following venous sinus occlusion with secondaryhemorrhage is important. The treatment of venous occlusivedisease is different from primary stroke, and the prognosis ofthe patient fully depends upon early diagnosis (Fig. 4). Mag-netic resonance imaging (MRI) is usually more sensitive andspecific in distinguishing both the stroke mimics and second-ary ischemic lesions. Finally, the application of a contrastagent may increase the specificity of imaging. Especiallycontrast-enhanced MRI can reveal a typical cortical patternof ischemic enhancement and/or help to detect other patholo-gies that belong to the stroke mimics.
CT and MR angiography
Imaging the vessels, the origin of all stroke pathology, is anessential part of the stroke protocol and follows the initial
native CT. Imaging of the vertebral and carotid arteries,preferably from the aortic arch to the circle of Willis, itsmajor branches and the initial branches beyond, should becovered. Angiography improves diagnostic precision, pro-viding insight into the source of dysfunction, and may leadthe management towards intervention [24, 25]. Both CT andMR angiography may be used, each maintaining someadvantages and disadvantages.
When the state-of-the-art CT scanners are employed, asingle bolus of contrast agent is sufficient to achieve bothangiography and perfusion images. Thus, CT angiographyrequires the application of a contrast agent, but its resolutionis always better than that of MR angiography. However, indetecting the occlusion of a larger artery such as the middlecarotid artery (MCA), both CT and MR angiography areusually straightforward (Fig. 1). MCA occlusion is the mostcommon target of interventional stroke treatment [26]. MRbrain angiography in the stroke protocol is non-contrast inmost cases and is based on the inflow of fresh spins into theimaging slice, called the time-of-flight (TOF) technique.One limitation of MR angiography is that the aortic arch isnot covered. Another non-contrast technique, phase-contrastangiography, is rarely used in stroke management, but is avaluable tool in detecting venous sinus thrombosis, whichoften leads to stroke. CT angiography source data may alsobe used for an estimation of the final infarct volume,similar to DWI in MRI. Furthermore, using this tech-nique it is possible to distinguish patients at risk ofinfarct growth according to the status of the collateralcirculation [27].
Perfusion imaging
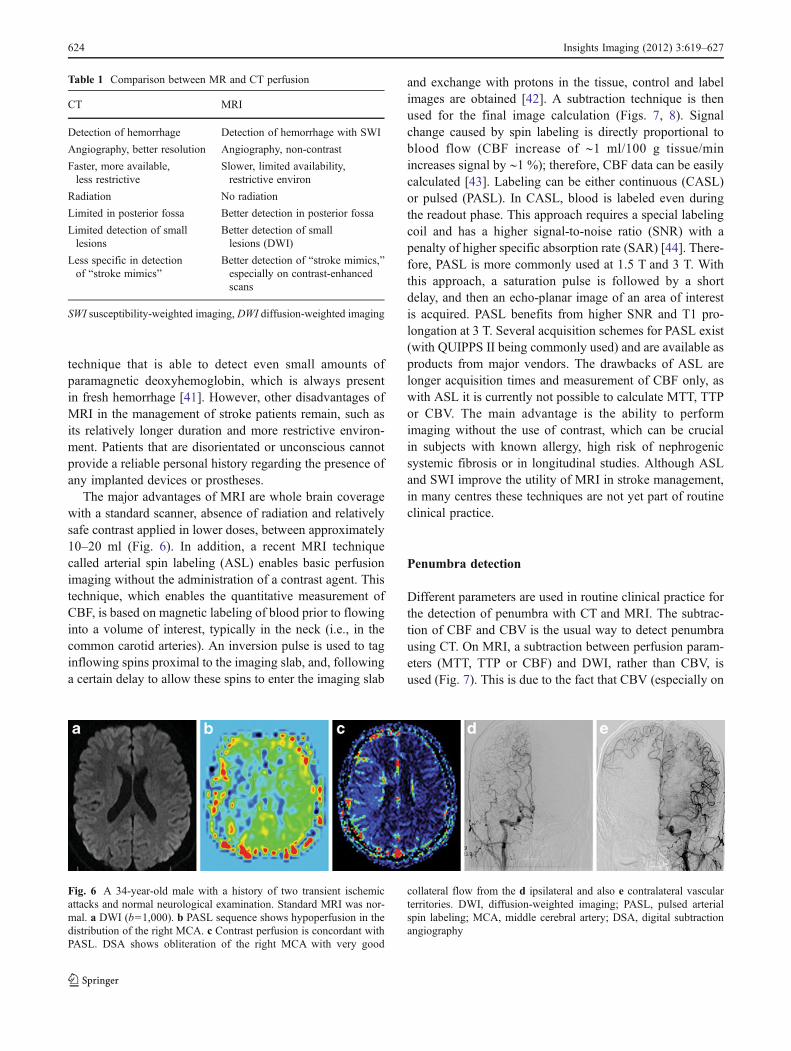
The goal of perfusion imaging is not only the diagnosis ofischemia, but also the detection of the penumbra. In order toquantify and more precisely detect brain perfusion, severalstandard flow parameters are calculated (Fig. 5). Meantransit time (MTT, s) represents the mean time required fora volume to clear the capillaries, while the time-to-peak(TTP, s) reflects the time required for a volume to reach
Fig. 1 Acute obliteration of theleft MCA in an 82-year-oldfemale. a Hyperdense arterysign suggesting an acutethrombus in the left MCA.b CT angiography showsobliteration of the left MCA.c VRT reconstruction. MCA,middle cerebral artery; VRT,volume-rendering technique
Insights Imaging (2012) 3:619–627 621
peak concentration. Both MTT and TTP are very sensitive tolocal perfusion disturbances, but less specific to ischemia orinfarction [28]. Cerebral blood volume (CBV, ml/100 gbrain) represents the volume of blood in a volume of tissue,and reflects autoregulation. As perfusion pressure decreases,autoregulatory mechanisms are activated, locally resultingin vasodilatation and recruitment of supporting capillarynetworks to increase perfusion of the ischemic region. Theresults of these changes are increased CBV, MTT and TTP.Within the ischemic core there is a failure of autoregulation,and CBV is ominously decreased in this region. Cerebralblood flow (CBF, ml/100 g brain/min) represents the deliv-ery of blood to tissue per unit time and is calculated bydividing the CBV by MTT. CBF is decreased in all hypo-perfused regions, including both the penumbra and ischemic
core. On perfusion CT, CBV has been shown to correlatewith infarct volume [29], and the subtraction of CBF andCBV is the usual way to detect the penumbra. With MRI,diffusion-weighted imaging (DWI) is considered to corre-late with infarct volume [30], and subtraction between CBFand DWI is used to demonstrate the penumbra. Acomparison between MR and CT perfusion is presentedin Table 1.
Perfusion computed tomography (PCT)
The introduction of perfusion computed tomography (PCT)of the brain significantly improved the sensitivity and spec-ificity in detecting fresh ischemia [28]. Perfusion deficit canbe detected immediately after stroke, i.e., in the time when astandard CT is still negative (Fig. 5). A major disadvantageof this technique is the limited coverage of the brain witholder scanners. In such cases the coverage is limited toseveral slices, and the neurologist or neuroradiologist hasto decide which part of the brain should be covered. It mayhappen that misleading neurological symptomatology leadsthe physician to set the perfusion slab in the wrong position.An example may be setting the covered area around thebasal ganglia with the ischemia located in the upper subcor-tical/cortical areas, or ischemia in the posterior fossa withoutcerebellar symptomatology or alternating hemiparesis, thusmimicking supratentorial involvement. Therefore, 75-mmbrain coverage is the minimal PCT coverage recommendedin selecting patients with acute stroke for reperfusion ther-apy [31]. However, the emergence of state-of-the-art CTscanners enables coverage of almost the whole brain andhas resolved this limitation.
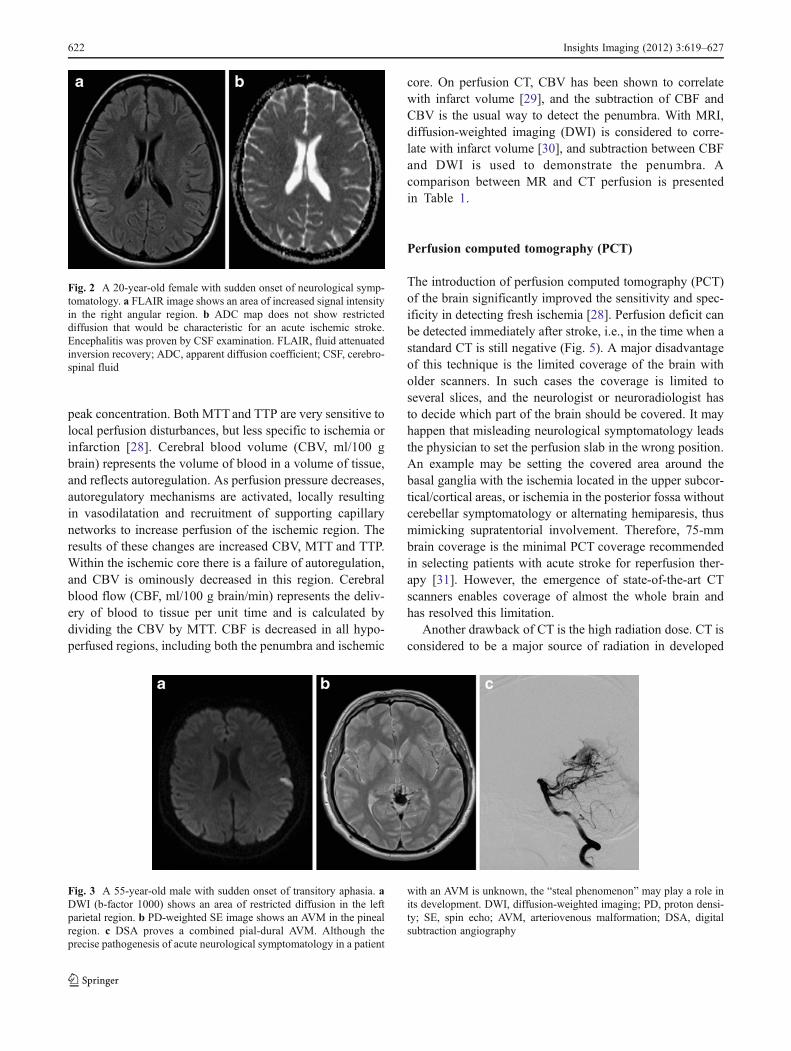
Another drawback of CT is the high radiation dose. CT isconsidered to be a major source of radiation in developed
Fig. 2 A 20-year-old female with sudden onset of neurological symp-tomatology. a FLAIR image shows an area of increased signal intensityin the right angular region. b ADC map does not show restricteddiffusion that would be characteristic for an acute ischemic stroke.Encephalitis was proven by CSF examination. FLAIR, fluid attenuatedinversion recovery; ADC, apparent diffusion coefficient; CSF, cerebro-spinal fluid
Fig. 3 A 55-year-old male with sudden onset of transitory aphasia. aDWI (b-factor 1000) shows an area of restricted diffusion in the leftparietal region. b PD-weighted SE image shows an AVM in the pinealregion. c DSA proves a combined pial-dural AVM. Although theprecise pathogenesis of acute neurological symptomatology in a patient
with an AVM is unknown, the “steal phenomenon” may play a role inits development. DWI, diffusion-weighted imaging; PD, proton densi-ty; SE, spin echo; AVM, arteriovenous malformation; DSA, digitalsubtraction angiography
622 Insights Imaging (2012) 3:619–627
countries [32]. Although ultrafast CT scanners together withiterative reconstructions can significantly reduce the radia-tion dose in some applications, such as abdominal or cardiacCT, in perfusion CT of the brain the dose still remainsrelatively high (mean effective dose is approximately5 mSv) [33]. Additionally, the long reconstruction times ofiterative techniques, in the range of minutes, are inconve-nient for stroke patient management. There are howevertechniques that are able to decrease the radiation dose tovalues comparable to unenhanced brain CT (approximately2 mSv). A decrease from 140–120 kV to 100–80 kV notonly significantly lowers the radiation dose, but alsoincreases the prominence of the contrast agent because ofthe greater importance of the photoelectric effect for 80-kVphotons [34]. Another method for dose reduction relies ondecreasing the image frequency of acquisition from the PCTfirst-pass data [35].
PCT enjoys a number of advantages as it is fast, widelyavailable, and cost effective. Furthermore, there are fewrestrictions in the CT environment. However, CT is lesssensitive and less specific in the detection of ischemia thanMRI. Other lesions, such as acute demyelinating plaques,inflammatory lesions and some brain tumors, may mimicbrain ischemia on CT [36]. A number of pitfalls need to beconsidered in performing PCT as well. The operator-dependent selection for the arterial input function may havea substantial influence on the results, especially in subjectswith chronic vascular conditions such as giant aneurysm orcarotid artery occlusion, as well as in patients with asym-metric microvascular changes [37]. Postictal changes areanother concern, as lateralised postictal hyperperfusionmay lead to the erroneous diagnosis of contralateral ische-mia on visual inspection of colour maps [38]. Furthermore,postprocessing and modeling methods may affect the resultsand may complicate comparison across studies [39].
MR perfusion
Although there has been a great deal of interest in usingMRI in the acute workup of stroke, it remains largelyacademic. MRI is known to generally be more sensitivethan CT in the detection of ischemia, and current experi-mental MRI studies with Na23 show even better sensitivityfor acute stroke imaging [40]. However, the detection ofhemorrhage, especially smaller hemorrhage, is not sostraightforward with MRI. Diamagnetic oxyhemoglobinpresent in fresh hemorrhage only changes the proton densi-ty, the least sensitive MRI parameter, and not the relaxationtimes that are primarily responsible for signal intensity onMR images. This disadvantage has since been balanced withthe introduction of susceptibility-weighted imaging (SWI), a
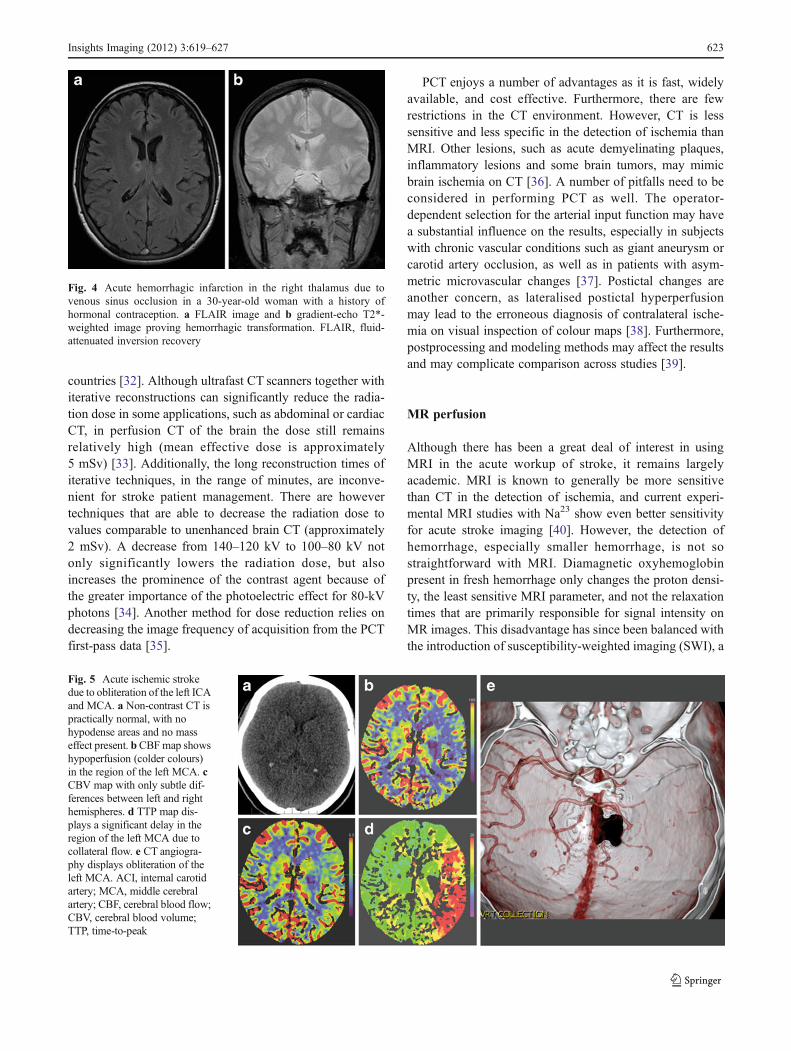
Fig. 4 Acute hemorrhagic infarction in the right thalamus due tovenous sinus occlusion in a 30-year-old woman with a history ofhormonal contraception. a FLAIR image and b gradient-echo T2*-weighted image proving hemorrhagic transformation. FLAIR, fluid-attenuated inversion recovery
Fig. 5 Acute ischemic strokedue to obliteration of the left ICAand MCA. a Non-contrast CT ispractically normal, with nohypodense areas and no masseffect present. bCBFmap showshypoperfusion (colder colours)in the region of the left MCA. cCBV map with only subtle dif-ferences between left and righthemispheres. d TTP map dis-plays a significant delay in theregion of the left MCA due tocollateral flow. e CT angiogra-phy displays obliteration of theleft MCA. ACI, internal carotidartery; MCA, middle cerebralartery; CBF, cerebral blood flow;CBV, cerebral blood volume;TTP, time-to-peak
Insights Imaging (2012) 3:619–627 623
technique that is able to detect even small amounts ofparamagnetic deoxyhemoglobin, which is always presentin fresh hemorrhage [41]. However, other disadvantages ofMRI in the management of stroke patients remain, such asits relatively longer duration and more restrictive environ-ment. Patients that are disorientated or unconscious cannotprovide a reliable personal history regarding the presence ofany implanted devices or prostheses.
The major advantages of MRI are whole brain coveragewith a standard scanner, absence of radiation and relativelysafe contrast applied in lower doses, between approximately10–20 ml (Fig. 6). In addition, a recent MRI techniquecalled arterial spin labeling (ASL) enables basic perfusionimaging without the administration of a contrast agent. Thistechnique, which enables the quantitative measurement ofCBF, is based on magnetic labeling of blood prior to flowinginto a volume of interest, typically in the neck (i.e., in thecommon carotid arteries). An inversion pulse is used to taginflowing spins proximal to the imaging slab, and, followinga certain delay to allow these spins to enter the imaging slab
and exchange with protons in the tissue, control and labelimages are obtained [42]. A subtraction technique is thenused for the final image calculation (Figs. 7, 8). Signalchange caused by spin labeling is directly proportional toblood flow (CBF increase of ∼1 ml/100 g tissue/minincreases signal by ∼1 %); therefore, CBF data can be easilycalculated [43]. Labeling can be either continuous (CASL)or pulsed (PASL). In CASL, blood is labeled even duringthe readout phase. This approach requires a special labelingcoil and has a higher signal-to-noise ratio (SNR) with apenalty of higher specific absorption rate (SAR) [44]. There-fore, PASL is more commonly used at 1.5 T and 3 T. Withthis approach, a saturation pulse is followed by a shortdelay, and then an echo-planar image of an area of interestis acquired. PASL benefits from higher SNR and T1 pro-longation at 3 T. Several acquisition schemes for PASL exist(with QUIPPS II being commonly used) and are available asproducts from major vendors. The drawbacks of ASL arelonger acquisition times and measurement of CBF only, aswith ASL it is currently not possible to calculate MTT, TTPor CBV. The main advantage is the ability to performimaging without the use of contrast, which can be crucialin subjects with known allergy, high risk of nephrogenicsystemic fibrosis or in longitudinal studies. Although ASLand SWI improve the utility of MRI in stroke management,in many centres these techniques are not yet part of routineclinical practice.
Penumbra detection
Different parameters are used in routine clinical practice forthe detection of penumbra with CT and MRI. The subtrac-tion of CBF and CBV is the usual way to detect penumbrausing CT. On MRI, a subtraction between perfusion param-eters (MTT, TTP or CBF) and DWI, rather than CBV, isused (Fig. 7). This is due to the fact that CBV (especially on
Table 1 Comparison between MR and CT perfusion
CT MRI
Detection of hemorrhage Detection of hemorrhage with SWI
Angiography, better resolution Angiography, non-contrast
Faster, more available,less restrictive
Slower, limited availability,restrictive environ
Radiation No radiation
Limited in posterior fossa Better detection in posterior fossa
Limited detection of smalllesions
Better detection of smalllesions (DWI)
Less specific in detectionof “stroke mimics”
Better detection of “stroke mimics,”especially on contrast-enhancedscans
SWI susceptibility-weighted imaging, DWI diffusion-weighted imaging
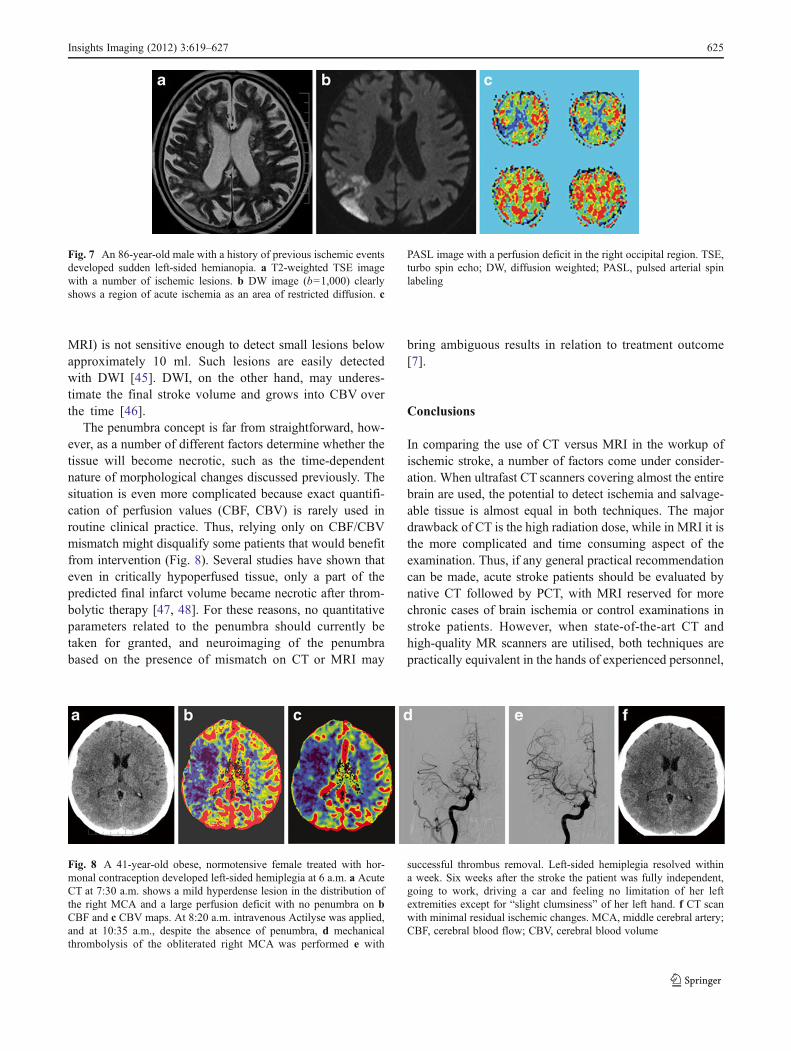
Fig. 6 A 34-year-old male with a history of two transient ischemicattacks and normal neurological examination. Standard MRI was nor-mal. a DWI (b01,000). b PASL sequence shows hypoperfusion in thedistribution of the right MCA. c Contrast perfusion is concordant withPASL. DSA shows obliteration of the right MCA with very good
collateral flow from the d ipsilateral and also e contralateral vascularterritories. DWI, diffusion-weighted imaging; PASL, pulsed arterialspin labeling; MCA, middle cerebral artery; DSA, digital subtractionangiography
624 Insights Imaging (2012) 3:619–627
MRI) is not sensitive enough to detect small lesions belowapproximately 10 ml. Such lesions are easily detectedwith DWI [45]. DWI, on the other hand, may underes-timate the final stroke volume and grows into CBV overthe time [46].
The penumbra concept is far from straightforward, how-ever, as a number of different factors determine whether thetissue will become necrotic, such as the time-dependentnature of morphological changes discussed previously. Thesituation is even more complicated because exact quantifi-cation of perfusion values (CBF, CBV) is rarely used inroutine clinical practice. Thus, relying only on CBF/CBVmismatch might disqualify some patients that would benefitfrom intervention (Fig. 8). Several studies have shown thateven in critically hypoperfused tissue, only a part of thepredicted final infarct volume became necrotic after throm-bolytic therapy [47, 48]. For these reasons, no quantitativeparameters related to the penumbra should currently betaken for granted, and neuroimaging of the penumbrabased on the presence of mismatch on CT or MRI may
bring ambiguous results in relation to treatment outcome[7].
Conclusions
In comparing the use of CT versus MRI in the workup ofischemic stroke, a number of factors come under consider-ation. When ultrafast CT scanners covering almost the entirebrain are used, the potential to detect ischemia and salvage-able tissue is almost equal in both techniques. The majordrawback of CT is the high radiation dose, while in MRI it isthe more complicated and time consuming aspect of theexamination. Thus, if any general practical recommendationcan be made, acute stroke patients should be evaluated bynative CT followed by PCT, with MRI reserved for morechronic cases of brain ischemia or control examinations instroke patients. However, when state-of-the-art CT andhigh-quality MR scanners are utilised, both techniques arepractically equivalent in the hands of experienced personnel,
Fig. 7 An 86-year-old male with a history of previous ischemic eventsdeveloped sudden left-sided hemianopia. a T2-weighted TSE imagewith a number of ischemic lesions. b DW image (b01,000) clearlyshows a region of acute ischemia as an area of restricted diffusion. c
PASL image with a perfusion deficit in the right occipital region. TSE,turbo spin echo; DW, diffusion weighted; PASL, pulsed arterial spinlabeling
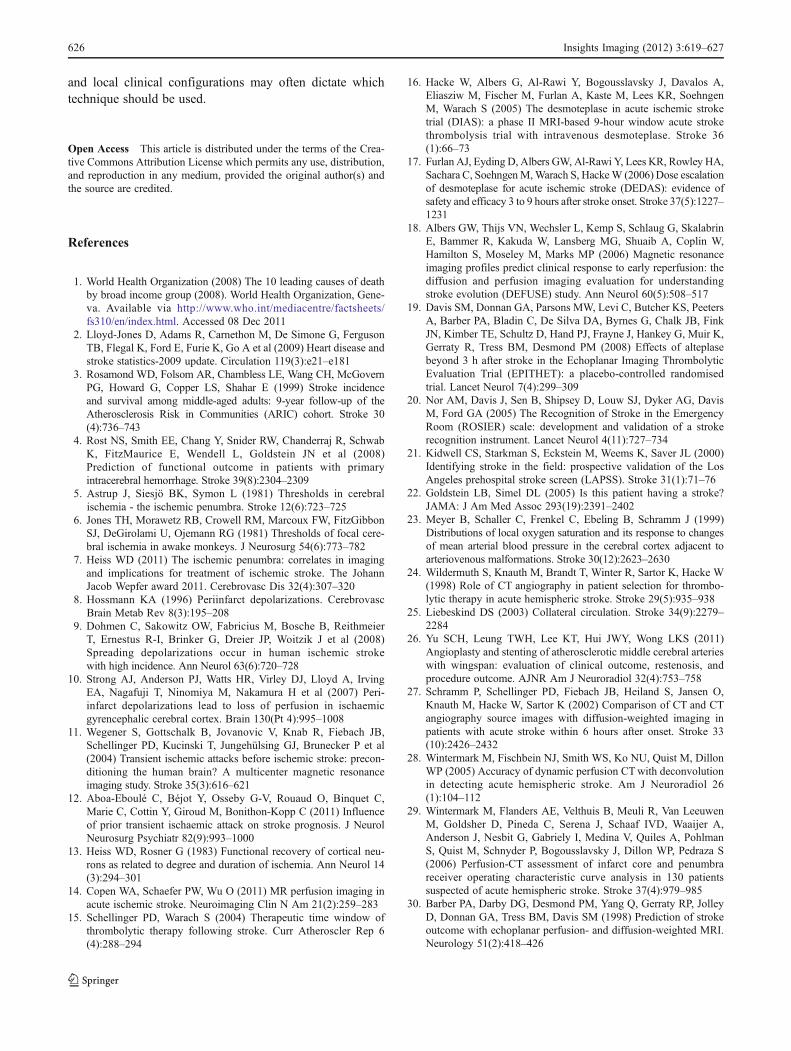
Fig. 8 A 41-year-old obese, normotensive female treated with hor-monal contraception developed left-sided hemiplegia at 6 a.m. a AcuteCT at 7:30 a.m. shows a mild hyperdense lesion in the distribution ofthe right MCA and a large perfusion deficit with no penumbra on bCBF and c CBV maps. At 8:20 a.m. intravenous Actilyse was applied,and at 10:35 a.m., despite the absence of penumbra, d mechanicalthrombolysis of the obliterated right MCA was performed e with
successful thrombus removal. Left-sided hemiplegia resolved withina week. Six weeks after the stroke the patient was fully independent,going to work, driving a car and feeling no limitation of her leftextremities except for “slight clumsiness” of her left hand. f CT scanwith minimal residual ischemic changes. MCA, middle cerebral artery;CBF, cerebral blood flow; CBV, cerebral blood volume
Insights Imaging (2012) 3:619–627 625
and local clinical configurations may often dictate whichtechnique should be used.
Open Access This article is distributed under the terms of the Crea-tive Commons Attribution License which permits any use, distribution,and reproduction in any medium, provided the original author(s) andthe source are credited.
References
1. World Health Organization (2008) The 10 leading causes of deathby broad income group (2008). World Health Organization, Gene-va. Available via http://www.who.int/mediacentre/factsheets/fs310/en/index.html. Accessed 08 Dec 2011
2. Lloyd-Jones D, Adams R, Carnethon M, De Simone G, FergusonTB, Flegal K, Ford E, Furie K, Go A et al (2009) Heart disease andstroke statistics-2009 update. Circulation 119(3):e21–e181
3. Rosamond WD, Folsom AR, Chambless LE, Wang CH, McGovernPG, Howard G, Copper LS, Shahar E (1999) Stroke incidenceand survival among middle-aged adults: 9-year follow-up of theAtherosclerosis Risk in Communities (ARIC) cohort. Stroke 30(4):736–743
4. Rost NS, Smith EE, Chang Y, Snider RW, Chanderraj R, SchwabK, FitzMaurice E, Wendell L, Goldstein JN et al (2008)Prediction of functional outcome in patients with primaryintracerebral hemorrhage. Stroke 39(8):2304–2309
5. Astrup J, Siesjö BK, Symon L (1981) Thresholds in cerebralischemia - the ischemic penumbra. Stroke 12(6):723–725
6. Jones TH, Morawetz RB, Crowell RM, Marcoux FW, FitzGibbonSJ, DeGirolami U, Ojemann RG (1981) Thresholds of focal cere-bral ischemia in awake monkeys. J Neurosurg 54(6):773–782
7. Heiss WD (2011) The ischemic penumbra: correlates in imagingand implications for treatment of ischemic stroke. The JohannJacob Wepfer award 2011. Cerebrovasc Dis 32(4):307–320
8. Hossmann KA (1996) Periinfarct depolarizations. CerebrovascBrain Metab Rev 8(3):195–208
9. Dohmen C, Sakowitz OW, Fabricius M, Bosche B, ReithmeierT, Ernestus R-I, Brinker G, Dreier JP, Woitzik J et al (2008)Spreading depolarizations occur in human ischemic strokewith high incidence. Ann Neurol 63(6):720–728
10. Strong AJ, Anderson PJ, Watts HR, Virley DJ, Lloyd A, IrvingEA, Nagafuji T, Ninomiya M, Nakamura H et al (2007) Peri-infarct depolarizations lead to loss of perfusion in ischaemicgyrencephalic cerebral cortex. Brain 130(Pt 4):995–1008
11. Wegener S, Gottschalk B, Jovanovic V, Knab R, Fiebach JB,Schellinger PD, Kucinski T, Jungehülsing GJ, Brunecker P et al(2004) Transient ischemic attacks before ischemic stroke: precon-ditioning the human brain? A multicenter magnetic resonanceimaging study. Stroke 35(3):616–621
12. Aboa-Eboulé C, Béjot Y, Osseby G-V, Rouaud O, Binquet C,Marie C, Cottin Y, Giroud M, Bonithon-Kopp C (2011) Influenceof prior transient ischaemic attack on stroke prognosis. J NeurolNeurosurg Psychiatr 82(9):993–1000
13. Heiss WD, Rosner G (1983) Functional recovery of cortical neu-rons as related to degree and duration of ischemia. Ann Neurol 14(3):294–301
14. Copen WA, Schaefer PW, Wu O (2011) MR perfusion imaging inacute ischemic stroke. Neuroimaging Clin N Am 21(2):259–283
15. Schellinger PD, Warach S (2004) Therapeutic time window ofthrombolytic therapy following stroke. Curr Atheroscler Rep 6(4):288–294
16. Hacke W, Albers G, Al-Rawi Y, Bogousslavsky J, Davalos A,Eliasziw M, Fischer M, Furlan A, Kaste M, Lees KR, SoehngenM, Warach S (2005) The desmoteplase in acute ischemic stroketrial (DIAS): a phase II MRI-based 9-hour window acute strokethrombolysis trial with intravenous desmoteplase. Stroke 36(1):66–73
17. Furlan AJ, Eyding D, Albers GW, Al-Rawi Y, Lees KR, Rowley HA,Sachara C, SoehngenM,Warach S, HackeW (2006) Dose escalationof desmoteplase for acute ischemic stroke (DEDAS): evidence ofsafety and efficacy 3 to 9 hours after stroke onset. Stroke 37(5):1227–1231
18. Albers GW, Thijs VN, Wechsler L, Kemp S, Schlaug G, SkalabrinE, Bammer R, Kakuda W, Lansberg MG, Shuaib A, Coplin W,Hamilton S, Moseley M, Marks MP (2006) Magnetic resonanceimaging profiles predict clinical response to early reperfusion: thediffusion and perfusion imaging evaluation for understandingstroke evolution (DEFUSE) study. Ann Neurol 60(5):508–517
19. Davis SM, Donnan GA, Parsons MW, Levi C, Butcher KS, PeetersA, Barber PA, Bladin C, De Silva DA, Byrnes G, Chalk JB, FinkJN, Kimber TE, Schultz D, Hand PJ, Frayne J, Hankey G, Muir K,Gerraty R, Tress BM, Desmond PM (2008) Effects of alteplasebeyond 3 h after stroke in the Echoplanar Imaging ThrombolyticEvaluation Trial (EPITHET): a placebo-controlled randomisedtrial. Lancet Neurol 7(4):299–309
20. Nor AM, Davis J, Sen B, Shipsey D, Louw SJ, Dyker AG, DavisM, Ford GA (2005) The Recognition of Stroke in the EmergencyRoom (ROSIER) scale: development and validation of a strokerecognition instrument. Lancet Neurol 4(11):727–734
21. Kidwell CS, Starkman S, Eckstein M, Weems K, Saver JL (2000)Identifying stroke in the field: prospective validation of the LosAngeles prehospital stroke screen (LAPSS). Stroke 31(1):71–76
22. Goldstein LB, Simel DL (2005) Is this patient having a stroke?JAMA: J Am Med Assoc 293(19):2391–2402
23. Meyer B, Schaller C, Frenkel C, Ebeling B, Schramm J (1999)Distributions of local oxygen saturation and its response to changesof mean arterial blood pressure in the cerebral cortex adjacent toarteriovenous malformations. Stroke 30(12):2623–2630
24. Wildermuth S, Knauth M, Brandt T, Winter R, Sartor K, Hacke W(1998) Role of CT angiography in patient selection for thrombo-lytic therapy in acute hemispheric stroke. Stroke 29(5):935–938
25. Liebeskind DS (2003) Collateral circulation. Stroke 34(9):2279–2284
26. Yu SCH, Leung TWH, Lee KT, Hui JWY, Wong LKS (2011)Angioplasty and stenting of atherosclerotic middle cerebral arterieswith wingspan: evaluation of clinical outcome, restenosis, andprocedure outcome. AJNR Am J Neuroradiol 32(4):753–758
27. Schramm P, Schellinger PD, Fiebach JB, Heiland S, Jansen O,Knauth M, Hacke W, Sartor K (2002) Comparison of CT and CTangiography source images with diffusion-weighted imaging inpatients with acute stroke within 6 hours after onset. Stroke 33(10):2426–2432
28. Wintermark M, Fischbein NJ, Smith WS, Ko NU, Quist M, DillonWP (2005) Accuracy of dynamic perfusion CTwith deconvolutionin detecting acute hemispheric stroke. Am J Neuroradiol 26(1):104–112
29. Wintermark M, Flanders AE, Velthuis B, Meuli R, Van LeeuwenM, Goldsher D, Pineda C, Serena J, Schaaf IVD, Waaijer A,Anderson J, Nesbit G, Gabriely I, Medina V, Quiles A, PohlmanS, Quist M, Schnyder P, Bogousslavsky J, Dillon WP, Pedraza S(2006) Perfusion-CT assessment of infarct core and penumbrareceiver operating characteristic curve analysis in 130 patientssuspected of acute hemispheric stroke. Stroke 37(4):979–985
30. Barber PA, Darby DG, Desmond PM, Yang Q, Gerraty RP, JolleyD, Donnan GA, Tress BM, Davis SM (1998) Prediction of strokeoutcome with echoplanar perfusion- and diffusion-weighted MRI.Neurology 51(2):418–426
626 Insights Imaging (2012) 3:619–627
31. Furtado AD, Lau BC, Vittinghoff E, Dillon WP, Smith WS, RigbyT, Boussel L, Wintermark M (2010) Optimal brain perfusion CTcoverage in patients with acute middle cerebral artery stroke.AJNR Am J Neuroradiol 31(4):691–695
32. Brenner DJ, Hall EJ (2007) Computed tomography–an increasingsource of radiation exposure. N Engl J Med 357(22):2277–2284
33. Mnyusiwalla A, Aviv RI, Symons SP (2009) Radiation dose frommultidetector row CT imaging for acute stroke. Neuroradiology 51(10):635–640
34. Wintermark M, Maeder P, Verdun FR, Thiran JP, Valley JF,Schnyder P, Meuli R (2000) Using 80 kVp versus 120 kVp inperfusion CT measurement of regional cerebral blood flow. AJNRAm J Neuroradiol 21(10):1881–1884
35. Konstas AA, Goldmakher GV, Lee T-Y, Lev MH (2009) Theoreticbasis and technical implementations of CT perfusion in acuteischemic stroke, part 2: technical implementations. AJNR Am JNeuroradiol 30(5):885–892
36. Winkler DT, Fluri F, Fuhr P, Wetzel SG, Lyrer PA, Ruegg S,Engelter ST (2009) Thrombolysis in stroke mimics: frequency,clinical characteristics, and outcome. Stroke 40(4):1522–1525
37. Leiva-Salinas C, Provenzale JM, Wintermark M (2011) Responsesto the 10 most frequently asked questions about perfusion CT. AJRAm J Roentgenol 196(1):53–60
38. Allmendinger AM, Tang ER, Lui YW, Spektor V (2012) Imagingof stroke: part 1, perfusion CT–overview of imaging technique,interpretation pearls, and common pitfalls. AJR Am J Roentgenol198(1):52–62
39. Konstas AA, Goldmakher GV, Lee T-Y, Lev MH (2009) Theoreticbasis and technical implementations of CT perfusion in acuteischemic stroke, part 1: theoretic basis. AJNR Am J Neuroradiol30(4):662–668
40. Schad L (2011) Sodium imaging revived - Clinical and experi-mental aspects. In Proceedings of the 28th Annual Meeting ofESMRMB, Leipzig, Germany. doi:10.1007/s10334-011-0267-6
41. Mittal S, Wu Z, Neelavalli J, Haacke EM (2009) Susceptibility-weighted imaging: technical aspects and clinical applications, part2. AJNR Am J Neuroradiol 30(2):232–252
42. Deibler AR, Pollock JM, Kraft RA, Tan H, Burdette JH, MaldjianJA (2008) Arterial spin-labeling in routine clinical practice, part 1:technique and artifacts. Am J Neuroradiol 29(7):1228–1234
43. Herholz K, Perani D, Morris C (2006) The dementias: early diag-nosis and evaluation, 1st edn. Taylor & Francis, New York
44. Wong EC, Buxton RB, Frank LR (1997) Implementation of quanti-tative perfusion imaging techniques for functional brain mappingusing pulsed arterial spin labeling. NMR Biomed 10(4–5):237–249
45. Straka M, Lee J, Lansberg MG, Mlynash M, Albers GW, Bammer R(2010) Is Reduced CBVa Reliable Surrogate Marker for Infarct Coreand Can It Be Used to Identify Lesion Mismatch? In Proceedings ofthe 18th Annual Meeting of ISMRM, Stockholm, Sweden
46. Schaefer PW, Hunter GJ, He J, Hamberg LM, Sorensen AG,Schwamm LH, Koroshetz WJ, Gonzalez RG (2002) Predictingcerebral ischemic infarct volume with diffusion and perfusionMR imaging. AJNR Am J Neuroradiol 23(10):1785–1794
47. Kidwell CS, Saver JL, Mattiello J, Starkman S, Vinuela F, DuckwilerG, Gobin YP, Jahan R, Vespa P et al (2000) Thrombolytic reversal ofacute human cerebral ischemic injury shown by diffusion/perfusionmagnetic resonance imaging. Ann Neurol 47(4):462–469
48. Olivot JM, Mlynash M, Thijs VN, Purushotham A, Kemp S,Lansberg MG, Wechsler L, Bammer R, Marks MP et al (2009)Relationships between cerebral perfusion and reversibility of acutediffusion lesions in DEFUSE: insights from RADAR. Stroke 40(5):1692–1697
Insights Imaging (2012) 3:619–627 627