Embed Size (px)
Citation preview
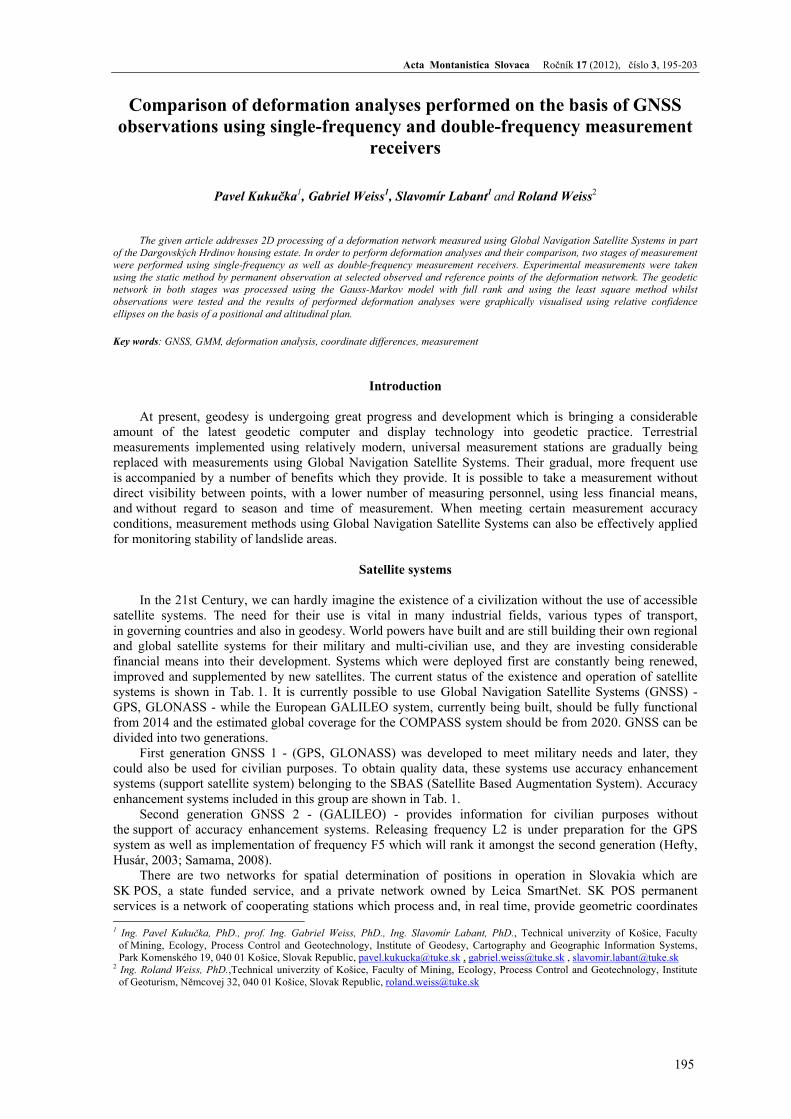
Acta Montanistica Slovaca Ročník 17 (2012), číslo 3, 195-203
195
Comparison of deformation analyses performed on the basis of GNSS observations using single-frequency and double-frequency measurement
receivers
Pavel Kukučka1, Gabriel Weiss1, Slavomír Labant1 and Roland Weiss2
The given article addresses 2D processing of a deformation network measured using Global Navigation Satellite Systems in part of the Dargovských Hrdinov housing estate. In order to perform deformation analyses and their comparison, two stages of measurement were performed using single-frequency as well as double-frequency measurement receivers. Experimental measurements were taken using the static method by permanent observation at selected observed and reference points of the deformation network. The geodetic network in both stages was processed using the Gauss-Markov model with full rank and using the least square method whilst observations were tested and the results of performed deformation analyses were graphically visualised using relative confidence ellipses on the basis of a positional and altitudinal plan.
Key words: GNSS, GMM, deformation analysis, coordinate differences, measurement
Introduction
At present, geodesy is undergoing great progress and development which is bringing a considerable amount of the latest geodetic computer and display technology into geodetic practice. Terrestrial measurements implemented using relatively modern, universal measurement stations are gradually being replaced with measurements using Global Navigation Satellite Systems. Their gradual, more frequent use is accompanied by a number of benefits which they provide. It is possible to take a measurement without direct visibility between points, with a lower number of measuring personnel, using less financial means, and without regard to season and time of measurement. When meeting certain measurement accuracy conditions, measurement methods using Global Navigation Satellite Systems can also be effectively applied for monitoring stability of landslide areas.
Satellite systems
In the 21st Century, we can hardly imagine the existence of a civilization without the use of accessible
satellite systems. The need for their use is vital in many industrial fields, various types of transport, in governing countries and also in geodesy. World powers have built and are still building their own regional and global satellite systems for their military and multi-civilian use, and they are investing considerable financial means into their development. Systems which were deployed first are constantly being renewed, improved and supplemented by new satellites. The current status of the existence and operation of satellite systems is shown in Tab. 1. It is currently possible to use Global Navigation Satellite Systems (GNSS) - GPS, GLONASS - while the European GALILEO system, currently being built, should be fully functional from 2014 and the estimated global coverage for the COMPASS system should be from 2020. GNSS can be divided into two generations.
First generation GNSS 1 - (GPS, GLONASS) was developed to meet military needs and later, they could also be used for civilian purposes. To obtain quality data, these systems use accuracy enhancement systems (support satellite system) belonging to the SBAS (Satellite Based Augmentation System). Accuracy enhancement systems included in this group are shown in Tab. 1.
Second generation GNSS 2 - (GALILEO) - provides information for civilian purposes without the support of accuracy enhancement systems. Releasing frequency L2 is under preparation for the GPS system as well as implementation of frequency F5 which will rank it amongst the second generation (Hefty, Husár, 2003; Samama, 2008).
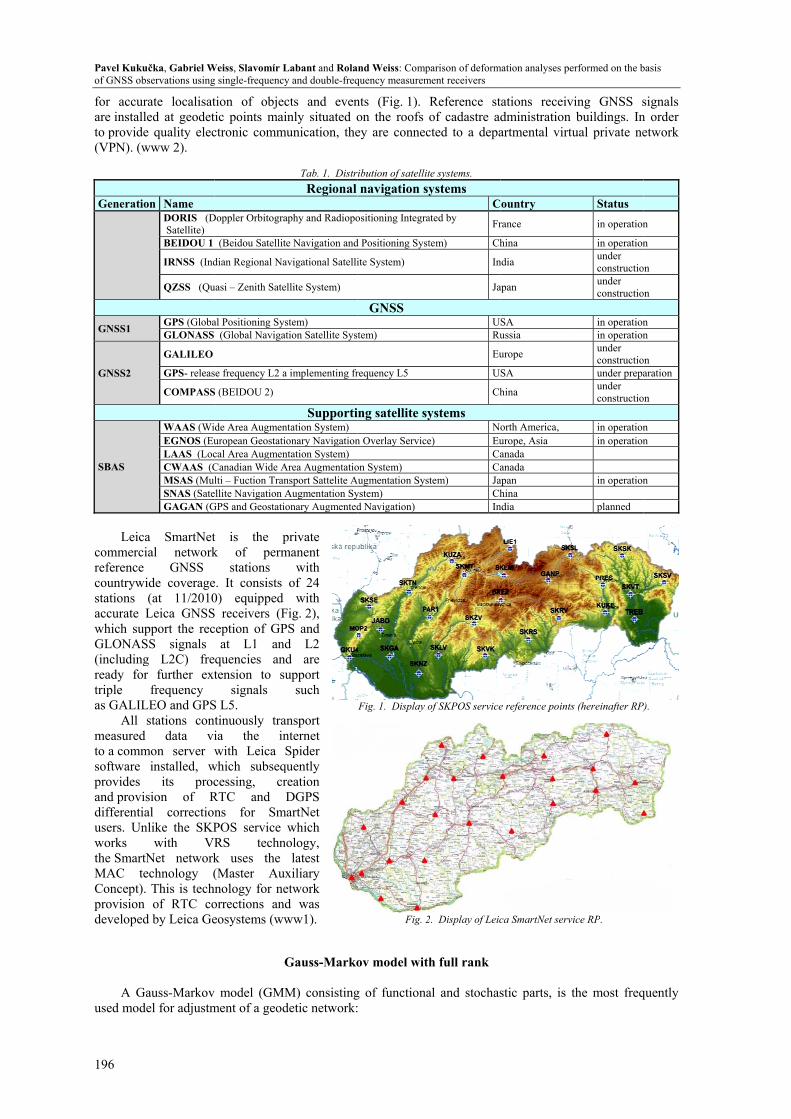
There are two networks for spatial determination of positions in operation in Slovakia which are SK POS, a state funded service, and a private network owned by Leica SmartNet. SK POS permanent services is a network of cooperating stations which process and, in real time, provide geometric coordinates 1 Ing. Pavel Kukučka, PhD., prof. Ing. Gabriel Weiss, PhD., Ing. Slavomír Labant, PhD., Technical univerzity of Košice, Faculty
of Mining, Ecology, Process Control and Geotechnology, Institute of Geodesy, Cartography and Geographic Information Systems, Park Komenského 19, 040 01 Košice, Slovak Republic, [email protected] , [email protected] , [email protected]
2 Ing. Roland Weiss, PhD.,Technical univerzity of Košice, Faculty of Mining, Ecology, Process Control and Geotechnology, Institute of Geoturism, Němcovej 32, 040 01 Košice, Slovak Republic, [email protected]
Pavel Kukuof GNSS ob
196
for accuare instalto provid(VPN). (w
Generati
GNSS1
GNSS2
SBAS
Leic
commercreferencecountrywstations accurate which suGLONAS(includingready fotriple as GALIL
All measuredto a commsoftware provides and providifferentiusers. Unworks the SmartMAC tConcept)provisiondeveloped
A G
used mod
učka, Gabriel Wbservations using
rate localisatled at geodete quality elecwww 2).
ion Name DORIS (D Satellite) BEIDOU 1
IRNSS (Ind
QZSS (Qu
GPS (GlobaGLONASS
GALILEO
GPS- releas
COMPASS
WAAS (WiEGNOS (EuLAAS (LocCWAAS (CMSAS (MulSNAS (SateGAGAN (G
ca SmartNetcial networke GNSS wide coverage
(at 11/2010Leica GNSS
upport the recSS signals g L2C) fre
or further extfrequency
LEO and GPSstations con
d data vimon server w
installed, wits proc
ision of Rial correctionnlike the SKP
with VRtNet networkechnology (. This is tech
n of RTC cod by Leica Ge
Gauss-Markovdel for adjustm
Weiss, Slavomír Lg single-frequency
tion of objectic points maictronic comm
Doppler Orbitogra
(Beidou Satellit
dian Regional Na
uasi – Zenith Sate
al Positioning Sys (Global Navigat
se frequency L2 a
S (BEIDOU 2)
de Area Augmenuropean Geostatical Area AugmenCanadian Wide Alti – Fuction Tran
ellite Navigation AGPS and Geostatio
t is the pk of perm
stations e. It consists 0) equipped S receivers (Fception of GP
at L1 andquencies andtension to su
signals S L5. tinuously traia the inwith Leica S
which subseqcessing, cr
RTC and Dns for SmPOS service RS technk uses the (Master Auxnology for ne
orrections andeosystems (ww
G
v model (GMMment of a geod
Labant and Rolay and double-freq
cts and eveninly situated o
munication, the
Tab. 1. DistrRegional
aphy and Radiopo
e Navigation and
avigational Satelli
ellite System)
stem) tion Satellite Sys
a implementing fr
Supportintation System) onary Navigation
ntation System)Area Augmentationsport Sattelite AAugmentation Syonary Augmented
private manent
with of 24
with Fig. 2), PS and d L2 d are upport
such
ansport nternet Spider
quently reation DGPS
martNet which ology, latest
xiliary etwork d was ww1).
Gauss-Marko
M) consistingdetic network:
and Weiss: Compquency measurem
nts (Fig. 1). on the roofs ey are connec
ibution of satellitnavigation sy
ositioning Integra
d Positioning Syst
ite System)
GNSS
tem)
requency L5
ing satellite sy
n Overlay Service
on System)Augmentation Sysystem)d Navigation)
ov model with
g of functiona
Fig. 1. Display o
Fig. 2
parison of deformment receivers
Reference stof cadastre ad
cted to a depa
te systems. ystems
Cated by Fr
tem) Ch
In
Ja
URu
Eu
U
Ch
ystems No
e) EuCaCa
tem) JaChIn
h full rank
al and stochas
of SKPOS service
2. Display of Leic
mation analyses pe
tations receivdministration artmental virtu
ountry
rance
hina
ndia
apan
SA ussia
urope
SA
hina
orth America, urope, Asiaanadaanada
apanhina
ndia
stic parts, is t
e reference points
ca SmartNet serv
erformed on the b
ving GNSS sbuildings. In
ual private ne
Status
in operation
in operationunder constructiounder constructio
in operationin operationunder constructiounder prepaunder constructio
in operationin operation in operation planned
the most freq
s (hereinafter RP)
vice RP.
basis
signals n order etwork
n
n
on
on
n n
on aration
on
n n
n
quently
P).
Acta Montanistica Slovaca Ročník 17 (2012), číslo 3, 195-203
197
part, stochastic -,part, functional-),()ˆ(ˆ
20 LL Qs
LLCCAdLCAdv=Σ
°−−°−=−= (1)
where v represents the correction vector for observed values, A is the design matrix, °−= CCCd ˆˆ is the vector of an increase of adjusted values of determined coordinates, °−= LLdL is the vector of reduced observations.
The measured GNSS data of vectors, primarily processed using software, can be processed on the basis of Gauss-Markov's estimation model (adjustment of measurement parameters) as linked adjustments. We consider spatial Cartesian coordinates of a RP obtained from a software solution as fixed. We seek adjusted coordinates C of network points via sighted and pre-processed values in the network. In this case, the GNSS observation vectors ijXYZ∆ are lined into vector L in the following order:
⎟⎟⎟⎟
⎠
⎞
⎜⎜⎜⎜
⎝
⎛
∆∆∆
=∆∆=
ij
ij
ij
ijijmZYX
XYZkdeXYZL)1,3()1,(
:),( - observation components. (2)
Observation vector L creates −m of observation vectors, i.e. mn 3= observation components.
)1,(kC° - represents vector of approximate coordinates of determined points with a column structure:
where bi ...,,1= points. (3)
)1,(nL° - vector of approximate values of observations obtained from the vector of approximate coordinates
)1,(kC° can be expressed as a vector of functions )( °=° CfL .
)1,(ndL - vector of auxiliary measured values:
)1,()1,()1,( nnnLLdL °−= , (4)
)1,(nv - correction vector, we obtain: ,ˆ
)1,()1,(),()1,( nkknndLCdAv −⋅= (5)
where ( )knA,
is the design matrix - matrix of function partial derivation )()1,(
°=° CfLn
according to the vector
of determined parameters )1,(k
C° :
( )
⎟⎟⎟⎟⎟⎟⎟⎟⎟⎟⎟
⎠
⎞
⎜⎜⎜⎜⎜⎜⎜⎜⎜⎜⎜
⎝
⎛
∂
∂
∂
∂
∂
∂
∂
∂
∂
∂
∂
∂
∂∂
∂∂
∂∂
=
⎟⎟⎟⎟⎟⎟⎟
⎠
⎞
⎜⎜⎜⎜⎜⎜⎜
⎝
⎛
=
o
o
o
o
o
o
o
o
o
o
o
o
o
o
o
o
o
o
LL
M
LL
M
LL
LL
M
LL
M
LL
k
n
j
nn
k
i
j
ii
kj
nknjn
ikiji
kj
kn
CL
CL
CL
CL
CL
CL
CL
CL
CL
aaa
aaa
aaa
A
1
1
11
1
1
1
1
1111
,. (6)
),( nnLQ - diagonal cofactor matrix of vector
)1,(nL :
( )⎟⎟⎟⎟⎟
⎠
⎞
⎜⎜⎜⎜⎜
⎝
⎛
=
O
O
ijl
l
nnL Q
Q
Q
12
, where
( )ijZZYZXZ
ZYYYXY
ZXYXXX
l
qqqqqqqqq
Qij
⎟⎟⎟
⎠
⎞
⎜⎜⎜
⎝
⎛=
∆∆∆∆∆∆
∆∆∆∆∆∆
∆∆∆∆∆∆
3,3
, (7)
where elements ijlQ correspond to individual GNSS observation vectors ijXYZ∆ , elements in submatrix
ijlQ
on the main diagonals are cofactors of values ),,( ijijij ZYX ∆∆∆ , elements outside the main diagonal are mixed cofactors. Apart from measured observations, entry data for such a constructed model is ijL
and approximately values of coordinates °iC as well as selection of cofactors ijq .
,)1,( ⎟
⎟⎟
⎠
⎞
⎜⎜⎜
⎝
⎛
°°°
=°
i
i
i
kZYX
C

Pavel Kukučka, Gabriel Weiss, Slavomír Labant and Roland Weiss: Comparison of deformation analyses performed on the basis of GNSS observations using single-frequency and double-frequency measurement receivers
198
Within processing data obtained by observations using Gauss Markov model with full rank, mainly the following values are determined (Caspary, 1987; Sabová et al., 2007; Weiss, Jakub, 2007; Weiss et al., 2008; Gašincová et.al., 2011):
)1,(ˆ
kC - vector of adjusted coordinates of determined points: CdCC
kˆˆ
)1,(+= o , (8)
)1,(ˆ
kCd - vector of auxiliaries of estimates of determined points: ( ) dLQAAQACd 1
LT11
LT −−−=ˆ , (9)
),(ˆkkCQ - cofactor matrix of adjusted coordinates of determined points:
( ) 111
),(ˆ
−−− == NAQAQ LT
kkC , (10)
)1,(nN - matrix of normal equation coefficients: AQAN L
T
n
1
)1,(
−= , (11)
( )1,nv - correction vector of observed values
( )1,nL which has the form of:
( )dLCAdv
n−= ˆ
1,,
(12)
( )1,ˆ
nL - vector of adjusted measured values: vLL +=ˆ , (13)
( )1,1
20s - estimated variance factor: ( )kn
vQvs L
T
−=
−1
)1,1(
20 , (14)
),(ˆnnLΣ
- covariance matrix of adjusted measured values: ( ) T
LT
LnnL AAQAAsQs
1120ˆ
20
),(ˆ
−−==Σ , (15)
),(ˆnnCΣ - covariance matrix of
ii YX ˆ,ˆ determined points in deformation network (DN): CnnC Qs ˆ
20
),(ˆ =Σ (16)
Evaluation of whether the given measurement is controllable and in which ratio can be done on the basis of redundancy of the network (Sabová et al., 2007; Weiss, Jakub, 2007):
),( nnR
- redundancy matrix characterising network geometry is given by the multiplication of cofactor matrix
LQ and cofactor matrix of corrections :VQ 11111
),()( −−−−− −=−== L
TL
TLLvnn
QAANIQAANQQQR . (17)
Deformation analysis
After testing the adjusted DN, deformation analysis (hereinafter DA) of spatial changes of individual
observed points (hereinafter OP) is performed. When evaluating stability or instability of an observed location, i.e. whether there was a spatial shift of OP, the adjusted coordinates of individual OP are compared in the same coordinate system, in between stages ii ttt −=∆ +1 , whilst the differences in OP in individual stages or changes in individual coordinates are determined (Sabová et al., 2007). Coordinate differences
create vector C∆ and represent the size of change in individual points between stages in the direction
of axes, which means single dimensional shifts: CCC iiii tttt ˆˆˆ 11, −=∆ ++ .
Global test
Stability or instability of all points can be tested using a global test with zero hypothesis:
0ˆˆˆ: 10 =−=∆ + CCCH ii tt . Testing statistics
120 fsRT = , where CQCR Cd
T ˆˆ 1ˆ ∆∆= − is compared with
the critical value of F-distribution, random variable T , at a selected level of significance α (0.02, 0.05, ...), with degree of freedom knfkf −== 21 , , )1,,( 21 αα −= ffFTkrit .
If kritTT < , the created coordinate differences between stages ii ttt −=∆ +1 can be considered as an expression of a statistically insignificant, stochastic change in the point position and therefore all determined points of DN be considered as stable. In such cases, network implementations are congruent.
Acta Montanistica Slovaca Ročník 17 (2012), číslo 3, 195-203
199
Local congruency test
Localisation test statistics for individual DN points is a random variable 1
20
1
ks
CdQCdT iCd
Ti
i
))) −
= which
is compared with the critical value ),,1( 0 ffFT ikrit ′α−= α , where ( )n1
0 11 αα −−= , with F - distribution
with degree of freedom 1kf = , knf −=´ and the level of significance α . In the equation 1k - the number
of tested parameters of the given point (1D=1, 2D=2, 3D=3), k - the value of argument k after already performed individual testing is gradually lessening and bi ,..,2,1= (Biacs, 1989; Heck, 1984; Weiss, Jakub, 2007).
If kriti TT > , the test shows a significant change in the point position between stages ii ttt −=∆ +1 , 0H can be refused with risk 0α whilst the spatial change of the appropriate point is allowed due to the effects of deformation forces. After local congruency tests, a graphic test using confidential ellipsoids (Sabová et al., 2002) takes place.
Location used for experimental measurements Resolving the stated issues required
selection of a suitable location for carrying out experimental measurements necessary for the preparation of DA of an area and stating certain conclusions. In order to monitor stability or instability of an area within a certain time period, it is necessary to have stages of measurements between which the DA will be performed. Additionally, based on this fact, the location of Dargovských hrdinov (DH) housing estate, which had been geodetically monitored for several years, was selected for experimental observation.
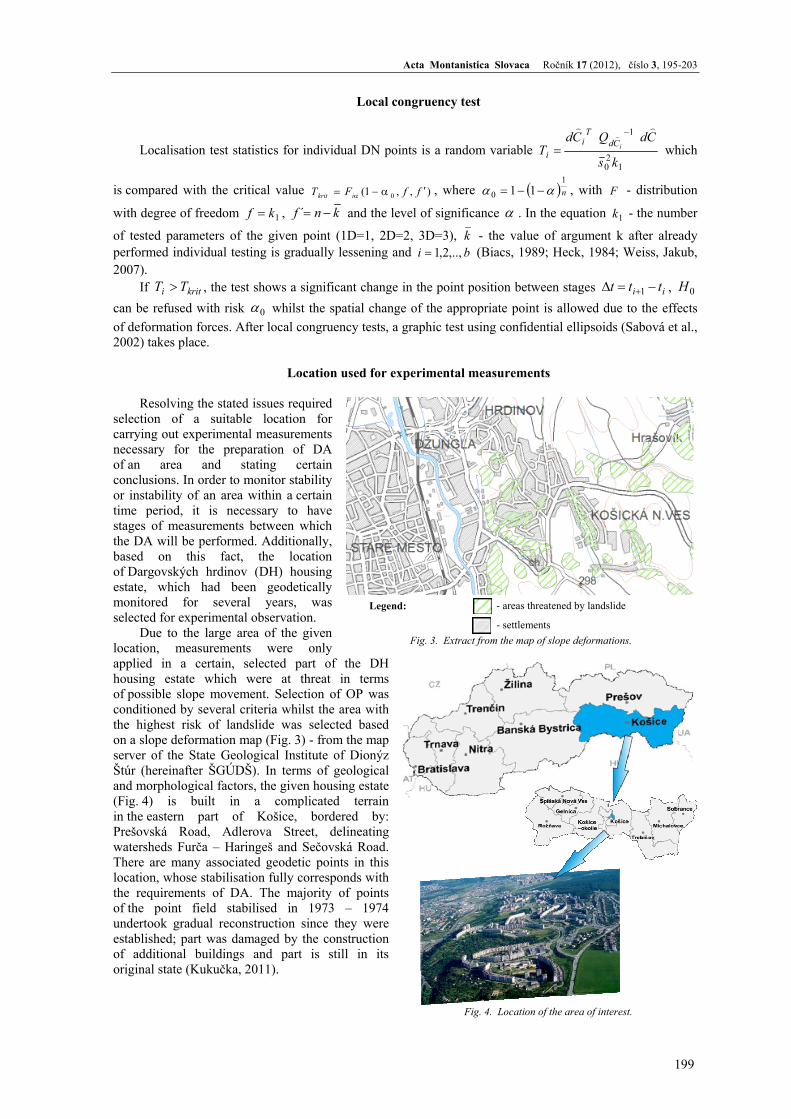
Due to the large area of the given location, measurements were only applied in a certain, selected part of the DH housing estate which were at threat in terms of possible slope movement. Selection of OP was conditioned by several criteria whilst the area with the highest risk of landslide was selected based on a slope deformation map (Fig. 3) - from the map server of the State Geological Institute of Dionýz Štúr (hereinafter ŠGÚDŠ). In terms of geological and morphological factors, the given housing estate (Fig. 4) is built in a complicated terrain in the eastern part of Košice, bordered by: Prešovská Road, Adlerova Street, delineating watersheds Furča – Haringeš and Sečovská Road. There are many associated geodetic points in this location, whose stabilisation fully corresponds with the requirements of DA. The majority of points of the point field stabilised in 1973 – 1974 undertook gradual reconstruction since they were established; part was damaged by the construction of additional buildings and part is still in its original state (Kukučka, 2011).
Legend: - areas threatened by landslide
- settlements Fig. 3. Extract from the map of slope deformations.
Fig. 4. Location of the area of interest.
Pavel Kukučka, Gabriel Weiss, Slavomír Labant and Roland Weiss: Comparison of deformation analyses performed on the basis of GNSS observations using single-frequency and double-frequency measurement receivers
200
Experimental observations As already mentioned, part of the
Dargovských Hrdinov housing estate was selected for experimental observation. On the basis of reconnaissance, five OP were chosen: B6, B10, C20, P-III-1, P-IV-1 as well as three RP: Haringeš, Varkapa, Široká, hereinafter marked as H, V and S. The selection of RP was conditioned by the fact that they had already been used in the 2003 measurement stage, used in subsequent DA. The pertinent area was measured using the GNSS static measurement method in two consecutive stages in May 2009 and June 2009. Experimental measurements in the May 2009 stage were carried out using single frequency (hereinafter 1-F) Sokkia Stratus receivers and in the June 2009 stage using double frequency (hereinafter 2-F) Leica GPS900CS and Leica GPS1200 receivers (Labant et al., 2009).
Experimental measurement performed using Sokkia Stratus 1-F GPS receivers (May 2009 stage)
The first experimental measurement for this contribution, in order to monitor stability of part of the DH
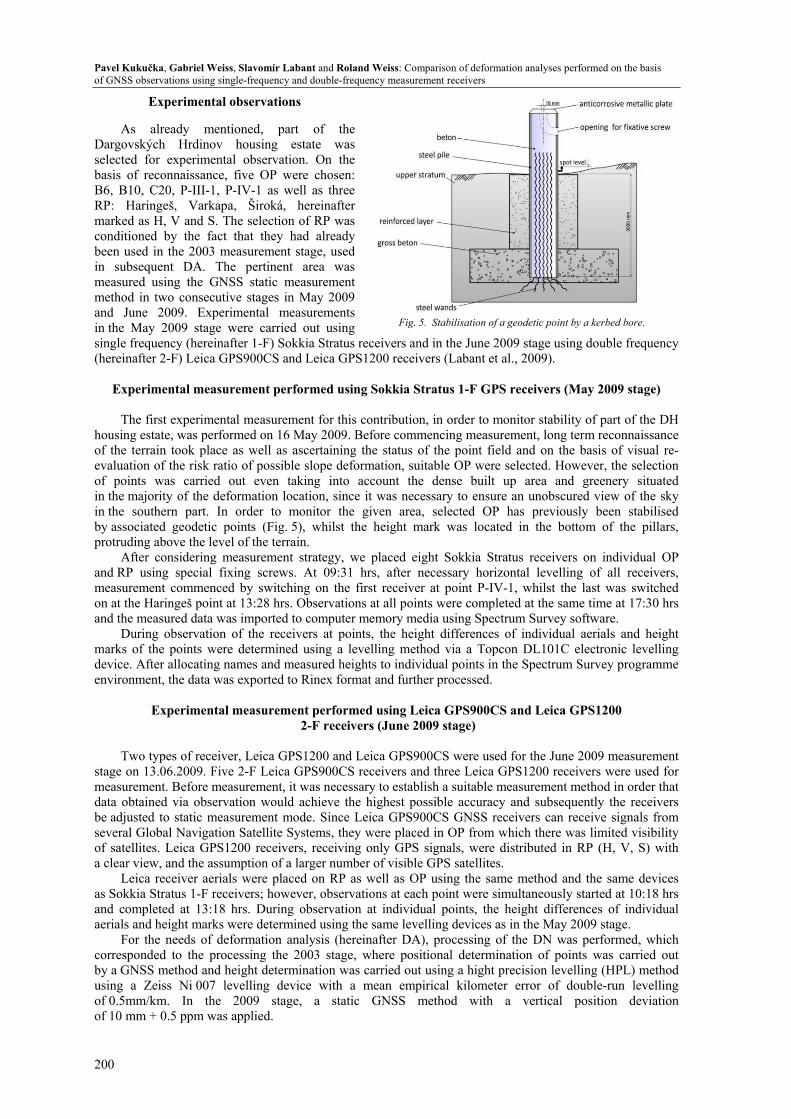
housing estate, was performed on 16 May 2009. Before commencing measurement, long term reconnaissance of the terrain took place as well as ascertaining the status of the point field and on the basis of visual re-evaluation of the risk ratio of possible slope deformation, suitable OP were selected. However, the selection of points was carried out even taking into account the dense built up area and greenery situated in the majority of the deformation location, since it was necessary to ensure an unobscured view of the sky in the southern part. In order to monitor the given area, selected OP has previously been stabilised by associated geodetic points (Fig. 5), whilst the height mark was located in the bottom of the pillars, protruding above the level of the terrain.
After considering measurement strategy, we placed eight Sokkia Stratus receivers on individual OP and RP using special fixing screws. At 09:31 hrs, after necessary horizontal levelling of all receivers, measurement commenced by switching on the first receiver at point P-IV-1, whilst the last was switched on at the Haringeš point at 13:28 hrs. Observations at all points were completed at the same time at 17:30 hrs and the measured data was imported to computer memory media using Spectrum Survey software.
During observation of the receivers at points, the height differences of individual aerials and height marks of the points were determined using a levelling method via a Topcon DL101C electronic levelling device. After allocating names and measured heights to individual points in the Spectrum Survey programme environment, the data was exported to Rinex format and further processed.
Experimental measurement performed using Leica GPS900CS and Leica GPS1200
2-F receivers (June 2009 stage)
Two types of receiver, Leica GPS1200 and Leica GPS900CS were used for the June 2009 measurement stage on 13.06.2009. Five 2-F Leica GPS900CS receivers and three Leica GPS1200 receivers were used for measurement. Before measurement, it was necessary to establish a suitable measurement method in order that data obtained via observation would achieve the highest possible accuracy and subsequently the receivers be adjusted to static measurement mode. Since Leica GPS900CS GNSS receivers can receive signals from several Global Navigation Satellite Systems, they were placed in OP from which there was limited visibility of satellites. Leica GPS1200 receivers, receiving only GPS signals, were distributed in RP (H, V, S) with a clear view, and the assumption of a larger number of visible GPS satellites.
Leica receiver aerials were placed on RP as well as OP using the same method and the same devices as Sokkia Stratus 1-F receivers; however, observations at each point were simultaneously started at 10:18 hrs and completed at 13:18 hrs. During observation at individual points, the height differences of individual aerials and height marks were determined using the same levelling devices as in the May 2009 stage.
For the needs of deformation analysis (hereinafter DA), processing of the DN was performed, which corresponded to the processing the 2003 stage, where positional determination of points was carried out by a GNSS method and height determination was carried out using a hight precision levelling (HPL) method using a Zeiss Ni 007 levelling device with a mean empirical kilometer error of double-run levelling of 0.5mm/km. In the 2009 stage, a static GNSS method with a vertical position deviation of 10 mm + 0.5 ppm was applied.
Fig. 5. Stabilisation of a geodetic point by a kerbed bore.
Acta Montanistica Slovaca Ročník 17 (2012), číslo 3, 195-203
201
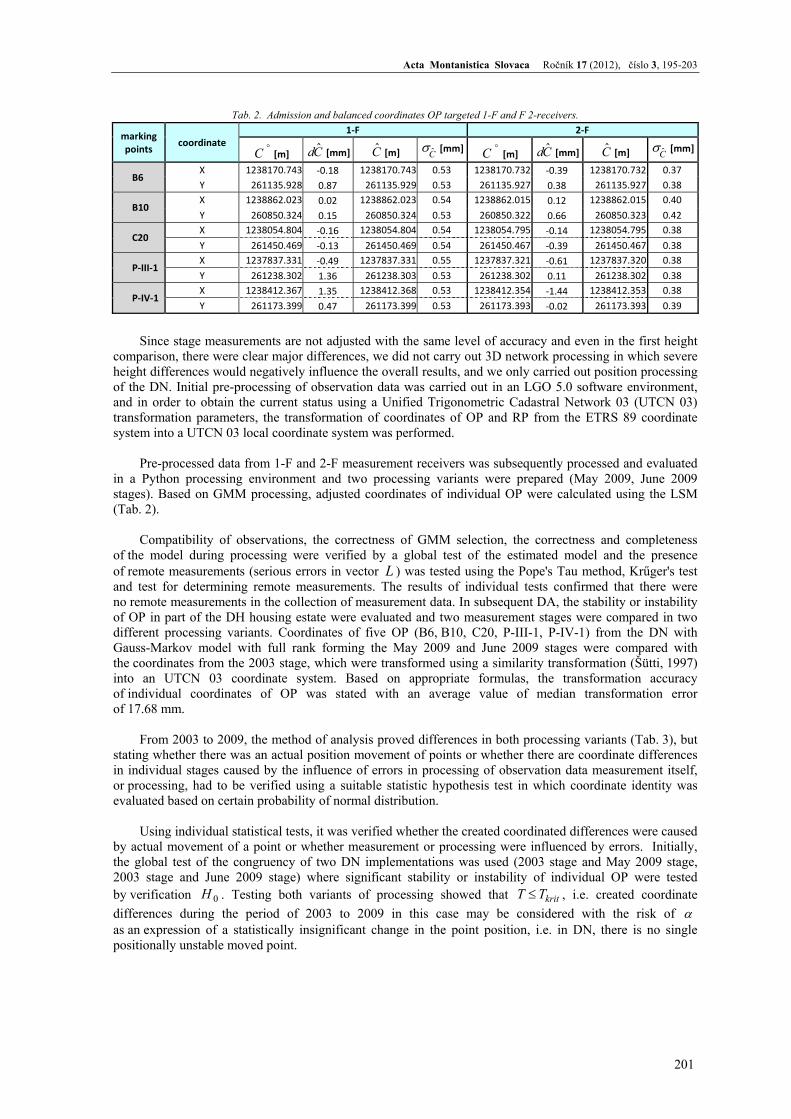
Tab. 2. Admission and balanced coordinates OP targeted 1-F and F 2-receivers.
Since stage measurements are not adjusted with the same level of accuracy and even in the first height
comparison, there were clear major differences, we did not carry out 3D network processing in which severe height differences would negatively influence the overall results, and we only carried out position processing of the DN. Initial pre-processing of observation data was carried out in an LGO 5.0 software environment, and in order to obtain the current status using a Unified Trigonometric Cadastral Network 03 (UTCN 03) transformation parameters, the transformation of coordinates of OP and RP from the ETRS 89 coordinate system into a UTCN 03 local coordinate system was performed.
Pre-processed data from 1-F and 2-F measurement receivers was subsequently processed and evaluated
in a Python processing environment and two processing variants were prepared (May 2009, June 2009 stages). Based on GMM processing, adjusted coordinates of individual OP were calculated using the LSM (Tab. 2).
Compatibility of observations, the correctness of GMM selection, the correctness and completeness
of the model during processing were verified by a global test of the estimated model and the presence of remote measurements (serious errors in vector L ) was tested using the Pope's Tau method, Krűger's test and test for determining remote measurements. The results of individual tests confirmed that there were no remote measurements in the collection of measurement data. In subsequent DA, the stability or instability of OP in part of the DH housing estate were evaluated and two measurement stages were compared in two different processing variants. Coordinates of five OP (B6, B10, C20, P-III-1, P-IV-1) from the DN with Gauss-Markov model with full rank forming the May 2009 and June 2009 stages were compared with the coordinates from the 2003 stage, which were transformed using a similarity transformation (Šütti, 1997) into an UTCN 03 coordinate system. Based on appropriate formulas, the transformation accuracy of individual coordinates of OP was stated with an average value of median transformation error of 17.68 mm.
From 2003 to 2009, the method of analysis proved differences in both processing variants (Tab. 3), but
stating whether there was an actual position movement of points or whether there are coordinate differences in individual stages caused by the influence of errors in processing of observation data measurement itself, or processing, had to be verified using a suitable statistic hypothesis test in which coordinate identity was evaluated based on certain probability of normal distribution.
Using individual statistical tests, it was verified whether the created coordinated differences were caused
by actual movement of a point or whether measurement or processing were influenced by errors. Initially, the global test of the congruency of two DN implementations was used (2003 stage and May 2009 stage, 2003 stage and June 2009 stage) where significant stability or instability of individual OP were tested by verification 0H . Testing both variants of processing showed that kritTT ≤ , i.e. created coordinate differences during the period of 2003 to 2009 in this case may be considered with the risk of α as an expression of a statistically insignificant change in the point position, i.e. in DN, there is no single positionally unstable moved point.
marking points
coordinate 1‐F 2‐F
oC [m] Cd ˆ
[mm] C [m] Cσ [mm] oC [m] Cd ˆ
[mm] C [m] Cσ [mm]
B6 X 1238170.743 ‐0.18 1238170.743 0.53 1238170.732 ‐0.39 1238170.732 0.37 Y 261135.928 0.87 261135.929 0.53 261135.927 0.38 261135.927 0.38
B10 X 1238862.023 0.02 1238862.023 0.54 1238862.015 0.12 1238862.015 0.40
Y 260850.324 0.15 260850.324 0.53 260850.322 0.66 260850.323 0.42
C20 X 1238054.804 ‐0.16 1238054.804 0.54 1238054.795 ‐0.14 1238054.795 0.38
Y 261450.469 ‐0.13 261450.469 0.54 261450.467 ‐0.39 261450.467 0.38
P‐III‐1 X 1237837.331 ‐0.49 1237837.331 0.55 1237837.321 ‐0.61 1237837.320 0.38
Y 261238.302 1.36 261238.303 0.53 261238.302 0.11 261238.302 0.38
P‐IV‐1 X 1238412.367 1.35 1238412.368 0.53 1238412.354 ‐1.44 1238412.353 0.38
Y 261173.399 0.47 261173.399 0.53 261173.393 ‐0.02 261173.393 0.39
Pavel Kukučka, Gabriel Weiss, Slavomír Labant and Roland Weiss: Comparison of deformation analyses performed on the basis of GNSS observations using single-frequency and double-frequency measurement receivers
202
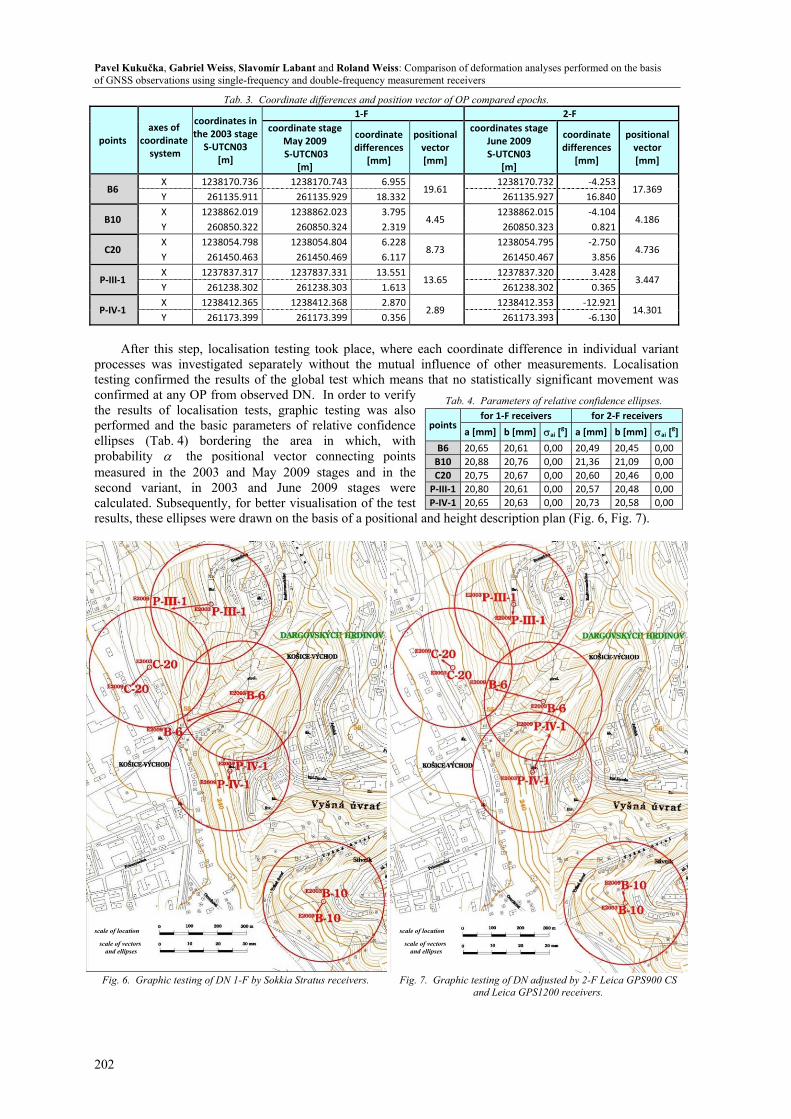
Tab. 3. Coordinate differences and position vector of OP compared epochs.
points axes of
coordinate system
coordinates in the 2003 stage S‐UTCN03
[m]
1‐F 2‐F coordinate stage
May 2009 S‐UTCN03
[m]
coordinate differences
[mm]
positional vector [mm]
coordinates stageJune 2009 S‐UTCN03
[m]
coordinate differences
[mm]
positional vector [mm]
B6 X 1238170.736 1238170.743 6.955
19.61 1238170.732 ‐4.253
17.369 Y 261135.911 261135.929 18.332 261135.927 16.840
B10 X 1238862.019 1238862.023 3.795
4.45 1238862.015 ‐4.104
4.186 Y 260850.322 260850.324 2.319 260850.323 0.821
C20 X 1238054.798 1238054.804 6.228
8.73 1238054.795 ‐2.750
4.736 Y 261450.463 261450.469 6.117 261450.467 3.856
P‐III‐1 X 1237837.317 1237837.331 13.551
13.65 1237837.320 3.428
3.447 Y 261238.302 261238.303 1.613 261238.302 0.365
P‐IV‐1 X 1238412.365 1238412.368 2.870
2.89 1238412.353 ‐12.921
14.301 Y 261173.399 261173.399 0.356 261173.393 ‐6.130
After this step, localisation testing took place, where each coordinate difference in individual variant
processes was investigated separately without the mutual influence of other measurements. Localisation testing confirmed the results of the global test which means that no statistically significant movement was confirmed at any OP from observed DN. In order to verify the results of localisation tests, graphic testing was also performed and the basic parameters of relative confidence ellipses (Tab. 4) bordering the area in which, with probability α the positional vector connecting points measured in the 2003 and May 2009 stages and in the second variant, in 2003 and June 2009 stages were calculated. Subsequently, for better visualisation of the test results, these ellipses were drawn on the basis of a positional and height description plan (Fig. 6, Fig. 7).
Fig. 6. Graphic testing of DN 1-F by Sokkia Stratus receivers.
Fig. 7. Graphic testing of DN adjusted by 2-F Leica GPS900 CS and Leica GPS1200 receivers.
Tab. 4. Parameters of relative confidence ellipses.
pointsfor 1‐F receivers for 2‐F receivers
a [mm] b [mm] σai [g] a [mm] b [mm] σai [
g]
B6 20,65 20,61 0,00 20,49 20,45 0,00B10 20,88 20,76 0,00 21,36 21,09 0,00C20 20,75 20,67 0,00 20,60 20,46 0,00P‐III‐1 20,80 20,61 0,00 20,57 20,48 0,00P‐IV‐1 20,65 20,63 0,00 20,73 20,58 0,00
scale of location
scale of vectors and ellipses
scale of location
scale of vectors and ellipses
Acta Montanistica Slovaca Ročník 17 (2012), číslo 3, 195-203
203
Conclusion
By constant monitoring of areas threatened by slope movement, it is possible to discover risk factors
which could cause great damage to property as well as lives. Prior to monitoring, preparation of the project and selection of suitable work methods took place, taking into consideration economic, time and accuracy criteria. The achieved results showed the fact that the use of GNSS is very favourable for the needs of investigating deformation, whilst when also using Sokkia Stratus 1-F receivers during sufficiently long observation, more suitable measurement conditions and with improved quality preparation of measurements, it is possible to achieve results comparable to the more expensive double frequency Leica GPS900CS and Leica GPS1200 receivers Worsening of the quality of data obtained by observations of double frequency Leica receivers on RP and OP of the deformation network could also be caused by the fact that measurement took place from 10:18 hrs to 13:18 hrs, when there is limited signal reception from GNSS satellites which invludes the values of PDOP and HDOP. Another factor which could have negatively influenced the achieved accuracy was the use of two Leica receivers equipped with different firmware. Disadvantages of using GNSS could also include determination of the point position in a vertical direction which, in case of 3D processing of a deformation network, would influence the overall results. That is why it is more beneficial to determine the vertical position of observed points using a method of very accurate levelling. The results of the deformation analysis show that coordinate differences of observed points are not statistically significant which proves that the monitored area is relatively stable.
References
Biacs, Z.: Estimation and Hypothesis Testing for Deformation Analysis in Special Purpose Networks. UCSE Report No. 20032, Unio. Calgary 1989, pp. 1-171.
Caspary, W. F.: Concepts of network and deformation analysis. 1st edition. Kensingthon: School of surveying The University of New South Wales, 1987. 187 p., ISBN 0-85839-044-2.
Gašincová, S., Kňežo D., Mixtaj L., Harman P.: Impacts of measuring and Numerical errors in LSM adjustment of Local Geodetic Net. GeoScience Engineering, 2011, Vol. LVII, Issue no.1, ISSN 1802-5420.
Heck, B.: Zur geometrischen Analyse von Deformationen in Lagenetzen. Allg. Werm. Nachr.,1984, no. 11, pp. 357-364.
Hefty, J., Husár, L.: Satellite geodesy: Global Positioning System. Bratislava: STU Bratislava, 2003. 186 p., ISBN 80-227-1823-8.
Kukučka, P., The using of satellite systems for monitoring slide areas. PhD Thesis, 2011, Košice. Labant, S., Kalatovičová, L., Kukučka, P., Weiss, E.: Precision of GNSS instruments by static method
comparing in real time. Acta Montanistica Slovaca, Vol. 14, 2009, no. 1, pp. 55-61, ISBN 1335-1788. Sabová, J., Gašincová, S.: Graphic testing in deformation monitoring. Acta Montanistica Slovaca. Vol.7,
2002, no.2, pp. 127-130, ISBN 1335-1788. Sabová, J., Jakub, V.: Geodetic deformation monitoring. 1st edition. Košice: Editor centre and editorial office
AMS, F BERG, Technical University of Košice, 2007. 128 p., ISBN 978-80-8073-788-7. Samama, N.: Global positioning: Technologies and Performance. Hoboken, New Jersey: John Wiley and
sons, Inc., 2008. 419 p., ISBN 978-0-471-79376-2. Šütti, J.: Deviationless geodetic transformations. Acta Montanistica Slovaca, Vol. 2, 1997, no. 1, p. 1-10,
ISBN 1335-1788. Weiss, G., Gašinec, J., Engel, J., Labant, S., Rákay, ml., Š.: Effect incorrect points of the Local Geodetic
Network at results of the adjustment. Acta Montanistica Slovaca, Vol. 13, 2008, 4, pp. 485-490, ISBN 1335-1788.
Weiss, G., Jakub, V.: The test verification of 3D geodetic points and their changes. Acta Montanistica Slovaca. 12, Special Issue 3, 2007, pp. 612-616, ISBN 1335-1788.
www1: SmartNet Slovensko [online]. [cit. 2010.3.20]. Available at: http://www.geotech.sk/srv_gtch.htm www2: SKPOS [online]. [cit. 2010.4.25]. Available at: http://www.gku.sk/predmet-cinnosti/geodeticke-
zaklady/gnss-uvod