Embed Size (px)
Citation preview
1AMERICAN INSTITUTE OF AERONAUTICS AND ASTRONAUTICS
Comparison of Discharge Plasma Parameters in a30-cm NSTAR Type Ion Engine with and
without Beam Extraction*
Daniel A. Herman†, Alec D. Gallimore‡
Plasmadynamics and Electric Propulsion LaboratoryUniversity of Michigan
Ann Arbor, MI 48105 USA
ABSTRACT
Double Langmuir probe measurements are presented over a two-dimensional array of locationsin the near Discharge Cathode Assembly (DCA) region of a 30-cm diameter ring cusp i o nthruster. Discharge plasma data taken with and without beam extraction exhibit a broadeningof the high on-axis electron temperature region when a beam is extracted. Electron numberdensity and temperature contours are presented for similar discharge currents and voltages, butdifferent cathode and main mass flow rates. Decreasing the discharge cathode flow rate tendsto broaden the high on-axis electron temperature region possibly resulting from transition o fthe discharge cathode from spot to plume mode. Electron temperature magnitudes, 2 – 7 e V ,are comparable to those measured by other researchers in electron bombardment dischargeplasmas. Number density contours, with a maximum of approximately 2 x 1 012 cm-3 o ncenterline, show very little variation over the range of operating conditions investigated.Number densities are similar to data taken by other researchers and are high enough t oaccount for the measured erosion of the DCA in the 8200 hour wear test, as calculated b yWilliams, due to singly ionized xenon accelerating away from a potential hill back towardsthe DCA.
NOMENCLATURE
* Color copies available at http://www.engin.umich.edu/dept/aero/spacelab/research/conf_pub.html.† Graduate Student, Aerospace Engineering, Member AIAA, [email protected].‡ Associate Professor and Laboratory Director, Associate Fellow AIAA.
Ap Probe surface area, m2
As Ion Collection Area, m2
e, q Electron charge, 1.6x10⁻¹⁹ CI Probe collected current, mAIsat Ion saturation current, AJa Acceleration grid current, mAJb Beam current, AJdc Discharge current, AJnk Neutralizer keeper current, Ak Boltzmann’s constant, 1.38x10⁻²³ J/KMXe Atomic mass of xenon, kgm Electron mass, kgne, Electron number density, cm-3
ni Ion number density, cm-3
Pb Base pressure (air), TorrPi Indicated pressure (with xenon flow), TorrPc Corrected pressure (on xenon), Torrr Probe Electrode Radius, mTeV Electron temperature, eVVck-cc Keeper to cathode common voltage, VVd Discharge voltage, VVg Neutralizer to ground coupling voltage, VVs Screen grid voltage, VVa Acceleration grid voltage, VVnk Neutralizer keeper voltage, VlD Debye Length, cm or mmf Probe bias potential, Vd Sheath thickness, cm
2AMERICAN INSTITUTE OF AERONAUTICS AND ASTRONAUTICS
INTRODUCTION
Ion thrusters are high efficiency, high specificimpulse (Isp) propulsion systems proposed as theprimary propulsion source for a variety ofmissions. In some cases ion thruster technologyhas enabled new missions that had not beenfeasible using liquid propellant rockettechnology. NASA’s Dawn mission, propelledby three 30-cm ion thrusters, will study twominor planets, Ceres and Vesta, that reside in thevast asteroid belt between Mars and Jupiter.1 TheNASA Solar Electric Propulsion TechnologyApplications Readiness (NSTAR) 30-cm ionthruster was the first ion engine to be used forprimary spacecraft propulsion, validating ionthruster technology, and demonstratingoperation for over three times its intendedlifetime.2 Nevertheless, efforts to furtherincrease engine lifetime continue.A potential failure mechanism for an ion engineis erosion of the discharge cathode.3 A cathodekeeper was added, as an engineering solution, inorder to mitigate cathode erosion on NSTAR.4
Adding the keeper reduced the cathode erosionrate to acceptable levels and until recently wasthought to have solved the Discharge CathodeAssembly (DCA) erosion issue. An ExtendedLife Test (ELT) of the NSTAR flight sparethruster, conducted at the Jet PropulsionLaboratory (JPL), revealed extensive keepererosion that has yet to be fully explained.5-7
Although the engine continues to operate after28,000 hours of operation (over 200 kg ofxenon processed)7, there exists a clear need tounderstand the cause of DCA erosion, howengine operating conditions affect DCA erosion,and how to reduce DCA erosion therebyextending engine lifetime. Laser Induced Fluorescence (LIF) measurementsdone by Williams have suggested the existenceof a potential hill downstream of the DCA as apossible cause of DCA erosion.8-10 Directmeasurement of plasma properties, such aselectron temperature, electron number density,and plasma potential would validate or rule outthe possibility that a potential hill causesdischarge cathode erosion by accelerating aportion of the ions away from the hill towardsthe DCA.
Mapping the internal plasma structure of the 30-cm ion engine, downstream of the DCA, as afunction of engine operating condition isessential to understanding the cause of DCAerosion.
30-CM ION THRUSTER
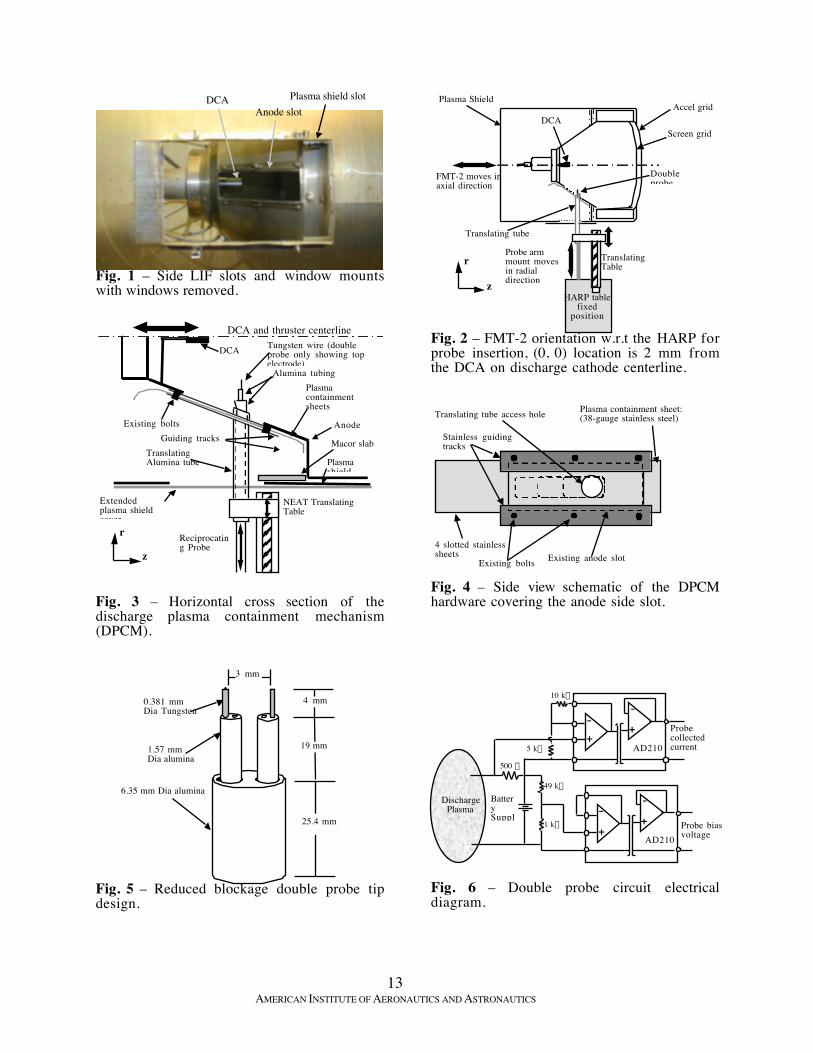
BackgroundThe Functional Model Thruster (FMT) precededthe NSTAR Engineering Model Thruster (EMT)and the NSTAR Flight Thruster. The principaldifference in the construction of the FMT fromthe EMT is the anode material. The FMT anodeis aluminum while the EMT anode is spunaluminum and titanium. The second of twoFMTs, FMT-2, was modified at the NASA GlennResearch Center (GRC) by Williams to allowoptical access to the discharge chamber for LIFmeasurements.8 Six slots were cut into FMT-2:three slots in the anode wall and three slots in theplasma shield. Three quartz windows covered the rectangularslots cut into the FMT-2 anode wall during LIFmeasurements. These three slots, each 10.2 cmby 3.2 cm, replaced roughly twenty percent ofthe anode surface. The side slots of the plasmashield and anode are shown in Fig. 1. The magnetic field, DCA, and geometry of thedischarge chamber are identical to those of theEMT-1.8 For a more complete comparisonbetween FMT-2 and EMT-1 see Reference 8.The thruster has been operated over the entireNSTAR power throttling range at GRC and atthe Plasmadynamics and Electric PropulsionLaboratory (PEPL) illustrating comparableperformance to the EMTs and flight thrusters.Williams has shown that these modifications havenot altered the discharge chamber magneticfield, the ion production efficiency, or theoverall thruster performance.8
Discharge Plasma Containment MechanismThe side anode quartz window is replaced by aDischarge Plasma Containment Mechanism(DPCM) allowing electrostatic probe accessinside the anode. The first design iterationconsisted of 44-gauge stainless steel foil heldbetween stainless steel guides that force the foilto curl as the probe moved downstream of theDCA.
3AMERICAN INSTITUTE OF AERONAUTICS AND ASTRONAUTICS
A 99.8% pure alumina tube extended from theplasma shield into the anode, isolating the probefrom both anode and ground while maintainingisolation between anode and ground. Thisdesign proved flawed due to the formation ofrips or tears in the foil after multiple axialcycles. A more complete description of theoriginal design can be found in Reference 11.The new design, shown in Figures 2 – 4, replacesthe 44-gauge curling sheet with a series ofoverlapping 38-guage slotted stainless steelsheets. Repeatable axial movement of the probeis possible without the formation of rips.Discharge plasma containment is maintained andvisually monitored during thruster operation viaan adjacent vacuum-rated camera. Any visiblehole or tear formation, while extracting a beam,leads to a surge of discharge plasma towards thehole as the high-voltage plasma escapes toground. Repeated recycles of the engine occurwhen this happens that often overload theisolation amplifiers in the double probe circuit. The ability to retract and extend the translatingalumina tube at various axial locationsminimizes protrusion of material into thedischarge chamber. The alumina tube extendsapproximately 2 cm inside of the dischargechamber wall at all axial locations. The aluminatube is mounted onto a New England AffiliatedTechnologies (NEAT) RMS-800 single axis ballscrew table controlled via computer. The tablehas a lead screw accuracy of 80 mm and a rangeof motion of 20 cm. To minimize the likelihood of contaminatingand perturbing the discharge plasma, the probeis recessed in the low-density interior of thealumina tube when not in use. A rectangularaluminum plate eliminates the line of sight ofbackground particles to the anode.
APPARATUS AND PROCEDURE
Vacuum FacilityAll experiments are performed in the 6 m by 9m Large Vacuum Test Facility (LVTF) at PEPL.Four of the seven CVI Model TM-1200 Re-Entrant Cryopumps are used for theseexperiments, which provide a combinedpumping speed of 140,000 l/s on xenon with abase pressure of ~3x10⁻⁷ Torr. Chamberpressure is recorded using two hot-cathodeionization gauges. The pressure reported is anaverage of the two corrected readings. Acomplete neutral pressure map of the LVTF hasshown that the average pressure is a conservativemeasure of the tank pressure in this facility.12
Pressure measurements from each gauge arecorrected for xenon using the known basepressure on air and a correction factor of 2.87for xenon according to,13,14
bPbPiPcP +
-=
87.2. (1)
A dedicated propellant feed system, consistingof three Edwards mass flow controllers providedby NASA GRC, control the xenon flow rate tothe thruster. The flow rates are periodicallycalibrated using a known volume technique.A 2 m by 2.5 m louvered graphite panel beamdump is positioned approximately 4 mdownstream of the FMT-2 to reduce backsputtering. The thruster is operated at PEPLusing a modified Skit-Pac provided by NASAGRC.
Axial MovementThe FMT-2 is mounted on a custom built, two-axis positioning system consisting of two NEATtranslational stages. The upper axis maintains aconstant radial distance between the thruster andthe High-speed Axial Reciprocating Probe(HARP) positioning system. The lower axiscontrols the engine axial location with respect tothe probe to an absolute position accuracy of0.15 mm. The electrostatic probe is radiallypositioned inside the discharge chamber usingthe HARP. The HARP system is fixed to thechamber wall. When actuated, the probe extendsto the thruster centerline then returns to thestarting location recessed inside the translatingalumina tube. The RMS-800 NEAT tableretracts and extends the translating alumina tubeas the axial location changed.
High-speed Axial Reciprocating Probe (HARP)A linear motor assembly provides highlyaccurate direct linear motion of the probe withminimal discharge chamber residence times.The HARP system is a three-phase brushless dcservo motor consisting of a linear “U”-shapedmagnet track and a “T”-shaped coil moving ona set of linear tracks. The linear encoderprovides positioning resolution to 5 mm.15 APacific Scientific SC950 digital, brushless servodrive controls the motor. A PC monitors andcontrols the servo drive via serial cable. Theentire table is enclosed in a stainless steel shroudwith a graphite outer skin. Residence times ofthe probe inside the discharge chamber are keptunder one second to minimize probe heatingand discharge plasma perturbation. Additional
4AMERICAN INSTITUTE OF AERONAUTICS AND ASTRONAUTICS
information of the HARP system can be foundin References 15 and 16.
FMT-2 OperationSince the current investigation focuses on nearDCA plasma phenomena, the primary thrusteroperating parameters are the discharge currentand voltage. For each operating condition,without beam extraction, the discharge current isset to the desired value corresponding to thedischarge current in the NASA Throttling table(TH Level). The main anode flow rate anddischarge cathode flow rate are adjusted so thedischarge voltage matches the respective valuefor the desired NASA TH Level. The dischargeonly operating conditions, i.e. without beamextraction, of the FMT-2 are referred to asDischarge Levels (DL). The procedure for operating the FMT-2 withbeam extraction is to slowly throttle up thedischarge current to match the desired NASATH Level discharge current. The main anddischarge flow rates are adjusted until both thedischarge cathode voltage and beam currentmatch those recorded in the NASA throttlingtable. The data taken with beam extraction arereferred to as Thruster Operating Conditions(TOC Levels). Referring to them as ThrottlingLevels (TH) would be erroneous because not allof the thruster operating parameters arematched. Tables 1 – 3 report the completelisting of the discharge parameters and thrustertelemetry for the operating conditionsinvestigated.The typical data collection time was one hourfor each operating condition. In order tomaintain discharge voltage and beam current,the cathode and main flow rates were sometimesadjusted slightly during data collection. Themaximum and minimum flow rates during datacollection are recorded.
ELECTROSTATIC PROBE
Probe TypeSeveral factors are taken into consideration whendesigning the electrostatic probe, the first beingthe type of probe. Unlike the single Langmuirprobe, the double probe floats as a whole, whichboth minimizes discharge plasma perturbationand allows the probe electrodes to followdischarge plasma oscillations.17 The symmetricgeometry of the double probe about thedischarge cathode orifice makes it moreappealing than using a triple probe. Asymmetric double probe is selected over an
asymmetric double probe because the simplicityin data analysis outweighed the benefits gainedby sampling more of the electron energydistribution. A major drawback of the doubleprobe is that there is no distinction betweenprimary and Maxwellian electron populations.Double Probe HardwareProbes always perturb their surroundings,however the extent of the perturbation isminimized by physically making the probe assmall as possible. This bodes well with the needto maintain spatial resolution when makingmeasurements. To minimize the plasma lossesto the probe, which would unduly perturb thedischarge plasma, the probe size is minimizedwhile maintaining a measurable current based onpredicted plasma parameters.The electrodes of the double probe are sizedsuch that, for the expected electron temperature(2 – 11 eV)18,19 and predicted number densities(1010 – 1012 cm-3),18,20 the probe operates in thethin sheath regime. The number densities areexpected to have a maximum on cathodecenterline and decrease by over two orders ofmagnitude with increasing radial distance fromcenterline driving an ever-increasing Debyelength. The relationship of the Debye length toelectron number density and temperature isillustrated in Equation 2:29-30
e
eVD n
T743=l . (2)
In the thin sheath regime, the flux of particlesentering the sheath can be calculated withoutconsidering the details about the orbits of theseparticles in the sheath.17,21-23 In this case, thecollection area of the electrode is approximatedas the area of the electrode, which is justified fora large ratio of probe radius to Debye length,lD.17,21,23 However, the rapid growth in the Debyelength with increasing radial distance fromcathode centerline dictates that, at some radiallocation inside the anode, the thin sheathcriterion may not strictly apply. Accordingly,the thin sheath calculation is used until theDebye length is equal to the electrode radius.A large length to diameter ratio minimizes endeffects. A conservative gap distance – thedistance between the probe electrodes –maintains a minimum factor of three times thesum of the two electrode sheaths (i.e., 3 x 2 x5lD) to avoid overlapping. Three similar double probes were used duringthe test due to breaking of probes. All probes
5AMERICAN INSTITUTE OF AERONAUTICS AND ASTRONAUTICS
were slight variations on the basic double probedesign used, shown in Fig. 5. Two 0.381 mmdiameter cylindrical tungsten electrodes, with 4mm exposed length, are held inside two doublebore pieces of 99.8% pure alumina epoxied toone larger double bore piece of 99.8% purealumina. The total length of the tungsten andalumina is approximately 46 cm (18 inches).The “double tier” design reduces the amountof blockage mass that is inserted into thedischarge cathode plume.
Double Probe ElectronicsDuring probe insertion into the dischargeplasma, the floating potential rapidly increases ashigh as 1100 V, causing difficulty for mostelectronics. Significant errors in the measuredcurrent can occur due to any appreciable straycapacitance in the circuit. As such, carefulattention is paid to minimizing stray capacitancein the circuit design including the use ofbatteries to supply the bias voltage.16 The batterysupply consists of two series groups of four67.5-volt zinc-manganese dioxide batteriesconnected in parallel. The batteries are capableof outputting 135 V at 100 mA. Apotentiometer is attached to the battery output toadjust the electrode bias voltage.The double probe circuit, previously used tomake similar measurements inside the dischargechannel of a Hall Thruster16, is built around twoAnalog Devices AD210 isolation amplifiers.These amplifiers are capable of handling up to2500 volts of common mode voltage andprovide an input impedance of 1x10¹² W. Thelow impedance output (1 W maximum) isconnected to a Tektronix TDS 3034B digitaloscilloscope that, when triggered off the probeposition, records the data and saves it to acomputer. Figure 6 illustrates the double probecircuit. The outputs of the isolation amplifiersare calibrated with known currents and biasvoltages over their entire operating ranges.
DATA ACQUISITION
To reduce data collection time, the three NEATtables are controlled by one LabVIEW code thatallows multiple input positions, the ability to waitat a given location, the ability to trigger theHARP, and record the data from the oscilloscopeafter each sweep. The automation increases thespatial resolution for a given amount of time.The two NEAT translational stages and NEATRMS-800 stage are controlled via GPIBconnections. A LabVIEW code steps throughthe full axial range of motion (approximately 4
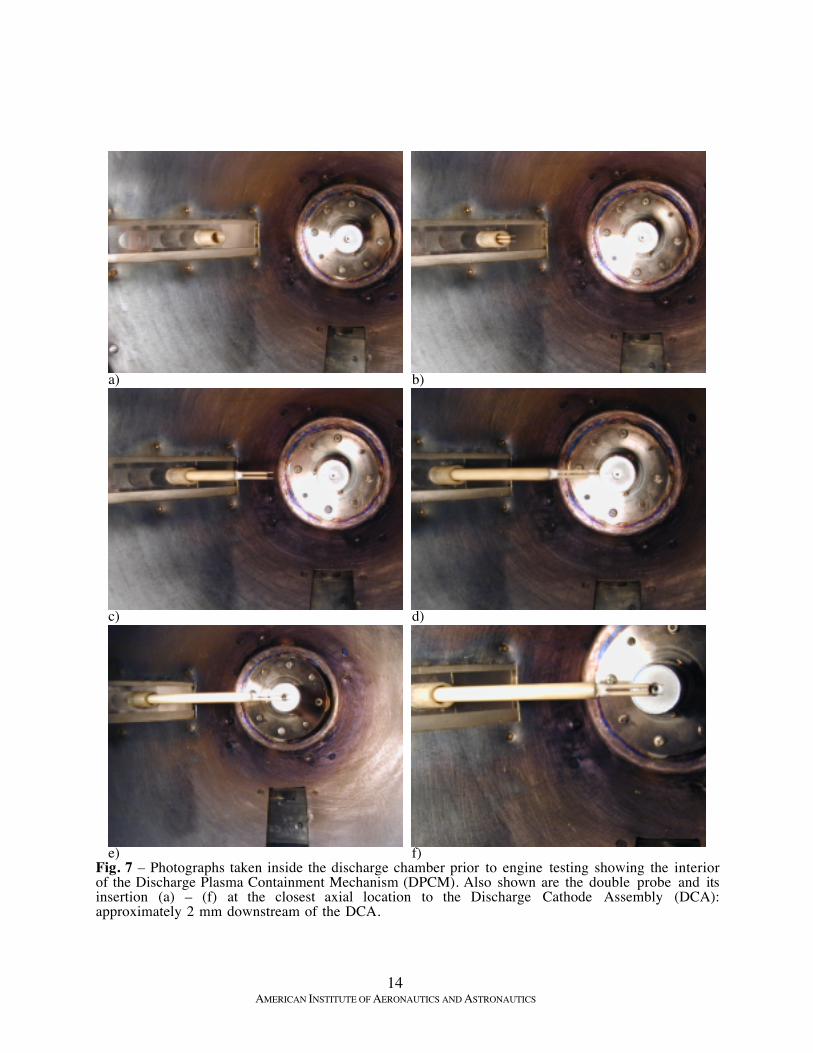
cm) in 1.6 mm increments. For each axial step,the program retracts the alumina translating tuberadially, sweeps the probe radially through thedischarge plasma, and dwells for the amount oftime required for the HARP sweep of the probe.After all axial locations are interrogated, thecomputer returns the FMT-2 to the zero axialposition located 2 mm downstream of the DCAexit plane. Bias voltages are set manually usinga potentiometer and the battery supply. Theprobe is then swept through all spatial locations.The bias voltage is then manually changed andthe process repeats until the 31 bias voltages areinvestigated.The HARP is controlled by a separate computerusing serial connections. A Tektronix TDS3034B oscilloscope triggers off of the HARPposition and records all data. The oscilloscoperecords probe position, probe collected current,probe bias voltage, and the discharge current(from a Hall sensor) as a function of time duringprobe insertion. From the oscilloscope raw data,the discharge current, probe collected current,and probe bias voltage are calculated as afunction of probe position. The resulting dataare reassembled to obtain the current-voltagecharacteristic (I-V curve) of the double probe ateach spatial location in the radial sweep.Only data taken on the “in sweep” of the probeare analyzed as “out sweep” data are morelikely to be affected by probe perturbation.Figure 7 illustrates probe insertion into thedischarge plasma. Figure 8 illustrates the two-dimensional data collection domain. Thedischarge current perturbation induced by thedouble probe is measured using a Hall Probe, inconjunction with the Tektronix TDS 3034Boscilloscope. Discharge current perturbation isapproximately 5 - 10%.
DATA ANALYSIS
The scientific graphing package Igor is used toanalyze the data. The data are read into Igor,which reassembles the data into individualcharacteristics at each spatial location in the two-dimensional grid. The individual double probecharacteristics are analyzed assuming an infinite,quasi-neutral, and quiescent plasma. Theelectron and ion mean free paths are muchlarger than the probe dimensions indicating acollisionless analysis. Particles are assumed tobe collected without reflection or reaction insidethe electrode collection area. The presence of a magnetic field has anegligible effect on the probe measurements.
6AMERICAN INSTITUTE OF AERONAUTICS AND ASTRONAUTICS
The double probe analysis infers numberdensity from the ion saturation current andtherefore is unaffected by the reduction inelectron saturation current caused by thepresence of a magnetic field. The magneticfield can also lead to electron energydistribution function (EEDF) anisotropy.Passoth24 determined that EEDF anisotropydepends upon the ratio B/po, where po is thepressure in the containment vessel (in this casethe discharge chamber). It has been shownexperimentally that EEDF anisotropy isnegligible for B/po £ 2.5x10⁶ G/Torr.25 In theFMT-2, B has a maximum (downstream of theDCA) of 107 G and the pressure in thedischarge chamber is estimated to be ~10-4 Torr.The value of B/po for the worst case is 1x10⁶,therefore no substantial anisotropy in the EEDFis expected.Post test inspection of the raw data revealedasymmetric I-V curves. The asymmetry is mostextreme closest to the DCA, decreasing withincreasing axial distance from the DCA. Theasymmetry is larger than can be accounted forby differing electrode lengths. The mostprobable cause is electrode to orificemisalignment occurring during pumpdown.The HARP, and thus the electrostatic probe, ismounted to the wall of the chamber, while theengine rests on a platform inside the vacuumfacility. During pumpdown the walls of thechamber compress resulting in a shift of theprobe tip. A vertical shift of one millimeterwould result in one electrode lying directly infront of the discharge cathode plume. Thedisappearance of the asymmetry far from theplume supports the misalignment theory.Mounting both the engine and the HARP on acommon structure, independent of the chamberwall, would eliminate this problem.To account for the misalignment shift, theelectrode collected current and bias voltage datacorresponding to the larger collected current, i.e.the electrode in the discharge cathode plume, ismirrored and the resulting I-V curve is used forthe fit. Each I-V characteristic is fitted with thetheoretical hyperbolic tangent curve for asymmetric cylindrical double probe, Equation 3,incorporating the Levenberg-Marquardt fitmethod.17,26-28
212tanh AA
TII
eVsat +⋅+˜̃
¯
ˆÁÁË
Ê⋅= f
f (3)
In Equation 3, the parameter A1 accounts forsheath expansion in the ion saturation region
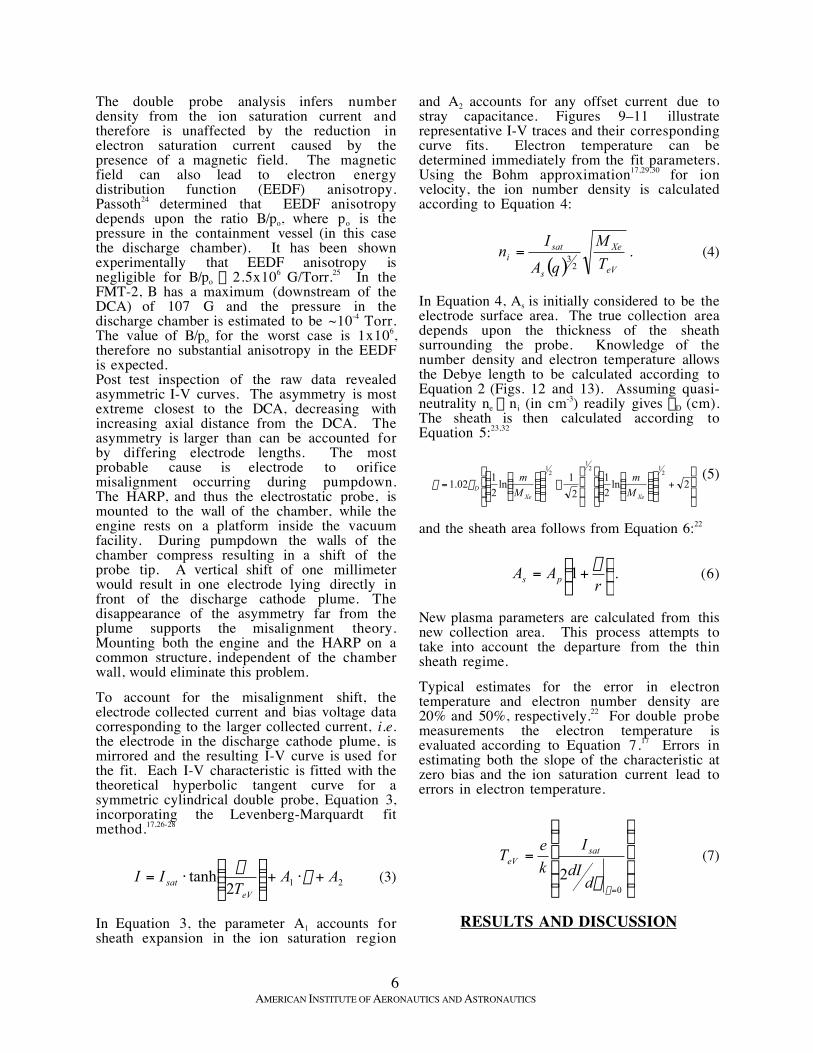
and A2 accounts for any offset current due tostray capacitance. Figures 9–11 illustraterepresentative I-V traces and their correspondingcurve fits. Electron temperature can bedetermined immediately from the fit parameters.Using the Bohm approximation17,29,30 for ionvelocity, the ion number density is calculatedaccording to Equation 4:
( ) eV
Xe
s
sati T
M
qA
In
23
= . (4)
In Equation 4, As is initially considered to be theelectrode surface area. The true collection areadepends upon the thickness of the sheathsurrounding the probe. Knowledge of thenumber density and electron temperature allowsthe Debye length to be calculated according toEquation 2 (Figs. 12 and 13). Assuming quasi-neutrality ne ª ni (in cm-3) readily gives lD (cm).The sheath is then calculated according toEquation 5:23,32
˙˙
˚
˘
ÍÍ
Î
È+˜
˜¯
ˆÁÁË
ʘ̃¯
ˆÁÁË
Ê˙˙
˚
˘
ÍÍ
Î
È-˜
˜¯
ˆÁÁË
ʘ̃¯
ˆÁÁË
Ê= 2ln
2
1
2
1ln
2
102.1
212
1
21
XeXeD M
m
M
mld
(5)
and the sheath area follows from Equation 6:22
˜¯
ˆÁË
Ê +=r
AA ps
d1 . (6)
New plasma parameters are calculated from thisnew collection area. This process attempts totake into account the departure from the thinsheath regime.Typical estimates for the error in electrontemperature and electron number density are20% and 50%, respectively.22 For double probemeasurements the electron temperature isevaluated according to Equation 7.17 Errors inestimating both the slope of the characteristic atzero bias and the ion saturation current lead toerrors in electron temperature.
˜˜˜˜
¯
ˆ
ÁÁÁÁ
Ë
Ê
=
=0
2ffd
dI
I
k
eT sat
eV (7)
RESULTS AND DISCUSSION
7AMERICAN INSTITUTE OF AERONAUTICS AND ASTRONAUTICS
No data taken with beam extraction for TOC 12- corresponding to TH Level 12 - are presentedbecause an incomplete data set was taken.
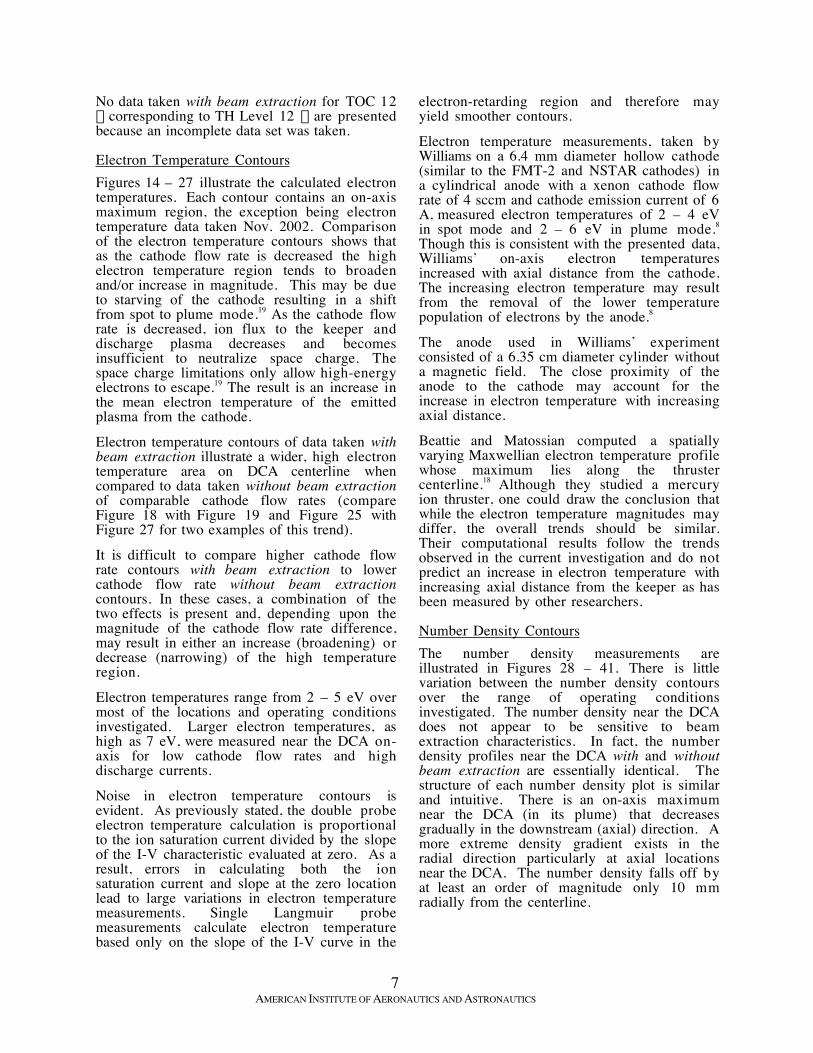
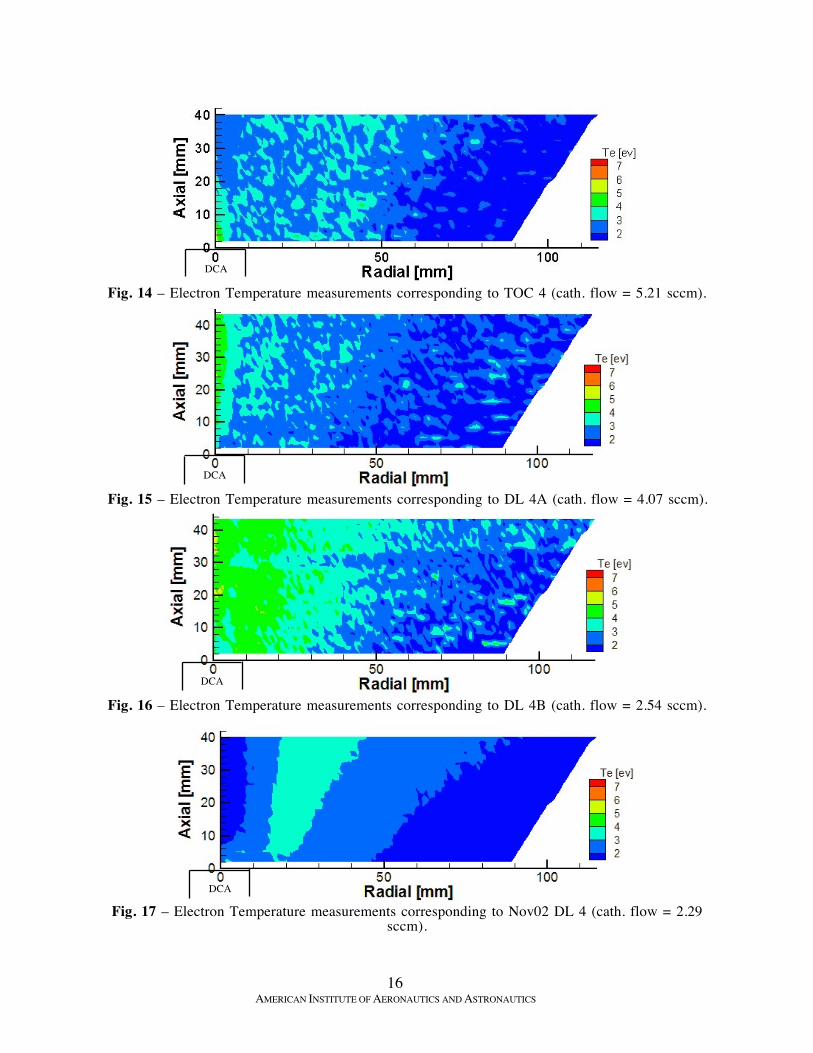
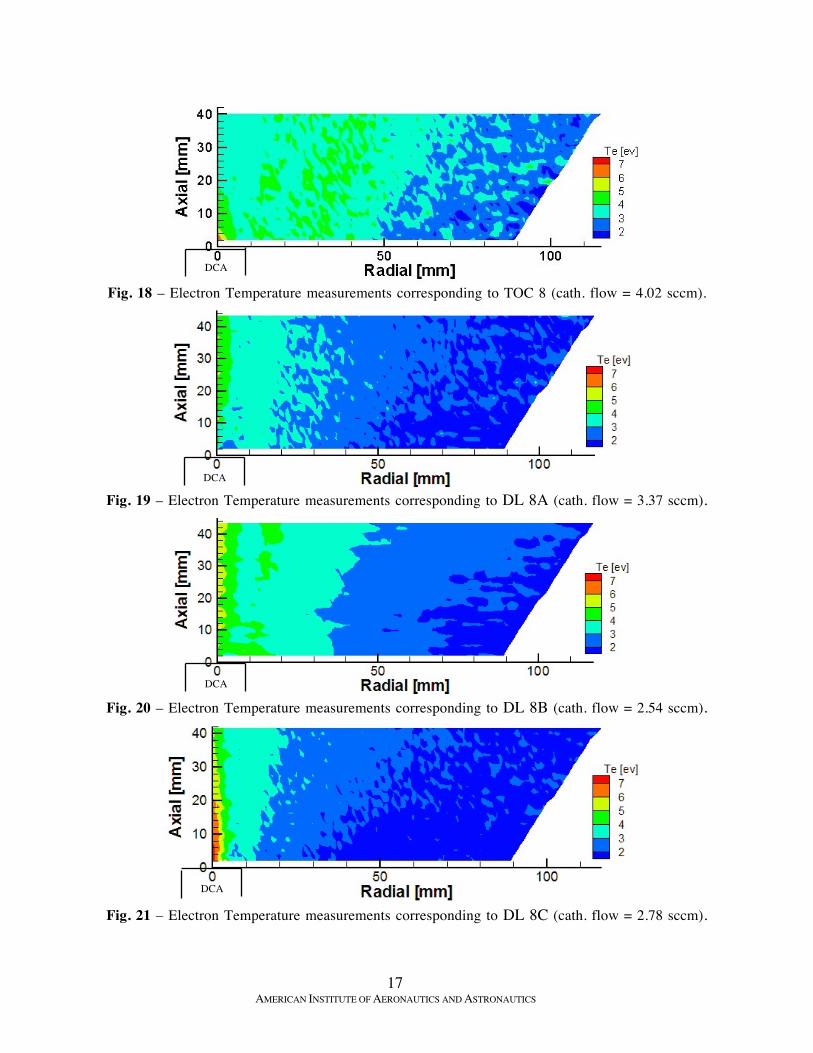
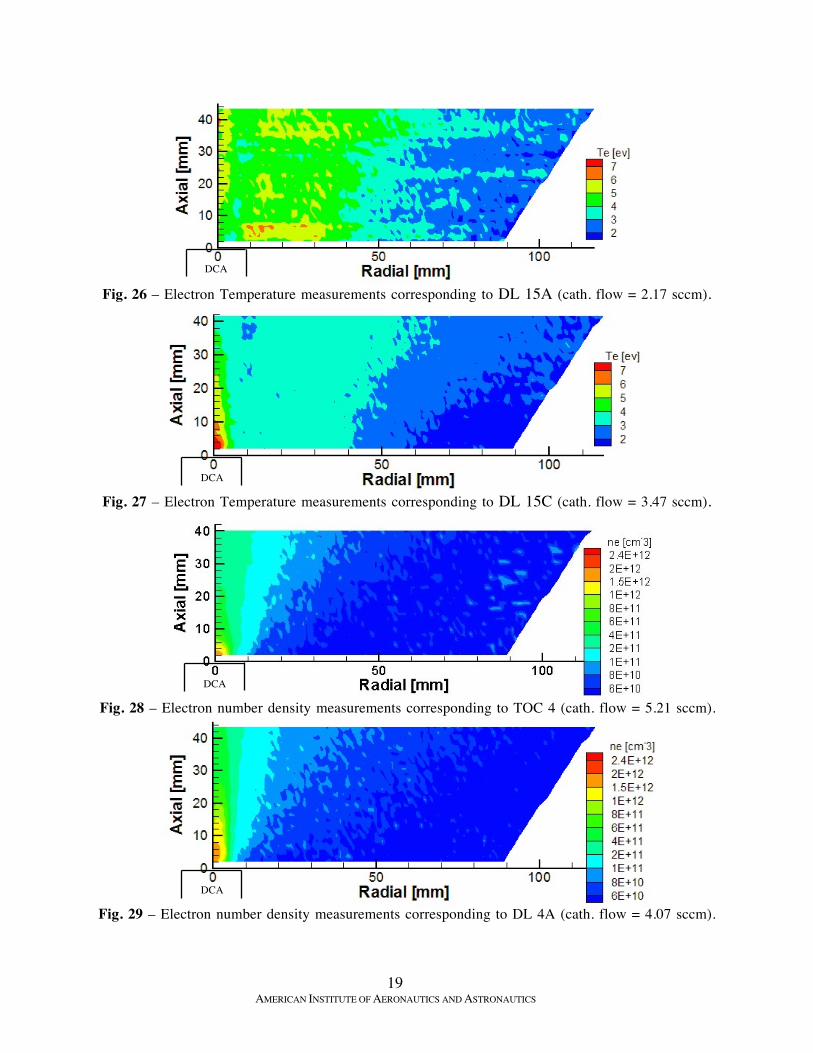
Electron Temperature ContoursFigures 14 – 27 illustrate the calculated electrontemperatures. Each contour contains an on-axismaximum region, the exception being electrontemperature data taken Nov. 2002. Comparisonof the electron temperature contours shows thatas the cathode flow rate is decreased the highelectron temperature region tends to broadenand/or increase in magnitude. This may be dueto starving of the cathode resulting in a shiftfrom spot to plume mode.19 As the cathode flowrate is decreased, ion flux to the keeper anddischarge plasma decreases and becomesinsufficient to neutralize space charge. Thespace charge limitations only allow high-energyelectrons to escape.19 The result is an increase inthe mean electron temperature of the emittedplasma from the cathode.Electron temperature contours of data taken withbeam extraction illustrate a wider, high electrontemperature area on DCA centerline whencompared to data taken without beam extractionof comparable cathode flow rates (compareFigure 18 with Figure 19 and Figure 25 withFigure 27 for two examples of this trend).It is difficult to compare higher cathode flowrate contours with beam extraction to lowercathode flow rate without beam extractioncontours. In these cases, a combination of thetwo effects is present and, depending upon themagnitude of the cathode flow rate difference,may result in either an increase (broadening) ordecrease (narrowing) of the high temperatureregion.Electron temperatures range from 2 – 5 eV overmost of the locations and operating conditionsinvestigated. Larger electron temperatures, ashigh as 7 eV, were measured near the DCA on-axis for low cathode flow rates and highdischarge currents. Noise in electron temperature contours isevident. As previously stated, the double probeelectron temperature calculation is proportionalto the ion saturation current divided by the slopeof the I-V characteristic evaluated at zero. As aresult, errors in calculating both the ionsaturation current and slope at the zero locationlead to large variations in electron temperaturemeasurements. Single Langmuir probemeasurements calculate electron temperaturebased only on the slope of the I-V curve in the
electron-retarding region and therefore mayyield smoother contours.Electron temperature measurements, taken byWilliams on a 6.4 mm diameter hollow cathode(similar to the FMT-2 and NSTAR cathodes) ina cylindrical anode with a xenon cathode flowrate of 4 sccm and cathode emission current of 6A, measured electron temperatures of 2 – 4 eVin spot mode and 2 – 6 eV in plume mode.8
Though this is consistent with the presented data,Williams’ on-axis electron temperaturesincreased with axial distance from the cathode.The increasing electron temperature may resultfrom the removal of the lower temperaturepopulation of electrons by the anode.8 The anode used in Williams’ experimentconsisted of a 6.35 cm diameter cylinder withouta magnetic field. The close proximity of theanode to the cathode may account for theincrease in electron temperature with increasingaxial distance.Beattie and Matossian computed a spatiallyvarying Maxwellian electron temperature profilewhose maximum lies along the thrustercenterline.18 Although they studied a mercuryion thruster, one could draw the conclusion thatwhile the electron temperature magnitudes maydiffer, the overall trends should be similar.Their computational results follow the trendsobserved in the current investigation and do notpredict an increase in electron temperature withincreasing axial distance from the keeper as hasbeen measured by other researchers.
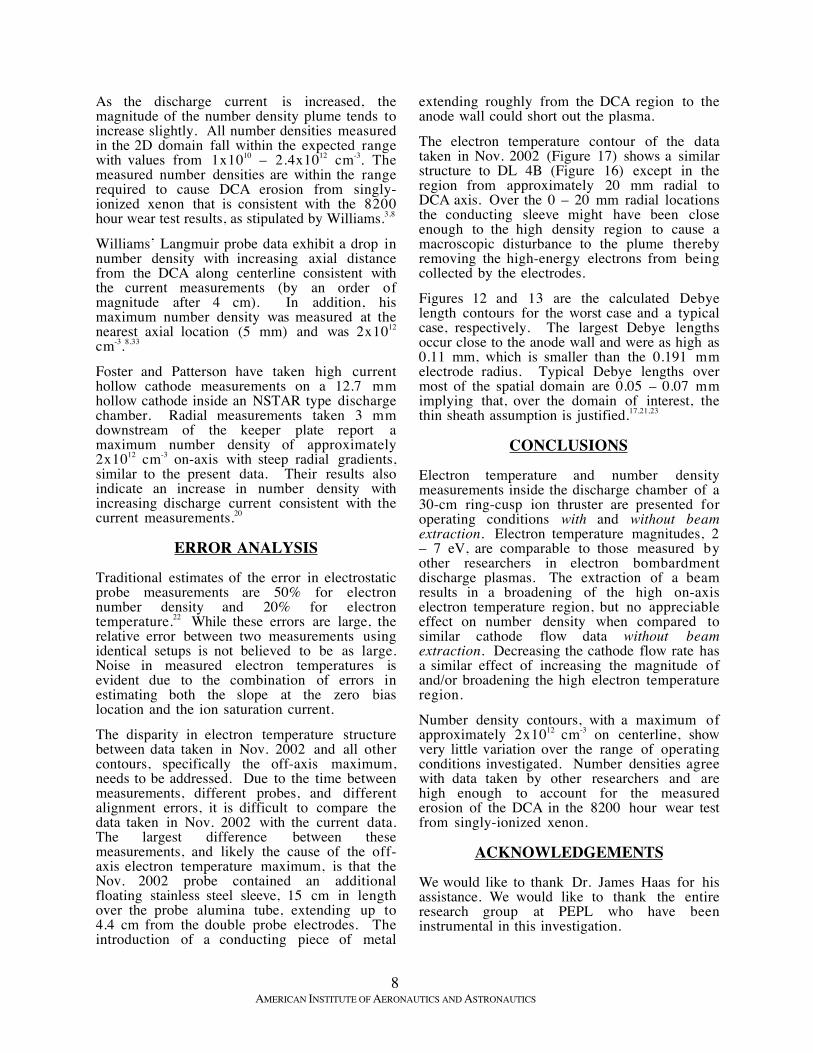
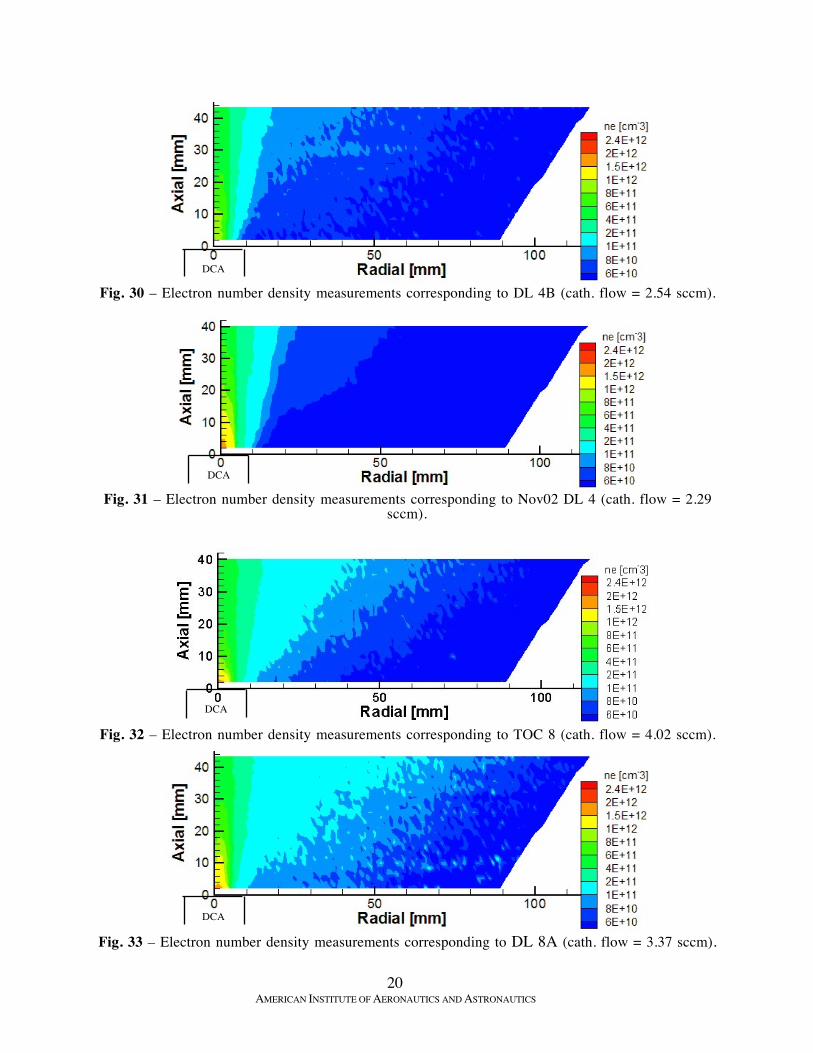
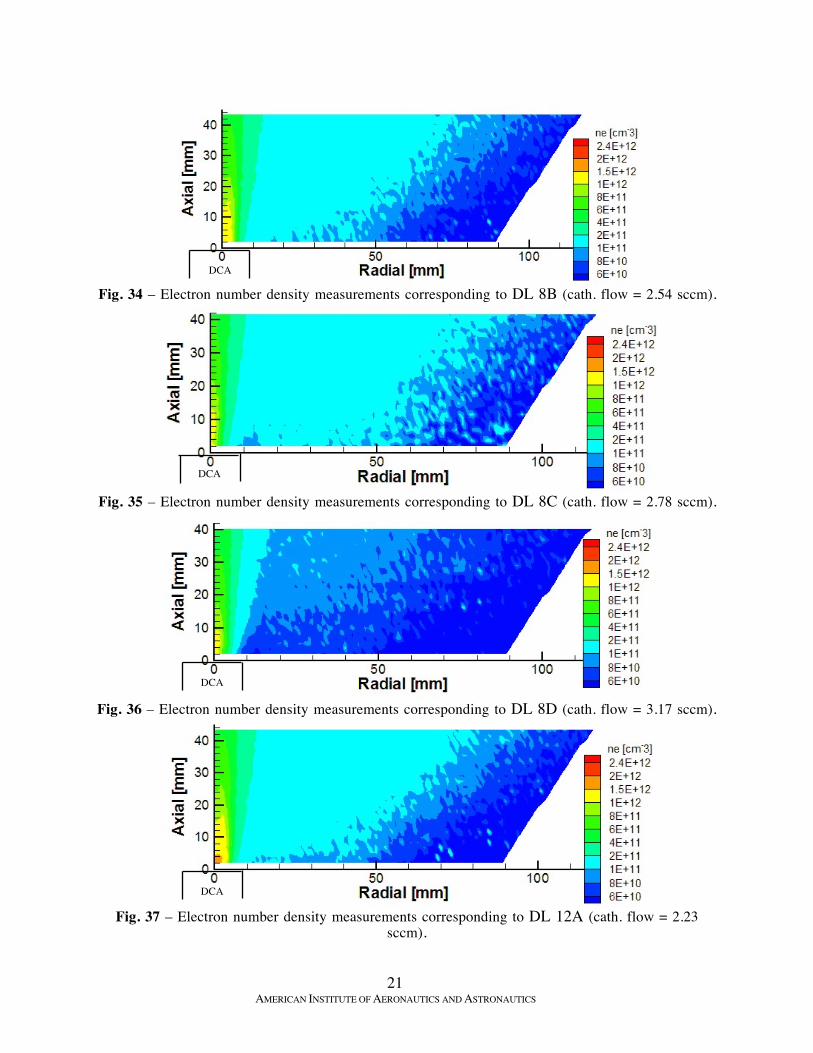
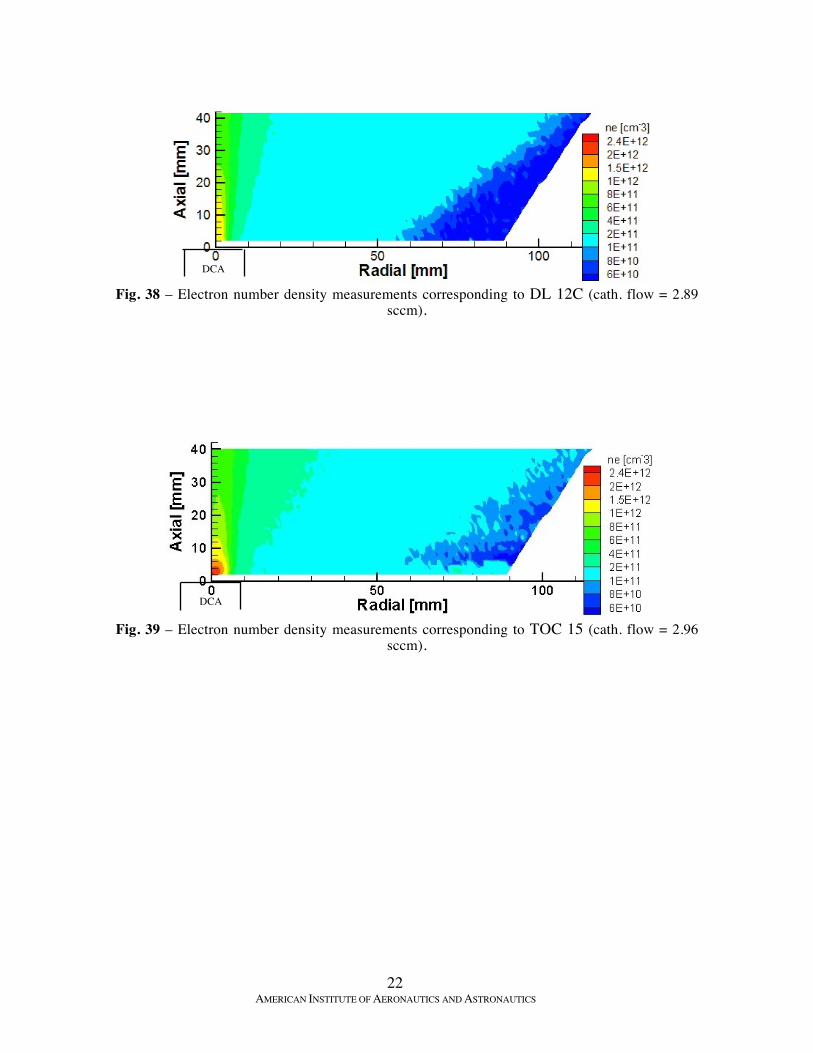
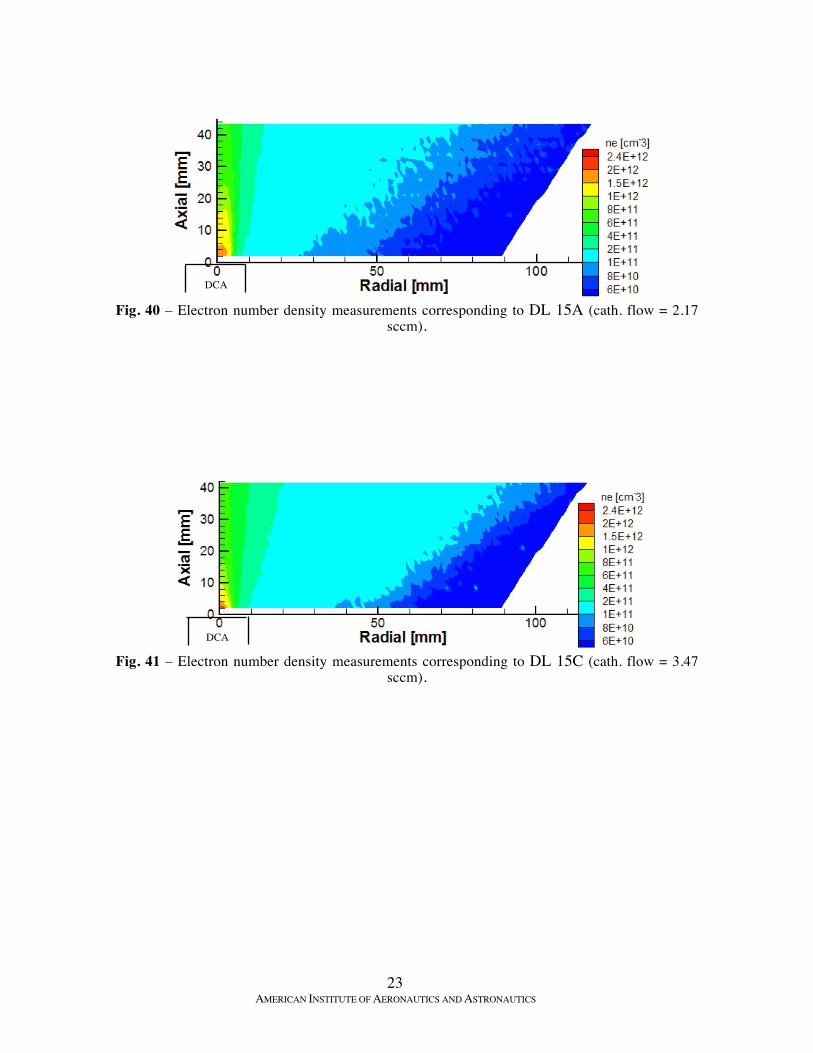
Number Density ContoursThe number density measurements areillustrated in Figures 28 – 41. There is littlevariation between the number density contoursover the range of operating conditionsinvestigated. The number density near the DCAdoes not appear to be sensitive to beamextraction characteristics. In fact, the numberdensity profiles near the DCA with and withoutbeam extraction are essentially identical. Thestructure of each number density plot is similarand intuitive. There is an on-axis maximumnear the DCA (in its plume) that decreasesgradually in the downstream (axial) direction. Amore extreme density gradient exists in theradial direction particularly at axial locationsnear the DCA. The number density falls off byat least an order of magnitude only 10 mmradially from the centerline.
8AMERICAN INSTITUTE OF AERONAUTICS AND ASTRONAUTICS
As the discharge current is increased, themagnitude of the number density plume tends toincrease slightly. All number densities measuredin the 2D domain fall within the expected rangewith values from 1x10¹⁰ – 2.4x1012 cm-3. Themeasured number densities are within the rangerequired to cause DCA erosion from singly-ionized xenon that is consistent with the 8200hour wear test results, as stipulated by Williams.3,8 Williams’ Langmuir probe data exhibit a drop innumber density with increasing axial distancefrom the DCA along centerline consistent withthe current measurements (by an order ofmagnitude after 4 cm). In addition, hismaximum number density was measured at thenearest axial location (5 mm) and was 2x10¹²
cm-3.8,33 Foster and Patterson have taken high currenthollow cathode measurements on a 12.7 mmhollow cathode inside an NSTAR type dischargechamber. Radial measurements taken 3 mmdownstream of the keeper plate report amaximum number density of approximately2x1012 cm-3 on-axis with steep radial gradients,similar to the present data. Their results alsoindicate an increase in number density withincreasing discharge current consistent with thecurrent measurements.20
ERROR ANALYSIS
Traditional estimates of the error in electrostaticprobe measurements are 50% for electronnumber density and 20% for electrontemperature.22 While these errors are large, therelative error between two measurements usingidentical setups is not believed to be as large.Noise in measured electron temperatures isevident due to the combination of errors inestimating both the slope at the zero biaslocation and the ion saturation current.The disparity in electron temperature structurebetween data taken in Nov. 2002 and all othercontours, specifically the off-axis maximum,needs to be addressed. Due to the time betweenmeasurements, different probes, and differentalignment errors, it is difficult to compare thedata taken in Nov. 2002 with the current data.The largest difference between thesemeasurements, and likely the cause of the off-axis electron temperature maximum, is that theNov. 2002 probe contained an additionalfloating stainless steel sleeve, 15 cm in lengthover the probe alumina tube, extending up to4.4 cm from the double probe electrodes. Theintroduction of a conducting piece of metal
extending roughly from the DCA region to theanode wall could short out the plasma. The electron temperature contour of the datataken in Nov. 2002 (Figure 17) shows a similarstructure to DL 4B (Figure 16) except in theregion from approximately 20 mm radial toDCA axis. Over the 0 – 20 mm radial locationsthe conducting sleeve might have been closeenough to the high density region to cause amacroscopic disturbance to the plume therebyremoving the high-energy electrons from beingcollected by the electrodes. Figures 12 and 13 are the calculated Debyelength contours for the worst case and a typicalcase, respectively. The largest Debye lengthsoccur close to the anode wall and were as high as0.11 mm, which is smaller than the 0.191 mmelectrode radius. Typical Debye lengths overmost of the spatial domain are 0.05 – 0.07 mmimplying that, over the domain of interest, thethin sheath assumption is justified.17,21,23
CONCLUSIONS
Electron temperature and number densitymeasurements inside the discharge chamber of a30-cm ring-cusp ion thruster are presented foroperating conditions with and without beamextraction. Electron temperature magnitudes, 2– 7 eV, are comparable to those measured byother researchers in electron bombardmentdischarge plasmas. The extraction of a beamresults in a broadening of the high on-axiselectron temperature region, but no appreciableeffect on number density when compared tosimilar cathode flow data without beamextraction. Decreasing the cathode flow rate hasa similar effect of increasing the magnitude ofand/or broadening the high electron temperatureregion.Number density contours, with a maximum ofapproximately 2x1012 cm-3 on centerline, showvery little variation over the range of operatingconditions investigated. Number densities agreewith data taken by other researchers and arehigh enough to account for the measurederosion of the DCA in the 8200 hour wear testfrom singly-ionized xenon.
ACKNOWLEDGEMENTS
We would like to thank Dr. James Haas for hisassistance. We would like to thank the entireresearch group at PEPL who have beeninstrumental in this investigation.
9AMERICAN INSTITUTE OF AERONAUTICS AND ASTRONAUTICS
We would also like to thank Mr. MichaelPatterson of the NASA Glenn Research Center(GRC) for the financial support of this researchthrough research grant NAG3-2216 and for useof government equipment. We would like toacknowledge Dr. Matthew Domonkos (grantmonitor), Dr. John Foster, and Dr. GeorgeWilliams who have been principal contacts atNASA GRC. Mr. Daniel Herman is supportedthrough a Department of Defense NDSEGfellowship.
REFERENCES
[1] http://solarsystem.nasa.gov/missions/ astmissns/ast-dawn.html
[2] http://nmp.jpl.nasa.gov/ds1/gen/mission.html
[3] Polk, J. E., et al., “An Overview of the Resultsfrom an 8200 Hour Wear Test of the NSTAR IonThruster,” AIAA Paper # 99-2446, 35th AIAA / ASME/ SAE / ASEE Joint Propulsion Conference, LosAngeles, CA, June 1999.[4] Williams, G. J., et al., “Characterization of FMT-2Discharge Cathode Plume,” IEPC Paper #99-104, 26th
International Electric Propulsion Conference,Ketakiushu, Japan, Oct. 1999.[5] Anderson, J. R., et al, “Performance Characteristicsof the NSTAR Ion Thruster During and On-Going LongDuration Ground Test,” IEEE Paper No. 8.0303, IEEEAerospace Conference, Big Sky, MT, Mar. 2000.[6] Domonkos, M. T., Foster, J. E., Patterson, M. J.,“Investigation of Keeper Erosion in the NSTAR IonThruster,” IEPC Paper No. 01-308, 27th InternationalElectric Propulsion Conference, Pasadena, CA, Oct.2001.[7] Sengupta, A., Brophy, J. R., and Goodfellow, K.D., “Wear Characteristic from the Extended Life Test ofthe DS1 Flight Spare Ion Thruster,” 28th InternationalElectric Propulsion Conference, Toulouse, France,March 17-21, 2003.[8] Williams, G. J., The Use of Laser-InducedFluorescence to Characterize Discharge Cathode Erosionin a 30 cm Ring-Cusp Ion Thruster, Ph.D.Dissertation, University of MI, 2000.[9] Kameyama, I., and P. J. Wilbur, “Potential-HillModel of High-Energy Ion Production Near High-Current Hollow Cathodes,” ISTS-98-Aa2-17, 21st
International Symposium on Space Technology andScience, (May, 1998).[10] Hayakawa, et al, “Measurements of ElectronEnergy Distributions in a 14 cm Diameter Ring CuspIon Thruster,” Journal of Propulsion and Power, Vol. 8,pp. 118-126, Jan-Feb, 1992.
[11] Herman, D. A., McFarlane, D. S., and Gallimore,A. D., “Discharge Plasma Parameters of a 30-cm IonThruster Measured without Beam Extraction using aHigh-Speed Probe Positioning System,” IEPC-03-0069, 28th International Electric Propulsion Conference,Toulouse, France, March 17-21, 2003.[12] Walker, M. L. R., Gallimore, A. D., “PressureMap of a Facility as a Function of Flow Rate to StudyFacility Effects,” AIAA-2002-3815, 38th JointPropulsion Conference, Indianapolis, Indiana, July 7-10, 2002.[13] Hofer, R. R., Peterson, P. Y., Gallimore, A. D.,“Characterizing Vacuum Facility Backpressure Effectson the Performance of a Hall Thruster,” IEPC PaperNo. 01-045, 27th International Electric PropulsionConference, Pasadena, CA, Oct. 2001.[14] Dushman, S., Scientific Foundations of VacuumTechnique, Vol. 4, Wiley, N.Y., 1958.[15] Haas, J. W., et al, “Development of a High-Speed,Reciprocating Electrostatic Probe System for HallThruster Interrogation,” Review of ScientificInstruments. Vol. 71, No. 11, pp. 4131-4138, Nov.2000.[16] Haas, J. W., Low-Perturbation Interrogation of theInternal and Near-Field Plasma Structure of a HallThruster using a High-Speed Probe PositioningSystem, Ph.D. Dissertation, University of Michigan,2001.[17] Mott-Smith, H., and Langmuir, I. PhysicsReview, Vol. 28, 727, 1926.[18] Beattie, J. R., and Matossian, J. N., Mercury IonThruster Technology Final Report, NASA CR-174974,Hughes Research Labs. Feb. 1983 – Oct. 1984.[19] Domonkos, M. T., Evaluation of Low-CurrentOrificed Hollow Cathode, Ph.D. Dissertation,University of Michigan, 1999.[20] Foster, J. E., and Patterson, M. J., “PlasmaEmission Characteristics from a High Current HollowCathode in an Ion Thruster Discharge Chamber,” AIAA-2002-4102, 38th Joint Propulsion Conference,Indianapolis, Indiana, July 7-10, 2002.[21] Hershkowitz, N., “How Langmuir Probes Work,”Plasma Diagnostics. Nuclear Engineering andEngineering Physics Department, Univ. of Wisconsin-Madison, 1989.[22] Hutchinson, I. H., Principles of PlasmaDiagnostics, Cambridge University Press, New York,N.Y., 1987.[23] Schott, L. Plasma Diagnostics: Ch. 11 ElectricalProbes, American Elsevier Publishing Co, New York,N.Y., 1968.

10AMERICAN INSTITUTE OF AERONAUTICS AND ASTRONAUTICS
[24] Passoth, E., et al, “An experimental study ofplasma density determination by a cylindrical Langmuirprobe at different pressures and magnetic fields in acylindrical magnetron discharge in heavy rare gases,”Journal of Physics D., Vol. 30, No. 12, June 1997, p.1763-77.[25] Aikawa, H., “The Measurement of the Anisotropyof Electron Distribution Function of a MagnetizedPlasma,” Journal of the Physical Society of Japan, Vol.40, No. 6, June 1976.[26] Johnson, E. O., and Malter, L., “A FloatingDouble Probe Method for Measurements in GasDischarges,” Physics Review, Vol. 80, No. 1, pp. 58 -68, Oct., 1950.[27] Boedo, et al, “Fast Scanning Probe for TokamakPlasmas,” Review of Scientific Instruments, Vol.69,#7,pp. 2663-70, July, 1998.[28] Smith, B. A, and Overzet, L., J., “Improvementsto the Floating Double Probe for Time-resolvedMeasurements in Pulsed RF Plasmas,” Review ofScientific Instruments, Vol. 69, No. 3, pp. 1372 –1377, March, 1998.[29] Chen, F.F. Introduction to Plasma Physics andControlled Fusion: Vol. 1 Plasma Physics, PlenumPress, New York, N.Y., 1984.[30] Chen, F. F., Plasma Diagnostic Techniques: Ch. 4Electric Probes, Academic Press, New York, N.Y.,1965.[31] NRL Plasma Formulary, NRL/PU/6790--00-426,Naval Research Laboratory, Washington, D.C., 2000.[32] Ruzic, D. D., Electric Probes for LowTemperature Plasmas, American Vacuum SocietyEducational Committee, New York, N.Y., 1994.[33] Williams, G. J., et al., “Near-Field Investigation ofIons Emitted from a Hollow Cathode AssemblyOperating at Low-Power,” AIAA-98-3658, 34th JointPropulsion conference, July, 1998.
11AMERICAN INSTITUTE OF AERONAUTICS AND ASTRONAUTICS
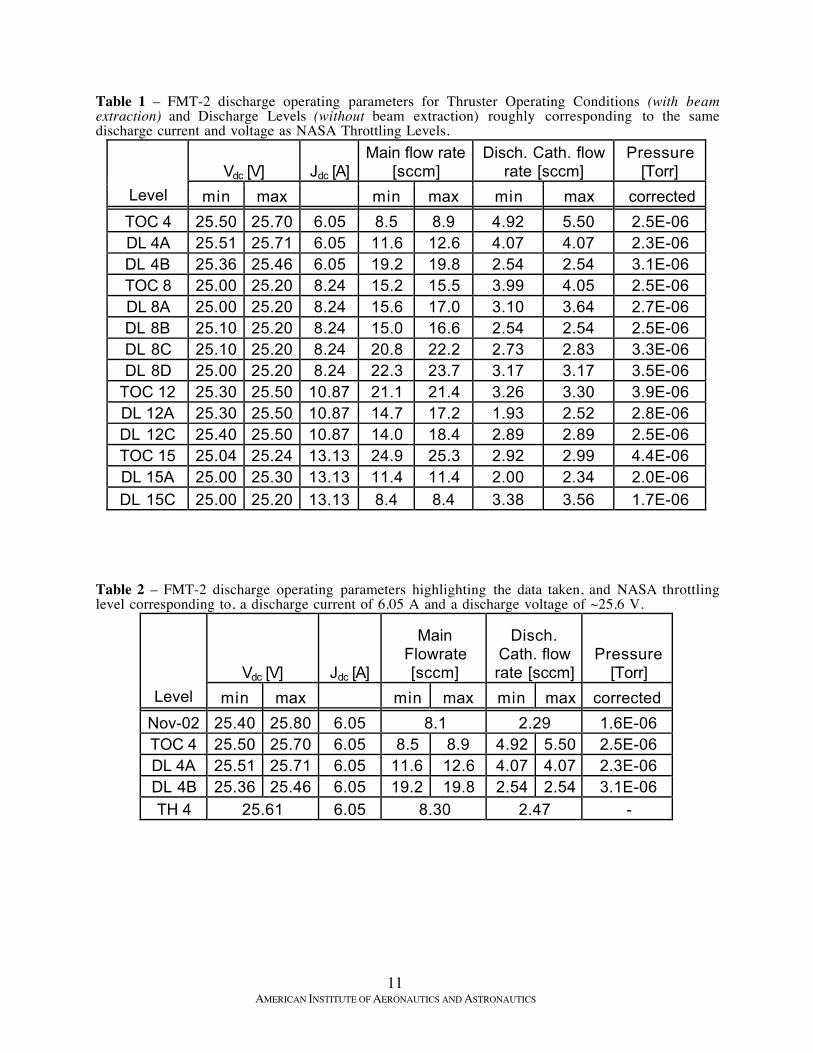
Table 1 – FMT-2 discharge operating parameters for Thruster Operating Conditions (with beamextraction) and Discharge Levels (without beam extraction) roughly corresponding to the samedischarge current and voltage as NASA Throttling Levels.
Vdc [V] Jdc [A]Main flow rate
[sccm]Disch. Cath. flow
rate [sccm]Pressure
[Torr]
Level min max min max min max corrected
TOC 4 25.50 25.70 6.05 8.5 8.9 4.92 5.50 2.5E-06DL 4A 25.51 25.71 6.05 11.6 12.6 4.07 4.07 2.3E-06DL 4B 25.36 25.46 6.05 19.2 19.8 2.54 2.54 3.1E-06TOC 8 25.00 25.20 8.24 15.2 15.5 3.99 4.05 2.5E-06DL 8A 25.00 25.20 8.24 15.6 17.0 3.10 3.64 2.7E-06DL 8B 25.10 25.20 8.24 15.0 16.6 2.54 2.54 2.5E-06DL 8C 25.10 25.20 8.24 20.8 22.2 2.73 2.83 3.3E-06DL 8D 25.00 25.20 8.24 22.3 23.7 3.17 3.17 3.5E-06
TOC 12 25.30 25.50 10.87 21.1 21.4 3.26 3.30 3.9E-06DL 12A 25.30 25.50 10.87 14.7 17.2 1.93 2.52 2.8E-06DL 12C 25.40 25.50 10.87 14.0 18.4 2.89 2.89 2.5E-06TOC 15 25.04 25.24 13.13 24.9 25.3 2.92 2.99 4.4E-06DL 15A 25.00 25.30 13.13 11.4 11.4 2.00 2.34 2.0E-06
DL 15C 25.00 25.20 13.13 8.4 8.4 3.38 3.56 1.7E-06
Table 2 – FMT-2 discharge operating parameters highlighting the data taken, and NASA throttlinglevel corresponding to, a discharge current of 6.05 A and a discharge voltage of ~25.6 V.
Vdc [V] Jdc [A]
MainFlowrate[sccm]
Disch.Cath. flowrate [sccm]
Pressure[Torr]
Level min max min max min max corrected
Nov-02 25.40 25.80 6.05 8.1 2.29 1.6E-06TOC 4 25.50 25.70 6.05 8.5 8.9 4.92 5.50 2.5E-06DL 4A 25.51 25.71 6.05 11.6 12.6 4.07 4.07 2.3E-06DL 4B 25.36 25.46 6.05 19.2 19.8 2.54 2.54 3.1E-06
TH 4 25.61 6.05 8.30 2.47 -
12AMERICAN INSTITUTE OF AERONAUTICS AND ASTRONAUTICS
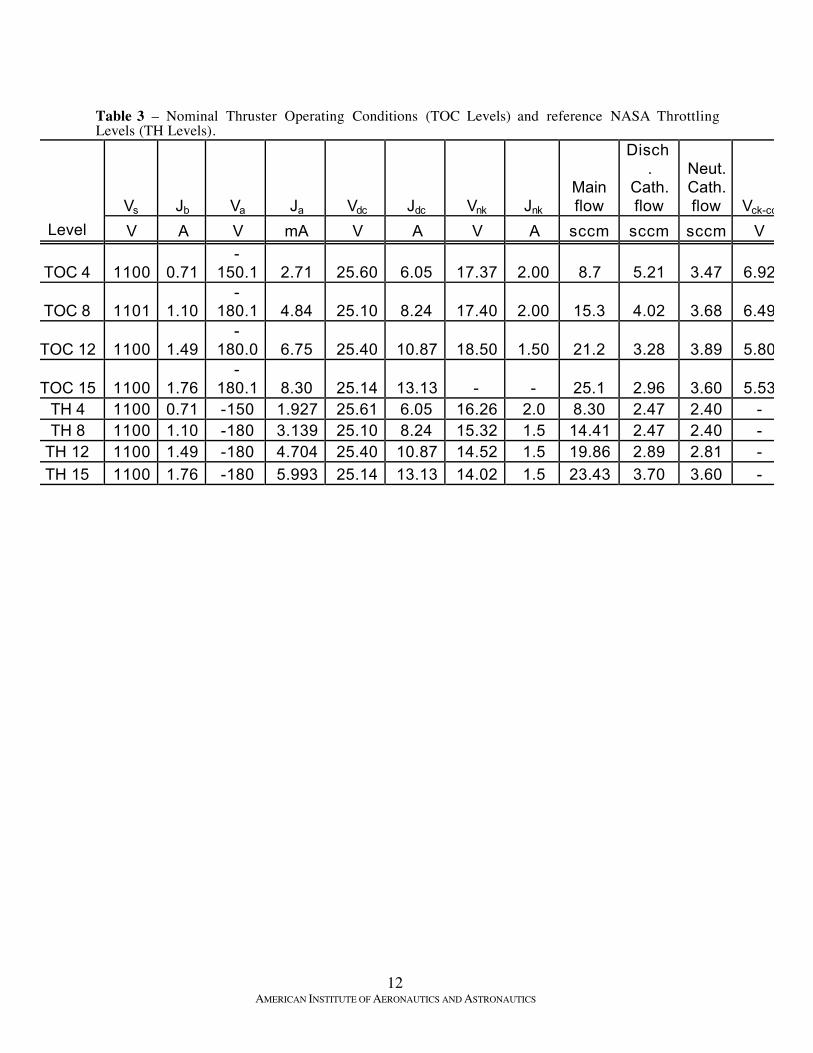
Table 3 – Nominal Thruster Operating Conditions (TOC Levels) and reference NASA ThrottlingLevels (TH Levels).
Vs Jb Va Ja Vdc Jdc Vnk Jnk
Mainflow
Disch.
Cath.flow
Neut.Cath.flow Vck-cc
Level V A V mA V A V A sccm sccm sccm V
TOC 4 1100 0.71-
150.1 2.71 25.60 6.05 17.37 2.00 8.7 5.21 3.47 6.92
TOC 8 1101 1.10-
180.1 4.84 25.10 8.24 17.40 2.00 15.3 4.02 3.68 6.49
TOC 12 1100 1.49-
180.0 6.75 25.40 10.87 18.50 1.50 21.2 3.28 3.89 5.80
TOC 15 1100 1.76-
180.1 8.30 25.14 13.13 - - 25.1 2.96 3.60 5.53TH 4 1100 0.71 -150 1.927 25.61 6.05 16.26 2.0 8.30 2.47 2.40 -TH 8 1100 1.10 -180 3.139 25.10 8.24 15.32 1.5 14.41 2.47 2.40 -
TH 12 1100 1.49 -180 4.704 25.40 10.87 14.52 1.5 19.86 2.89 2.81 -
TH 15 1100 1.76 -180 5.993 25.14 13.13 14.02 1.5 23.43 3.70 3.60 -
13AMERICAN INSTITUTE OF AERONAUTICS AND ASTRONAUTICS
Fig. 1 – Side LIF slots and window mountswith windows removed.
Fig. 3 – Horizontal cross section of thedischarge plasma containment mechanism(DPCM).
Fig. 5 – Reduced blockage double probe tipdesign.
Fig. 2 – FMT-2 orientation w.r.t the HARP forprobe insertion, (0, 0) location is 2 mm fromthe DCA on discharge cathode centerline.
Fig. 4 – Side view schematic of the DPCMhardware covering the anode side slot.
Fig. 6 – Double probe circuit electricaldiagram.
+-
+
-
+
-+
-
10 kW
5 kW
500 W
AD210
BatterySupply
DischargePlasma
49 kW
1 kW
AD210Probe biasvoltage
Probecollectedcurrent
Existing anode slotExisting bolts
Stainless guidingtracks
Plasma containment sheet:(38-gauge stainless steel)Translating tube access hole
4 slotted stainlesssheets
6.35 mm Dia alumina
1.57 mmDia alumina
0.381 mmDia Tungsten
25.4 mm
19 mm
4 mm
3 mm
Extendedplasma shieldcover
Plasmashield
Guiding tracks
Plasmacontainmentsheets
Existing bolts
Alumina tubing
Tungsten wire (doubleprobe only showing topelectrode)
TranslatingAlumina tube
Anode
DCA
Macor slab
DCA and thruster centerline
r
z
NEAT TranslatingTable
Reciprocating Probe
FMT-2 moves inaxial direction
Translating tube
Accel grid
Screen gridDCA
Doubleprobe
TranslatingTable
Probe armmount movesin radialdirection
r
z
Plasma ShieldPlasma shield slotDCAAnode slot
HARP tablefixed
position
14AMERICAN INSTITUTE OF AERONAUTICS AND ASTRONAUTICS
a) b)
c) d)
e) f)Fig. 7 – Photographs taken inside the discharge chamber prior to engine testing showing the interiorof the Discharge Plasma Containment Mechanism (DPCM). Also shown are the double probe and itsinsertion (a) – (f) at the closest axial location to the Discharge Cathode Assembly (DCA):approximately 2 mm downstream of the DCA.
15AMERICAN INSTITUTE OF AERONAUTICS AND ASTRONAUTICS
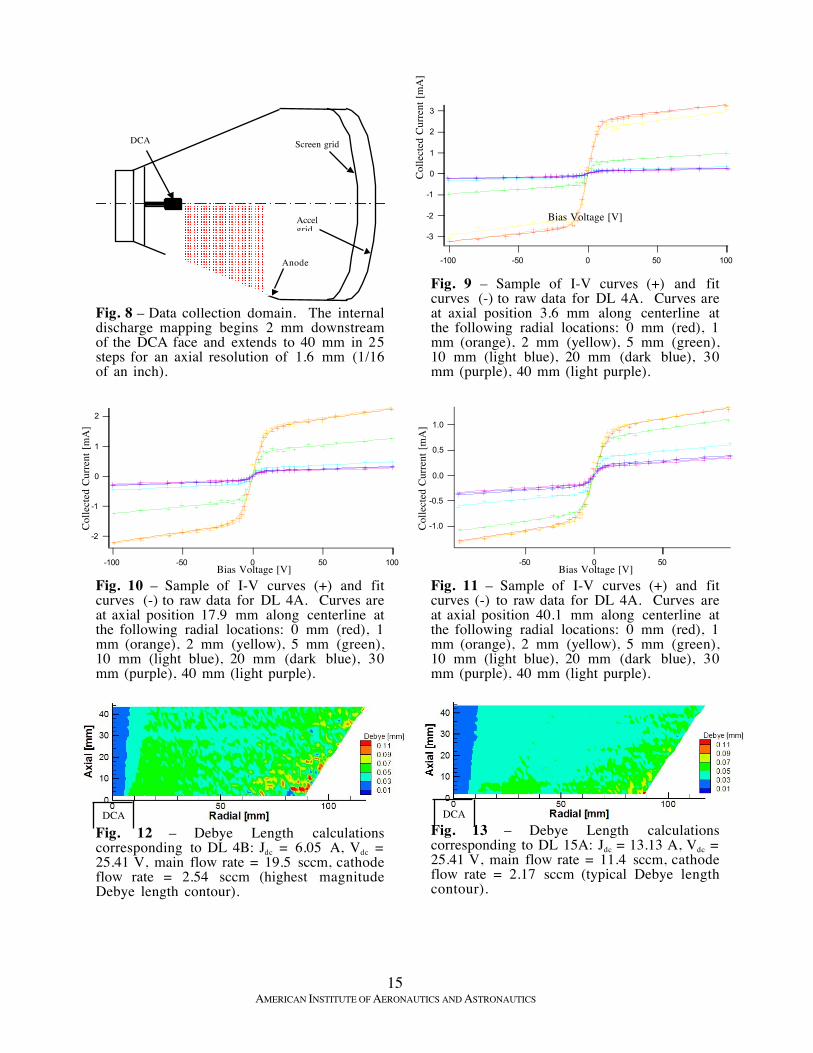
Fig. 8 – Data collection domain. The internaldischarge mapping begins 2 mm downstreamof the DCA face and extends to 40 mm in 25steps for an axial resolution of 1.6 mm (1/16of an inch).
2
1
0
-1
-2
-100 -50 0 50 100
Fig. 10 – Sample of I-V curves (+) and fitcurves (-) to raw data for DL 4A. Curves areat axial position 17.9 mm along centerline atthe following radial locations: 0 mm (red), 1mm (orange), 2 mm (yellow), 5 mm (green),10 mm (light blue), 20 mm (dark blue), 30mm (purple), 40 mm (light purple).
Fig. 12 – Debye Length calculationscorresponding to DL 4B: Jdc = 6.05 A, Vdc =25.41 V, main flow rate = 19.5 sccm, cathodeflow rate = 2.54 sccm (highest magnitudeDebye length contour).
3
2
1
0
-1
-2
-3
-100 -50 0 50 100
Fig. 9 – Sample of I-V curves (+) and fitcurves (-) to raw data for DL 4A. Curves areat axial position 3.6 mm along centerline atthe following radial locations: 0 mm (red), 1mm (orange), 2 mm (yellow), 5 mm (green),10 mm (light blue), 20 mm (dark blue), 30mm (purple), 40 mm (light purple).
1.0
0.5
0.0
-0.5
-1.0
-50 0 50
Fig. 11 – Sample of I-V curves (+) and fitcurves (-) to raw data for DL 4A. Curves areat axial position 40.1 mm along centerline atthe following radial locations: 0 mm (red), 1mm (orange), 2 mm (yellow), 5 mm (green),10 mm (light blue), 20 mm (dark blue), 30mm (purple), 40 mm (light purple).
Fig. 13 – Debye Length calculationscorresponding to DL 15A: Jdc = 13.13 A, Vdc =25.41 V, main flow rate = 11.4 sccm, cathodeflow rate = 2.17 sccm (typical Debye lengthcontour).
Accelgrid
DCA Screen grid
Anode
DCA DCA
Bias Voltage [V]
Colle
cted
Cur
rent
[mA
]
Bias Voltage [V]Bias Voltage [V]
Colle
cted
Cur
rent
[mA
]
Colle
cted
Cur
rent
[mA
]
16AMERICAN INSTITUTE OF AERONAUTICS AND ASTRONAUTICS
Fig. 14 – Electron Temperature measurements corresponding to TOC 4 (cath. flow = 5.21 sccm).
Fig. 15 – Electron Temperature measurements corresponding to DL 4A (cath. flow = 4.07 sccm).
Fig. 16 – Electron Temperature measurements corresponding to DL 4B (cath. flow = 2.54 sccm).
Fig. 17 – Electron Temperature measurements corresponding to Nov02 DL 4 (cath. flow = 2.29sccm).
DCA
DCA
DCA
DCA
17AMERICAN INSTITUTE OF AERONAUTICS AND ASTRONAUTICS
Fig. 18 – Electron Temperature measurements corresponding to TOC 8 (cath. flow = 4.02 sccm).
Fig. 19 – Electron Temperature measurements corresponding to DL 8A (cath. flow = 3.37 sccm).
Fig. 20 – Electron Temperature measurements corresponding to DL 8B (cath. flow = 2.54 sccm).
Fig. 21 – Electron Temperature measurements corresponding to DL 8C (cath. flow = 2.78 sccm).
DCA
DCA
DCA
DCA

18AMERICAN INSTITUTE OF AERONAUTICS AND ASTRONAUTICS
Fig. 22 – Electron Temperature measurements corresponding to DL 8D (cath. flow = 3.17 sccm).
Fig. 23 – Electron Temperature measurements corresponding to DL 12A (cath. flow = 2.23 sccm).
Fig. 24 – Electron Temperature measurements corresponding to DL 12C (cath. flow = 2.89 sccm).
Fig. 25 – Electron Temperature measurements corresponding to TOC 15 (cath. flow = 2.96 sccm).
DCA
DCA
DCA
DCA
19AMERICAN INSTITUTE OF AERONAUTICS AND ASTRONAUTICS
Fig. 26 – Electron Temperature measurements corresponding to DL 15A (cath. flow = 2.17 sccm).
Fig. 27 – Electron Temperature measurements corresponding to DL 15C (cath. flow = 3.47 sccm).
Fig. 28 – Electron number density measurements corresponding to TOC 4 (cath. flow = 5.21 sccm).
Fig. 29 – Electron number density measurements corresponding to DL 4A (cath. flow = 4.07 sccm).
DCA
DCA
DCA
DCA
20AMERICAN INSTITUTE OF AERONAUTICS AND ASTRONAUTICS
Fig. 30 – Electron number density measurements corresponding to DL 4B (cath. flow = 2.54 sccm).
Fig. 31 – Electron number density measurements corresponding to Nov02 DL 4 (cath. flow = 2.29sccm).
Fig. 32 – Electron number density measurements corresponding to TOC 8 (cath. flow = 4.02 sccm).
Fig. 33 – Electron number density measurements corresponding to DL 8A (cath. flow = 3.37 sccm).DCA
DCA
DCA
DCA
21AMERICAN INSTITUTE OF AERONAUTICS AND ASTRONAUTICS
Fig. 34 – Electron number density measurements corresponding to DL 8B (cath. flow = 2.54 sccm).
Fig. 35 – Electron number density measurements corresponding to DL 8C (cath. flow = 2.78 sccm).
Fig. 36 – Electron number density measurements corresponding to DL 8D (cath. flow = 3.17 sccm).
Fig. 37 – Electron number density measurements corresponding to DL 12A (cath. flow = 2.23sccm).
DCA
DCA
DCA
DCA
22AMERICAN INSTITUTE OF AERONAUTICS AND ASTRONAUTICS
Fig. 38 – Electron number density measurements corresponding to DL 12C (cath. flow = 2.89sccm).
Fig. 39 – Electron number density measurements corresponding to TOC 15 (cath. flow = 2.96sccm).
DCA
DCA
23AMERICAN INSTITUTE OF AERONAUTICS AND ASTRONAUTICS
Fig. 40 – Electron number density measurements corresponding to DL 15A (cath. flow = 2.17sccm).
Fig. 41 – Electron number density measurements corresponding to DL 15C (cath. flow = 3.47sccm).
DCA
DCA