Embed Size (px)
Citation preview

University of Montana University of Montana
ScholarWorks at University of Montana ScholarWorks at University of Montana
Graduate Student Theses, Dissertations, & Professional Papers Graduate School
1987
Comparison of estimated and actual data concerning time Comparison of estimated and actual data concerning time
allocation and caseloads of public school speech/language allocation and caseloads of public school speech/language
clinicians clinicians
Emilie M. Brown The University of Montana
Follow this and additional works at: https://scholarworks.umt.edu/etd
Let us know how access to this document benefits you.
Recommended Citation Recommended Citation Brown, Emilie M., "Comparison of estimated and actual data concerning time allocation and caseloads of public school speech/language clinicians" (1987). Graduate Student Theses, Dissertations, & Professional Papers. 7223. https://scholarworks.umt.edu/etd/7223
This Thesis is brought to you for free and open access by the Graduate School at ScholarWorks at University of Montana. It has been accepted for inclusion in Graduate Student Theses, Dissertations, & Professional Papers by an authorized administrator of ScholarWorks at University of Montana. For more information, please contact [email protected].

• COPYRIGHT ACT OF 1976
Th i s i s an u n p u b l i s h e d m a n u s c r ip t in which c o p y r ig h t
SUBSISTS. Any further r e p r i n t i n g of i t s contents must BE
APPROVED BY THE. AUTHOR.
MANSFIELD L ib r a r y
Un i v e r s i t y of Montana
Date ; 198 7
Reproduced with permission of the copyright owner. Further reproduction prohibited without permission.

Reproduced with permission of the copyright owner. Further reproduction prohibited without permission.

COMPARISON OF ESTIMATED AND ACTUAL DATA
CONCERNING TIME ALLOCATION AND
CASELOADS OF PUBLIC SCHOOL SPEECH/LANGUAGE CLINICIANS
By
Emilie M. Brown
B.A., University of Montana, 1978
Presented in the partial fulfillment of the requirements
for the degree of
Master of A rts
University of Montana
1987
Approved by:
- Chairman, Board of Examiners
D ^ n , Graduate ISch^l
X / â . S
Reproduced with permission of the copyright owner. Further reproduction prohibited without permission.

UMI Number: EP38024
All rights reserved
INFORMATION TO ALL USERS The quality of this reproduction is dependent upon the quality of the copy submitted.
In the unlikely event that the author did not send a complete manuscript and there are missing pages, these will be noted. Also, if material had to be removed,
a note will indicate the deletion.
UMTDisMfMlion PkMisNng
UMI EP38024Published by ProQuest LLC (2013). Copyright in the Dissertation held by the Author.
Microform Edition © ProQuest LLC.All rights reserved. This work is protected against
unauthorized copying under Title 17, United States Code
uestProQuest LLC.
789 East Eisenhower Parkway P.O. Box 1346
Ann Arbor, Ml 48106 -1346
Reproduced with permission of the copyright owner. Further reproduction prohibited without permission.

Brown, Emilie M., M.A., 1987 Communication Sciences and Disorders
Comparision of Estimated and Actual Data Concerning Time Allocation andCaseloads of Public School^eech/Language Ctincians
Director: Dr. Barbara
The purposes of the present study were: 1) to develop methods to identify and describe the present responsibilities and activities of the school speech and language clinician, 2) to survey the clinicians and administrators involved and 3) to report these findings. 235 administrative personnel and 181 school speech/language clinicians were sampled for information concerning clinician responsibilities and activities, using a questionnaire. A supplemental telephone sampling, to increase the number of administrative responses was necessary. A time analysis log was recorded by 30 clinicians, 10 each from low, medium and high population districts. This provided actual time expenditure information to compare to the clinician's and administrator's estimates from the questionnaire. The results of the study demonstrated a need for collecting and sharing of information between speech/language clinicians and OPI personnel, school administrators and legislators. A classification system and time analysis procedure were found to be effective. Data should continue to be collected, using these two tools, and should be distributed to speech/language clinicians and to those persons making decisions affecting speech/language services in the public schools. Better description of clinicians' responsibilities and caseloads should result for the different size population districts in Montana. State-wide centralized documentation by district of special education records, including speech/language, should occur and be monitored by the state during the special education auditing procedure. Future research topics should include evaluating the present study for reliability and validity.
Reproduced with permission of the copyright owner. Further reproduction prohibited without permission.

Table of Contents
Acknowledgements v1. INTRODUCTION 1
1.1. HISTORY OF SPECIAL EDUCATION PROVISION SYSTEM IN MONTANA 21.2. DESCRIPTION OF CURRENT DATA COLLECTION SYSTEM 51.3. HISTORY OF SPEECH/LANGUAGE PROVISION IN PUBLIC SCHOOLS 8
NATIONWIDE2. METHOD 14
2.1. Part 1 - Questionnaire 152.1.1. Development 152.1-2. Respondents 162.1.3. Analysis 18
2.2. Part 2 - Time Analysis 182.2.1. Development of Time Analyses 182.2.2. Subjects 192.2.3. Procedure 202.2.4. Measurement 21
3. RESULTS AND DISCUSSION 223.1. The Questionnaire 243.2. Comparative Descriptive Results 263.3. Time Analysis 553.4. Analysis by Population Difference 573.5. Analysis by Seasonal Variations 573.6. Comparison of Time Analysis to Clinicians and Collapsed 58
Administration Questionnaire Responses4. CONCLUSIQNS AND IMPLICATIONS 60
4.1. Efficient Caseload Descriptors 604.2. Time Allocation 624.3. Assessment of Procedures and Results Obtained 644.4. Implications 674.5. Resulting Topics for Future Research 714.6. Conclusion 72
Appendix A. Questionnaire 73
III
Reproduced with permission of the copyright owner. Further reproduction prohibited without permission.

Appendix B. Time Analysis Forms 79Appendix C. Range of Scores from Questionnaire for Administrators & 81
CliniciansAppendix D. Clinician Time Analysis Results 86Appendix E. Comparision of Clinician's Actual Time Expenditure to Clinicians 94
Questionnaire Estimate and Adminstration and Phone Sample Estimates REFERENCES 95
IV
Reproduced with permission of the copyright owner. Further reproduction prohibited without permission.

Acknowledgements
I wish to thank Dr. Mike Jakupcak and Dr. Charles Parker for their time and
thoughts. My special appreciation goes to Dr. Barbara Bain, thesis chair, for the
great amount of time, thoughtful direction and guidance she supplied.
Many thanks to the 30 clinicians for their time and efforts in the time
analysis as well as the clinicians and administrators who responded to the
questionnaire.
I want to thank the consultants and professors at the University of Montana
Computer Center for help while entering and printing this project.
Many thanks to Kelly Koch, Lenora Pelson and Christine Gresham whose
babysitting help allowed this project's completion.
I wish to thank my sisters, brothers and parents for their love and support.
Thanks also to my parents for the lesson that I must finish tasks that I begin.
Finally, my deep appreciation to my husband, Mark, and children, Tera and Carson
for their patience, love and support.
Reproduced with permission of the copyright owner. Further reproduction prohibited without permission.

Chapter 1
INTRODUCTION
The professional demands on the speech/language clinician in the public
school systems have changed greatly in the last several years. Included among
these changes are the types and severity of communication problems seen in the
public school caseloads, the different roles that the clinician must perform, and the
various settings, equipment and accompanying knowledge that the clinician must
be able to utilize The changes have occurred for legal as well as philosophical
and scientific reasons. Legal decisions have impacted and changed the student
make-up of the public schools, and therefore the composition of special education
caseloads. Changes also have occurred within the speech and language profession
with regard to research and training interest and expansion into various content
areas. With these changes from both inside and outside of our profession, the
allocation of work time and the demands on the clinician have been altered.
Devising a method of identifying and describing the present responsibilities and
activities of the school speech and language clinician and a format to effectively
report these findings are therefore critical in making the on-going informed
decisions required by clinicians, local administrators, and state and local special
education administrators. The purposes of this study are to 1) develop a method
to meet these needs, 2) survey the clinicians and others involved, and 3) report
these findings.
1
Reproduced with permission of the copyright owner. Further reproduction prohibited without permission.
This chapter will discuss the development of the special education provision
system, on both state and national levels. Speech and language therapy in the
schools is administrated by the special education system within the government.
Then, a description of the current provision and record-keeping system will follow,
and finally, the current provision system will be analyzed for its efficiency and
usefulness to persons involved
1.1. HISTORY OF SPECIAL EDUCATION PROVISION SYSTEM IN
MONTANA
The legislative history of the funding of special education in Montana began
in 1945, with the 29th Legislative Assembly A resolution recommended that the
governor appoint a committee to investigate the crisis in public school funding.
The 31st Legislative Assembly in 1949 passed the Foundation Program Act, the
program that funds public education in Montana.
Direct financing of special education programs in the public schools of
Montana began in 1953 when the 33rd Legislative Assembly directed cerebral
palsied children in special classes be included in the school funding. Educable
Mentally Handicapped and Custodial (Trainable) Mentally Handicapped in the public
schools were included in funding in 1955 and were given more funding per student
than the regular education student. In 1961, the 37th Legislative Assembly made
special classes mandatory in the public schools when ten or more handicapped
students resided in a school district and permitted tuition payment for o u t-o f-
district placement if ten students or a classroom were not present in a specific
Reproduced with permission of the copyright owner. Further reproduction prohibited without permission.

district.
The 39th Legislature In 1965 mandated district surveys every four years to
determine numbers and needs of handicapped children in each district. This
Assembly also began a weighting system for speech handicapped children that
were not in special classes. A weighting system for funding indicating the extra
costs incurred in educating handicapped students was acknowledged and more
money per student was provided for their education. Handicapped students were
therefore funded as regular students in the public schools, plus a 'weighted' extra
amount - to help recover the extra expenditures required for their education. This
weighting system was determined by the state legislature and could be changed
by the state legislature.
In 1967, the 40th Legislative Assembly more clearly delineated its policy on
providing services to the children with handicaps and also allowed preschoolers
and trainable mentally retarded to be served The policy allowed the individual
school district to make their own decisions whether or not to serve these groups.
The 42nd assembly in 1971, provided definitions of handicapped students and
increased the age range of service from preschool to twenty-five years of age,
adding the older students with the approval of the State Superintendent of
Schools.
When the Montana Constitution was rewritten in 1972, equal educational
opportunity for all school-aged children, regardless of handicap, was guaranteed.
These Montana Constitutional changes preceded federal Public Law 94-142 in 1975,
a portion of Part B of the Education for All Handicapped Children Act. PL 94-142
Reproduced with permission of the copyright owner. Further reproduction prohibited without permission.

was a federal regulation which defined and addressed the educational inadequacies
of mentally retarded children. These inadequacies and inequities resulted in legal
disputes. Pennsylvania Association for Retarded Children vs. Pennsylvania (1971)
and Mills vs. the District of Columbia (1971) as well as thirty-four similar cases in
twenty-one other states dealt with the constitutional rights for the education of
the handicapped. In the Pennsylvania Association for Retarded Children vs. the
Commonwealth of Pennsylvania (1971) suit, the court concluded that the state
could not deny public education to mentally retarded children. Mills vs. Board of
Education of the District of Columbia (1971) was the second major court action
which determined that all school-aged children, regardless of handicap or severity
of that handicap, were entitled to receive a free appropriate public education.
These cases determined educational standards and required specific procedures for
the protection of these new equal rights. PL 94-142 stated that all handicapped
children were entitled to a free appropriate public education: special education
and related services provided in the least restrictive (as similar to that of the
regular student as possible) environment, at no cost to the parent, to those
children determined to require the services. Following the implementation of
federal law, Montana had to revise its then-current laws to be in agreement with
PL 94-142. In 1977, the definitions of handicapping conditions were changed by
the 45th Legislative Assembly. The regulation from the 1972 Montana Constitution,
concerning due process and mandatory and required services was also changed,
since Montana's did not agree completely with the federal standards. Since 1977,
there have been eight revisions made by three Superintendents of Public
Reproduced with permission of the copyright owner. Further reproduction prohibited without permission.

Instruction involving changes in day to day operation and streamlining of the
Special Education Reference Manual of Montana Laws and Rules. The revisions
were in 1972, and twice in 1974 by Delores Colburg, in 1977 and 1980 by Georgia
Rice, and in 1982, 1984, and 1986 by Ed Argenbright. In 1986, Appendix G was
added to the Reference Manual, describing best practices to further delineate the
processes described in the manual for screening, evaluation and placement of
students in special education.
1.2. DESCRIPTION OF CURRENT DATA COLLECTION SYSTEM
Federal and state law mandate that identifying information on all children
served by special education programs including speech and language therapy,
must be reported to those governments annually. The state has the responsibility
of ensuring that PL 94-142 is being implemented in order to be eligible for federal
funding for its programs(Dublinske, 1978). The state child-count form provides
information on students seen for special education, including those seen for
speech and language therapy.
The Montana child-count form for special education, as with most other
states, is modelled directly on federal regulations and is presently used by the
state and federal governments primarily for funding purposes. Consequently, the
form must include: numbers of students, and handicap for 'weighting'. Federal
funds are distributed to the state based on a varying percentage of the average
cost per pupil times the number of handicapped children receiving special
education services in the state's schools. The local school districts of Montana
Reproduced with permission of the copyright owner. Further reproduction prohibited without permission.

apply to the state for money by describing the types and extents of services they
provide. The state disburses funds based on two factors; service descriptions, and
the number of students served during the previous year and reported on the child-
count form(Dublinske, 1978).
The child-count form consists of identifying information for each child: a)
name - in initials, birthdate and sex, b) child's primary problem - from the state's
eleven accepted handicapping conditions, and c) amount of time seen for therapy
per week (reported only in whole numbers representing hours seen per week for
direct therapy). The child-count form is completed in December for all children
being served on December 1 of each year and is redistributed in June of the same
school year for any changes which occurred in caseload, and to add the total
number of weeks each student was served during that school year.
The record-keeping system used for speech and language therapy should be
useful for both the speech and language clinicians who are gathering the data, and
the administration, local, state and federal, who are receiving and then making
decisions based on that data. To be useful to both parties, the information to be
recorded should involve as many key descriptors as possible, but also be efficient
to implement and analyze. The present child-count form is useful to local, and
particularly to state and federal program administrators receiving the data only in
terms of counting documented caseload numbers under a broad general label to
justify funding. The child-count form is useful to those recording the data, only to
the extent of having information on the number of students they are serving.
The child-count forms that are used for monitoring the numbers and types
Reproduced with permission of the copyright owner. Further reproduction prohibited without permission.

of handicapped children in the state of Montana have not changed greatly from the
original design(1978). Changes from the original forms include no longer reporting
the severity of handicapping conditions as time seen per week in special education
(1982), and slight format changes to allow for computerization of the information
reported.
The child-count form, at present, describes speech and language therapy as
'speech'. Therefore, it does not begin to recognize the depth and breadth of
students' handicaps seen for treatment by clinicians, such as language delay,
language impairment associated with learning disabilities or physical handicaps,
fluency, voice, etc. The form does not begin to describe the clinician s role of
interaction with these students, reflecting only time in direct therapy. Primary
treatment agent, consultant with teacher or special education personnel or
program designer for aide or parent to be the primary agent of change in
intervention are all roles that the school speech and language clinician may
undertake to achieve maximum gains with different students. The child-count
form in its present format is inadequate for collecting data to allow administrators
or the clinicians themselves to make informed decisions regarding adequate
performance of the clinician, considering geographic and population parameters. A
state such as Montana is diverse in population density, ranging from rural remote
school districts to urban school districts. The data the state collects is collapsed
across these diverse districts. The amount of travel required to serve rural school
districts is not acknowledged by the present paperwork and appears as simply
lower caseload numbers.
Reproduced with permission of the copyright owner. Further reproduction prohibited without permission.

8
1.3. HISTORY OF SPEECH/LANGUAGE PROVISION IN PUBLIC SCHOOLS
NATIONWIDE
The role of the speech and language clinicians in the school setting has also
changed professionally in the last twenty years. This is roughly the same time
span described in the development of changes in the present special education
provision and record-keeping system. Caseloads have changed, with the special
education system modifications' regulation to provide 'free and appropriate'
services in the least restrictive environment' to all children, as required by PL
94-142. In the past, public school speech and language clinicians primarily served
school-aged individuals who were able to function independently in regular
education classrooms and caseloads consisted primarily of children with
articulation disorders. (80% articulation, 20% voice, rhythm and problems
associated with organic conditions. Van Hattum, 1971.) The types and severity of
handicaps present in the school that require services have changed greatly, with
wider age range, now including preschoolers to post-graduation ages, wider range
of handicaps and wider range of severity of handicapping condition of children
being seen, (O'Toole & Zaslow, 1969) as mandated by PL 94-142. For example,
deaf children or children with severe mental retardation or other
physical/educational impairments previously placed in state institutions or private
care facilities, are now attending public schools. These children now require
services from the appropriate special education personnel in the public schools.
They may require specialized settings. Historically, much of the speech/language
therapy occurred in therapy rooms - outside the regular classroom(Garrard, 1979).
Reproduced with permission of the copyright owner. Further reproduction prohibited without permission.

Now, Children with wheelchairs, hearing aids or more broad-based communication
problems may not be remediated most effectively and 'least restrictively' in a
separate setting (the speech/language therapy room). These children may now
have basic problems with learning and academics. Classroom interaction or
consulting/conferencing with other professionals involved in the child's treatment
may be much more effective for some children. Specialized equipment and
knowledge, such as health-care equipment, augmentative communication
equipment, more concrete objects and more extensive and lower level materials
are necessary. Different treatment formats may even be necessary because of the
younger children being seen, or the older children with more severe health or
attention problems being unable to work for a long period of time. This may
require shorter, but more frequent intervention sessions.
In addition, knowledge of language in the last twenty years (Rees, 1974) has
affected the speech and language clinician as the clinician learns to evaluate and
remediate different communication areas more effectively. In a 1931 survey of
1,000,000 school children, only two points of language behaviors were even
recognized, dialectical differences and aphasia. 1949 and 1951 studies reported
"delayed speech" or "retarded speech development" (early labels for language
problems) at 3 - 4% (ASHA Committee on Language, 1975). Beginning in the late
1960's and early 1970's, speech and language clinicians increased their caseload
with children considered language impaired. Percentages ranged from 29 - 39% of
language impaired children in public school caseloads (Des Roches, 1976) and 36%
of clinicians indicated that primarily language impaired students make up more
Reproduced with permission of the copyright owner. Further reproduction prohibited without permission.

10
than 50% of their caseloads (Stark, 1971), Major changes in the composition of
disorders of children seen in clinician's caseloads occurred during this time period.
These changes accompanied a major shift in the research and training efforts
in communication disorders. In research studies and texts of the 1940's and
1950's, only limited mention was made of language. In the 1960's and 1970's,
these topics were greatly expanded (ASHA Committee of Language, 1975). A major
signal of this change was ASHA's endorsement, in 1977, changing the title speech
pathologist to speech/language pathologist. In fact, the acronym, ASHA might well
be ASHLA (American Speech, Hearing and Language Association) or ASLA
(American Speech and Language Association) to mirror our increased Interest and
knowledge in language, if it were not for the problems of public recognition of the
acronym (Wepman. 1975).
Comparing recent studies of language problems seen and treated in public
school caseloads with the historical perspective of speech/language pathology, a
change of major proportion has occurred in the last twenty years. Clinicians no
longer see primarily 'speech' problems for therapy. Language involved students
receive a much greater percentage of the clinician's time than in the past. There
has been no acknowledgement of this significant change in the paperwork (child-
count) used to make decisions about speech/language programs, or from the
people involved in making those decisions. The label on the child-count form,
applied to the handicapped children seen for speech/language therapy remains
speech impaired'. The numbers gathered from that label constitute the only
concrete knowledge that administrators at all levels have concerning these
Reproduced with permission of the copyright owner. Further reproduction prohibited without permission.

11
caseloads and that does not begin to accurately reflect what is currently taking
place.
At present, in Montana, some information is gathered within various urban
districts, i.e. Great Falls and Helena, or by individual employers, for example, Easter
Seals Society, and various special education co-operatives, concerning the
composition of the caseloads and professional activities/obligations of the school
speech and language clinician. This information needs to be gathered by a
common useable tool and shared, this process should not be splintered within the
state. The Montana Speech, Hearing and Language Association (MSHA) and the
Office of Public Instruction (OPI) both identified the need to seek more accurate
information. OPI requested, through a series of meetings, that MSHA find a way to
make the information they receive more accurate and informational, but to also try
to keep within the existing format. MSHA then funded a study which served as a
basis for this thesis. This indicates an acknowledgement that the present system
is not adequate, and the interest of different agencies to make the record-keeping
system more accurately reflect the provision of services delivered.
In conclusion, governmental and legal changes have altered the role of the
public school speech and language clinician, as well as caseload composition.
There are many new students with a wider variety and degree of handicaps in the
public schools than were previously served, such as hearing impaired or nonvocal
children. These students require changes in types of services provided. As a
result, the demands on the clinician for different materials, different settings and
time, and especially for different knowledge bases have increased. In the same
Reproduced with permission of the copyright owner. Further reproduction prohibited without permission.

12
time span when legal changes occurred, the profession of speech pathology made
significant changes. Language required for effective treatment of the various types
of handicapped children has become an important aspect of the profession's focus
to address communication. As with other professionals, speech and language
clinicians must continue to examine their present status and accomplishments, to
ensure that the best and most efficient procedures are followed. In order for the
speech and language professionals to work as a cohesive unit, this examination
should be statewide. The present record-keeping requirements do not begin to
address these points and issues, and do not describe appropriately the treatment
modes taking place at this time.
In order to reflect these changes in clinical responsibility and caseload,
current information should be obtained which describes public school speech and
language clinician's roles and responsibilities. This information could be used for a
wide variety of purposes. These include: a) examining caseload size per clinician
- possible recommended sizes may be determined based on type of children a
clinician sees, the setting, the geographical location, etc. b) educational training
and in-service needs - they need to reflect, as much as possible, the current
demands on the speech and language profession in the public school, c) providing
information to the legislature and administrators that is accurate and current, as
well as descriptive, for informed decision making.
The purpose of the present study therefore, was to obtain information to
answer the following questions:
1. What are speech and language caseload descriptors that should be
Reproduced with permission of the copyright owner. Further reproduction prohibited without permission.

13
included on a state-wide record-keeping system a) from the speech and language
clinician's viewpoint? b) from the administrator of the speech and language
therapy program's viewpoint?
2. How does the speech and language clinician in the schools allocate and
spend her/his work time a) from the speech and language clinician's viewpoint? b)
from the administrator of the speech and language therapy program's viewpoint?
13
Reproduced with permission of the copyright owner. Further reproduction prohibited without permission.

Chapter 2
METHOD
In July of 1983, O P I requested a meeting with MSHA and University of
Montana representatives of the Communication Sciences and Disorders Department
(U. of Mt OSD) to determine an efficient and effective method of accurately
describing speech and language service delivery in the public schools in the state
of Montana. O P I. called the meeting to locate, or initiate a search for, information
they were seeking concerning speech and language therapists in the public
schools in the state, to help answer questions that were developing in their
department, as well as to supplement information they had recently received from
a MSHA Commitee on Language. Two categories of information were determined
to be important. The first category concerned caseloads: breakdown of types of
cases, severity, case dismissal information, type of therapy (group, individual).
O.P.I.'s interest in this topic related to questions they had about the numbers of
preschoolers being seen, the increases in caseload numbers of Speech Impaired,
and 'optimal time needs' of speech impaired students. The second category of
information concerned how the clinician spends her/his work time: how much time
for evaluation, screening, consulting, conferencing, monitoring, etc. that is not
reported under direct therapy, time required for specific types of treatment, i.e.
language vs. articulation, clinician's role when treatment is also being provided by
another special service person; and when the use of aides was feasible. In
14
Reproduced with permission of the copyright owner. Further reproduction prohibited without permission.

15
addition, O P I was interested in rural vs. urban effects on clinician work time.
An investigator was chosen who would gather the information and deliver a
final report to the agencies involved, in conjunction with a thesis project to
complete educational requirements for a graduate degree. A committee made up
of personnel from MSHA and the U. of Mt. CSD Department acted as an advisory
group for the project.
To examine the issues, two methods were devised; a questionnaire, to be
distributed to and returned by the appropriate personnel in the state, and a time
analysis. The time analysis was designed to be kept by speech and language
clinicians in the schools who were employed in specific sized schools.
2.1. Part 1 - Questionnaire
2.1.1. Development
The questionnaire was developed by the investigator, a state licensed
speech/language clinician who has been working in the public school system for
four years. Suggestions and recommended changes for elaboration and
clarifications of questions were made by the advisory committee. The
questionnaire was thus designed to elicit specific information about caseload and
allocation of time of the speech and language clinician from the various viewpoints
involved in speech and language therapy, both clinical and administrative. A draft
of the questionnaire was reviewed by the committee and after revising was
completed by the investigator, a final form was reviewed and approved by the
committee. Appendix A contains the questionnaire used in the study.
Reproduced with permission of the copyright owner. Further reproduction prohibited without permission.

16
2.1.2. Respondents
The questionnaire was sent to all speech and language clinicians working in
the public school setting in Montana, and all school superintendents and special
education co-operative directors employed by the public school systems in the
state of Montana. Addresses were supplied by O.P.I. and MSHA. Two hundred
thirty-five administrative personnel (school superintendents, special education
directors, special education co-operative directors) and one hundred eighty-one
school speech and language clinicians received a copy of the questionnaire.
The questionnaire was mailed with a return postage guaranteed envelope
Returned questionnaires were assigned a number, by the investigator, when
received, to preserve confidentiality of the respondents' answers. This allowed
foilowup by the researcher on any questions that arose in the analysis of the
questionnaires.
An increase in the number of administrators responding to the questionnaire
was necessary to allow the investigator to place more confidence in interpreting
the administrative data. The investigator contacted OPI on 7 /28/86 to obtain an
accurate count of administrators presently working in the public schools in the
state of Montana. Steve Colburg, OPI's statistician, reported that administrators are
currently classified by OPI as superintendents (numbering 142.3) and other
administrators (176) which includes principals, vice principals, co-operative
directors, etc. There were, at that time, 23 co-operatives in the state. These
numbers represent a change from the total number of administrators available in
the original sampling, but by using 165 (142 superintendents and 23 co-operative
Reproduced with permission of the copyright owner. Further reproduction prohibited without permission.

17
directors) admmlstrators, the supplemental study received data from those
administrators who have final responsibility for speech/language (special
education) programs. The original results from the administrators were not evenly
distributed across the low, medium and high population size groups, as the
clinician responses were. The supplemental sampling corrected for this
discrepancy, by sampling administrators evenly across all three population groups.
The investigator added 5 administrators from the high population district
group, 22 from the medium and 40 from the low population group This provided
a potential 40% response rate from each population group, based on school
administrators employed in 1986 in the state of Montana.
To ensure immediate response to the questions, a telephone interview
method was used. This allowed for information to be obtained immediately and
still maintained the option of allowing the respondents to not answer questions if
that was their desire.
To both facilitate the telephone sampling method used in this foilowup study
and to limit the information sought to only those questions which relate directly to
the thesis research questions, the following items were selected for the telephone
interview. This selection eliminated information that was obtained for the project
for OPI, but that did not relate directly to the thesis questions. Questions 1,2,16
and 17 were included in the phone interview because they dealt with the allocation
of clinicians' work time. Questions 3,6,7 and 8 were included because they dealt
with possible statewide caseload descriptors Question 19 was included to elicit
any other information the administrators might think relevant.
Reproduced with permission of the copyright owner. Further reproduction prohibited without permission.

18
2.1.3. Analysis
The frequency of response and percentage responses obtained by the
questions were tabulated and recorded. Total percentages of responses were then
calculated for both administrator groups and the clinicians. The administrative
phone sample results were collapsed with the previous administrative
questionnaire results whenever a significant difference was not demonstrated as a
result of analysis by the t test for independent means and chi^ . Where the results
of analysis indicated a significant difference in results, the data received from the
second administrative sampling was presented separately from the original sample.
The collapsed or separate responses of the groups of administrators were
compared and contrasted with those of the clinicians. Later, the questionnaire
responses of the clinicians and administrators were also compared to the results
received from the time analysis.
2.2. Part 2 - Time Analysis
2.2.1. Development of Time Analyses
In order to develop a system for time analysis, the investigator analyzed her
typical workday as a school speech and language clinician through a workday diary
for two weeks. In addition, seasonal variables in caseload, such as school speech
and language screening, preschool screening, and annual meetings concerning
students were identified. The various activities conducted during workdays were
assembled on a key as a basis for the time analysis. A time analysis format was
devised by the investigator as a work week calendar. Each day was divided into
Reproduced with permission of the copyright owner. Further reproduction prohibited without permission.

19
fifteen minute segments. Activities performed were assigned to the time
segments in order to describe the clinician's working days, in accordance with the
activities the key provided.
This draft of the time analysis was distributed to a small sample (12) of
working school speech and language clinicians around the state for a trial period
of two weeks to discover problems in understanding or recording, or to obtain
additional activities. The time analysis was modified for ease in recording, based
on feedback received from these participating clinicians. Appendix B contains the
Time Analysis.
2.2.2. Subjects
A print-out of the populations of all public schools in the State of Montana
was obtained from O.P.I. and the state's schools were divided into three groups.
Group #1 represented low population districts and was based on elementary
schools of up to approximately 200 students and high schools of up to
approximately 150 students. A one classroom per grade contains approximately 25
- 30 students. Group #2 is based on two classrooms per grade of approximately
25 - 30 students. Elementary schools contain up to 500 students and high schools
up to 500 students. Group #3 encompassed the rest of the state's schools, the
highest population districts. Elementary schools contain up to 738 students and
High Schools contain as many as 2031 students.
Criteria used to select participating clinicians for the study were: a) full time
school clinician, b) employment in one of the three population size school districts
and c) representation of the variety of geographic regions. Telephone contact was
Reproduced with permission of the copyright owner. Further reproduction prohibited without permission.

20
made with 58 clinicians to obtain 30 clinicians to participate, 10 for each
population district size. Contact with 58 clinicians was necessary to achieve the
desired 30 clinicians, 10 for each population group. 10 clinicians involved in the
pilot time analysis participated in the final study when they met the necessary
criteria. No reliability or validity measures were obtained on the data.
2.2.3. Procedure
The time analyses were completed by all study clinicians for the same three
monthly periods, representing the beginning, middle and end of the school year.
These time periods were designed to reflect the changes in job activities
throughout the school year. For example, screening of school-aged children for
speech and language problems usually takes place in the fall, preschool screenings
take a block of time usually during the winter or spring. Certain times of the year,
particularly early fall or late spring may have more student meetings to determine
scheduling and therapy needs than at other times.
The analysis formats were collected at the end of each timekeeping month
and analyzed for percentage of time/month spent for each job and job related
activity.
Reproduced with permission of the copyright owner. Further reproduction prohibited without permission.

21
2.2.4. Measurement
The time analysis results was analyzed by percentage of time/month spent,
broken down by job and job related activities of the speech and language
clinicians. Then these results were examined across population and seasonal
variables.
21
Reproduced with permission of the copyright owner. Further reproduction prohibited without permission.

Chapter 3
RESULTS AND DISCUSSION
The present study was designed to investigate two specific issues. First the
project examined the historical perspective of the development of the current
special education provision system in the public schools. Second, an analysis of
that current system and how it related directly to speech/language therapy was
conducted. Specifically the following questions were addressed: 1) What are the
most useful and efficient speech and language caseload descriptors to be used on
a state-wide record keeping system - from the viewpoint of the speech/language
clinician, and from that of the administrators of those clinicians? 2) How does the
speech/language clinician in the schools allocate and spend her/his work time?
To examine the issues, two methods were devised. The first method
employed a questionnaire, which was distributed to and returned by appropriate
personnel in the state. A second sampling included phoning additional
administrators to increase the number of respondents. The second method for
examining the issues was a time analysis. The time analysis was maintained by
selected speech and language clinicians in the schools who met specific guidelines
for population size of work sites.
Statistical methods were used to analyze the data. Answers of clinicians'
and administrators' were analyzed into mean percentages for each question. The
two administrators groups; group 1 - the mailed questionnaire, and group 2 - the
22
Reproduced with permission of the copyright owner. Further reproduction prohibited without permission.

23
phone sample of selected items from the questionnaire were then compared. The
t test for independent means was used to determine if the questions with
percentage responses could be collapsed across the two administrative samples.
This was based on the premise that the t test determines whether performance
differences between two groups is significant. A chi^ statistic was used to
determine whether the yes/no question responses could be collapsed across the
two samples since chi^ shows relationship when frequency of response data is
available for two groups. The two administrative groups' results were collapsed
when they were significantly related according to the results of the chi^ and t
statistic analyses, at the .01 confidence level. When the responses differed
significantly, the results of the two groups were presented and discussed
separately.
T test for independent means and chi^ were used, as described above, to
analyze and compare clinicians' and administrators' responses to the questionnaire.
This allowed for discussion of differences and similarities between these two
groups.
The t test for independent means was first calculated for the most widely
differing percentages. If no significant difference was found by the analysis at this
level, analysis was discontinued and all answer options with smaller percentage
differences were considered to be nonsignificant. If a significant difference was
found at the widest percentage difference, the statistic was then repeated for the
next widely differing percentage, and continued until a nonsignificant difference
level was found, if possible, from data given.
Reproduced with permission of the copyright owner. Further reproduction prohibited without permission.

24
The t test for independent means provided significance results for each pair
of percentage responses being compared. Chi^ test analyzed answers to
yes/no/no answer questions altogether and determined whether the total pattern
of responses from each group was significantly related/not related to the pattern
of responses of the other group in the comparison. If the chi^ differed, differences
were discussed descriptively since chi^ analyzes only the total pattern of the
response. A .01 level of significance was used because of the number of times
the statistic was repeated. This level reduced the chance occurrence of
significance/nonsignificance due solely to number of times the statistic was
repeated.
The following discussion will present three results. First, the questionnaire
results will be described in terms of clinician vs. administrative results. Second,
the questionnaire results of the administrative responses were compared to the
phone sampling results. Third, the clinician time analysis results will be presented,
with comparison to clinician and administration questionnaire responses.
3.1. The Questionnaire
The questionnaires were mailed to 235 administrative personnel, including
school superintendents, special education directors and special education co
operative directors. In addition, 181 school speech and language clinicians were
mailed questionnaires. These represented personnel working in Montana, based on
addresses supplied by the Office of Public Instruction and the Montana Speech,
Hearing and Language Association.
Reproduced with permission of the copyright owner. Further reproduction prohibited without permission.
25
The questionnaires were returned by 52 administrative personnel (22.13%)
and three letters, critical of the method of gathering information, were also
received from administrators. Seven (13.4%) of the administrative questionnaires
returned were not completed. Seventy (38.67%) of the speech/language clinicians
returned the questionnaire.
An increase in the number of administrators responding to the questionnaire
was necessary to allow the investigator to place more confidence in interpreting
the data. The initial results from the administrators were not evenly distributed
across the small, medium and large size population groups. The supplemental
sampling was employed to minimize this problem.
The supplemental sampling included five administrators from the high
population group, 22 from the median group and 40 from the low population
group. This provided a 40% response rate from each population group, based on
administrators employed in 1986. The supplemental phone results were collapsed
with the previous questionnaire results wherever the data agreed, as demonstrated
by t tests for independent means and chi^ .
The format for presenting the results will include first the statement of the
question. This will be followed by the percentages of responses to that question
for the clinicians (left hand column) and the administrators (right hand columns).
The type(s) of administrative response presented will be noted above the results
for each question, that is whether the results of each sample of administrators or
a collapsed sample of administrators is presented. A star will indicate a significant
difference between groups and the statistical result of the significantly differing
Reproduced with permission of the copyright owner. Further reproduction prohibited without permission.

26
groups will be presented below the percentages. Appendix C contains range of
scores for both groups of administrators and the clinicians for the percentage of
response questions.
3.2. Comparative Descriptive Results
Question #1: Please note approximate percentage (based on 100%) of
time/year utilized in the following activities;
Clinician % Activity CollapsedAdministration %
58.51 Direct Therapy 60.47
3.94 Screening 5.15
7.93 Evaluation 5.91
3.41 Meetings 2.94
1.74 Monitoring (client) 1.64
5.36 Preparation Time 3.92
1.72 Professional Consultation 2.77
6.46 Paperwork 4.72
1.00 In-Service 1.46
3.34 Parent Counseling/ 2.93Conferences
.92 Audiological Follow-up 1.12
5.31 Travel 7.02
.27 Other ----
Reproduced with permission of the copyright owner. Further reproduction prohibited without permission.

27
(t test for independent means score (Administrator group 1 -Administrator group 2): .36, (Clinician - Collapsed Administration): .80, not significantly different at the .01 level. Both samples did not differ.)
The agreement between the scores overall seemed to indicate accurate
information concerning utilization of the speech/language clinician was known by,
or was readily available to the administrators. Both clinicians and administrators
agreed as to how clinician's time is expended. The importance of the results to
this question appeared to be that at least on the local school district level, there
was knowledge that the clinician was involved in many job activities, other than
direct therapy. This accurate description of the role of the school
speech/language clinician is important information for higher levels of
administration to have when making decisions affecting those clinicians. Current
decisions are being made primarily on the basis of information the state gathers
on child-count - which describes only therapy case numbers.
Question #2: Does the speech/language clinician in your school(s) have time
allocated in their schedule for any of the above?
* Overall results differed between two groups of administrators and administration and clinicians.
Clinician % Activity Administration %
(Group 1) (Group 2)
68.33 "Yes" 77.28 52.24
16.67 "No" 11.36 46.27
15.00 "No Answer" 11.36 1.49
*(chi^ score; 16.81, patterns of answers differ significantly between administrative groups, chi^ score; >.03, patterns of answers differ
Reproduced with permission of the copyright owner. Further reproduction prohibited without permission.

28
significantly between clinicians and administrators).
Question #2 continued; If yes, please note approximate percentage (based
on 100%) of scheduled time/year: (Percentage data for the second half of Question
2 was not obtained from Administrative group 2).
Clinician^ Activity Administration (Group 1) %
73*15 * Direct Therapy 62.66
2.62 * Screening 9.67
5.81 Evaluation 7*33
2.08 Meetings .17
.65 Monitoring (client) --
1.96 Preparation Time .67
.54 Professional Consultation --
2.04 Paperwork .33
.42 In-Service .67
2.89 Parent Counseling/ .83Conferences
.85 Audiological Follow-up ----
6.46 » Travel 17.33
.02 Other
*(t test for independent means score: >2.75, significantly different at the .01 level). Unmarked percentages indicate comparison is nonsignificant between clinicians and administrators.
Reproduced with permission of the copyright owner. Further reproduction prohibited without permission.

29
The administrators' mailed questionnaire responses (group 1) estimate of
clinicians scheduled time increased evaluation and travel, from responses to
Question 1 and decreased time scheduled for all others, again, in comparison to
Question 1 responses. Administrators and clinicians reported a work schedule that
included time for all these activities rather than taking time from direct therapy
when necessary. The clinicians reported scheduling themselves for more direct
therapy and travel, and less for all other activities than their responses to Question
1 indicated. A significant difference in scores between clinicians and
administrators occurred for responses on direct therapy. Screening and travel
were both scheduled at a significantly higher percentage of time in administrative
estimation than for the clinicians. Clinicians, apparently, are somewhat reluctant to
schedule time for activities other than direct therapy, although both the clinicians
and the administrators indicated a variety of activities occurred.
The administrators (group 2) who reported time was scheduled for activities
other than direct therapy listed screening and in-service as those activities.
Percentage of time per year data obtained from this group was extremely limited
(less than 2% of phone sample administrators answered this portion of the
question with specific percentage information). This differs from the group 1
administrators' response, but probably represents the most visible (to the
administrators) schedule items. For example, the administrators schedule much of
the In-service on their district calendar and reported being aware that many
clinicians do not begin therapy in the fall until screening is finished. Possibly the
time lag between the two administrative samples explains some of the difference
Reproduced with permission of the copyright owner. Further reproduction prohibited without permission.

30
in opinion reported on this portion of Question 2. Many administrators currently
reported concerns about cost effectiveness for time, whereas that concern may
not have been as important to the original administrative sample.
More accurate information needs to be available to education personnel
regarding the time needed to provide activities other than direct therapy.
Responses to this question also suggested in-service needs of the clinicians on
how best to schedule. They indicated the activities take place (Question 1) but
that they do not schedule time for them as needed (Question 2). The clinicians
and administrators have both indicated the necessity of activities other than direct
therapy. Teachers, as the primary caretaker of the child in the school setting, may
also need information on how other activities relate to optimal therapy progress,
since some clinicians commented that time not involved in direct therapy is often
questioned by them. This is also supported by a study (Ruscello, 1980), that
reported teachers' concerns over allocation of time. Teachers must be made
aware of the importance of all activities involved in treating a child with
speech/language problems, realizing that direct therapy is only one of several
ways students can be helped to improve their communication.
Question #3: Please note approximate percentage (based on 100%) of the
speech/language clinician's caseload by appropriate disorder;
Clinician % Activity Collapsed Administration %
35.27 Articulation 42.27
19.50 Language 16.13
1.10 Language (written) 2.21
Reproduced with permission of the copyright owner. Further reproduction prohibited without permission.
31
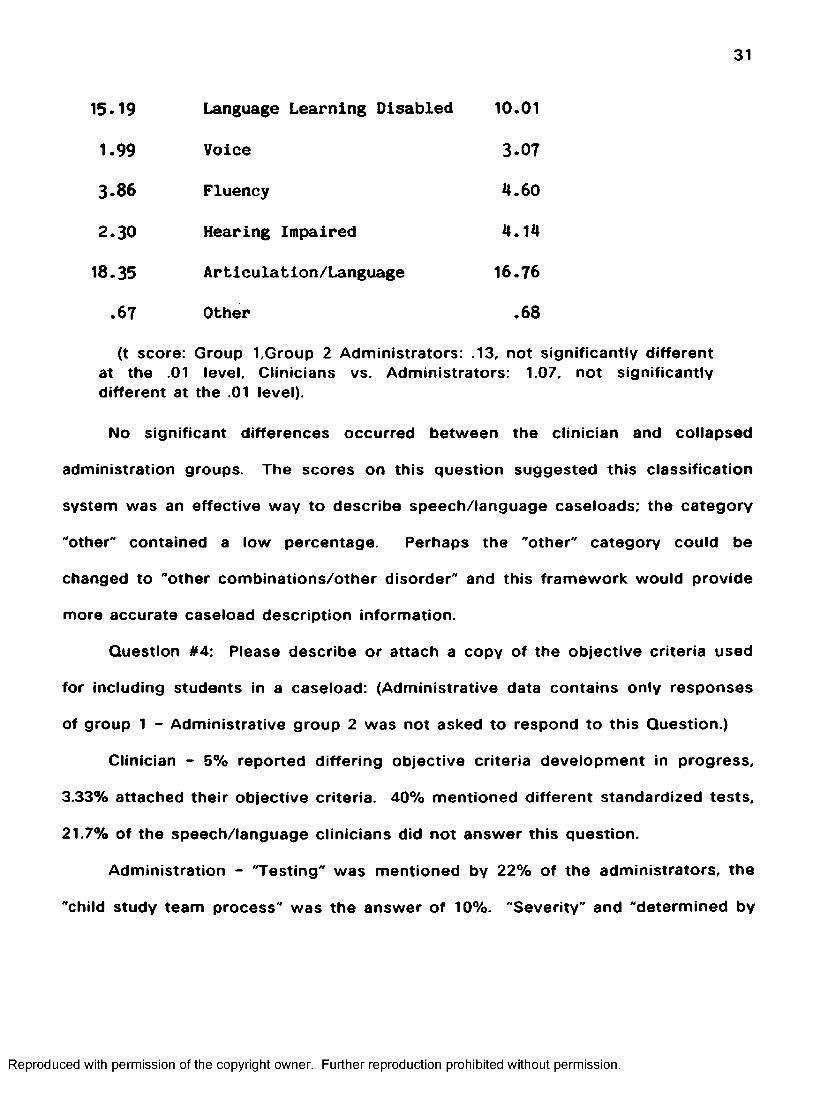
15.19 Language Learning Disabled 10.01
1.99 Voice 3.07
3.86 Fluency 4.60
2.30 Hearing Impaired 4.14
18.35 Articulation/Language 16.76
.67 Other .68
(t score: Group l,Group 2 Administrators: .13, not significantly different at the .01 level. Clinicians vs. Administrators: 1.07, not significantly different at the .01 level).
No significant differences occurred between the clinician and collapsed
administration groups. The scores on this question suggested this classification
system was an effective way to describe speech/language caseloads; the category
"other" contained a low percentage. Perhaps the "other" category could be
changed to "other combinations/other disorder" and this framework would provide
more accurate caseload description information.
Question #4: Please describe or attach a copy of the objective criteria used
for including students in a caseload: (Administrative data contains only responses
of group 1 - Administrative group 2 was not asked to respond to this Question.)
Clinician - 5% reported differing objective criteria development in progress,
3.33% attached their objective criteria. 40% mentioned different standardized tests,
21.7% of the speech/language clinicians did not answer this question.
Administration - "Testing" was mentioned by 22% of the administrators, the
"child study team process" was the answer of 10%. "Severity" and "determined by
Reproduced with permission of the copyright owner. Further reproduction prohibited without permission.

32
therapist* each accounted for 4% of the answers. There were other individual
answers and 48% of the administrators did not answer this question.
The greatest percentage of clinicians reported presently using some variation
of standard deviation from the norm on standardized testing for caseload selection.
Speech/language clinicians should not be restricted to just standardization data, in
terms of case selection, since normative information is not available for many
disorders served by our profession, i.e., fluency and voice. In addition, the validity
and reliability of standardized tests should be considered. Whether or not the
norms on standardized tests are appropriate for students in Montana in unknown
at this time. Even more importantly, whether the speech/language disorders
populations are distributed normally, is not known and therefore statistically
"normed" procedures may be inappropriate. Descriptive data of the Individual
child's abilities in developmental areas, including speech/language abilities, if well
recorded, can be objective. Complete descriptive data therefore, could be used
effectively with clinician judgement, as sufficient criteria for caseload inclusion.
The professionals involved in the actual intervention (i.e. speech/language
clinicians through the professional organization, MSHA) may be the ones best
informed to develop caseload guidelines. Descriptive data and clinician judgement
should be the basis of any such guidelines.
Question #5: For optimum progress, are there children seen in the
speech/language clinicians' caseload who could benefit from more therapy time
than they presently receive? If yes, please note approximate percentage (based on
100%) of caseload affected, by appropriate disorder: (Administrative data contains
Reproduced with permission of the copyright owner. Further reproduction prohibited without permission.
33
only responses of group 1 - Administrative group 2 not sampled for this question).
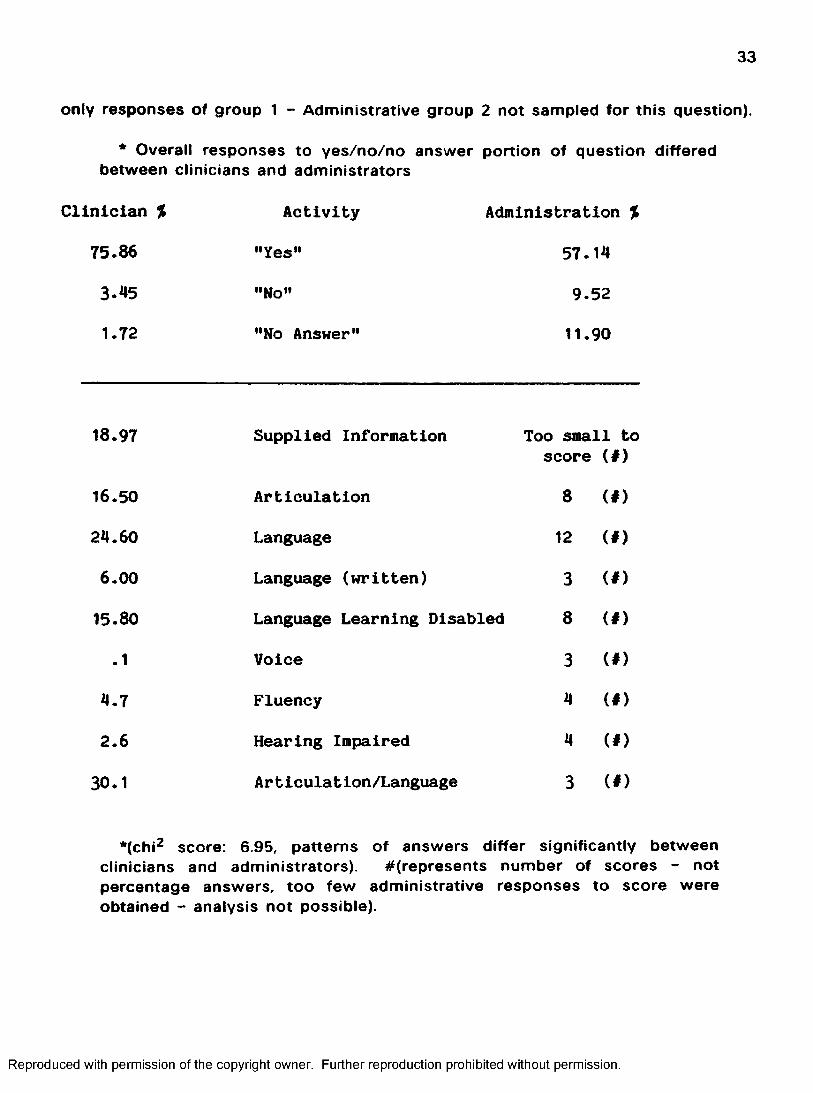
* Overall responses to yes/no/no answer portion of question differed between clinicians and administrators
Clinician %
75.86
Activity
"Yes”
Administration %
57 .14
3 .45 "No" 9 .52
1.72 "No Answer" 11.90
18.97 Supplied Information Too small to score (#)
16.50 Articulation 8 (# )
24 .60 Language 12 (# )
6 .0 0 Language (written) 3 (# )
15.80 Language Learning Disabled 8 (# )
.1 Voice 3 (# )
4 .7 Fluency 4 (# )
2 .6 Hearing Impaired 4 (# )
30.1 Articulation/Language 3 (# )
*(chi^ score: 6.95, patterns of answers differ significantly between clinicians and administrators). #(represents number of scores - not percentage answers, too few administrative responses to score were obtained - analysis not possible).
Reproduced with permission of the copyright owner. Further reproduction prohibited without permission.

34
There was very little direct relationship between the administrator and
clinician scores on the question. Patterns of answers differ significantly between
the clinicians and administrators. Clinicians reported a higher percentage of
students who could benefit from more therapy than did the administrators. In
addition, several comments from both groups expressed problems with the basis
of this question and the efficiency of optimum progress.
Question #6; Are children seen by the speech/language ctinician(s) and
labeled speech impaired on the current special education child-count form who
could be more specifically labeled? If yes, please check the labeling system below
that you feel would be more appropriate:
* Significant overall response between clinicians and administrators
Clinician % Activity Administration %
(Group 1) (Group 2)
18.03 Communication Disability 14.81 10.45
21.31 Language Disorder 11,11 16.42Voice/Fluency Disorder Articulation Disorder
29.51 Speech Disorder/Language 22.22 5.97Disorder/Content of Language— voice, phonology, semantics, articulation, morphology, function of language, fluency, syntax, pragmatics
6.56 Other 7.41 —
18.03 Yes, with no choice 3.70
Reproduced with permission of the copyright owner. Further reproduction prohibited without permission.

35
6.56 No 40.74 67.16
* (chi^ score: 5.08, the patterns of answers differ significantly between administrative groups. chi^ score: >3.12, patterns of answers differ significantly between clinicians and administrators).
The data reflected a clear consensus that the present label, speech Impaired,
is not acceptable to the clinicians {93%). Administrators (Group 1) responded "no"
fewer times than administrators (Group 2) but far more times than clinicians.
Administrators (Group 2) reported a majority in support of the present label. The
need is clearly presented by the group of clinicians and to a lesser extent,
administrators (Group 1) for a more accurate labeling system. The present label
does not accurately describe the disorder of 55 - 65% of the caseload since this
percentage is other than speech impaired based on clinicians' estimates. (See
Question 3) The term "speech Impaired" may also be confusing when clinicians
explain to parents and others the child's communication disability. In addition, the
term doesn't allow for documenting caseload changes or trends. Administrative
responses (both groups) also included comments that the label Is not Important,
they reported more concern that the children be served. This may have affected
how much interest/emphasis they placed on responding to this question.
A label with more specific description could provide the OPI personnel with
more accurate information concerning types and extents of speech/language
problems. This information should be useful In administrating and funding
programs. None of the labeling systems provided as question foils were clearly
favored by any of the sample groups.
Reproduced with permission of the copyright owner. Further reproduction prohibited without permission.
36
If the needs of the state are being met by the single label, at least let it
represent the students that are being seen, i.e. communicatively handicapped. If
more accurate and descriptive information would be useful to the state and federal
governments, several alternatives should be considered. Speech-impaired and
language-impaired is another labeling system that is concise but slightly more
descriptive and useful than the present one. One of the questionnaire choices
with a foil added for "others ' is another possibility. This issue could be referred to
professionals in MSHA for development of an appropriate labeling system. (A label
recommended by a concensus of a MSHA committee could be offerred to the
speech/language clinicians.) OPI and MSHA could receive both accurate child-
count information and more descriptive caseload information needed for program
planning and funding in one data collection if the present system were changed.
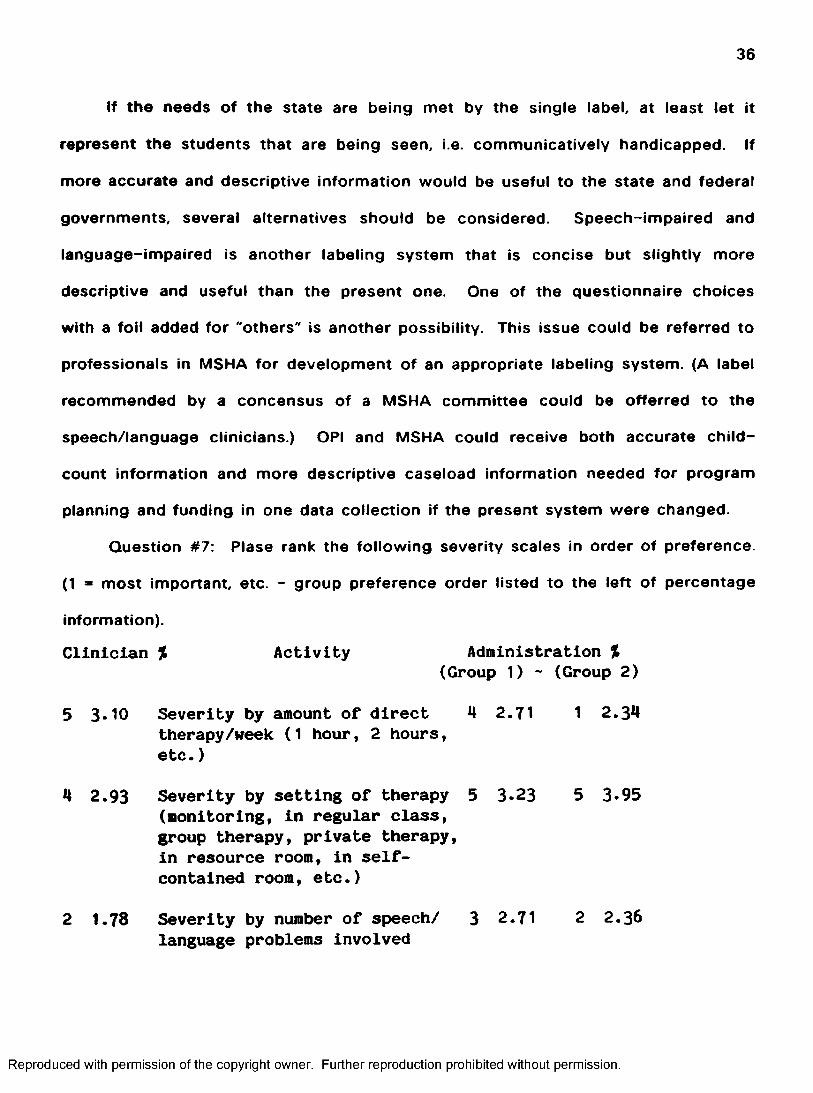
Question #7: Plase rank the following severity scales in order of preference.
(1 = most important, etc - group preference order listed to the left of percentage
information).
Clinician % Activity Administration %(Group 1) - (Group 2)
5 3-10 Severity by amount of direct 4 2.71 1 2.34therapy/week (1 hour, 2 hours, etc. )
4 2.93 Severity by setting of therapy 5 3.23 5 3*95(monitoring. In regular class, group therapy, private therapy,In resource room. In self- contained room, etc.)
2 1.78 Severity by number of speech/ 3 2.71 2 2.36language problems Involved
Reproduced with permission of the copyright owner. Further reproduction prohibited without permission.
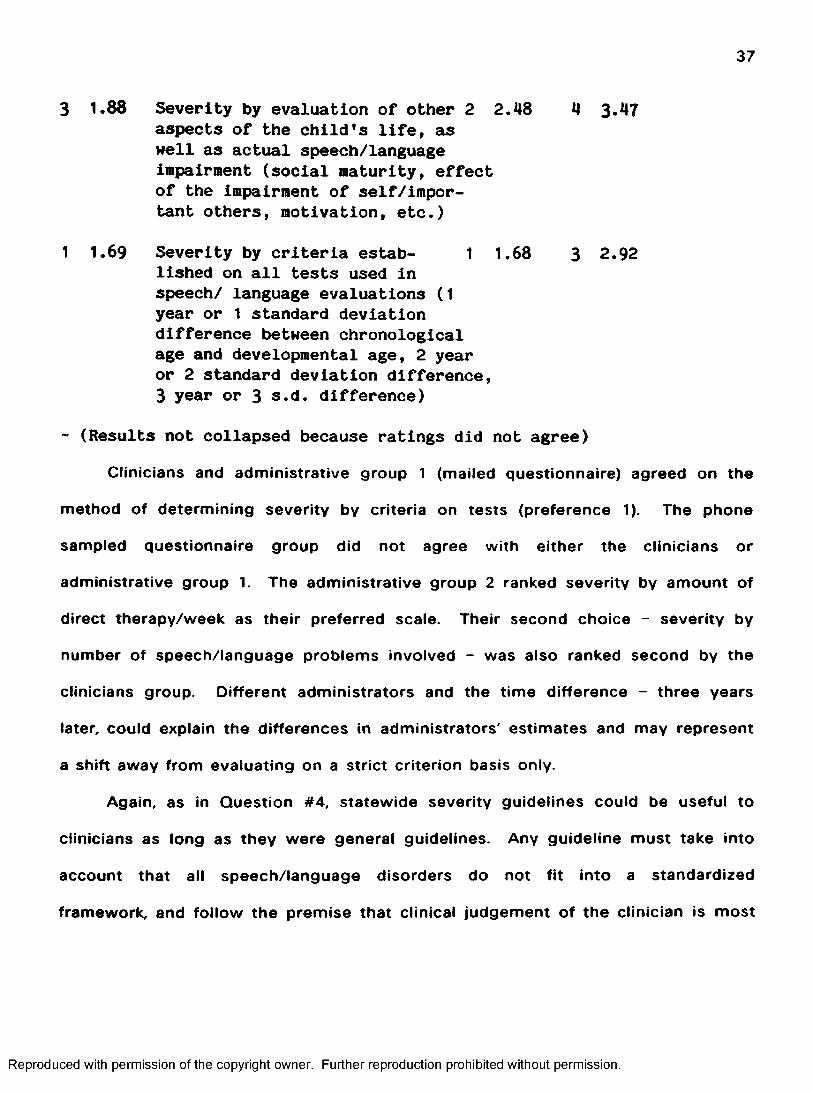
37
3 1.88 Severity by evaluation of other 2 2.48 4 3.47aspects of the child's life, as well as actual speech/language Impairment (social maturity, effect of the Impairment of self/important others, motivation, etc.)
1 1.69 Severity by criteria estab- 1 1.68 3 2.92lished on all tests used in speech/ language evaluations (1 year or 1 standard deviation difference between chronological age and developmental age, 2 year or 2 standard deviation difference,3 year or 3 s.d. difference)
- (Results not collapsed because ratings did not agree)Clinicians and administrative group 1 (mailed questionnaire) agreed on the
method of determining severity by criteria on tests (preference 1). The phone
sampled questionnaire group did not agree with either the clinicians or
administrative group 1. The administrative group 2 ranked severity by amount of
direct therapy/week as their preferred scale. Their second choice - severity by
number of speech/language problems involved - was also ranked second by the
clinicians group Different administrators and the time difference - three years
later, could explain the differences in administrators' estimates and may represent
a shift away from evaluating on a strict criterion basis only.
Again, as in Question #4, statewide severity guidelines could be useful to
clinicians as long as they were general guidelines. Any guideline must take into
account that all speech/language disorders do not fit into a standardized
framework, and follow the premise that clinical judgement of the clinician is most
Reproduced with permission of the copyright owner. Further reproduction prohibited without permission.
38
important in determining severity of any disorder. Accurate caseload description -
by disorder - could be helpful in determining special services needs and duration
of those services, for funding decisions.
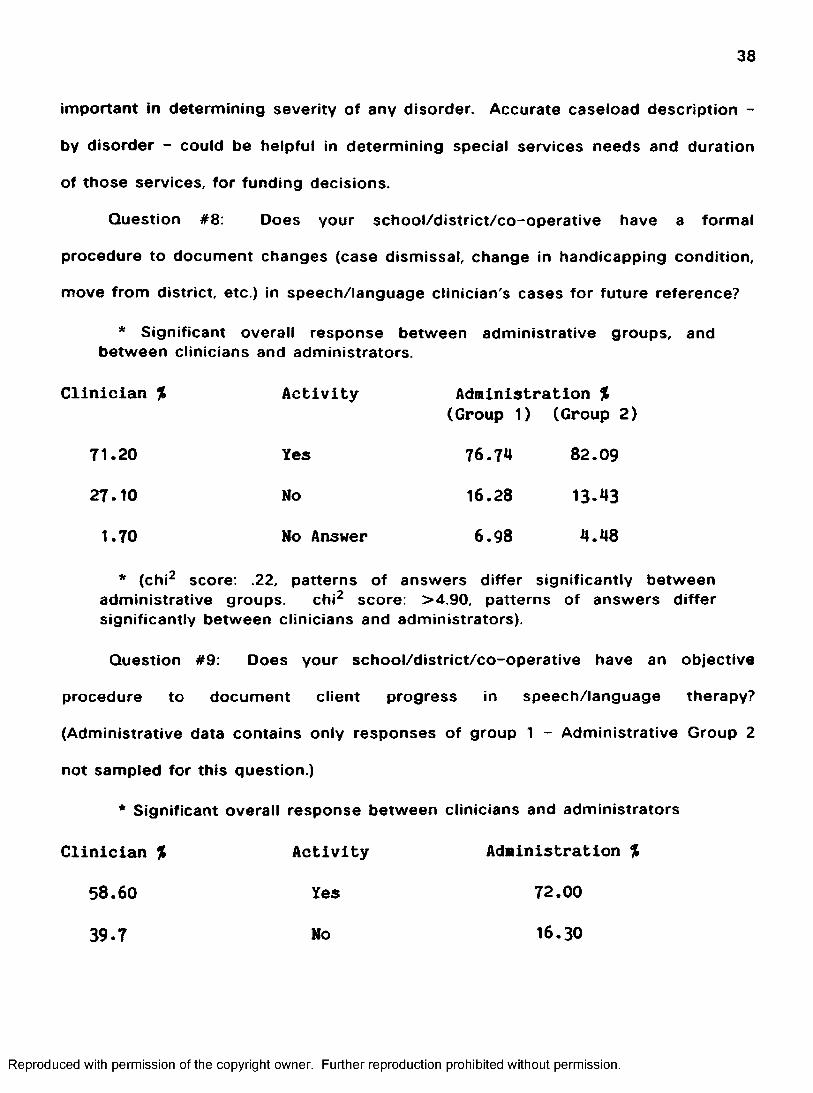
Question #8: Does your school/district/co-operative have a formal
procedure to document changes (case dismissal, change in handicapping condition,
move from district, etc.) in speech/language clinician's cases for future reference?
* Significant overall response between administrative groups, and between clinicians and administrators.
Clinician % Activity Administration %
(Group 1) (Group 2)
71.20 Yes 76.74 82.09
27.10 No 16.28 13.43
1.70 No Answer 6.98 4.48
* (chi^ score: .22, patterns of answers differ significantly between administrative groups. chi^ score: >4.90, patterns of answers differsignificantly between clinicians and administrators).
Question #9: Does your school/district/co-operative have an objective
procedure to document client progress in speech/language therapy?
(Administrative data contains only responses of group 1 - Administrative Group 2
not sampled for this question.)
* Significant overall response between clinicians and administrators
Clinician % Activity Administration %
58.60 Yes 72.00
39.7 No 16.30
Reproduced with permission of the copyright owner. Further reproduction prohibited without permission.

39
1.7 Mo Answer 11.60
*(chi^ score: 9.33, patterns of answers differ significantly betweenclinicians and administrators).
Question #10: Does your school/district/co-operative have an objective
procedure to document justification for case dismissal? (Administrative data
contains only responses of group 1 - Administrative Group 2 not sampled for this
question.)
* Significant overall response between clinicians and administrators
Clinician % Activity Administration %
48.30 Yes 55.80
50.00 No 30.20
1.70 No Answer 14.00
*(chi^ score: 7.93, patterns of answers differ significantly betweenclinicians and administrators.)
Question #11: Where is student speech/language information recorded
presently in your schooi(s), other than on State Special Education child-Count
forms? Please not place of recording by appropriate letter:
a) daily logs
b) individualized educational programs
c) cumulative record
d) health record
e) other
Reproduced with permission of the copyright owner. Further reproduction prohibited without permission.

40
f) not recorded
(Administrative data contains only responses of group 1 Administrative group 2 not sampled for this question.)
a. b. c. d. e. f.Hearing Test Results
ClinAdm
1,897.14
16.9820.24
29.2528.57
30.1930.95
21.7013.09
— — — —
Speech/Language Clin Screening Adm
6.258.06
13.7525.81
13.7527.42 12.90
6.2524.19
3.751.61
Speech/Language Clin Test Ado
8.4113.04
44.8636.23
14.0215.94 5.80
32.7128.99
— — —
Type of Therapy
ClinAdm
27.8720.55
45.9043.84
8.2012.33 2.74
18.0319.18 1.37
Setting of Therapy
ClinAdm
19.5422.22
40.2342.86
4.606.35 1.59
19.5412.70
16.0914.29
EducationalSignificance
ClinAdm
5.8012.28
37.6843.86
8.707.02 3.51
21.74 26.09 17.54 15.79
Progress ClinAdm
44.3531.88
25.2237.68
8.7013.04 1.45
20.8715.94
.87
The results on Questions #8.9.10, and 11 will be discussed together since all
four questions dealt with recordkeeping of special education information in
conjunction with regular school recordkeeping. On Questions #8 and 9 , the great
majority of both clinicians and administrative groups (Question #8 - Administrative
group 1 and 2, Question #9 - Administrative group 1) responded that their
school/district/co-operatives had procedures in place to document client changes
and therapy progress. On Question #10, the clinicians responses were divided
fairly evenly over the yes and no responses, but the majority of administrators
Reproduced with permission of the copyright owner. Further reproduction prohibited without permission.

41
responded yes, so clinicians had more questions about the documentation of case
dismissal than did the administrators. The responses to Question #11 indicated
that the information is kept, but certainly not in any established location in the
estimation of either the clinician or administrators, based on the diversity of
answers obtained. This lack of consistency in recording speech, language and
hearing information, in any consistent central place may indicate a serious problem
in sharing and making available information concerning speech/language therapy
students.
In the interest of effective communication between school officials and
special education personnel, there should be consistent objective procedures for
documenting and recording special education student information. Further, an
indicator/paper trail in the established folder for each child (cumulative folder)
could note further information is available elsewhere. This should be implemented
as standard state special education procedure and should be monitored by the
state, as part of the special education audit procedure.
Question #12: What percentage (based on 100%) of the speech/language
clinician's caseload involves preschool children under the age of six years?
Describe or attach criteria used to include a preschool child in the caseload.
(Administrative data contains only responses of group 1 - Administrative group 2
not sampled for this question.)
Clinician % Administration %
9.50 9.40
(t test for independent means score: 07, no significant difference at the .01 level).
Reproduced with permission of the copyright owner. Further reproduction prohibited without permission.
42
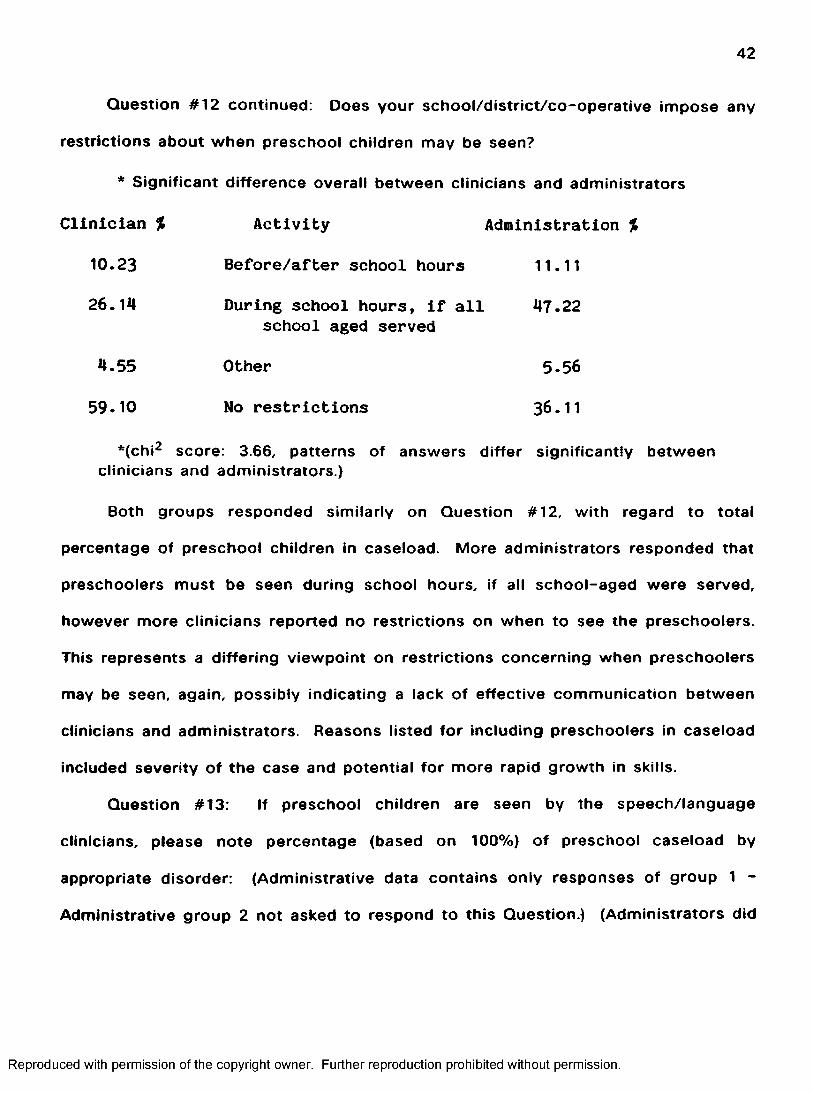
Question #12 continued: Does your school/district/co-operative impose any
restrictions about when preschool children may be seen?
* Significant difference overall between clinicians and administrators
Clinician % Activity Administration %
10.23 Before/after school hours 11.11
26.14 During school hours, if all 47.22school aged served
4.55 Other 5.56
59.10 No restrictions 36.11.2*(chi^ score; 3.66, patterns of answers differ significantly between
clinicians and administrators.)
Both groups responded similarly on Question #12, with regard to total
percentage of preschool children in caseload. More administrators responded that
preschoolers must be seen during school hours, if all school-aged were served,
however more clinicians reported no restrictions on when to see the preschoolers.
This represents a differing viewpoint on restrictions concerning when preschoolers
may be seen, again, possibly indicating a lack of effective communication between
clinicians and administrators. Reasons listed for including preschoolers in caseload
included severity of the case and potential for more rapid growth in skills.
Question #13: If preschool children are seen by the speech/language
clinicians, please note percentage (based on 100%) of preschool caseload by
appropriate disorder: (Administrative data contains only responses of group 1 -
Administrative group 2 not asked to respond to this Question.) (Administrators did
Reproduced with permission of the copyright owner. Further reproduction prohibited without permission.

43
not answer with enough correct percentage information to score, but the following
listing under administrators represents the number of times each disorder was
marked/chosen.)
Clinician % Activity Administration #
22.10
21.17
3.28
.68
3.83
3.66
56.38
2.66
Articulation 17
Language
Language (written)
Language Learning Disabled
Voice
Fluency
Hearing Impaired
Articulation/Language
Other
5
1
4
6
12
The answers to this question and the previous question seem to indicate
some need for in-service to administrators, since administrators reported most of
the children were being seen for articulation, whereas the clinicians reported the
most preschoolers with combined articulation/language disorder were seen for
therapy. The clinicians' response to this question probably provided more accurate
information regarding caseload composition than did the responses of the
administrators.
Question #14: Is the use of a trained aide, supervised by a speech/language
clinician, appropriate in your district/area? (Administrative data contains only
Reproduced with permission of the copyright owner. Further reproduction prohibited without permission.
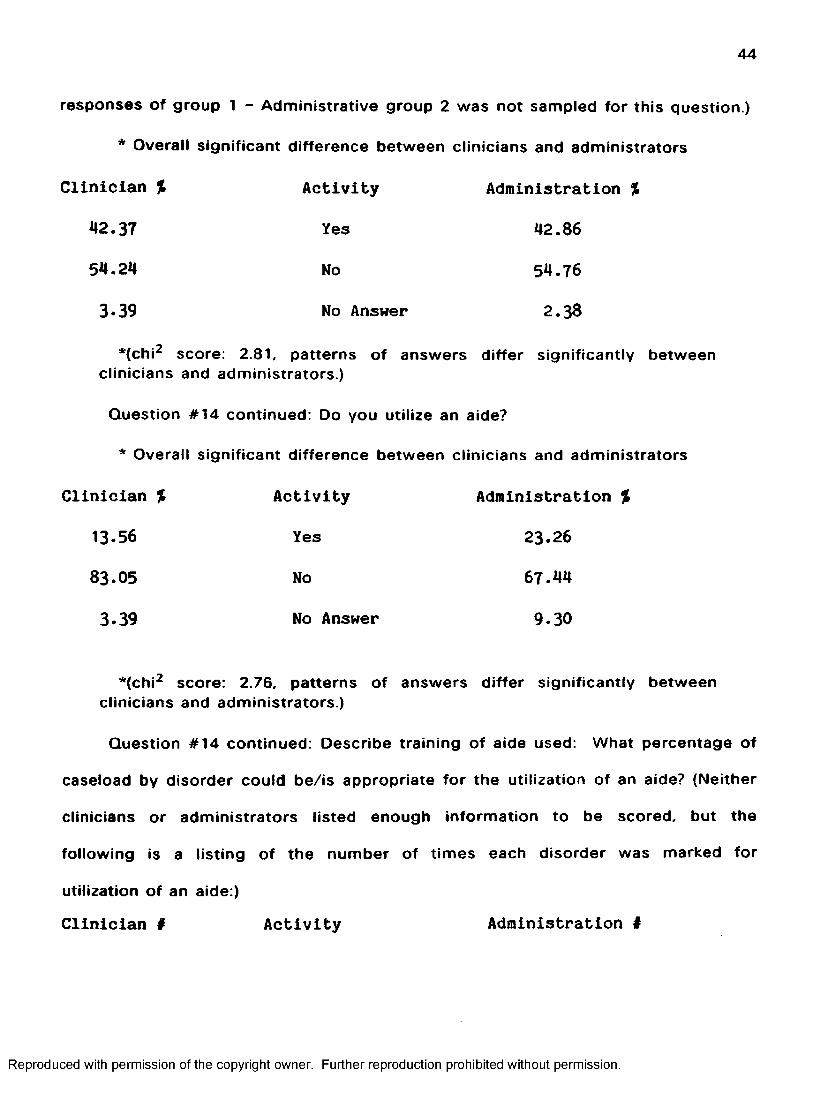
44
responses of group 1 - Administrative group 2 was not sampled for this question.)
* Overall significant difference between clinicians and administrators
C lin ic ia n % A c t iv i ty A d m in is tra tio n %
42.37 Yes 42.86
54.24 No 54.76
3.39 No Answer 2.38
*{chi^ score: 2.81, patterns of answers differ significantly betweenclinicians and administrators.)
Question #14 continued: Do you utilize an aide?
* Overall significant difference between clinicians and administrators
Clinician % Activity Administration %
13.56 Yes 23.26
83.05 No 67.44
3.39 No Answer 9.30
*(chi^ score: 2.76, patterns of answers differ significantly betweenclinicians and administrators.)
Question #14 continued: Describe training of aide used: What percentage of
caseload by disorder could be/is appropriate for the utilization of an aide? (Neither
clinicians or administrators listed enough information to be scored, but the
following is a listing of the number of times each disorder was marked for
utilization of an aide:)
Clinician # Activity Administration #
Reproduced with permission of the copyright owner. Further reproduction prohibited without permission.
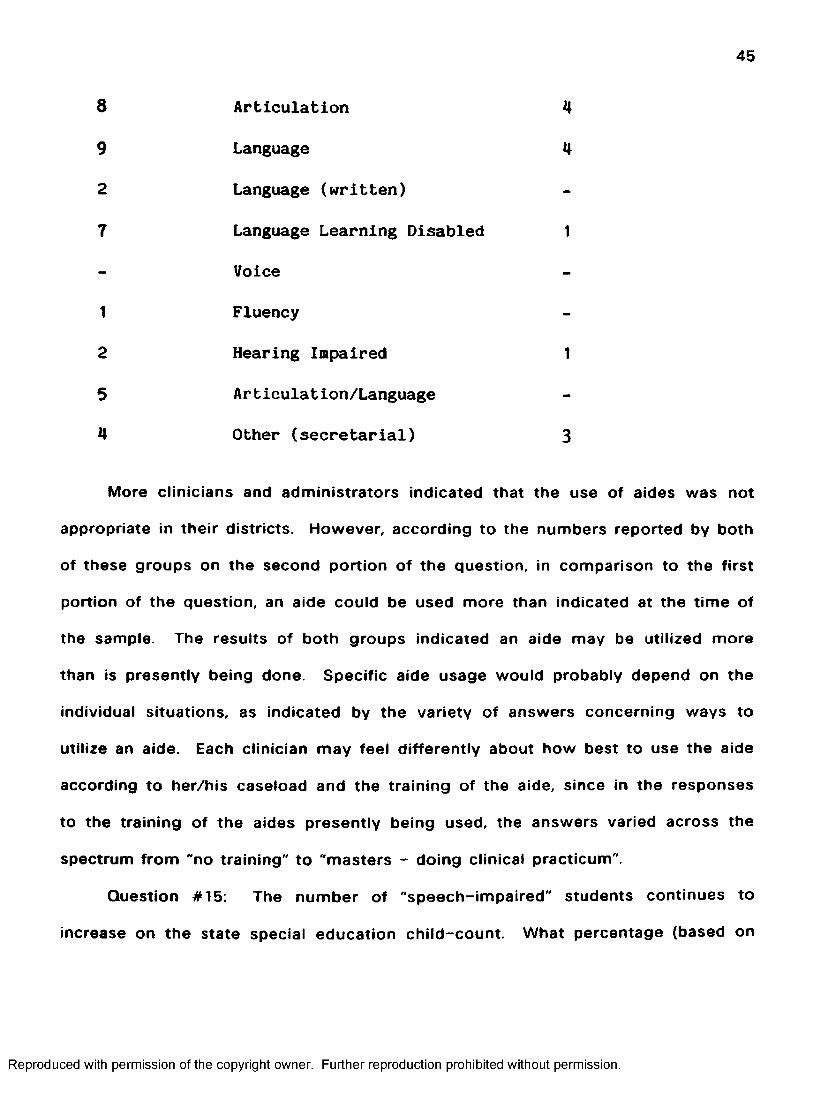
45
8 Articulation 4
9 Language 4
2 Language (written)
7 Language Learning Disabled 1
Voice
1 Fluency
2 Hearing Impaired 1
5 Articulation/Language
4 Other (secretarial) 3
More clinicians and administrators indicated that the use of aides was not
appropriate in their districts. However, according to the numbers reported by both
of these groups on the second portion of the question, in comparison to the first
portion of the question, an aide could be used more than indicated at the time of
the sample. The results of both groups indicated an aide may be utilized more
than is presently being done. Specific aide usage would probably depend on the
individual situations, as indicated by the variety of answers concerning ways to
utilize an aide. Each clinician may feel differently about how best to use the aide
according to her/his caseload and the training of the aide, since in the responses
to the training of the aides presently being used, the answers varied across the
spectrum from "no training" to “masters - doing clinical practicum".
Question #15: The number of "speech-impaired" students continues to
increase on the state special education child-count. What percentage (based on
Reproduced with permission of the copyright owner. Further reproduction prohibited without permission.
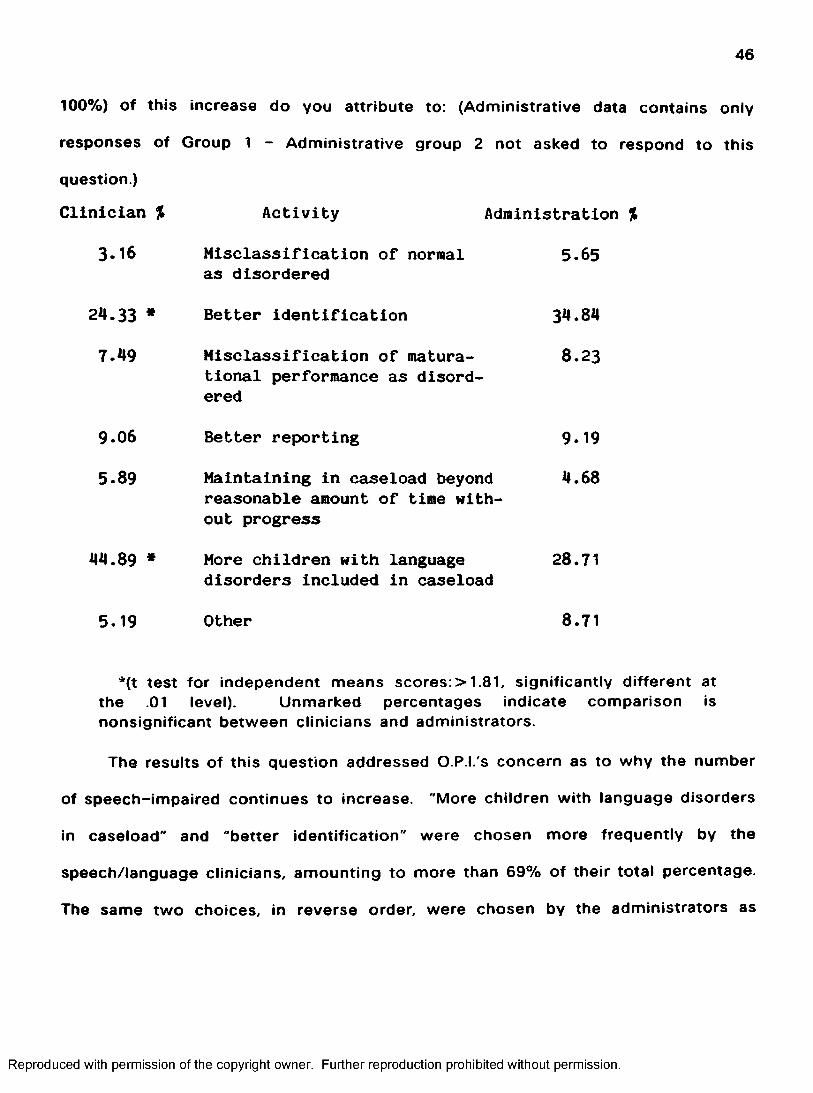
46
100%) Of this increase do you attribute to: (Administrative data contains only
responses of Group 1 - Administrative group 2 not asked to respond to this
question.)
Activity Administration %
5.65
Clinician %
3.16 Misclassification of normal as disordered
24.33 * Better identification
7.49 Misclassification of matura-tional performance as disordered
9.06 Better reporting
5.89 Maintaining in caseload beyondreasonable amount of time without progress
44.89 * More children with languagedisorders included in caseload
5.19 Other
34.84
8.23
9.19
4.68
28.71
8.71
*{t test for independent means scores: > 1.81, significantly different at the .01 level). Unmarked percentages indicate comparison is nonsignificant between clinicians and administrators.
The results of this question addressed O.P.I.'s concern as to why the number
of speech-impaired continues to increase. "More children with language disorders
in caseload" and "better identification" were chosen more frequently by the
speech/language clinicians, amounting to more than 69% of their total percentage.
The same two choices, in reverse order, were chosen by the administrators as
Reproduced with permission of the copyright owner. Further reproduction prohibited without permission.

47
their most frequent answers to the increase, representing more than 63% of their
total percentage. These two reasons are clearly the main choices of the two
groups to answer Question 15, but their explanations of increase differ
significantly. The responses to this question address again the need for in-service
to administrators concerning the speech/language clinicians' caseload. Reasons
listed under "other" included the following; more language disordered children,
more impaired children of all kinds, better training of clinicians, and later date of
child-count.
Question #16: Are children seen by the speech/language clinician(s) that are
also seen by another special service provider in the school?
* Overall significant difference between administrative groups and also between clinicians and administrative groups
Clinician % Activity Administration %(Group 1) (Group 2)
72.88 Yes 67.44 82.09
1.69 No 11.63 13.64
25.43 No Answer 20.93 4.27
*(chi^ score:>4.33, patterns of answers differ significantly between clinicians and administrative groups.)
Question #16 continued: If yes, please note approximate percentage (based
on 100%) of caseload by appropriate disorder:
Clinician % Activity Administration %
(Group 1) (Group 2)
12.06 Articulation 18.57 14.22
Reproduced with permission of the copyright owner. Further reproduction prohibited without permission.

48
Collapsed Administration %
18.77 Language 14.22
.88 *c Language (written) 8.55
36.47 Language Learning Disabled 34.36.88 Voice .99.65 Fluency 1.52
.94 Hearing Impaired 5.3628.82 Articulation/Language 15.04
* B (t score: 3.30, significant difference present at the ,01 level between administrative groups)
*c (t score; 1.01, significant difference present at the .01 level between clinicians and collapsed administration)
Unmarked percentages indicate comparison is nonsignificant between clinicians and administrators.
The responses to this question indicated a sharing of students between
special service providers. Children with learning problems or physical problems
often have communication problems as well. Language learning disabled was
reported as the primary disorder being seen by more than one provider by both
the collapsed administrative and clinician groups. Written language was the
disorder which differed significantly in percentage reported by clinicians and
administrators, with clinicians reporting very little dual service for this disorder.
Administrators indicated more dual service for Written Language than did the
clinicians. These scores reflect back to Question #3: accurate caseload description
needs to be provided to administration. The clinicians' results also serve to help
describe what types of disorders are frequently seen by more than one provider;
Reproduced with permission of the copyright owner. Further reproduction prohibited without permission.

49
Articulation, Language, Language Learning Disabled and Articulation/Language have
much greater percentages than the other disorders listed. (96% of total)
The administrators groups' disagreement on score for Articulation may
represent learning by administrators during the time lag between samples.
Administrators (Group 2) score was lower than Administrators' (Group 1) and closer
approximated the percentage reported by the clinicians who have more accurate
caseload information available. Overall, the similarity in the majority of the scores
represented an acceptance/understanding of reasons for dual service.
Question #17: If children are seen by the speech/language clinician(s) that
are also seen by another special service provider in the school, please note the
speech/language clinician's role, by letter, by appropriate disorder:
a) consult with classroom teacher
b) consult with other provider
c) provide indirect therapy (goals and supervision)
d) provide direct therapy in other provider's setting
e) provide direct therapy in separate setting, planned with other provider
f) provide direct therapy in separate setting, NOT planned with other provider
g) none of the above
a. b. c. d. e. f. g.
ArticulationClin. 29.73 13.51 5.41 4.05 10.81 21.62 14.86Adm.CGp 1) 21,88 15.63 6.25 3.13 18.75 15.63 18.75
Reproduced with permission of the copyright owner. Further reproduction prohibited without permission.
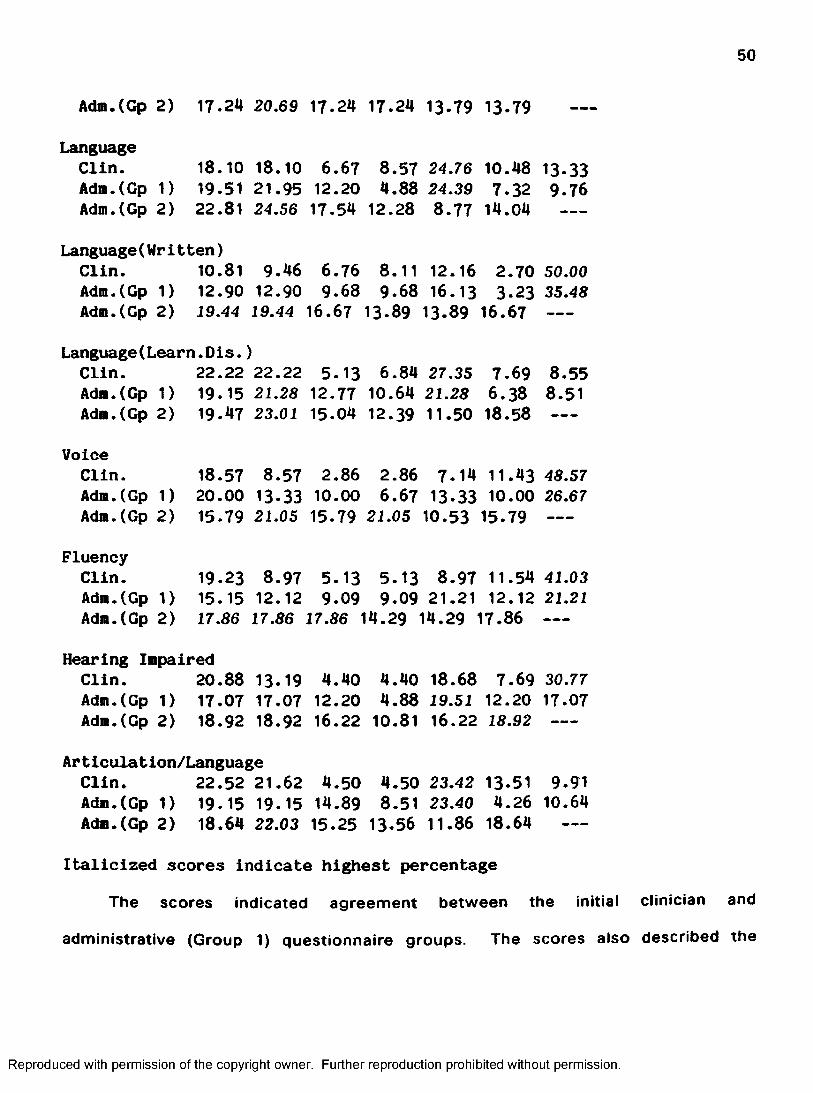
50
Adm.(Cp 2) 17.24 20.69 17.24 17.24 13-79 13-79
LanguageClin. 18.10 18.10 6.67 8.57 24.76 10.48 13.33Adm.(Gp 1) 19.51 21.95 12.20 4.88 24.39 7-32 9-76Adm.(Gp 2) 22.81 24.56 17-54 12.28 8.77 14.04
Language(Written)Clin. 10.81 9.46 6.76 8.11 12.16 2.70 50.00Adm.(Gp 1) 12.90 12.90 9.68 9.68 16.13 3.23 35.48Adm.(Gp 2) 19.44 19.44 16.67 13-89 13.89 16.67 --
Language(Learn.Dis.}Clin. 22.22 22.22 5.13 6.84 27.35 7.69 8.55Adm.CGp 1) 19.15 21.28 12.77 10.64 21.28 6.38 8.51Adm.CGp 2) 19.47 23.01 15.04 12.39 11.50 18.58 ---
VoiceClin. 18.57 8.57 2.86 2.86 7.14 11.43 48.57Adm.CGp 1) 20.00 13-33 10.00 6.67 13-33 10.00 26.67Adm.CGp 2) 15.79 21.05 15.79 21.05 10.53 15.79 --
FluencyClin. 19.23 8.97 5.13 5.13 8.97 11.54 41.03Adm.CGp 1) 15.15 12.12 9-09 9-09 21.21 12.12 21.21Adm.CGp 2) 17.86 17.86 17.86 14.29 14.29 17.86 --
Hearing Impaired Clin. 20.88 13-19 4.40 4.40 18.68 7.69 30.77Adm.CGp 1) 17.07 17.07 12.20 4.88 19.51 12.20 17.07Adm.CGp 2) 18.92 18.92 16.22 10.81 16.22 18.92 ---
Articulation/Language Clin. 22.52 21.62 4.50 4.50 23.42 13-51 9.91Adm.CGp 1) 19.15 19.15 14.89 8.51 23.40 4.26 10.64Adm.CGp 2) 18.64 22.03 15-25 13-56 11.86 18.64 —
Italicized scores indicate highest percentageThe scores indicated agreement between the Initial clinician and
administrative (Group 1) questionnaire groups. The scores also described the
Reproduced with permission of the copyright owner. Further reproduction prohibited without permission.

51
speech/language clinician's role in serving the various disorders. The scores
described the roles the clinicians provide in dual service of the disorders listed
(when more than one special service provider serves a child). The initial
questionnaire sample groups (Clinician and Administrator Group 1) expressed a
strong concensus concerning otimum method of treatment of speech/language
problems. They agreed both in which specific services providers were involved
and the specific setting of the therapy. The ratings of the telephone sampled
group did not agree with the original administrative group. For every disorder
group listed, the group 2 administrators chose role b) consult with other provider,
as at least one of their highest percentage choices. This indicates a strong
preference by Administrative Group 2 for this role being at least part of any dual
service. The overall disagreement between the two administrative groups may
also be explained by the different sampling method: not being able to look over all
the choices and think about how they relate to the disorders may have affected
the Administrative (Group 2) answers.
Question #18: Please note who currently evaluates the speech/language
ciinician(s) Job performance in your school(s)? Do you think that this person(s) is
knowledgeable enough to evaluate the speech/language clinician's role in the
school setting? The speech/language clinician's professional competence? Is the
speech/language clinician advised of evaluation criteria prior to observation?
(Administrative data contains only responses of group 1 - Administrative Group 2
not asked to respond to this question.)
* Significant overall difference between clinicians and administrators, with the exception of: **responses did not differ between clinicians and
Reproduced with permission of the copyright owner. Further reproduction prohibited without permission.

52
administrators
Principal (C) (A)
Percentage Evaluated by:
(C) (A)
37.04 27.50 51.85 55.00
Spec.Ed.Dir, Superintendent(C) (A)
3.70 17.50
Evaluate Role 50.00 45.45 53.57 95.45 100.00 **100.0in School Setting
(yes)
Evaluate Professional Competence
(yes)
25.00 27.27 35.71 90.91 50.00 87.71
Advised of 80.00 45.45 Evaluation Criteria
(yes)
75 .00 6 .36 100.00 85.71
(yes) indicates the percentages of yes answers for the administrators listed at the top of the chart, (C) indicates clinician answers, (A) indicates administrators answers.
*(chi^ score: >0.00, patterns of answers differ significantly between groups, with the exception of: **chi^ score: 0.00, clinician andadministration opinion concerning superintendents evaluation of clinician's role in school setting: nonsignificant difference.)
The following percentages were listed in addition to the more common
choices reported above. Clinicians reported evaluation by general administration:
3.70%, Assistant Director of Special Education: 3.70%, Outside
Consultant/Supervisor: 1.85%, Speech/Hearing/Language Coordinator: 1.85%, No
One: 1.85% and Self: 1.85%.
The clinicians responding to the questionnaire were more supportive of
evaluator's knowledge about their role in school setting. They agreed with
Reproduced with permission of the copyright owner. Further reproduction prohibited without permission.
53
superintendents' estimation of ability to evaluate that role, but expressed concern
about evaluation of their professional competence Reportedly, they were usually
advised of evaluation criteria in advance.
Question #19: What other information would you like to see included on the
federal/state mandated child-count forms?
57.63% of the speech/language clinicians and 76.74% of the original
administrators group did not answer this question. Comments from those who
responded included: credit for time spent on other than direct therapy, more
specificity in labeling, severity by some objective criteria, report of actual time
seen for therapy instead of rounding to the next hour, and how long the child has
been receiving services.
100% of the phone sample administrators answered this question. 73.13%
answered "No other information", suggesting approval of the present system.
Those who did offer other information, reflected some of the same comments as
those listed above for the questionnaire sampled administrators. Several different
comments were added by the group 2 administrators, perhaps prompted by the
changes in special education in this current year. Group 2 comments included:
need an avenue to have clinicians on staff - cannot obtain services or need more,
desire severity rating method, desire some avenue to record administrative
viewpoint, want some method of relating school population size to actual costs of
providing adequate services and suggestions to eliminate child-count.
Although a wide range of viewpoints were expressed regarding information
gathered on child-count, in general a need for more accuracy and specificity in
Reproduced with permission of the copyright owner. Further reproduction prohibited without permission.

54
reporting was described. Also, administrators would like an avenue to voice
problems/concerns to OPI on a regular basis.
Question #20: Are there other data you would find useful to your
professional acountability? (Administrative data contains only responses of group
1 - Administrative Group 2 not sampled for this question.)
54.24% of the clinicians and 65.12% of the administrators did not answer this
question. 33.00% of the clinicians and 30.23% of the administrators answered no,
and the comments of those that answered included the following: professional
goals, continuing education, accounting for travel, and complete job descriptions.
The "no" and "no answer" responses together represented 87% of the clinicians
and 95% of the administrators. This indicated a lack of interest or lack of
knowledge concerning gathering professional accountability information at the time
of sampling.
Question #21: Would you describe the speech/language clinician as:
(Administrative data contains only responses of group 1 - Administrative Group 2
not asked to respond to this question.)
* Overall significant difference clinicians and administrators
Clinician % Activity Administration %
5.08 A teacher with special 23.68responsibilities
77.97 A rehabilitation professional 68.42providing services in school
13.56 Other 7.80
Reproduced with permission of the copyright owner. Further reproduction prohibited without permission.
55
*(chi^ score: 7.33, patterns of answers differ significantly between clinicians and administrators.)
Although the patterns of answers differ according to profession, these results
indicated higher percentages for both clinician and administrative groups to
describe the speech/language clinician's role in the schools as a rehabilitation
professional providing services in the schools. The second choice of each group
differed and this may have accounted for the overall statistical difference found as
a result of analysis of this question's responses. Both clinicians and administrators
apparently recognize the difference in training and duties between teachers and
speech/language clinicians.
3.3. Time Analysis
In order to develop a system for time analysis, the author analyzed her
typical workday as a school speech and language clinician through a workday diary
for two weeks. In addition, seasonal variables in caseload such as school speech
and language screening, preschool screening, and annual meetings concerning
students were identified. The various activities conducted during workdays were
assembled as a basis for the time analysis. Each day was broken down into fifteen
minute segments. Activities performed were assigned to the time segments in
order to describe clinician's working days. This time analysis format was
distributed to thirty clinicians representing the various population areas of
Montana, to investigate, in depth, the work schedule of the public school speech
and language clinician.
Selection of the 30 clinicians was based on school populations. A print-out
Reproduced with permission of the copyright owner. Further reproduction prohibited without permission.

56
of the various populations of all the public schools in the state of Montana for the
1983-84 school year was obtained from the Office of Public instruction and the
state's schools were then divided into three groups. Group #1 (10 clinicians)
represented low density population districts which was based on one classroom of
approximately 30 students per grade per school. Elementary schools of up to
approximately 200 students and high schools of up to approximately 150 students
were Included. Group #2 (10 clinicians) was based on two classrooms of
approximately 30 students per grade per school. Elementary schools of up to 500
students and high schools of up to 500 students were included. Group #3 (10
clinicians) encompassed the rest of the state's schools with the highest population
districts. Elementary schools of up to 738 students and high schools of up to
2031 students were included.
The time analysis formats were collected monthly and analyzed by
percentage of tim e/week spent, as related to job and job associated activities of
speech and language clinicians in the public schools. These time analyses were
completed for three monthly periods, which represented the beginning, middle, and
end of the school year. These time periods were assumed to reflect the changes
in job activities throughout the school year. The data were analyzed by population
differences, by seasonal variations, and then by comparison back to the estimate
given by the speech/language clinicians and administrators of job activities on the
questionnaire. The results of the time analyses will be presented and discussed.
Reproduced with permission of the copyright owner. Further reproduction prohibited without permission.
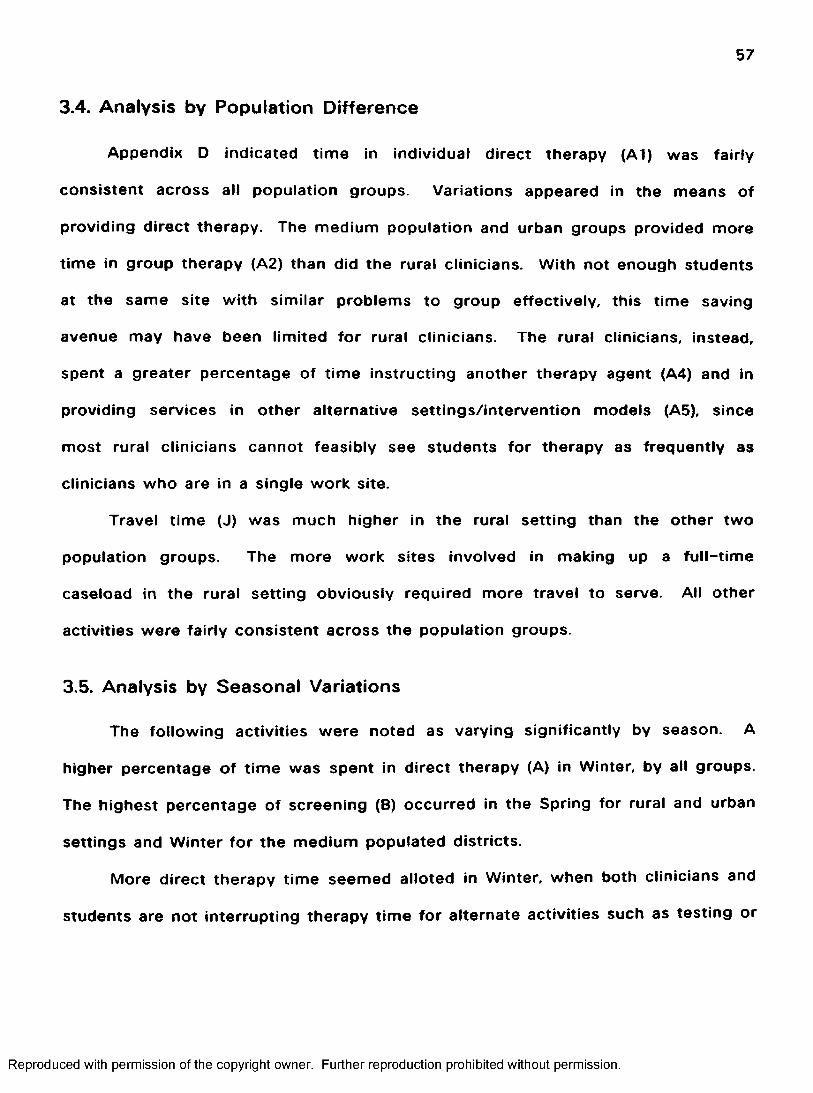
57
3.4. Analysis by Population Difference
Appendix D indicated time in individual direct therapy (A1) was fairly
consistent across all population groups. Variations appeared in the means of
providing direct therapy. The medium population and urban groups provided more
time in group therapy (A2) than did the rural clinicians. With not enough students
at the same site with similar problems to group effectively, this time saving
avenue may have been limited for rural clinicians. The rural clinicians, instead,
spent a greater percentage of time instructing another therapy agent (A4) and in
providing services in other alternative settings/intervention models (A5), since
most rural clinicians cannot feasibly see students for therapy as frequently as
clinicians who are in a single work site.
Travel time (J) was much higher in the rural setting than the other two
population groups. The more work sites involved in making up a full-tim e
caseload in the rural setting obviously required more travel to serve. All other
activities were fairly consistent across the population groups.
3.5. Analysis by Seasonal Variations
The following activities were noted as varying significantly by season. A
higher percentage of time was spent in direct therapy (A) in Winter, by all groups.
The highest percentage of screening (B) occurred in the Spring for rural and urban
settings and Winter for the medium populated districts.
More direct therapy time seemed alloted in Winter, when both clinicians and
students are not interrupting therapy time for alternate activities such as testing or
Reproduced with permission of the copyright owner. Further reproduction prohibited without permission.
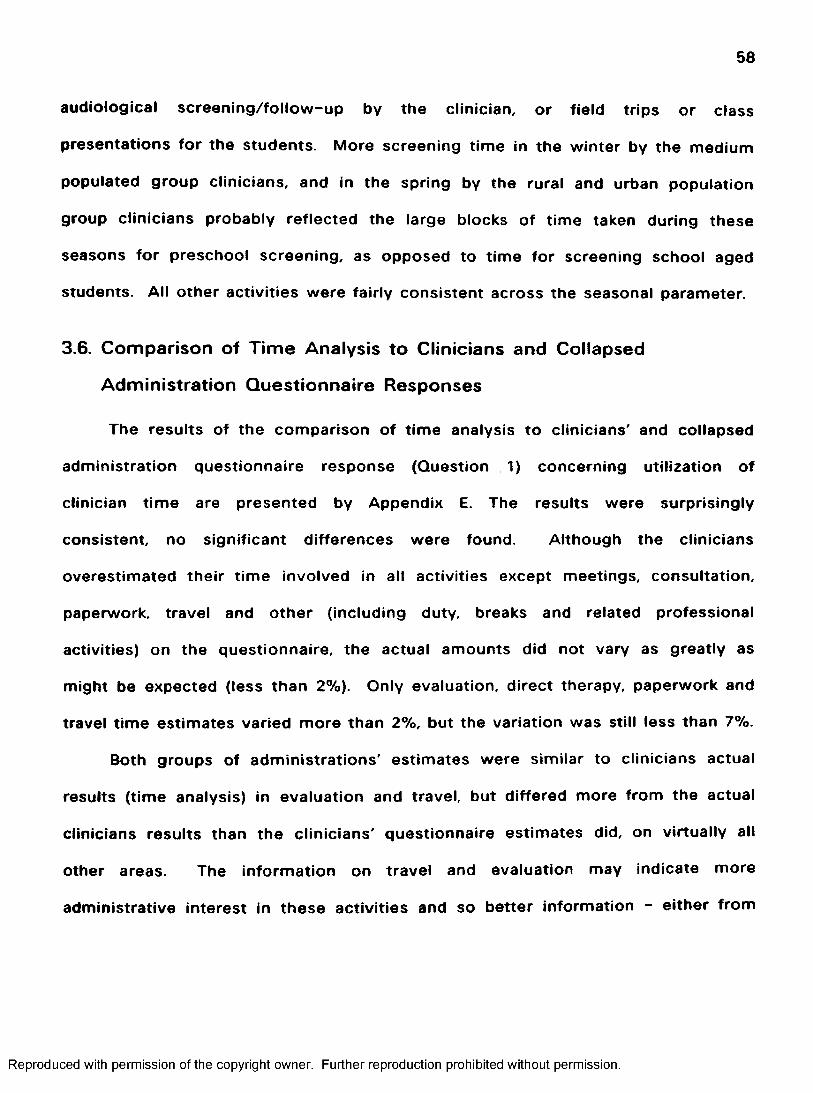
58
audiological screening/follow-up by the clinician, or field trips or class
presentations for the students. More screening time in the winter by the medium
populated group clinicians, and in the spring by the rural and urban population
group clinicians probably reflected the large blocks of time taken during these
seasons for preschool screening, as opposed to time for screening school aged
students. All other activities were fairly consistent across the seasonal parameter.
3.6. Comparison of Time Analysis to Clinicians and Collapsed
Administration Questionnaire Responses
The results of the comparison of time analysis to clinicians' and collapsed
administration questionnaire response (Question 1) concerning utilization of
clinician time are presented by Appendix E. The results were surprisingly
consistent, no significant differences were found. Although the clinicians
overestimated their time involved in all activities except meetings, consultation,
paperwork, travel and other (including duty, breaks and related professional
activities) on the questionnaire, the actual amounts did not vary as greatly as
might be expected (less than 2%). Only evaluation, direct therapy, paperwork and
travel time estimates varied more than 2%, but the variation was still less than 7%.
Both groups of administrations' estimates were similar to clinicians actual
results (time analysis) in evaluation and travel, but differed more from the actual
clinicians results than the clinicians' questionnaire estimates did, on virtually all
other areas. The information on travel and evaluation may indicate more
administrative interest in these activities and so better information - either from
Reproduced with permission of the copyright owner. Further reproduction prohibited without permission.

59
self-study or information sought from the clinicians in their district.
59
Reproduced with permission of the copyright owner. Further reproduction prohibited without permission.

Chapter 4
CONCLUSIONS AND IMPLICATIONS
4.1. Efficient Caseload Descriptors
A plethora of information was obtained from the results of the present study,
however, certain portions related directly to the research questions. The first
research question concerned useful and efficient caseload descriptors by clinicians
and administrators. Four questions from the questionnaire obtained information
relating to this question. The results to Question 3 indicated both clinicians and
administrators described the speech/language clinicians' caseload, based on
communication disorders, in a similar manner. Previous to this result, knowledge
was not available as to what disorders constituted speech/language clinicians'
caseloads. The categories of disorder devised for the questionnaire were
apparently adequate in describing the communication disorders of students seen,
since little use was made of the "other" category. Both clinicians and
administrators indicated a variety of disorders seen for therapy by
speech/language clinicians. The present data gathered statewide, i.e. child-count,
does not begin to describe the types of disorders of children seen by
speech/language clinicians. Question 6 attempted to resolve the current lack of
caseload-by-disorder information for OPI by providing a proposed data system
which would efficiently and accurately describe children seen by speech/language
60
Reproduced with permission of the copyright owner. Further reproduction prohibited without permission.

61
clinicians. OPI could collect this specific disorder information for each child seen,
rather than grouping all children seen for speech/language services together as
"speech impaired" An agreed upon labelling system of speech and language
disorders for child-count was a topic where clinicians and administrators differed
significantly in opinion, with far more clinicians reporting that the current state
labelling system is not acceptable. Both groups of administrators sampled
responded that the label, "speech impaired" was satisfactory. None of the labelling
systems provided as foils for Question 6 were clearly favored by a concensus of
all the sample groups.
Question 7 concerned severity of disorder. Administrators and clinicians
responding to the questionnaire agreed on test performance for a severity index.
The administrators sampled by phone however chose the amount of direct therapy
received each week for determining severity. Severity is not currently described
on child-count forms.
Question 8 related to the first research question; it involved information
regarding record-keeping. Most clinicians and administrators thought their
respective districts had objective documentation procedures. The results of the
study, however, indicated wide diversity in location of students' records and
sharing of student information by appropriate school personnel.
In summary, the caseload disorder classification system used on the
questionnaire was found to be effective to describe the disorders of children seen
by speech/language clinicians. Furthermore, the label currently used by the state
OPI, "speech impaired" was not assessed as adequate by speech/language
Reproduced with permission of the copyright owner. Further reproduction prohibited without permission.

62
clinicians. Severity is not currently addressed by the state wide record-keeping
system and no clear method of choice to rate severity was obtained from the
results of the present study Consistent centralized documentation of caseload
information was also found to be a problem in local school districts.
4.2. Time Allocation
The second study question concerned allocation and utilization of clinician
work time, from the viewpoints of clinicians and administrators. Four questions
from the questionnaire, and the time analysis obtained Information to answer this
question. On Questions 1 and 2, administrators and clinicians both reported that
the clinicians' work schedule and responsibility included time for activities other
than direct therapy. Clinicians' responses differed significantly from the
administrators' (Group 1) for estimates of time scheduled for direct therapy,
screening and travel. The clinicians reported more time scheduled for direct
therapy than the administrators and the administrators reported more time
scheduled for screening and travel than did the clinicians. Administrators in Group
2 reported more time scheduled for screening and in-service in addition to direct
therapy. These results indicated clinicians may need instruction concerning
effective scheduling, relative to job responsibilities. These results again indicated
the administrators have reasonably accurate information concerning the overall
responsibilities of the clinician and the allocation of clinicians' work time.
In relation to the second research question, the time analysis seemed to be
an effective and efficient method of obtaining information regarding the allocation
Reproduced with permission of the copyright owner. Further reproduction prohibited without permission.

63
of clinicians' work time over the school year. Neither the clinicians' or
administrators' estimated responses (obtained from the questionnaire) were
significantly different from the clinicians actual expenditure of time.
Questions 16 and 17 involved the dual services of students by both
speech/language clinicians and other special service providers. Responses to
these questions further described the clinicians' utilization of work time and
defined reasons the activities other than direct therapy are required. For example,
meetings, professional consultation and possibly team preparation time may be
required when a child is being served by more than one special service provider.
Again, the responses from clinicians and administrators indicated the role of the
clinician was understood.
In summary, with regard to time, the clinicians allocated and expended their
work time in a variety of activities - not just in direct therapy. Some training in
scheduling procedure for clinicians may make schedules more accurately describe
actual time utilization procedures. The time analysis was an effective procedure
for describing the actual expenditure of clinicians' work time and is an important
method to continue in order to obtain current information regarding utilization of
time.
The remainder of this chapter will discuss 3 topics: 1) an assessment of
procedures used and results obtained in this study, 2) implications derived from
the results of the present study and 3) suggestions for future research.
Reproduced with permission of the copyright owner. Further reproduction prohibited without permission.

64
4.3. Assessment of Procedures and Results Obtained
Problems of the study were encountered In the questionnaire sampling
method and in comparing the information obtained by the supplemental phone
sampling. In addition, the amount of information solicited and the statistical
analyses used were problematic. These topics will be further discussed.
Adequate responses were obtained to the questionnaire method from
clinicians (38.67%) but a poor return (22.13%) was obtained from the
administrators. The questionnaire sampling method allowed for non-interested
persons to not return the questionnaire. Consequently, the initial low return from
administrators may have been due to a lack of interest on the topic of the present
study. For a questionnaire sampling method to be effective across groups of
subjects, the investigator needs to ensure that the groups are interested to the
same degree or have some way to ensure subjects responding. This was not done
in the initial sampling. Phone sampling data was employed to supplement the
administrators' responses to the original questionnaire, in order to have a sufficient
percentage of response to compare administrators' responses to clinicians'
responses. 40% of the administrators employed in each of the small, medium and
large population districts in the state of Montana were contacted by phone for the
supplemental sampling. Percentages were calculated on the responses and the
administrative responses were collapsed when the responses between the original
questionnaire administrators and the phone sample administrators did not differ
statistically. Only responses to two questions out of nine could be collapsed
across the samples. The three year difference in time between the questionnaire
Reproduced with permission of the copyright owner. Further reproduction prohibited without permission.

65
and phone responses in the administrative groups may have resulted in differences
in opinion and knowledge. Other factors such as new information about
speech/language therapy services in the schools or special education, in general,
and increased accountability caused by decreased funding during this time period
may have also Influenced the difference in the two administrative responses. The
time difference of response between the two administrative samples was clearly a
limitation of this study.
Phone sampling vs. a mailed questionnaire sampling may have allowed for
differences in responding to occur for the two administrative groups. The
investigator could immediately clarify any questions the phone sample
administrators had and ensure all questions were answered. Administrators who
were not interested could chose not to participate in the study. The investigator
could then contact another administrator to ensure an adequate number of
subjects participated in the study in a timely manner. During the phone sampling,
the responses were immediately obtained from subjects and clarification necessary
to understand the questions was easily accomplished. The original questionnaire
sampling method allowed viewing the questions and possible responses,
comparing/changing answers and reconsidering of responses by the subjects. In
addition, the questionnaire format increased objectivity of response, at least
minimized investigator bias and increased confidentiality of responses. Overall,
however, the phone sampling method seemed much more effective in terms of
controlling the amount of responding needed in as short a time as possible.
Another limitation of the present study concerned the amount of information
Reproduced with permission of the copyright owner. Further reproduction prohibited without permission.

66
collected. Sampling both clinicians and administrators with the original
questionnaire method provided study of a wide variety of interesting topics from
two major viewpoints involved in delivery of speech/language services: the
clinicians who provide the actual services and the administrators who make
decisions regarding the clinicians and services. Perhaps in recognition of the
scope of the presenting problems, i.e. amount of information solicited and number
of subjects sampled, the amount of information included in the questionnaire made
the study unwieldy. Narrowing the focus of data to be obtained would have
resulted in a more concise/precise study. The study could have effectively been
narrowed by limiting to the topics which related directly to the thesis questions:
caseload descriptors and time allocation.
Statistical problems were caused by the different types of information
collected in the study. Statistical analysis of the frequency of response questions
was accomplished by the chi^ square method and percentage of response
questions acomplished by the t test for independent means. More careful question
formation and consideration of the statistical analysis necessary to analyze those
questions would have allowed a uniform statistical analysis to be conducted. With
the same answer format for all questions, one statistical analysis test could have
been employed consistently for more uniformity and for comparison of responses
across questions
Several problems were found in the design of this study Changing the
sampling method, to ensure an adequate number of subjects responding in a
uniform manner, limiting the amount of information obtained, and designing the
Reproduced with permission of the copyright owner. Further reproduction prohibited without permission.

67
types and numbers of questions to allow for consistent application of statistical
procedures are suggested as means to minimize the problems encountered.
4.4. implications
The results of the present study have several practical implications. A need
was demonstrated for collecting and sharing of information with OPI personnel,
school administrators, legislators, etc.. OPI does not collect descriptive
information, other than numbers and ages of children seen (child-count). This
study resulted in effective procedures to collect information on description of
caseload by disorder and expenditure of clinicians' work time. OPI has no direct
knowledge of these topics at the present time. Awareness of this information may
enhance the administration and provision of speech/language services in the state.
The clinician time analysis data and some form of caseload description data
should be collected as tools to provide ongoing accurate information.
Administrators at any level would probably not be interested in collecting
additional information concerning these topics. A professional organization, such
as MSHA, for example, could direct specific clinicians to collect the time analysis
data and have a committee/individual analyze the information on a regular basis.
Following analysis, data could then be distributed to legislators, OPI, MSHA
members and administrators. Data collected on such topics as duties and
responsibilities of those in the profession in the public schools, continuing
education experiences and needs, in-service and training would be useful to MSHA
and clinician education institutions to provide appropriate current instruction. This
Reproduced with permission of the copyright owner. Further reproduction prohibited without permission.

68
information about time expenditure and caseload description would also be useful
to the clinicians to compare to their own situations. Comparison of a clinician's
speech/language therapy program to others in the state would allow for a more
objective examination of a specific program. Legislators, OPI and administrators
could use the data provided to examine the current service provision system in the
state. For example, legislators and OPI might examine the information from the
time analysis which demonstrated discrepancies in work activities between the
small, medium and large school districts. This additional information might provide
a better work load distribution for the various district sizes. If data from all
therapists are collapsed as is the method at present, regardless of school district
size, then the state and federal government officials must be aware that the results
of the data collected do not present the differences found in service provision for
the various population size districts. For example, the allocation of time involved
in direct therapy and travel by the rural districts was much different than for the
more populated districts. Consequently, the expected total number of students per
caseload should differ for different sized populations on the present child-count
form. Data collected describing caseloads more accurately could also be useful to
OPI and legislators. Recommended numbers of students per caseload should be
lower when a wide variety of types of disorders are seen for services in a district,
as opposed to more limited types of disorder. A clinician that provides service to
a greater number of articulation cases can serve more students effectively than a
clinician with students whose disorders include many types of communication
problems. Caseload description and time utilization information by population size
Reproduced with permission of the copyright owner. Further reproduction prohibited without permission.

69
are therefore important sources of information for administrators and the state
legislators to have when making decisions concerning funding of special education
services.
Considering current restricted funds at all government levels and the
changing expanded roles for the speech/language clinician, distribution of the more
accurate descriptive information to decision makers is critical. Decision makers
must have accurate and descriptive information to help them understand the
importance of speech/language (special education) services and to make them
aware of the impact of financial decisions. Legislators and OPI personnel are
currently basing funding decisions of speech/language positions and services on
information (child-count) that does not address caseload description except as
"speech impaired" or clinician time utilization other than direct therapy. As a result
of the distribution of the more accurate descriptive information discussed here to
legislators, OPI, administrators and MSHA members, one further implication exists.
Once the information has been supplied to these individuals and organizations,
equalization of funding and services should result.
In response to the lack of centralized documentation of speech/language
therapy information described in this study, a consistent means for documenting
and recording students' changes in speech/language therapy and other special
education services, should be developed. A committee of OPI personnel,
administrators, and speech/language clinicians, representing the various factions of
the service provision system, would be an effective group to devise consistent
documentation procedures. OPI could create and oversee a committee of these
Reproduced with permission of the copyright owner. Further reproduction prohibited without permission.

70
various professionals directed to determine a consistent statewide policy regarding
what special education records are kept where and by whom. All personnel
involved in serving a child must have access to pertinent Information concerning
that child. This information would include all related special education information
such as; the results of speech and language screening and testing, hearing
screening, type, setting and educational significance of special service and
progress of the student. Consistent information sharing is necessary for effective
treatment when more than one individual is involved with a student. This sharing
avoids needless repetition of testing by different special education personnel and
counterproductive treatment methods; it allows for information sharing among
various professional areas to determine optimum setting and therapy for a child
receiving multiple services. The documentation policy formulated by this
committee could be monitored by the state during its present audit procedure to
ensure statewide follow-through.
In conclusion, several types of information are recommended to be collected
on an on-going basis. Time analysis of speech/language clinicians' work time,
caseload descriptor information and a centralized policy or procedure for speech
and language and other special education data are suggested to be devised,
implemented and monitored. Distribution of the information resulting from these
would provide more accurate information to make informed decisions. Informed
decisions may allow for better expenditure of funds and result in improved
provision of special education services. The data collection must be ongoing to
provide the most current information on which to base these critical decisions.
Reproduced with permission of the copyright owner. Further reproduction prohibited without permission.

71
4.5. Resulting Topics for Future Research
The following section will discuss future research topics. The development
of a labelling system for child-count suggested by this study would require future
analysis. A MSHA committee could propose the labelling system and test its
usage on specific clinicians If the system proved effective and efficient, it could
be introduced statewide.
Another future research topic would be replication of the results of this
study with other clinicians and administrators. In addition to these two groups,
other persons make decisions concerning the speech/language profession, such as
local school boards, the general taxpaying public and state and federal legislators.
These would be useful groups to assess in future, since they too need to be
involved and informed.
Another topic for future research is to evaluate whether or not the
information collected and presented to decision makers is worthwhile. An analysis
of legislators', OPIs' and administrators' decision making, following a period of
being provided with more accurate descriptive information could be done to
evaluate whether changes in funding or services actually result from having this
information available.
To summarize, several topics are suggested for future research by the
present study. Analysis of a proposed labelling system for efficiency and
effectiveness before statewide usage is suggested. Also, the present study needs
to be evaluated for reliability and validity.
Reproduced with permission of the copyright owner. Further reproduction prohibited without permission.

72
4.6. Conclusion
The present study described speech/language clinicians' time allocation and
caseloads from the viewpoint of speech/language clinicians and school
administrators. Numerous and diverse changes have occurred during the last
several years in speech/language therapy services in the public schools. Those
not directly involved in speech/language therapy services in the schools such as
legislators, apparently have not realized the magnitude of these changes or the
effect these changes have on the various population size districts of the state of
Montana. Data documenting the need for work time, equipment, training, etc. must
be collected on an ongoing basis to provide accurate information on which to base
financial decisions. Child-count, the state's present data collection instrument for
special education does not obtain this information. Administrators and clinicians
need to work together to provide current descriptive information to decision
makers who are more removed from the actual service provision. The results of
the study demonstrated avenues to collect time utilization information and more
descriptive caseload information. Record keeping of student information at the
local level also needs to be centralized and standardized. Information regarding
accurate labelling of students seen for services and time utilization when provided
to those making funding decisions should allow for informed decisions to occur
regarding services to handicapped children and increase accountability in
distribution of state and federal funds.
Reproduced with permission of the copyright owner. Further reproduction prohibited without permission.

73
Appendix A
Questionnaire
Position; ________ School Superintendent_ _ _ _ _ _ Snecinl Education Cooperative Director________ Speech/Lanv.uage Clinician________ Other (please specify) __________________
Employed by:
Address:
The people attending the Language Conference at the University of Montana held in the summer of 1982 exnressed concern about the data collection system employed by speech/language professionals on the state's Special Education Child Count form. They requested that the system be improved to more accurately reflect the make-up of the speech/language clinicians' caseload and work time. This project is designed to recommend modifications in the current speech/language portion of the State Special Education Child Count.
On the present child count form, children seen only by the soeech/language clinician are designated as belonging to a single category: speech impaired.There can be confusion in documenting the speech/language clinician's intervention time for children who are listed under another handicapping condition, since children seen by more chan one professional for services can only be counted once for funding purposes.
We are also seeking information about how speech/language clinicians allocate time in order to more adequately describe professional responsibilities.
A position paper will be written to reflect opinions of those persons completing this questionnaire. The paper will be used to provide information for consideration in improving the data keeping and continuity in speech/language programs in the State Office of Public Instruction and to the Montana Speech, Language and Hearing Association.
Please utilize data from the 1983-84 school year.
Please note approximate percentage (based on ICO percent) of time/year utilized in the following activities:
d irect therapy professional audiology_______screening consultation follow-up
evaluation paper work _______travelother (specify)jneetings in-service
_monitoring (client) _______ parent counseling/_preparation time conferences
Reproduced with permission of the copyright owner. Further reproduction prohibited without permission.

74
QUESTIONNAIRE
2. Does the speech/language clinician in your school(s) have tine allocated in their schedule for any of the above? Yes NoIf yes, please note approximate percentage (based on 100 percent) of scheduled time/year :
direct t h e r a p y _______ professional audiologyscreening consultation follow-upevaluation _______ paper work _______ travel
in-service other (specify)jnonitoring (client) _______ parent counseling/ ______ '_preparation cine conferences
3. Please note approximate percentage (paged on 100 percent) of the speech/ language clinician's caseload by appropriate disorder:
_______ articulation _______ fluency_______ language _______ hearing impaired_______ language (written) articulation/language_______ language learning disabled ________ other (please specify)
voice
4. Please describe or attach a copy of the objective criteria used for including students in a caseload.
3. For optimum progress, are there children seen in the speech/languageclinicians' caseload who could benefit from more therapy time than they presently receive? _______ Yes NoIf yes, please note approximate oercentage (based on 100 percent) of caseload affected,by appropriate disorder:
_______ articulation _______ fluency_______ language _______ hearing impaired
language (written) articulation/languagelanguage learning disabled _______ other (please specify)voice
Are children seen by the speech/language clinician(s) and labeled speech- impaired on the current special education child count form who could be more specifically labeled? _______ Yes _______ NoIf yes, please check the labeling system below that you feel would be more appropriate.
communication disability language disordervoice/fluency disorder articulation disorder
(continued)
Reproduced with permission of the copyright owner. Further reproduction prohibited without permission.
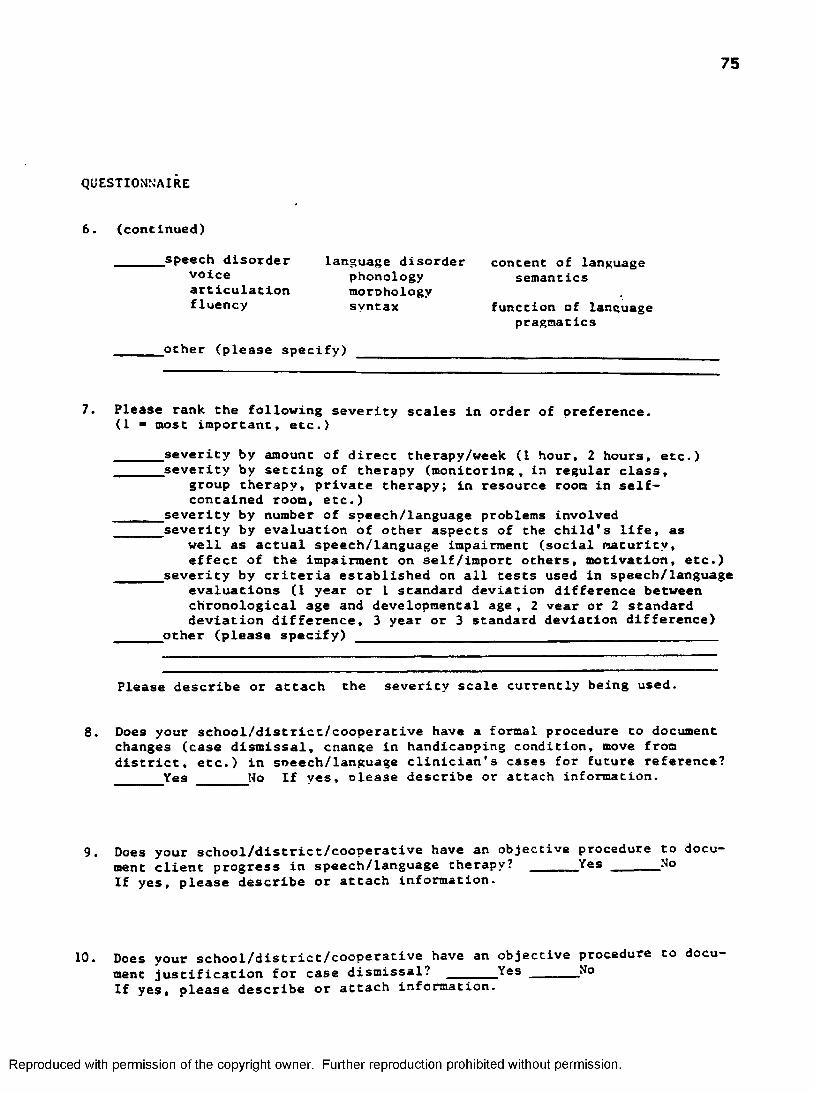
75
QUESTIONNAIRE
6. (continued)
speech disorder language disorder content of language voice phonology semanticsarticulation morohologyfluency syntax function of language
pragmatics
other (please specify)
Please rank the following severity scales in order of preference.(1 ■ most important, etc.)
_______ severity by amount of direct therapy/week (1 hour, 2 hours, etc.)_______ severity by setting of therapy (monitoring, in regular class,
group therapy, private therapy; in resource room in self- contained room, etc.)
severity by number of speech/language problems involved_______ severity by evaluation of other aspects of the child's life, as
well as actual speech/language impairment (social maturity, effect of the impairment on self/import others, motivation, etc.)
_______ severity by criteria established on all tests used in speech/languageevaluations (I year or 1 standard deviation difference between chronological age and developmental a g e , 2 vear or 2 standard deviation difference, 3 year or 3 standard deviation difference)
other (please specify)
Please describe or attach the severity scale currently being used.
8. Does your school/district/cooperative have a formal procedure to document changes (case dismissal, cnange in handicaoping condition, move from district, etc.) in sneech/language clinician's cases for future reference? _______Yes No If yes, olease describe or attach information.
Does your school/district/cooperative have an objective procedure to document client progress in speech/language therapy? _______Yes _______ NoIf yes, please describe or attach information.
10. Does your school/district/cooperative have an objective procedure to document justification for case dismissal? _______ Yes ______ N̂oIf yes, please describe or attach information.
Reproduced with permission of the copyright owner. Further reproduction prohibited without permission.
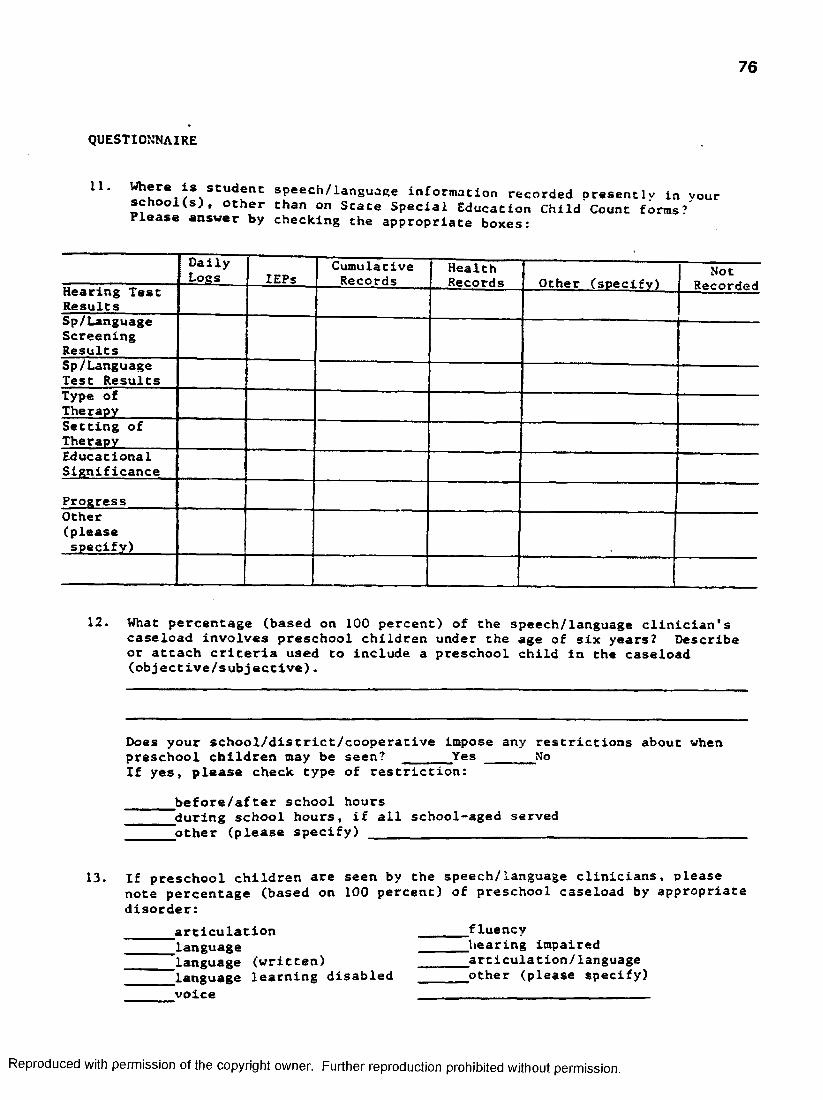
76
QUESTIONNAIRE
11. w speech/language information recorded presently in yours c h o o K s ) , other chan on State Special Education Child Count forms? Please answer by checking the appropriate boxes:
DailyLogs lEPs
CumulativeRecords
HealthRecords
1 Not Other (specify) 1 RecordedHearing Test
ResultsSp/LanguageScreeningResultsSp/Language Test ResultsType of TherapySetting of TherapyEducationalSignificance
ProgressOther(pleasespecify)
12. What percentage (based on 100 percent) of the speech/language clinician's caseload involves preschool children under the age of six years? Describe or attach criteria used to include a preschool child in the caseload (objective/subjective).
Does your school/district/cooperative Impose any restrictions about whenpreschool children may be seen? _______Yes NoIf yes, please check type of restriction:
_______ before/after school hours_______ during school hours, if all school-aged served
other (please specify)
13. If preschool children are seen by the speech/language clinicians, pleasenote percentage (based on 100 percent) of preschool caseload by appropriate disorder:
articulation_languagelanguage (written) 'language learning disabled voice
fluencyhearing impaired _articulation/language other (please specify)
Reproduced with permission of the copyright owner. Further reproduction prohibited without permission.
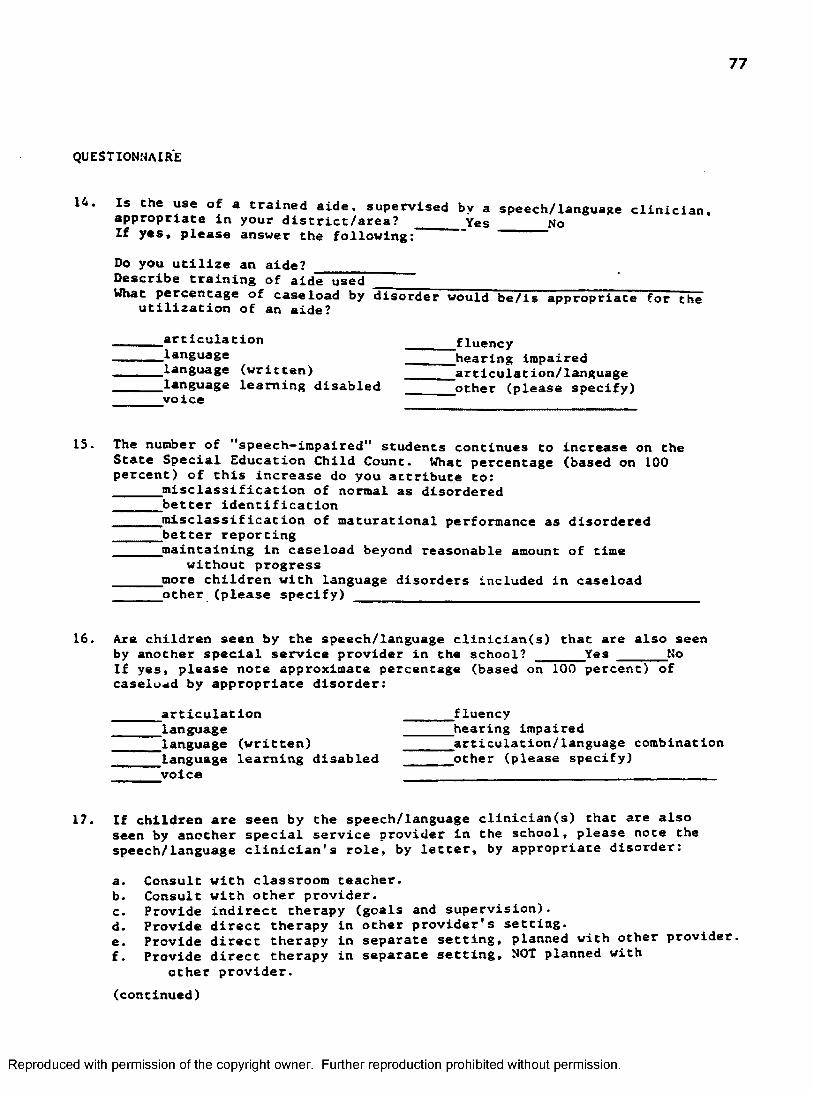
77
QUESTIONNAIRE
14. Is the use of a trained aide, supervised by a speech/language clinician,appropriate in your district/area? ____ Yes NoIf yes, please answer the following: — —
Do you utilize an aide?Describe training of aide usedWhat percentage of caseload by disorder would be/is appropriate for the
utilization of an aide?
articulation_languagelanguage (written) language learning disabled voice
fluencyhearing impaired articulation/language other (please specify)
15. The number of "speech-impaired" students continues to increase on the State Special Education Child Count. What percentage (based on 100 percent) of this increase do you attribute to:_______ misclassification of normal as disordered_______ better identification
misclassification of maturational performance as disordered better reportingjnaintaining in caseload beyond reasonable amount of time
without progress jnore children with language disorders Included in caseload other (please specify) ____________________________________________
16. Are children seen by the speech/language clinician(s) that are also seenby another special service provider in the school? _______ Yes _______ NoIf yes, please note approximate percentage (based on 100 percent) of caseload by appropriate disorder:
articulationlanguagelanguage (written) language learning disabled voice
fluencyhearing Impaired^^articulation/language combination other (please specify)
17. If children are seen by the speech/language clinician(s) that are also seen by another special service provider in the school, please note the speech/language clinician’s role, by letter, by appropriate disorder:
a. Consult with classroom teacher.b. Consult with ocher provider.c. Provide indirect therapy (goals and supervision).d. Provide direct therapy in other provider’s setting.e. Provide direct therapy in separate setting, planned with other provider.f. Provide direct therapy in separate setting, NOT planned with
other provider.(continued)
Reproduced with permission of the copyright owner. Further reproduction prohibited without permission.

78
QUESTIONNAIRE
17. (continued)
^articulation _______ fluencylanguage _______ hearing impairedlanguage (written)____________ _______ articulation/languagelanguage learning disabled _______other (please specify)voice
18. Please note who currently evaluates the speech/language clinician(s) job performance in your s c h o o l ( s ) _________________Do you think that this person(s) is knowledgeable enough to evaluate thespeech/language clinician's role in the school setting? _______Yes NoThe speech/language clinician's professional competence? _______Yes NoIs the speech language clinician advised of evaluation criteria prior to observation? _______ Yes No
19. VThat other information would you like to see included on the federal/ state mandated child-count form?
20. Are there other data you would find useful to your professional accountability? _______ Yes _______ NoIf yes, please describe or attach information.
21. Would you describe the speech/language clinician as:
a teacher with special responsibilities"a rehabilitation professional providing services in the schoolother (please specify)
Reproduced with permission of the copyright owner. Further reproduction prohibited without permission.

Appendix B 79
Time Analysis Forms
NAME:
DATE:
8 - C C
9:cc
|C CO
u , e c
i l .c c
SCHOOLS SER-/ÏD: >'0V.ruEsl
MON, TOES. 'ÆD. THURS. FRI.
3 ;0 c
4:00
'ÆD.THURS.FRI.
.CIRZCr TrZRAPY1, Individual2. Group3» Classroom
Other agent 5. Other
EN’ING
C.EVALUATION
D..MEE7I?.’G5 t. CSX2. E F3. special E d m
4. Faculty
S.CONSULTATION Ï. Parent2. Teacher3. Other
F.PAJreHWORX
G.HCNTTCRDJG
H.AULICLOGICALI.IN-SERVICE
1. Presenting2, Receiving
J.TiU’/El
K.SUTY1. Playground/Hall2. Lunchroom
L.LUNGH/3REAKS
H.REL. PRCFESSICNAL
Reproduced with permission of the copyright owner. Further reproduction prohibited without permission.

80
Please complete one form each week* Each hour is divided into 15 minute segments. Place appropriate letter (and number) in appropriate block* Please record to nearest 15 minute segment.
A. BlftfcCT THERAPY I 2^10* spent directly with student in individual therapy^Time spent directly with students in group therapy ^Time spent with student(s) in classroom Time spent instructing other therapy agent(trained aide, gparent, co-orofessional)'Other setting/intervention model
B* SCREENING; Time spent screening speech/language
C* EVALUATION ; Time soent in complete speech/language evaluation procedure with student
1D. MEETINGS ; ‘Time spent in Child Study Team meeting
^Tirae spent in Individualized Education Program meetingTime spent in special education personnel meetingTime spent in faculty meeting
E . CONSULTATION; gTime spent with parent, discussing child^Time spent with teacher, discussing student"^Time spent with other professionals, discussing student(Include telephone contact)
F. PAPERWORK; Time spent writing reports, preparing forms, lesson plans, dallylogs
G . y C N I T ΠI N G ; Time spent following speech/language progress of student no longer in therapy
h, AULIOLCGICAL FOLLOW-UP; Time spent delivering/oroviding information on audio-logical screenings, evallations and medical treatment
I. IN-SERVICE ; ^Time spent presenting to any groupTime spent receiving informations may or may not directly relate to your profession)
J. TRAVEL; Time spent in the car or walking during working day\not including to and from work)
K. DUTY; ^Tim* spent monitoring playground/halls ^ i m m spent monitoring lunchroom
L. TMxrH/AREars. Time not spent on A - & abovey , related PROF-SSICKAL ACTIVITIES/CONTINUING EDUCATION; Time spent gathering/
----- receiving"information directly related to your profession - not duringworking hours
Reproduced with permission of the copyright owner. Further reproduction prohibited without permission.

81
Appendix C
Range of Scores from Questionnaire for Administrators & Clinicians
#1
direct therapy
screening
evaluation
Ad^
6-9 0
0-13
0-18
Ad-
14-95
0 - 2 0
0 - 2 0
Clinicians
10-84
0-15
1-18
meetings
monitoring(client)
preparation time
professionalconsultation
paper work
rn-service
parent counseling/ conferences
audiologyfollow-up
travel
0-5
0 - 6
0-15
9-15
0-15
0-15
0-10
0-10
0-25
0-10
0-25
0-12
0-70
0-30
0-9
0 - 2 0
0-5
0-50
. 3-10
0 - 2 0
0-14
0-10
0 - 2 0
0-5
0-10
0-5
0-32
Reproduced with permission of the copyright owner. Further reproduction prohibited without permission.

82
#2
direct therapy
screening
evaluation
meetings
monitoring (client)
preparation time
professionalconsultation
paper work
in-service
parent counseling/ conferences
audiologyfollow-up
travel
Ad^
49-81
1-15
0-13
0-5
0-5
0-10
0-5
0-10
0-5
0-5
0 - 2
0-47
Ad' Clinicians
No data 30-96
0-10
.008-20
0 - 6
0-3
0-7.5
0-3
0-7 . 5
0 - 2
0-10
0-1
0-30
Reproduced with permission of the copyright owner. Further reproduction prohibited without permission.

83
#3 Ad2 Adi Clinicians
articulation 1-100 0-100 0-90language 0-50 0-100 0-70language (written) 0-30 0-20 0-30language learning
disabled 0-50 0-40 0-85
voice 0-12 0-12 0-11fluency 0-30 0-30 0-22hearing impaired 0-50 0-25 0-15articulation/
language0-50 0-100 0-60
#5 Ad^ Ad2 Cliniciansarticulation None None 0-64language 5-80language (written) 0-30language learning
disabled0-44
voice 0-1
fluency 0-20
hearing impaired 0-20
articulation/ 0-80language
Reproduced with permission of the copyright owner. Further reproduction prohibited without permission.

84
# 1 2 Ad0-30
Clinicians0-50
#13 Ad Clinicians
articulationlanguagelanguage (written)language learning
disabledvoicefluencyhearing impairedarticulation/
language
0-1000-270
0-40
0
0 - 2 0
0-950-50
0 - 6 6
0-800
0-50
0 - 2 0
0-500 - 2 0
0-100
#15 Ad Clinicians
misclass. of normal
betteridentificationmisclass. of
maturationalbetter reportingmaintaining in
caseloadmore children
0-500-100
0-40
0-500-25
0 — 100
0-700-80
0-40
0 — 50 0-30
0-100
Reproduced with permission of the copyright owner. Further reproduction prohibited without permission.

85
#16 Ad' Ad' Clinicians
articulation 0-80 0-50 0-100language 0-25 0-100 0-6 0language (written) 0-10 0-55 0-10language learning
disabled0-100 0-100 0-100
voice 0-10 0-33 0-10fluency 0 — 10 0-50 0-10hearing impaired 0-50 0-50 0-10articulation/ 0-80 0-100 0 — 100
language
Reproduced with permission of the copyright owner. Further reproduction prohibited without permission.

Appendix D
86
Clinician Time Analysis ResultsFall Quarter, 1 9 3 4
Semi-
Al Direct Therapy: Time soent d i r e c t ly with student in indiv idual therapy
24.dO% 24.50% 34.20%
AZ D irect Therapy: Time spent d ire c t ly with student in group therapy
[ 9.30 ......19:50.....- ... ig. 60
A3 D irect Therapy: Time spent with student(s) in classroom
.10 2.80 1.10
A4 D irect Therapy: Time spent instructing other therapy agent (tra ined a ide, parent, co- professional )
1.10 .50
As D irec t Therapy: Other s e t t in g / intervention model
.60 .30
U Screening: Time spent screening speech/language
.40 .90 2.80
0 Evaluation: t"ime spent in complete speech/language evaluation procedure w ith student
4.90 1.80 5.40 ■
Ol Meetings: Time spent in Child Study Team Meeting
1.50 1.20 2.60
02 Meetings: Time spend in Ind iv idualized Education Program Meeting
2.0 1.00 .70
03 Meetings: Time spent in Special Education Personnel Meeting
1.30 .30 .80
O4 Meetings: Time spent in facu lty meeting
.60 .90 .10
El Consultation; Time spent with parent, discussing c h i ld
1.80 2.30 3.20
E2 Consultation: Time spent with ffarher. disrupting student
2.80 3.50 3.50
E3 Consultation: Time spent with other professionals , discussing student (inc lude telephone contact)
1.80 1 .10 1.10
F Paperwork: Time spent w rit ing reports, preparing forms, lesson plans, d a i ly logs
14.80 16.40 13.60
G Monitoring: Time spent f o l lowing speech/language progress of student no longer in therapy
.50 .60 .40
h Audioloqical Follow-up: Time spent d e l ive r in g /p ro v id in g information on aud io logical screenings, eva lua tions , and medical treatment
.20 3.70 1.00
Reproduced with permission of the copyright owner. Further reproduction prohibited without permission.
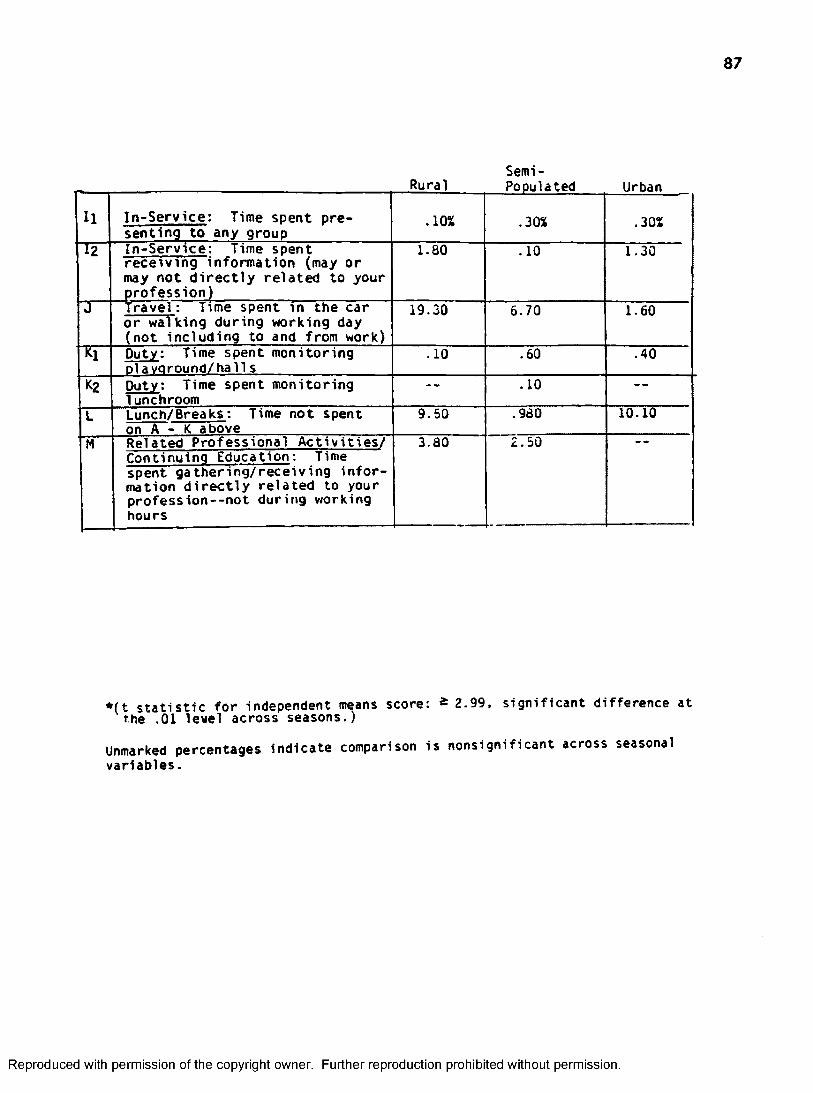
87
Semi-
u In -S e rv ic e : Time spent presenting to any group
.10% .30% .30%
l2 In -S erv ice : Time spent rece iv ing information (may or may not d i r e c t ly re la te d to your profession)
1.80 .10 1.30
J Trave l: Time spent in the car or walking during working day (not including to and from work)
19.30 5.70 1.60
h Duty: Time spent monitoringDlavoround/halls
.10 .60 .40
K2 Duty: Time spent monitoring 1unchroom
- . .10 -------
L Lunch/Breaks: Time not spent on A - K above
9.50 .980 10.10
M Related Professional A c t iv i t i e s / 3.80 2.50Continuing Education: Time spent g a thering /rece iv ing in fo r mation d i r e c t ly re la ted to your profess io n --n o t during working hours
» ( t s ta t is t ic fo r independent means score: * 2.99, s ignificant difference at the .01 level across seasons.)
Unmarked percentages indicate comparison is nonsignificant across seasonal variables.
Reproduced with permission of the copyright owner. Further reproduction prohibited without permission.
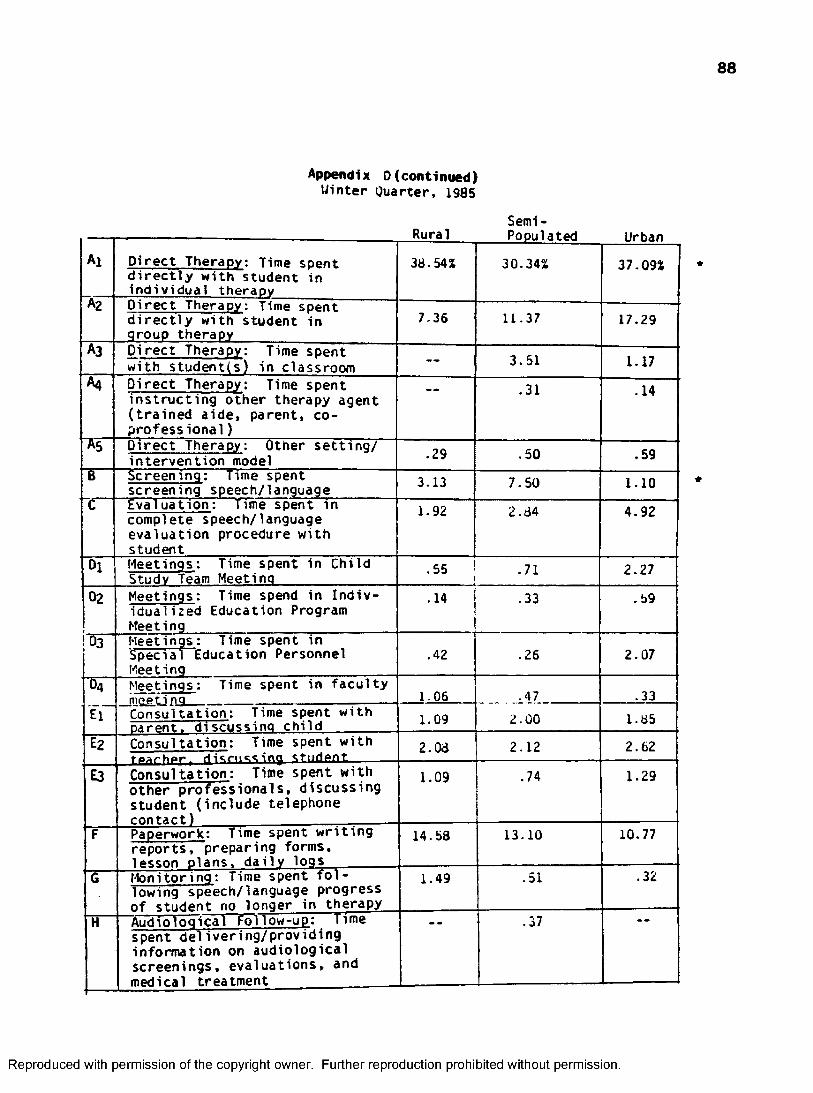
Appendix D(continued)Winter Quarter, 1985
88
Semi-
Al D irec t TheraDv: Time soent d i r e c t ly w ith student in ind iv idual theraov
38.54% 30.34%
ui uori
37.09%
A2 D irec t Therapy: Time spent d i r e c t ly with student in group therapy
7.36 11.37 17.29
A3 D irect Therapy: Time spent with student(s) in classroom 3.51 1.17
A4 D irec t Therapy: Time spent in s tru c tin g other therapy agent ( tra in e d a ide , parent, coprofessional )
.31 .14
As D irec t Therapy; Other s e t t in g / in te rvention model .29 .50 .59
8 Screening: Time spent screening speech/language 3.13 7.50 1.10
C Evaluation: Time spent in complete speech/language evaluation procedure with student
1.92 2.84 4.92
Ol Meetings: Time spent in Child Study Team Meeting
.55 .71 2.27
02 Meetings: Time spend in In d iv idualized Education Program Meeting
.14 .33 .59
!Û3 Meetings: Time spent in Special Education Personnel Meeting
.42 .26 2.07
O4
i r
Meetings : Time spent in fa c u ltymçeti no 1.06 .47 .33Consultation: Time spent w ith oarent. discussing child 1.09 2.00 1.85
Eg Consultation: Time spent w ith fearher, discussing Student 2.08 2.12 2.62
E3 Consultation: Time spent with other p ro fess iona ls , discussing student (inc lude telephone contact)
1.09 .74 1.29
F Paperwork: Time spent w r i t in g reports , preparing forms, lesson plans, d a i ly logs
14.58 13.10 10.77
G Monitoring: Time spent f o l lowing speech/language progress of student no longer in therapy
1.49 .51 .32
H Audiological Follow-up: Time spent d e l ive r in g /p ro v id in g information on audiological screenings, eva luations, and medical treatment
.37
Reproduced with permission of the copyright owner. Further reproduction prohibited without permission.

89
Semi-
u In -S erv ice : Time spent presenting to any group
.16% .06% .07%
l2 In -S erv ice: Time spent rece iv ing information {may or may not d i r e c t ly re la ted to your profession)
- - 2.72 .11
J T ra v e ): Time spent in the car or walking during working day (not including to and from work)
16.43 8.01 1.62
Ki Duty; Time spent monitoring Dlavoround/hall s .18 .32 .67
K2 Duty: Time spent monitoring lunchroom
- - --- - -
L Lunch/Breaks: Time not spent on A - K above
9.50 8.27 12.25
M Related Professional A c t iv i t i e s /2.11 .85Continuing Education; Time
spent gathering /rece iv ing in fo r mation d i r e c t ly re la te d to your profession— not during working hours
* ( t s ta t is t ic fo r independent means score; - 2.99, s ignificant difference at the .01 level across seasons.)
Unmarked percentages indicate comparison is nonsignificant across seasonal variables.
Reproduced with permission of the copyright owner. Further reproduction prohibited without permission.
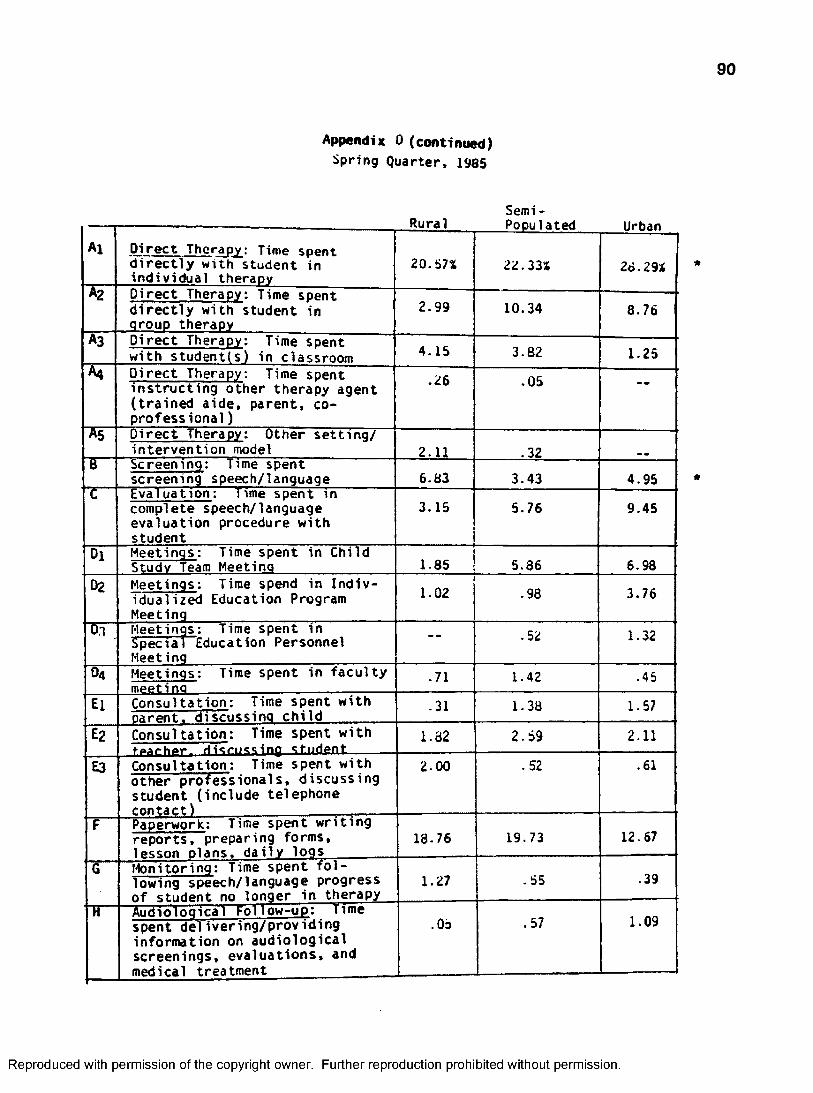
Appendix 0 (continued)Spring Quarter, 1985
90
Semi -
Al D irect Therapy: Time snent d i r e c t ly with student in indiv idual therapy
20.57%
rvk̂W 1 a kCU
22.33%
uroan
28.29%
A2 D irec t Therapy: Time spent d ir e c t ly with student in group therapy
2 . 9 9 10.34 8.76
A3 D irect Therapy: Time spent with student(s) in classroom 4.15 3.82 1.25
A4 D irec t Therapy: Time soent ins tru cting other therapy agent ( tra in ed a ide, parent, coprofessional )
.26 .05 - -
As D irec t Therapy: Other s e t t in g / in tervention model 2.11 .32
6 Screening: Time spent screening speech/language 6.83 3.43 4.95
C Evaluation: time spent in complete speech/language evaluation procedure with student
3.15 5.76 9.45
Dl Meetings: Time spent in Child Study Team Meeting 1.85 5.86 6.98
02 Meetings: Time spend in In d iv idualized Education Program Meeting
1.02 .98 3.76
Dl Meetings: Time spent in Special Education Personnel Meeting
- - .52 1.32
O4 Meetings: Time spent in fa c u lty meetino
.71 1.42 .45
El Consultation: Time spent w ith oarent. discussing ch ild
.31 1.38 1.57
E2 Consultation: Time spent w ith fAArhpr. rtism-tsino student
1.82 2.59 2.11
E3 Consultation: Time spent with other professionals, discussing student (include telephone contact)
2.00 .52 .61
F Paperwork: Time spent w rit in g reports , preparing forms, lesson plans, d a i ly logs
18.76 19.73 12.67
G Monitoring: Time s p e n t / fo l lowing speech/language progress o f student no longer in therapy
1.27 .55 .39
H Audiological Follow-up; Time spent de liver in g /prov id ing information on audiological screenings, eva luations, and medical treatment
.05 .57 1.09
Reproduced with permission of the copyright owner. Further reproduction prohibited without permission.

91
Appendix 0 (continimd)
Total (Year Average)
Semi-
Al D irec t Therapy: Time spent d i r e c t ly w ith student in ind iv idual therapy
nura 1
27.97%
populated
28.96%
Urban
29.96%
A2 D irect Therapy: Time spent d i r e c t ly w ith student in qrouo therapy
6.5b 12.44 15.18
A3 D irect Therapy: Time spent with student(s) in classroom 1.45 2.81 1.74
A4 D irec t Therapy: Time spent in s tru c tin g other therapy agent ( tra in e d a id e , parent, coprof ess ional )
8 . 6 6 .29 .41
As D irec t Therapy: Other s e t t in g / in te rvention model 1 . 2 0 .27 .30
B Screening: Time spent screening speech/language 3.45 4.58 2.32
t Evaluation: Time spent in complete speech/language evaluation procedure w ith student
3.32 4.67 5.39
Ol Meetings; Time spent in Child Study Team Meeting 1.30 3.02 3.48
02 Meetings: Time spend in In d iv idualized Education Program Meeting
.45 .67 1.78
03 Meetings: Time spent in Special Education Personnel Meeting
.57 .53 1.23
04 Meetings: Time spent in facu lty mppM no .79 . 6 6 .56
El Consultation: Time spent with narent. discussing ch ild
1.07 2.19 1.91
Eg Consultation: Time spent with tparhpr. discussing student
2.23 2.74 2.74
E3 Consultation: Time spent with other pro fess iona ls , discussing student (inc lude telephone contact)
1.63 .79 1 . 0 0
F Paperwork: Time spent w r it in g reports , preparing forms, lesson plans, d a i ly logs
16.05 15.48 13-28
G Monitoring: Time spent f o l lowing speech/language progress of student no longer in therapy
1.09 .49 .44
H Audioloqical Follow-up: Time spent d e liv e r in g /p ro v id in g information on audiological screenings, eva luations, and medical treatment
.08 .65 1.60
Reproduced with permission of the copyright owner. Further reproduction prohibited without permission.

92
Semi-
u In -S e rv ic e : Time spent presenting to any group
.09% . 12% .16%
l2 In -S erv ice : Time spent rece iv ing information (may or may not d i r e c t ly re la te d to your profession)
1.30 2.15 .60
J Travel: Time spent in the car or walking during working day (not including to and from work)
16.32 5.02 3.25
Kl Duty: Time spent monitoring Dlavoround/halls 1.76 .49 .52
K2 Duty: Time spent monitoring lunchroom
- - .03
L Lunch/Breaks: Time not spent on A - K above 10.08 8.89 11.03
M Related Professional A c t iv i t i e s / Continuing Education: Time spent ga thering /rece iv ing in fo r mation d i r e c t ly re la te d to your profess ion--not during working hours
1.27 1 . 6 6 1.75
* ( t s ta t is t ic fo r Independent means score: ^ 3.67, s ignificant difference a t the . 0 1 le v e l . )
Unmarked percentages indicate comparison is nonsignificant across population sizes.
Reproduced with permission of the copyright owner. Further reproduction prohibited without permission.

93
Semi
Il In -S erv ice : Time spent presenting to any group
— % - - % .12%
l2 In -S erv ice : Time spent rece iv ing information (may or may not d i r e c t ly re la te d to your profession)
2.10 2.44 1.58
J Trave l: Time spent in the car or walking during working day (not including to and from work)
13.23 5.44 1.43
Kl Duty: Time spent monitoring olavqround/halls 4.99 .76 .29
K2 Duty: Time spent monitoring lunchroom — — — —
L Lunch/Breaks: Time not spent on A - K above 11.23 a . 29 11.05
M Related Professional A c t iv i t i e s / Continuing Education; Time spent ga thering /rece iv ing in fo r mation d ir e c t ly re la te d to your profession—not during working hours
2.38 1.90
* ( t s ta t is t ic fo r independent means score: -2 .99 , s ignificant difference atthe . 0 1 level across seasons.)
Unmarked percentages indicate comparison is nonsignificant across seasonal variables.
Reproduced with permission of the copyright owner. Further reproduction prohibited without permission.

94
Appendix E
Comparlsion of Clinician's Actual Time Expenditure
to Clinicians Questionnaire
Estimate and Adminstration and Phone Sample Estimates
Time Analysis {Clinician)
Questionnaire Results
(Clinician)Questionnaire
Results (Collapsed Admin.)
direct therapy 51.97 58.51 60.47screening 3 .45 3.94 5.15evaluation 4.46 7.93 5.91meetings 5.02 3 . 41 2.94consultation 5.43 4.66 5.70paperwork 14.94 11.81 8.64monitoring . 67 1.74 1.64audioloqical . 78 .92 1.12in-service .12 1 .00 1.46travel 8.20 5.31 7.02other (duty, breaks 4.96 .27 — —
rel. professional)
T test for independent means score. (Administrator Group 1 Administrator Group 2): 36, (Questionnaire Clinicians - TimeAnalysis Clinicians): 1.18, (Time Analysis Clinicians -Collapsed Administrators): .81, not significantly different atthe .01 level. All samples did not differ.
Reproduced with permission of the copyright owner. Further reproduction prohibited without permission.
95
REFERENCES
AMERICAN SPEECH AND HEARING ASSOCIATION, 1975, "Meeting the Needs of children and Adults with Disorders of Language: The Role of the Speech Pathologist and Audiologist". Asha, 17, 273-278.
DES ROCHES, C.P., 1976, "Speech Therapy Services in a Large School System: A 6 Year Overview". Language, Speech and Hearing Services in the Schools, 7, 207-219. 207-219.
DU8LINSKE, S., 1978, "PL 94-142: Developing the Individualized Education Program (lEP)". Asha, 20, 380-393.
GARRARD, K., 1979, "The Changing Role of Speech and Hearing Professionals in Public Education". Asha, 21, 91-98.
LAWS OF MONTANA, 1945, 29th Legislative Assembly, 358.
LAWS OF MONTANA, 1949, 31st Legislative Assembly, 473.
LAWS OF MONTANA, 1953, 33rd Legislative Assembly, 456.
LAWS OF MONTANA, 1955, 34th Legislative Assembly, 452.
LAWS OF MONTANA, 1961, 37th Legislative Assembly, 1969.
LAWS OF MONTANA. 39th Legislative Assembly, 1965, 704
LAWS OF MONTANA. 40th Legislative Assembly, 1967, 202-203.
LAWS OF MONTANA. 42nd Legislative Assembly, 1971, 623
LAWS OF MONTANA. 45th Legislative Assembly, 1977, 1740-1741
OTOOLE, T. AND ZASLOW, E. "Public School Speech and Hearing Programs: Things are Changing". Language, Speech and Hearing Services in the Schools, 1970, 1, 3-9.
REES, N. "The Speech Clinicians Cum Language Clinician, 1974". Language, Speech
Reproduced with permission of the copyright owner. Further reproduction prohibited without permission.

96
and Hearing Services in the Schools, 1974, 4, 185-186.
RUSCELLO, O.M., LASS, N.J., FULTZ, N K , AND HUG, M.J. “Attitudes of Educators Toward Speech-Language Pathology Services in Rural Schools'. Language, Speech and Hearing Services in the Schools, 1980, 3, 145-153.
SPECIAL EDUCATION GUIDELINES. Delores Colburg, Superintendent of PublicInstruction, 1972.
SPECIAL EDUCATION GUIDELINES. Delores Colburg, Superintendent of PublicInstruction, 1974.
SPECIAL EDUCATION RULES AND REGULATIONS REFERENCE MANUAL. Delores Colburg, Superintendent of Public Instruction, 1974.
SPECIAL EDUCATION RULES AND REGULATIONS REFERENCE MANUAL Georgia Rice, Superintendent of Public Instruction, 1977.
SPECIAL EDUCATION REFERENCE MANUAL; MONTANA LAWS AND RULES. Georgia Rice, Superintendent of Public Instruction, 1980.
SPECIAL EDUCATION REFERENCE MANUAL: MONTANA LAWS AND RULES. EdArgenbright, Superintendent of Public Instruction, 1982.
SPECIAL EDUCATION REFERENCE MANUAL: MONTANA LAWS AND RULES. EdArgenbright, Superintendent of Public Instruction, 1986.
STARK, J. "Current Clinicial Practices in Language". Asha, 1971, 16, 217-220.
WEPMAN, J. "New and Wider Horizons for Speech and Hearing Specialists". Asha, 17, 9-10, 1975.
Reproduced with permission of the copyright owner. Further reproduction prohibited without permission.