Embed Size (px)
Citation preview
COMPARISON OF INDOOR AND OUTDOOR AIR QUALITY AT RESIDENTIAL ENVIRONMENT IN TAIWAN BY EXPERIMETERAL MONITOR
Y.C. HUANG1, C.F. CHANG1, and S.H. YANG2
1 Department of Land Management and development, Chang Jung Christian University,
396, Chang-Jung Rd, Kway Jen, Tainan 711, Taiwan, ROC.
2 Graduate Institute of Environmental Engineering, National Taiwan University, 71, Chou-Shan Rd, Taipei, Taiwan 106, ROC.
Keywords: Indoor air quality, Particulate matter, DustTrak Aerosol Monitor.
INTRODUCTION Indoor air quality in workplace and residential environments caught attention of scientists and the public in recent years because people spend more than 87.2% of their time indoors (Lance, 1996). A study has indicated the indoor air pollutant concentration higher than outdoor concentration (Montgomery and Kalman, 1989). Therefore, indoor air quality becomes very important to our health. The sources of the indoor air pollutions are complex, such as outdoor pollutants, building equipments, furnishings, and human activities. Among them, indoor particulate matters represents an important issue of indoor air quality because it rise the risk of respiratory diseases. Since the particulate matter is strongly affected by the outdoor pollutants, the objective of this study is to investigate the difference between indoor and outdoor particulate matter concentrations, and a further comparison will also be discussed.
EXPERIMENTAL METHODS The indoor samples were obtained from the office inside the teaching building in a school, and the outdoor samples were settled behind the teaching building. The sampling office had a glazed window for excluding noise and a HVAC (Heating, ventilating air conditioning) system is used to provide a comfortable temperature. The teaching building is located near the bare land with little grass on it. The outdoors particulate matters were sampled on this bare land. The PM10/PM2.5/PM1 concentrations of outdoor and indoor air were measured by using the DustTrak Aerosol Monitor (TSI, Inc. St. Paul, MN, USA). For each sampling, the sampling time was set to one hour. The DustTrak uses 90-deg light scattering to measure the mass concentration of particles in an air stream that passes through an impactor assembly. The DustTrak inlet designed by the manufacturer for PM10/PM2.5/PM1 monitoring was used for this test. Before each 1-hour sampling period, the DustTrak impaction plate was cleaned and greased. The DustTrak zero point was verified and reset by attaching a HEPA filter according to the manufacturer’s instructions, and the nominal flow rate was set on 1.40 min/L.
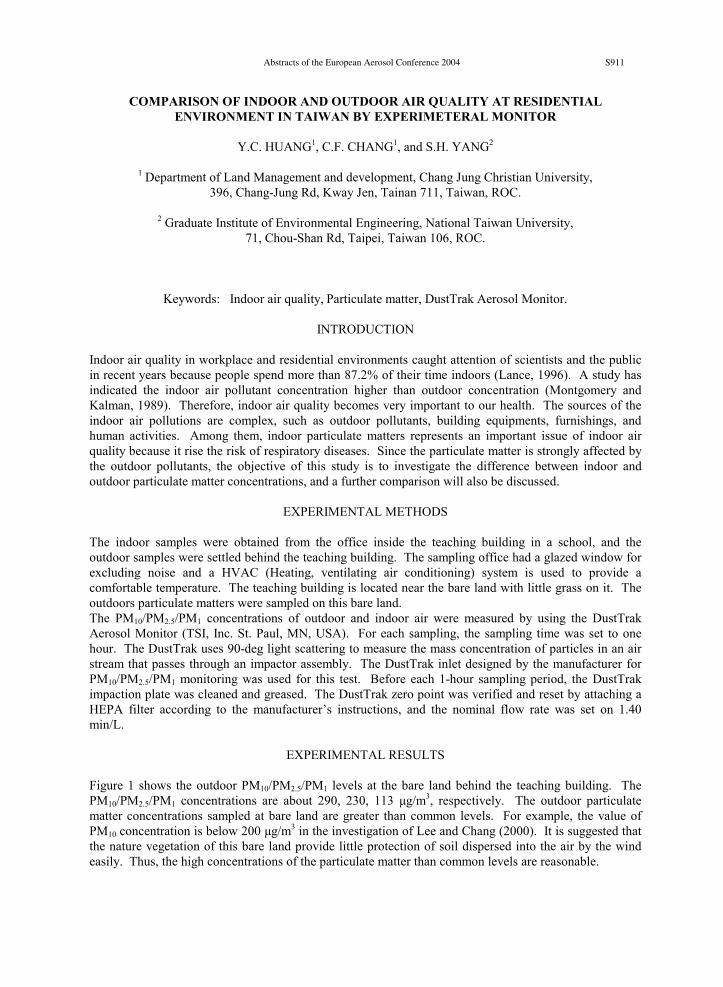
EXPERIMENTAL RESULTS Figure 1 shows the outdoor PM10/PM2.5/PM1 levels at the bare land behind the teaching building. The PM10/PM2.5/PM1 concentrations are about 290, 230, 113 µg/m3, respectively. The outdoor particulate matter concentrations sampled at bare land are greater than common levels. For example, the value of PM10 concentration is below 200 µg/m3 in the investigation of Lee and Chang (2000). It is suggested that the nature vegetation of this bare land provide little protection of soil dispersed into the air by the wind easily. Thus, the high concentrations of the particulate matter than common levels are reasonable.
Abstracts of the European Aerosol Conference 2004 S911
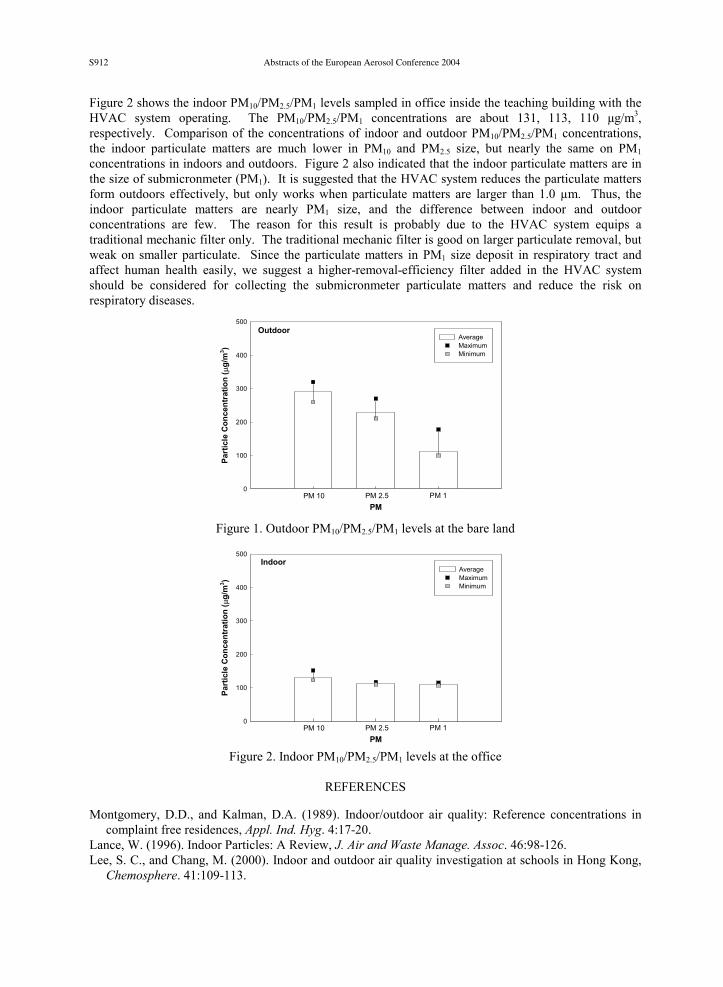
Figure 2 shows the indoor PM10/PM2.5/PM1 levels sampled in office inside the teaching building with the HVAC system operating. The PM10/PM2.5/PM1 concentrations are about 131, 113, 110 µg/m3, respectively. Comparison of the concentrations of indoor and outdoor PM10/PM2.5/PM1 concentrations, the indoor particulate matters are much lower in PM10 and PM2.5 size, but nearly the same on PM1 concentrations in indoors and outdoors. Figure 2 also indicated that the indoor particulate matters are in the size of submicronmeter (PM1). It is suggested that the HVAC system reduces the particulate matters form outdoors effectively, but only works when particulate matters are larger than 1.0 µm. Thus, the indoor particulate matters are nearly PM1 size, and the difference between indoor and outdoor concentrations are few. The reason for this result is probably due to the HVAC system equips a traditional mechanic filter only. The traditional mechanic filter is good on larger particulate removal, but weak on smaller particulate. Since the particulate matters in PM1 size deposit in respiratory tract and affect human health easily, we suggest a higher-removal-efficiency filter added in the HVAC system should be considered for collecting the submicronmeter particulate matters and reduce the risk on respiratory diseases.
Figure 1. Outdoor PM10/PM2.5/PM1 levels at the bare land
Figure 2. Indoor PM10/PM2.5/PM1 levels at the office
REFERENCES Montgomery, D.D., and Kalman, D.A. (1989). Indoor/outdoor air quality: Reference concentrations in
complaint free residences, Appl. Ind. Hyg. 4:17-20. Lance, W. (1996). Indoor Particles: A Review, J. Air and Waste Manage. Assoc. 46:98-126. Lee, S. C., and Chang, M. (2000). Indoor and outdoor air quality investigation at schools in Hong Kong,
Chemosphere. 41:109-113.
PM
Part
icle
Con
cent
ratio
n (
g/m
3 )
0
100
200
300
400
500
AverageMaximumMinimum
PM 10 PM 1PM 2.5
Indoor
PM
Part
icle
Con
cent
ratio
n (
g/m
3 )
0
100
200
300
400
500
AverageMaximumMinimum
PM 10 PM 1PM 2.5
Outdoor
Abstracts of the European Aerosol Conference 2004S912
FINE PARTICLES SUSPENDED IN OFFICE AIR
E. JANKOWSKA, D. KONDEJ, T. JANKOWSKI, M. GLI SKI
Department of Chemical and Aerosol Hazards, Central Institute for Labour Protection – National Research Institute
Czerniakowska 16, 00-701 Warsaw, Poland
Keywords: fine particles, office workplace, number and mass concentrations, ventilation.
INTRODUCTION Exposure to particles suspended in office air can have an adverse effect on human health. Respirable particles deposited in the human lungs can cause various kinds of diseases. Concentration and size distribution of particles present in office air closely depend on the efficiency of air filters and dilution ventilation. This paper presents the results of investigations of concentration and size of dust particles in offices located in two kinds of buildings: new ones (air-conditioned) and old ones (partially equipped with ventilation). Particle parameters were measured with different kinds of equipment used in investigating the quality of indoor air.
METHODS Testing was conducted in five buildings: three new air-conditioned ones (A, B and C), and two old ones (D and E), partially equipped with mechanical or natural ventilation systems. Table 1 lists information on the buildings selected for the tests.
Building
Year of completion
Number of
offices
Office employees
Number of investigated
offices
Ventilation and/or air conditioning systems in
investigated offices A 1999 191 300 B 1999 428 3 800 C 1998 400 1 400
100% offices – air conditioning
D 1956 560 800 30% offices – ventilation, 70% offices – no ventilation
E 1955 126 210
10
70% offices – ventilation, 30% offices – no ventilation
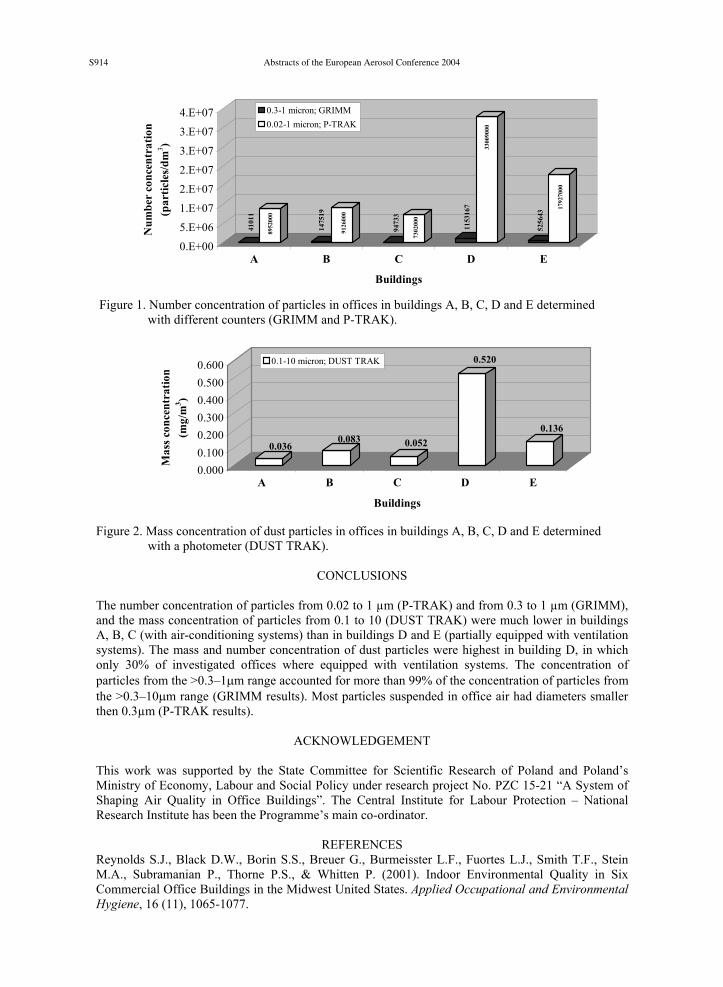
Table 1. Information on buildings selected for tests. Measurements of dust parameters in ten offices in each selected building (A, B, C, D and E) were done in the morning and in the afternoon at two test points per workplace. The tests were conducted in autumn and winter. Mass or number aerosol concentration, and particle size at office workplaces were measured with an optical particle counter (GRIMM 1.108 Dust Monitor), a condensation particle counter (P-TRAK 8525, TSI) and a photometer (DUST-TRAK 8520, TSI). Figure 1 illustrates number concentrations determined with two counters (GRIMM and P-TRAK). Figure 2 presents results of measurements of mass concentrations (DUST TRAK).
Abstracts of the European Aerosol Conference 2004 S913
4101
1
8952
000
1475
19
9126
000
9473
3
7302
000
1153
167
3300
9000
5256
43
1792
7000
0.E+00
5.E+06
1.E+07
2.E+07
2.E+07
3.E+07
3.E+07
4.E+07
Num
ber
conc
entr
atio
n (p
artic
les/d
m3 )
A B C D E
Buildings
0.3-1 micron; GRIMM0.02-1 micron; P-TRAK
Figure 1. Number concentration of particles in offices in buildings A, B, C, D and E determined with different counters (GRIMM and P-TRAK).
0.0360.083 0.052
0.520
0.136
0.0000.1000.2000.3000.4000.5000.600
Mas
s con
cent
ratio
n (m
g/m
3 )
A B C D E
Buildings
0.1-10 micron; DUST TRAK
Figure 2. Mass concentration of dust particles in offices in buildings A, B, C, D and E determined with a photometer (DUST TRAK).
CONCLUSIONS
The number concentration of particles from 0.02 to 1 µm (P-TRAK) and from 0.3 to 1 µm (GRIMM), and the mass concentration of particles from 0.1 to 10 (DUST TRAK) were much lower in buildings A, B, C (with air-conditioning systems) than in buildings D and E (partially equipped with ventilation systems). The mass and number concentration of dust particles were highest in building D, in which only 30% of investigated offices where equipped with ventilation systems. The concentration of particles from the >0.3–1 m range accounted for more than 99% of the concentration of particles from the >0.3–10 m range (GRIMM results). Most particles suspended in office air had diameters smaller then 0.3µm (P-TRAK results).
ACKNOWLEDGEMENT This work was supported by the State Committee for Scientific Research of Poland and Poland’s Ministry of Economy, Labour and Social Policy under research project No. PZC 15-21 “A System of Shaping Air Quality in Office Buildings”. The Central Institute for Labour Protection – National Research Institute has been the Programme’s main co-ordinator.
REFERENCES Reynolds S.J., Black D.W., Borin S.S., Breuer G., Burmeisster L.F., Fuortes L.J., Smith T.F., Stein M.A., Subramanian P., Thorne P.S., & Whitten P. (2001). Indoor Environmental Quality in Six Commercial Office Buildings in the Midwest United States. Applied Occupational and Environmental Hygiene, 16 (11), 1065-1077.
Abstracts of the European Aerosol Conference 2004S914
MATHEMATICAL MODELING OF MICROCLIMATE AND SPREAD OF AEROSOL POLLUTANTS WITHIN LARGE BUILDINGS
S.R. SARMANAEV1, A.I. BORODULIN1, B.M. DESYATKOV1,
V.A. SERPIONOV2, V.S. USTUJANIN2 and T.I. KUZNETSOVA2
1State Research Center of Virology and Biotechnology “Vector”, Koltsovo, Novosibirsk region, 630559, Russia
2 “Sibproject” RI Aircraft Industry, 29 Koroleva St., Novosibirsk 630015, Russia
Key words: INDOOR AEROSOLS, MATHEMATICAL MODELING.
INTRODUCTION
Modeling of non-stationary flows and the spread of aerosol and gas pollutants within residential constructions and production areas, first of all, large ones taking into account their configuration, the presence of equipment including heat generating one, various ventilation flows and pollutant sources is of great interest today. Large buildings include ones with horizontal and vertical dimensions of tens of meters. These are office buildings with large assembly halls, theatres, houses of culture, railway stations, airport buildings, stadiums, large production departments, etc.
Mathematical modeling may be performed at designing of clean production areas in microelectronic, pharmaceutical, medical and microbiological industries. In space industry, one of conditions of reliable work of devices sent to the space is their manufacturing under clear air conditions. Analogous problems emerge at designing ventilation systems of production areas where manufacturing equipment evolves pollutants that are harmful for the personnel’s health.
The work describes a mathematical model intended for the calculation of three-dimensional airflow within a large building containing equipment, partitions, heat sources, pollutants, influx-and-extract ventilation systems; and for the calculation of distribution of temperature and concentration fields of gas and aerosol pollutants.
METHODS The difficulty of modeling of airflows motion in large rooms is caused by complex three-dimensional geometry, the presence of heat-generating objects, including manufacturing equipment, people as heat-generating objects, influx-and-extract ventilation systems. These factors cause the motion of airflows of different scales. Such processes are described with a model based on a system of non-stationary three-dimensional Navie-Stokes equations for viscous incompressible gas, equations of heat transfer, pollutant concentrations and the model of closure of small-scale motions. The model details were described in the work (Sarmanaev et al., 2003). The results of its testing on a large number of well-known and thoroughly investigated problems are also given there, and the comparison with other authors’ calculations and the data of physical experiments was carried out. The system of equations is solved numerically with the method of splitting by physical processes and a two-cycle scheme of component-wise splitting (Marchuk G.I., 1989) on a spaced difference grid. Approximation of turbulent components of equations is performed with an implicit scheme (Samarsky
Abstracts of the European Aerosol Conference 2004 S915
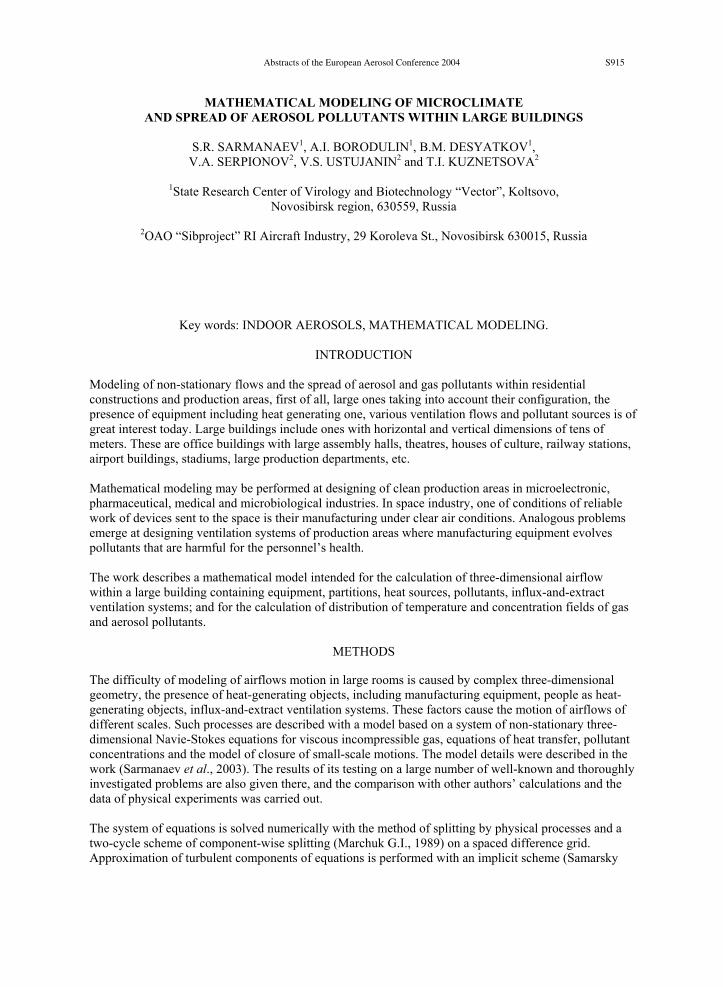
A.A., 1989), and that of convective components uses an implicit quasi-monotonous TVD scheme with compression (Harten A.A., 1983). The figure presents the results of modeling one of microclimate components at Section #102 of the erecting and testing block of the spaceship corporation “Energy”, “Baikonur” space center. Modeling was performed due to the reconstruction of the building ventilation and conditioning system.
Fig. Isolines of time-averaged module of airflow rate vector drawn with a step of 0.2 m/s in the building horizontal section at the height of 2m.
CONCLUSIONS A model for solution of a broad spectrum of problems associated with modeling of microclimate and pollutants spread indoors is presented. The prospects of using the proposed approach for modeling of microclimate and aerosol pollutants spread in large buildings with complex geometry are shown.
REFERENCES
Sarmanaev S.R et al. (2003). The Description of the Application Package for Modeling of Indoor
Microclimate, Siberian Journal of Industrial Mathematics. 7, 94-110 (in Russian). Harten A.A. (1983). A High-resolution Scheme for the Computation of Weak Solution of Hyperbolic
Conservative Laws, J. Comp. Phys. 49, 357-359. Marchuk G.I. (1989). Methods of Computational Mathematics. Moscow: “Nauka” Publishing Company
(in Russian). Samarsky A.A. (1989). The Theory of Difference Schemes. Moscow: “Nauka” Publishing Company (in
Russian).
55 m
47m
Abstracts of the European Aerosol Conference 2004S916
INDOOR AIR QUALITY ASSESSMENT ON TUBE PLATFORM - A CASE STUDY IN BUDAPEST
É VASKÖVI, T BEREGSZÁSZI, M ENDR DY, M CSÍK, G KOVÁCS, G TÖRÖK and A BITTÓ
National Institute of Environmental Health, Gyáli u. 2-6. Budapest, Hungary
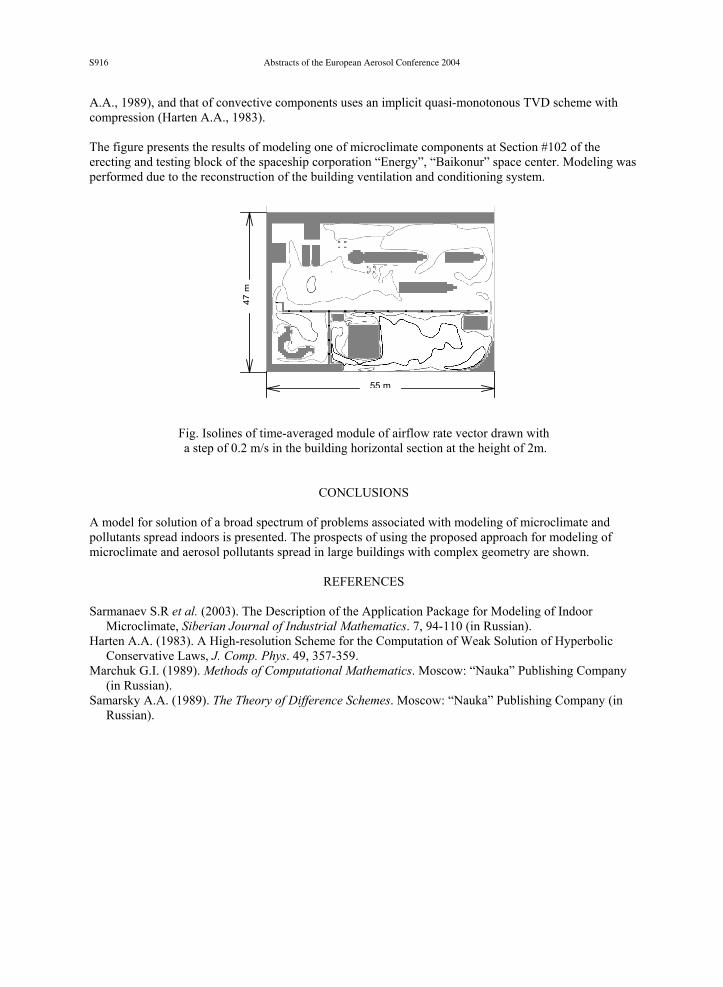
Keywords: indoor air quality, tube platform, TSP, PM10 , PM2,5
INTRODUCTION People are exposed to air pollution both indoor and outdoor circumstances. Indoor air quality has become the centre of interest during the last twenty years. There are no enough available data to assess the exposure level in the different microenvironments. As people spend about 10% of their time a day with transportation, and a huge number of people are exposed to traffic-related pollution in big cities every day, it is substantial to know the exposure level used by different means of communication. The aim of the study was to assess the air pollution in metro areas considering its important role in the urban mass transportation in Budapest during the last year.
METHODS Tube platforms at a deep (Klinikák) and subsurface underground (Nagyvárad square) stations were selected for sampling sites. Control locations at surface entrance of the stations and an area farther away from the metro stations but near the same road also designated. The measurement program planed for 5 workday’s consecutive weeks. Daily average concentrations of PM10 and PM2,5 were measured continuously. To determine the peak (1-hour) concentrations, short-term measurements for TSP elaborated by 3-hour period in the late morning. PM10 and PM2,5 pollution levels were controlled by gravimetric method using Harvard impactors. High volume samplers measured TSP concentrations. Exposed particulate samplings were analysed gravimetrically.
RESULTS
60-percentile of TSP hourly concentrations exceeded the national short-term limit value (200 µg/m3) at both platforms. The pollution trend at deep-level station was alternate during the week. The three-hour averages ranged from 140-286 µg/m3 at subsurface underground station and 140-441 µg/m3 at deep station (Fig.2). Daily averages (206, 198 µg/m3) for PM10 were came near to each other during the studied period. It means that the daily exposure 3-5 times were higher than the threshold limit. Differences in PM2,5 pollution were found between two sites. Indoor air was more polluted at tube platform at Nagyvárad square (weekly average: 88 µg/m3 ) than at tube platform at Klinikák station (64 µg/m3 ) (Fig.1). For PM10 and PM2,5 measurements, the farther site was considered as a control one. Exposure at this site was lower (44% and 29%) than the pollution level at tube platforms, Nagyvárad square and Klinikák. As regards the PM2,5 pollution, the tube platforms were most polluted areas than the control site (Nagyvárad square: 1,4-1,9; Klinikák: 1,5-2,1) Somewhat higher fine fraction in PM10 was found at tube platform on subsurface underground station (41%) than at deep metro station (31%). In contrast, PM2,5/PM10 ratio was the same (61-63 %) during the two consecutive weeks at control site.
Abstracts of the European Aerosol Conference 2004 S917
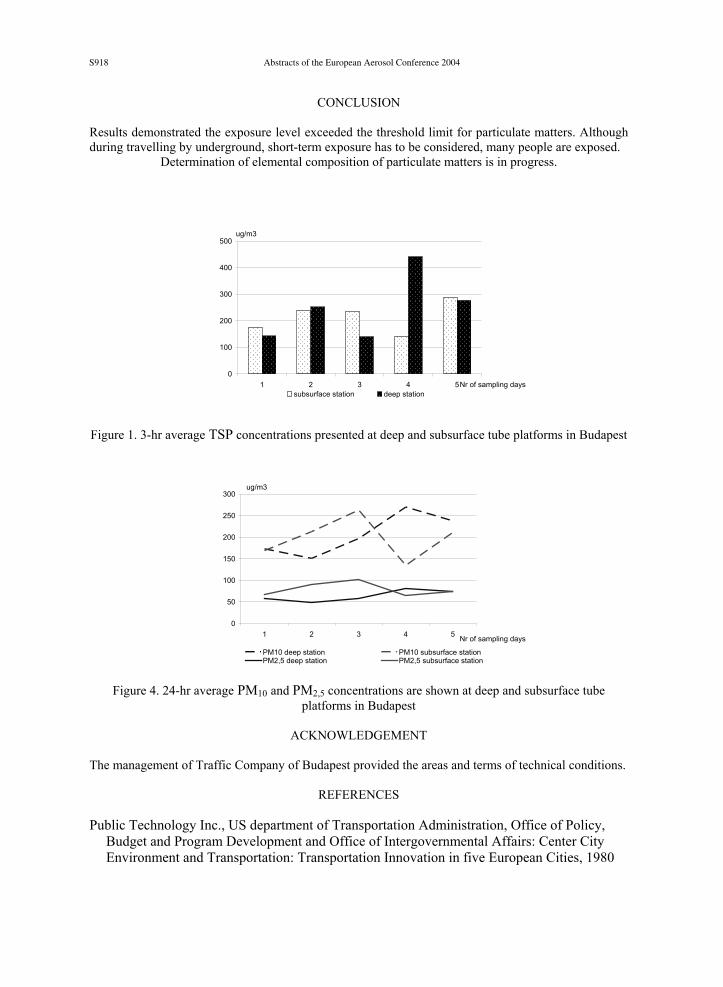
CONCLUSION Results demonstrated the exposure level exceeded the threshold limit for particulate matters. Although during travelling by underground, short-term exposure has to be considered, many people are exposed.
Determination of elemental composition of particulate matters is in progress.
0
100
200
300
400
500
1 2 3 4 5Nr of sampling days
ug/m3
subsurface station deep station
Figure 1. 3-hr average TSP concentrations presented at deep and subsurface tube platforms in Budapest
0
50
100
150
200
250
300
1 2 3 4 5 Nr of sampling days
ug/m3
PM10 deep station PM10 subsurface stationPM2,5 deep station PM2,5 subsurface station
Figure 4. 24-hr average PM10 and PM2,5 concentrations are shown at deep and subsurface tube
platforms in Budapest
ACKNOWLEDGEMENT
The management of Traffic Company of Budapest provided the areas and terms of technical conditions.
REFERENCES Public Technology Inc., US department of Transportation Administration, Office of Policy,
Budget and Program Development and Office of Intergovernmental Affairs: Center City Environment and Transportation: Transportation Innovation in five European Cities, 1980
Abstracts of the European Aerosol Conference 2004S918