Embed Size (px)
Citation preview

Proceedings of the 18th Central Hardwoods Forest Conference GTR-NRS-P-117 261
COMPARISON OF LIDAR-DERIVED DATA AND HIGH RESOLUTION TRUE COLOR IMAGERY FOR EXTRACTING URBAN FOREST COVER
Aaron E. Maxwell, Adam C. Riley, and Paul Kinder1
Abstract.—Remote sensing has many applications in forestry. Light detection and ranging (LiDAR) and high resolution aerial photography have been investigated as means to extract forest data, such as biomass, timber volume, stand dynamics, and gap characteristics. LiDAR return intensity data are often overlooked as a source of input raster data for thematic map creation. We utilized LiDAR intensity and elevation diff erence models from a recent Morgantown, WV, collection to extract land cover data in an urban setting. Th e LiDAR-derived data were used as an input in user-assisted feature extraction to classify forest cover. Th e results were compared against land cover extracted from high resolution, recent, true color, leaf-off imagery. We compared thematic map results against ground sample points collected using realtime kinematic (RTK) global positioning system (GPS) surveys and to manual photograph interpretation. Th is research supports the conclusion that imagery is a superior input for user-assisted feature extraction of land cover data within the software tool utilized; however, there is merit in including LiDAR-derived variables in the analysis.
INTRODUCTION
Light detection and ranging (LiDAR) is an active remote sensing technology that utilizes near-infrared light pulses, diff erential GPS, and inertial measurements to accurately map objects and surfaces along the earth. Th e technology is often utilized from an aerial platform to create elevation and topographic models of the Earth’s surface (Lillesand et al. 2008). It has many applications in forestry research due to the high spatial resolution and accuracy of the data and also the ability to collect multiple returns for a single laser pulse, which allows for the analysis of the vertical structure of forested areas (Wynne 2006). Forestry inventory attributes and canopy metrics such as canopy height, basal area, volume, crown diameter, and stem density have been derived from LiDAR data (Magnussen et al. 2010, Næsset 2009, Popescu et al. 2003). Also, the classifi cation of individual tree species has been pursued (Brandtberg 2007, Ørka et al. 2009).
LiDAR intensity is a measure of the strength of the return pulse, and this measurement is correlated with surface material (Lillesand et al. 2008). However, prior research by Lin and Mills (2010) has shown that return intensity is infl uenced by many variables including footprint size, scan angle, return number, and range distance. LiDAR return intensity has not been as heavily explored for its usefulness in forestry and land cover mapping due to the diffi culty of radiometric calibration (Flood 2001, Kaasalainen et al. 2005). Brennan and Webster (2006) explored the use of LiDAR-derived parameters, including intensity, for land cover mapping using image object segmentation and rule-based classifi cation and obtained individual class accuracies averaging 94 percent.
1Remote Sensing Analyst (AEM), West Virginia University, Natural Resource Analysis Center (NRAC), 2009 Agricultural Science Building, Evansdale Drive, Morgantown, WV 26506-6108; GIS Analyst (ACR), West Virginia University, NRAC; Research Scientist (PK), West Virginia University, NRAC. AEM is corresponding author: to contact, call 304-293-5623 or email at [email protected].

Proceedings of the 18th Central Hardwoods Forest Conference GTR-NRS-P-117 262
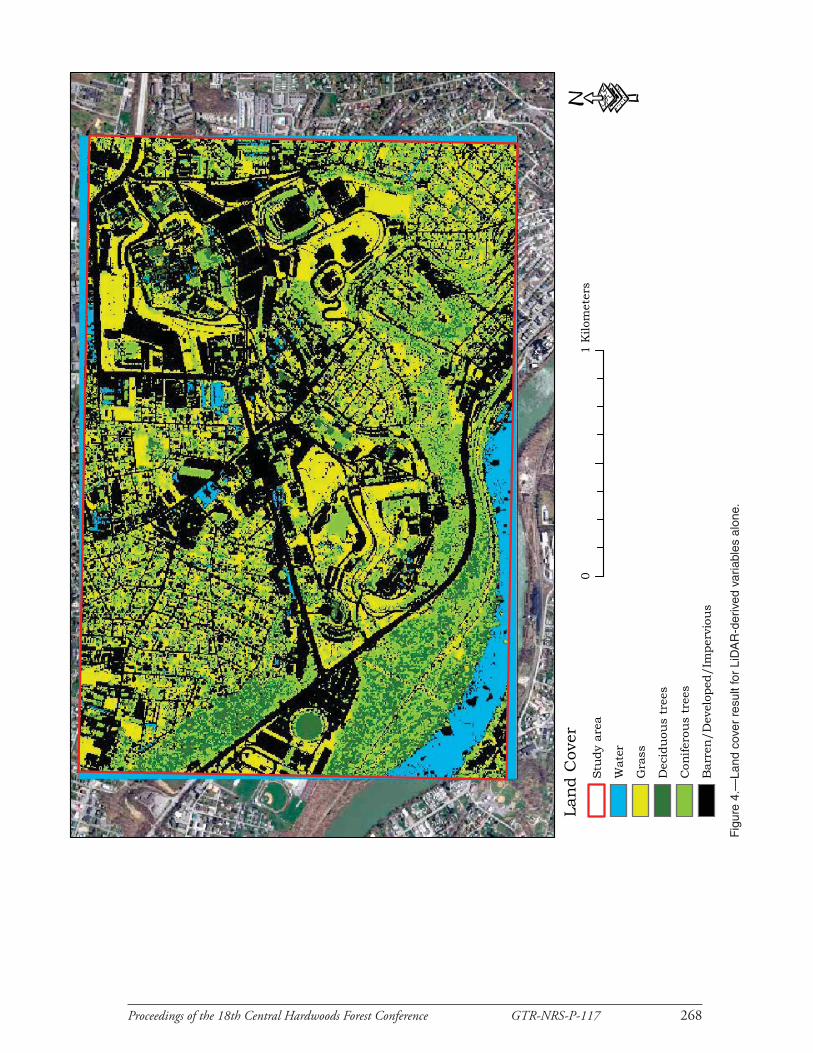
Th e purpose of this work was to compare LiDAR-derived data, LiDAR all return intensity and elevation diff erence models, and high resolution aerial imagery as inputs for user-assisted feature extraction of land cover with the software tool Feature Analyst (Visual Learning Systems, Missoula, MT). Land cover was diff erentiated in an urban setting and results were compared. Th e following land cover classes were of interest: barren/developed/impervious, grass, water, deciduous tees, and coniferous trees. We investigated whether forested land cover could be diff erentiated from other land cover types in an urban environment using feature extraction if only LiDAR data are available but no high-resolution imagery. Th e LiDAR-derived data were utilized in a raster format.
User-assisted feature extraction uses user-defi ned knowledge, as training data, to recognize and classify target features in an image (Visual Learning Systems 2002). Feature Analyst uses machine-learning algorithms and techniques as object recognition to automate feature-recognition from imagery (Visual Learning Systems 2002). Unlike supervised classifi cation techniques, feature extraction classifi es an image using more than just the digital number (DN) or spectral information contained by each pixel. Spatial context information such as spatial association, size, shape, texture, pattern, and shadow are considered (Opitz 2003). Studies have shown that feature extraction or object-based algorithms are more eff ective and accurate at extracting information from high resolution imagery than traditional image classifi cation methods, such as supervised classifi cation, because additional image characteristics are considered such as spatial context (Friedl and Brodley 1997, Harvey et al. 2002, Hong and Zhang 2006, Kaiser et al. 2004).
Feature extraction takes into account the spatial context that is available in high resolution data. We hypothesized that the textural information available in LiDAR-derived data could be utilized to diff erentiate forested land cover from other land cover types. As Figure 1 demonstrates, forested areas often show more texture and variability of LiDAR intensity values than more homogenous surfaces, such as pavement or grass.
STUDY AREA
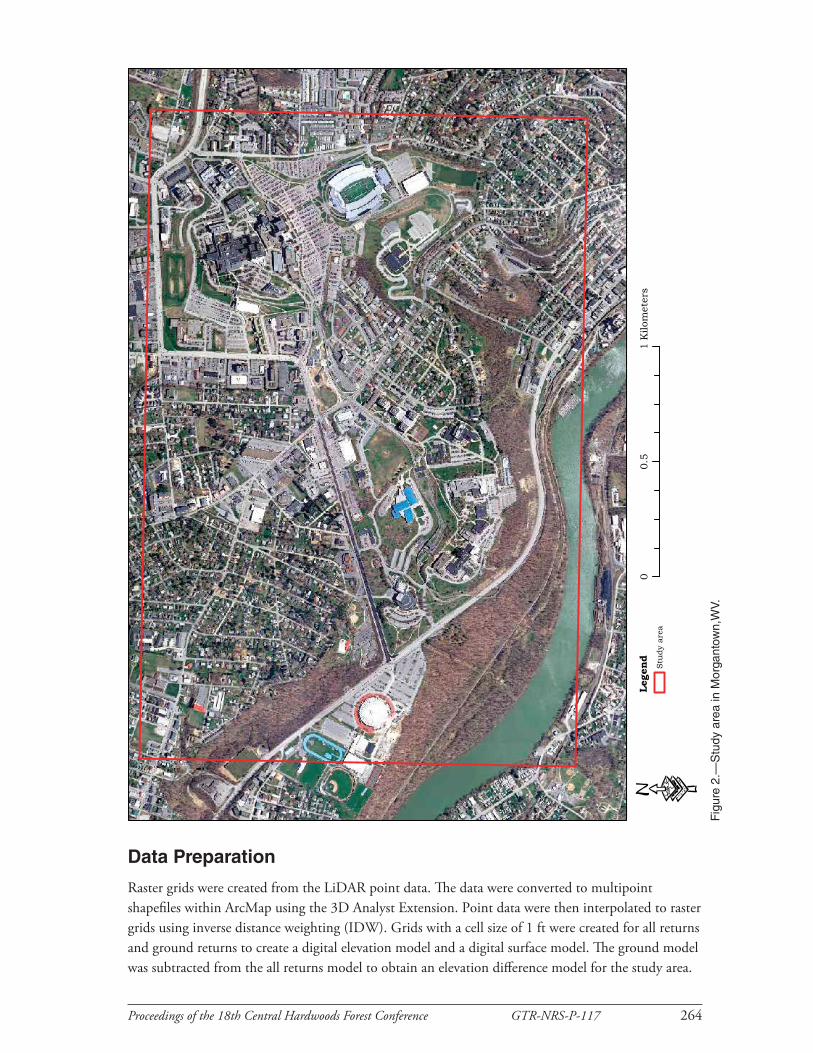
Th is study was conducted in Morgantown, WV, within a 5.3 km2 area near the Evansdale Campus of West Virginia University (Fig. 2). Th is area was selected because LiDAR and high resolution aerial imagery were available and a wide variety of land cover types are present.
METHODS
LiDAR Data
LiDAR data were collected on November 12, 2008, at an altitude of 3,500 ft (1066 m) above ground level (AGL) from an aircraft platform. An ALTM 3100 sensor was utilized at a pulse rate of 100 kHz, a half scan angle of 18 degrees, and a scan frequency of 30 Hz. Up to four returns were recorded per laser pulse. Th is was a leaf-off collection.
Imagery Data
True color imagery was fl own during leaf-off conditions in March of 2010 at a cell size of 6 inches. Th is imagery was made available by the Monongalia County Commission. Visual inspection of the imagery showed that it was well color balanced and precisely orthorectifi ed.

Proceedings of the 18th Central Hardwoods Forest Conference GTR-NRS-P-117 263
Figure 1.—Comparison of LiDAR intensity texture in forested (A and B) and nonforested (C and D) areas (1 ft cell size intensity models and 6 inch cell size imagery).
0 50 Meters
Intensity TextureHigh
Low·
"A "B
"C "D
Proceedings of the 18th Central Hardwoods Forest Conference GTR-NRS-P-117 264
Data Preparation
Raster grids were created from the LiDAR point data. Th e data were converted to multipoint shapefi les within ArcMap using the 3D Analyst Extension. Point data were then interpolated to raster grids using inverse distance weighting (IDW). Grids with a cell size of 1 ft were created for all returns and ground returns to create a digital elevation model and a digital surface model. Th e ground model was subtracted from the all returns model to obtain an elevation diff erence model for the study area.
Fig
ure
2.—
Stu
dy a
rea
in M
orga
ntow
n,W
V.
Lege
nd Stu
dy a
rea
00.
51
Kilo
met
ers
·

Proceedings of the 18th Central Hardwoods Forest Conference GTR-NRS-P-117 265
Elevation diff erences between the surfaces were most commonly a result of vegetation and manmade structures. An intensity grid was created from the all returns data at the same resolution using the same methodology.
Training Data
Training data for the land cover classes of interest were created by manual interpretation of the imagery and LiDAR-derived raster grids as polygons within ArcMap; as a result, land cover training data were created by visual interpretation of the input raster grids. Training data were collected throughout the study area in order to take into account class variability. Table 1 describes the training data collected. Due to variability, the most training data were collected for the barren/developed/impervious class. Separate training data were collected for conifers and deciduous trees. Th e same training data was used for each feature extraction performed so as not to induce variability or bias between the runs.
Feature Extraction
Th ree separate feature extractions were performed using the following raster data:
1) True color imagery
2) LiDAR-derived variables (all return intensity and elevation diff erence)
3) All three inputs
Th is was conducted so that comparisons could be made between thematic map results obtained from only the imagery, only the LiDAR-derived variables, and a combination of the two. User-assisted feature extraction was performed within ERDAS IMAGINE® using the software tool Feature Analyst by Visual Learning Systems. Th is software tool has many user defi ned parameters as described in Table 2.
Class Number of training polygons Total area
Water 60 73,505 m2
Grass 80 12,774 m2
Deciduous trees 55 22,923 m2
Coniferous trees 53 1,472 m2
Barren/Developed/Impervious 264 59,201 m2
Table 1.—Training data for land cover classes
Table 2.—Feature Analyst parameters used
Parameter Imagery LiDAR-Derived All
Classification method Multi-class Multi-class Multi-class
Output format Raster Raster Raster
Wall-to-wall classification Applied Applied Applied
Resampling factor 2 1 1
Histogram stretch Applied Applied Applied
Input presentation Manhattan (7) Manhattan (9) Manhattan (5)
Find rotated instances of features Applied Applied Applied
Learning algorithm Approach 1 Approach 1 Approach 1
Aggregate areas 80 80 80

Proceedings of the 18th Central Hardwoods Forest Conference GTR-NRS-P-117 266
Th e only parameters changed between runs were the resampling factor and the pattern width of the input presentation. Th e resampling factor was set at 2 for the image only result so that a 1 ft cell size output would be obtained to match the cell size of the other results. Th e input presentation determines the shape and size of the search window used to gather spatial context information for each pixel. Feature Analyst records the spectral information for all pixels within the pattern to defi ne the characteristics of the land cover class. Within Feature Analyst, the number of bands multiplied by the number of pixels within the search window cannot exceed 100 (Visual Learning Systems 2002). For each run we used the maximum pattern width allowable for the Manhattan pattern to make the most use of the spatial context information in the imagery and the LiDAR-derived variables.
We defi ned the parameters based on results obtained in previous research, suggestions from the software user’s manual, and professional judgment. Although it is possible to conduct further processing within Feature Analyst to enhance the results, we decided to compare initial outputs so as not to induce variability and bias between the runs; as a result, the fi nal accuracies obtained here should not be considered a representation of the optimal use of the software. All results were thematic map raster grids with a 1 ft cell size.
Error Assessment
Two error assessments were performed. First, 10,000 random points were selected using Hawth’s Tools, an extension for Arc Map. Th e thematic map class for each run was determined at each point. A 200-point subset of these points was then randomly selected for validation. We then manually interpreted the land cover class at the point locations by comparison to the true color imagery.
Second, 140 ground points were collected in the study area representing thematic categories using Pacifi c Crest realtime kinematic (RTK) survey equipment. Th e horizontal precision of these points averaged 0.03 m (3 cm). Th ese points were then compared to the thematic map results. It should be noted that these points do not represent a rigorous random sample. Th ey were collected to conduct a relative comparison of the mapping results and should not be considered a measure of true accuracy.
RESULTS AND DISCUSSION
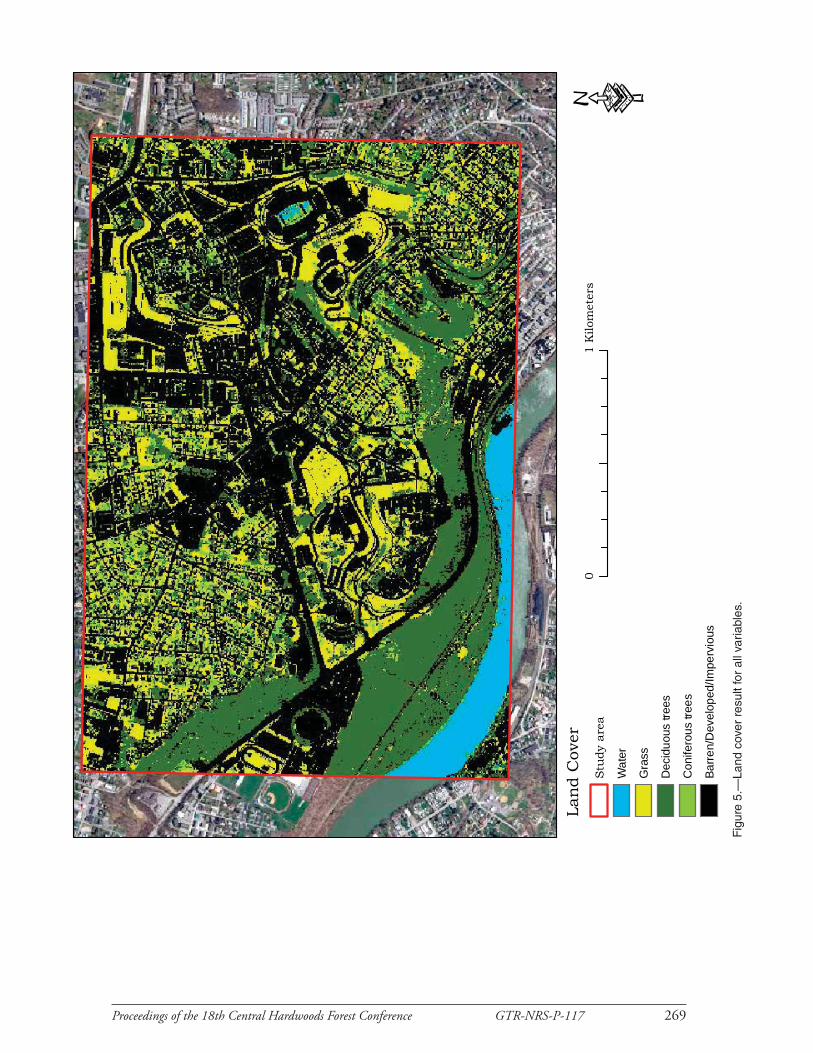
Th ematic map results are provided in Figures 3 through 5. By visual inspection, several observations can be made regarding the products. First, two problems associated with image classifi cation at this spatial scale are shadowing and relief displacement of above ground objects, such as trees. In the imagery alone result, we observed that tree shadows were often classifi ed as part of the tree, potentially overestimating the tree extents. Building shadows were often classifi ed as coniferous trees. We generally found that the inclusion of the LiDAR-derived parameters help to reduce this type of error. An example is shown in Figure 6 in which a water tower shadow was classifi ed as coniferous trees in the image only result but was more correctly classifi ed in the result utilizing all variables. Relief displacement is a problem in aerial imagery, but is not a problem in the LiDAR data. Th is displacement distorts the true location and spatial extent of a tree crown. Th ere were also classifi cation errors associated with roofs, which contain spectral variability by color and texture. Generally, LiDAR data enhanced roof and building classifi cation.

Proceedings of the 18th Central Hardwoods Forest Conference GTR-NRS-P-117 267
Fig
ure
3.—
Land
cov
er r
esul
t for
imag
ery
alon
e.
01
Kilo
met
ers
·St
udy
Are
a
Wat
er
Gra
ss
Dec
idu
ous
tree
s
Con
ifero
us
tree
s
Bar
ren
/Dev
elop
ed/I
mpe
rvio
us
Proceedings of the 18th Central Hardwoods Forest Conference GTR-NRS-P-117 268
Fig
ure
4.—
Land
cov
er r
esul
t for
LiD
AR
-der
ived
var
iabl
es a
lone
.
01
Kilo
met
ers
·St
udy
are
a
Wat
er
Gra
ss
Dec
idu
ous
tree
s
Con
ifero
us
tree
s
Bar
ren
/Dev
elop
ed/I
mpe
rvio
us
Proceedings of the 18th Central Hardwoods Forest Conference GTR-NRS-P-117 269
Fig
ure
5.—
Land
cov
er r
esul
t for
all
varia
bles
.
01
Kilo
met
ers
·St
udy
are
a
Wat
er
Gra
ss
Dec
iduo
us tr
ees
Con
ifero
us tr
ees
Barre
n/D
evel
oped
/Impe
rvio
us

Proceedings of the 18th Central Hardwoods Forest Conference GTR-NRS-P-117 270
Fig
ure
6.—
Com
paris
on o
f sha
dow
cla
ssifi
catio
n. L
and
cove
r in
sha
dow
s w
as m
ore
corr
ecty
cla
ssifi
ed w
hen
utili
zing
LiD
AR
-der
ived
da
ta a
long
with
the
imag
ery.
With
onl
y im
ager
y, la
nd c
over
in s
hado
ws
was
com
mon
ly in
corr
ectly
cla
ssifi
ed a
s co
nife
rous
tree
s.
020
Met
ers
·W
ater
Gra
ss
Dec
iduo
us tr
ees
Con
ifero
us tr
ees
Barre
n/D
evel
oped
/Impe
rvio
us
Imag
ery
and
LiD
AR
Imag
ery
"A"B
"C
Proceedings of the 18th Central Hardwoods Forest Conference GTR-NRS-P-117 271
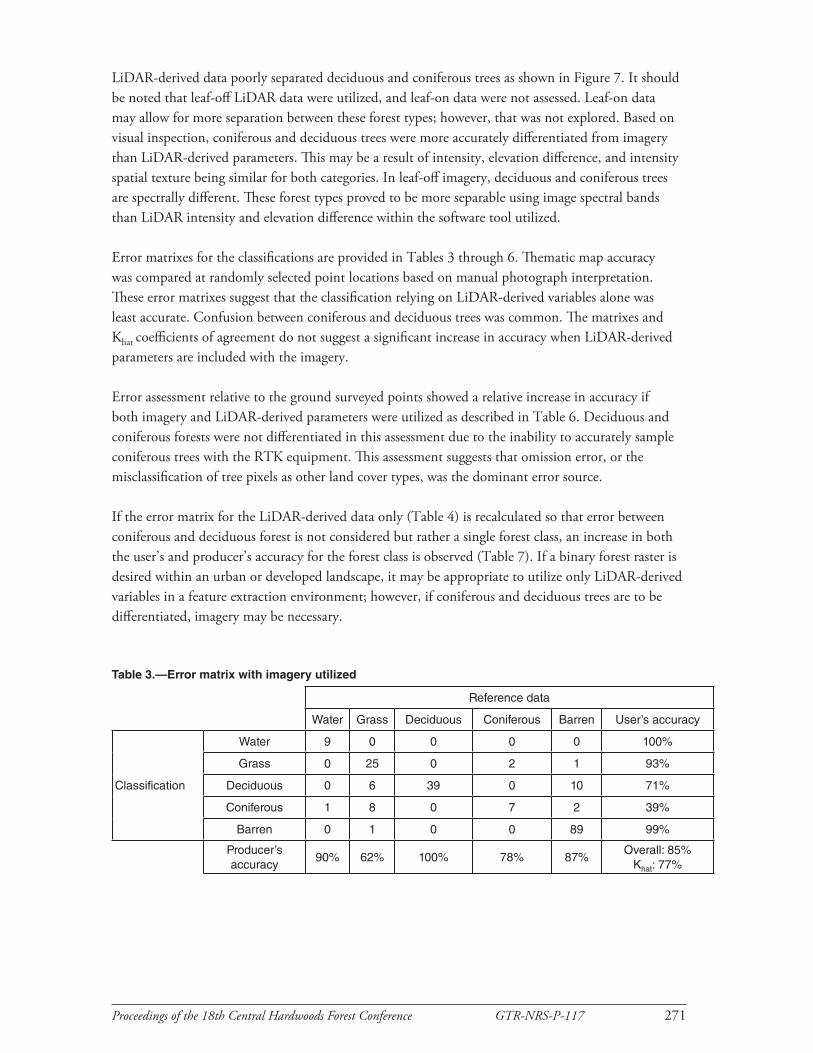
LiDAR-derived data poorly separated deciduous and coniferous trees as shown in Figure 7. It should be noted that leaf-off LiDAR data were utilized, and leaf-on data were not assessed. Leaf-on data may allow for more separation between these forest types; however, that was not explored. Based on visual inspection, coniferous and deciduous trees were more accurately diff erentiated from imagery than LiDAR-derived parameters. Th is may be a result of intensity, elevation diff erence, and intensity spatial texture being similar for both categories. In leaf-off imagery, deciduous and coniferous trees are spectrally diff erent. Th ese forest types proved to be more separable using image spectral bands than LiDAR intensity and elevation diff erence within the software tool utilized.
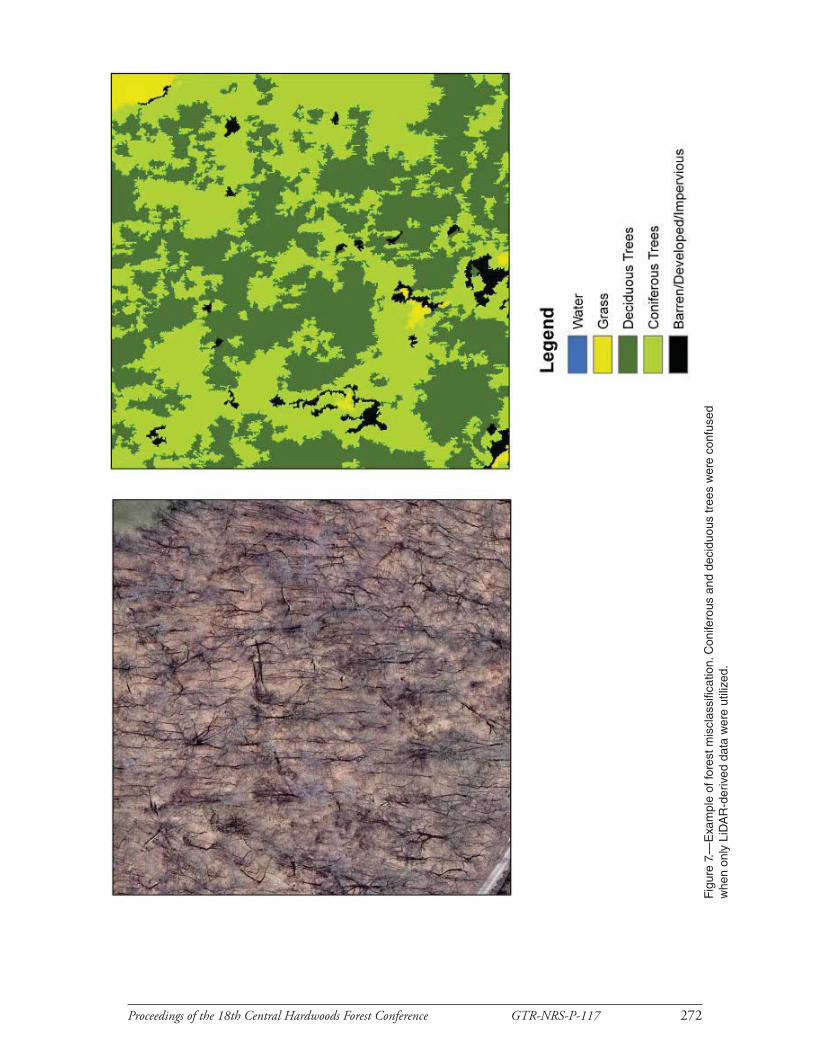
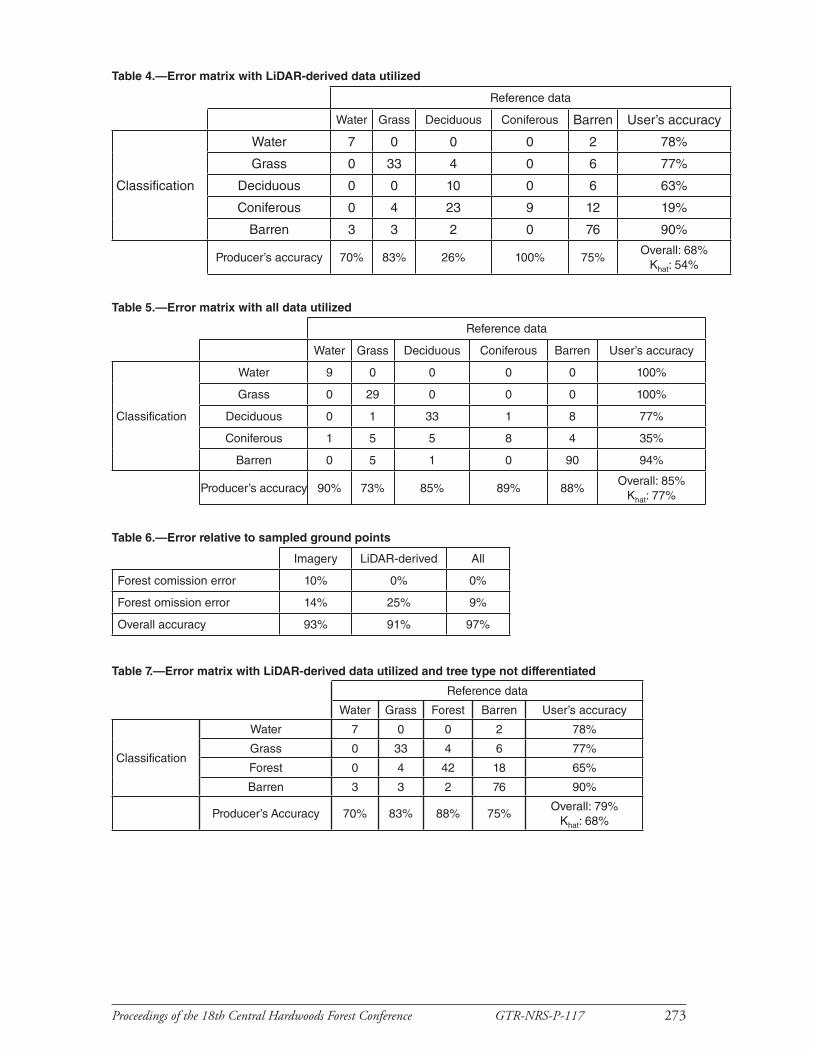
Error matrixes for the classifi cations are provided in Tables 3 through 6. Th ematic map accuracy was compared at randomly selected point locations based on manual photograph interpretation. Th ese error matrixes suggest that the classifi cation relying on LiDAR-derived variables alone was least accurate. Confusion between coniferous and deciduous trees was common. Th e matrixes and Khat coeffi cients of agreement do not suggest a signifi cant increase in accuracy when LiDAR-derived parameters are included with the imagery.
Error assessment relative to the ground surveyed points showed a relative increase in accuracy if both imagery and LiDAR-derived parameters were utilized as described in Table 6. Deciduous and coniferous forests were not diff erentiated in this assessment due to the inability to accurately sample coniferous trees with the RTK equipment. Th is assessment suggests that omission error, or the misclassifi cation of tree pixels as other land cover types, was the dominant error source.
If the error matrix for the LiDAR-derived data only (Table 4) is recalculated so that error between coniferous and deciduous forest is not considered but rather a single forest class, an increase in both the user’s and producer’s accuracy for the forest class is observed (Table 7). If a binary forest raster is desired within an urban or developed landscape, it may be appropriate to utilize only LiDAR-derived variables in a feature extraction environment; however, if coniferous and deciduous trees are to be diff erentiated, imagery may be necessary.
Table 3.—Error matrix with imagery utilized
Reference data
Water Grass Deciduous Coniferous Barren User’s accuracy
Classification
Water 9 0 0 0 0 100%
Grass 0 25 0 2 1 93%
Deciduous 0 6 39 0 10 71%
Coniferous 1 8 0 7 2 39%
Barren 0 1 0 0 89 99%
Producer’s accuracy
90% 62% 100% 78% 87%Overall: 85%
Khat: 77%
Proceedings of the 18th Central Hardwoods Forest Conference GTR-NRS-P-117 272
Fig
ure
7.—
Exa
mpl
e of
fore
st m
iscl
assi
ficat
ion.
Con
ifero
us a
nd d
ecid
uous
tree
s w
ere
conf
used
w
hen
only
LiD
AR
-der
ived
dat
a w
ere
utili
zed.
Proceedings of the 18th Central Hardwoods Forest Conference GTR-NRS-P-117 273
Table 7.—Error matrix with LiDAR-derived data utilized and tree type not differentiated
Reference data
Water Grass Forest Barren User’s accuracy
Classification
Water 7 0 0 2 78%
Grass 0 33 4 6 77%
Forest 0 4 42 18 65%
Barren 3 3 2 76 90%
Producer’s Accuracy 70% 83% 88% 75%Overall: 79%
Khat: 68%
Table 4.—Error matrix with LiDAR-derived data utilized
Reference data
Water Grass Deciduous Coniferous Barren User’s accuracy
Classification
Water 7 0 0 0 2 78%
Grass 0 33 4 0 6 77%
Deciduous 0 0 10 0 6 63%
Coniferous 0 4 23 9 12 19%
Barren 3 3 2 0 76 90%
Producer’s accuracy 70% 83% 26% 100% 75%Overall: 68%
Khat: 54%
Table 5.—Error matrix with all data utilized
Reference data
Water Grass Deciduous Coniferous Barren User’s accuracy
Classification
Water 9 0 0 0 0 100%
Grass 0 29 0 0 0 100%
Deciduous 0 1 33 1 8 77%
Coniferous 1 5 5 8 4 35%
Barren 0 5 1 0 90 94%
Producer’s accuracy 90% 73% 85% 89% 88%Overall: 85%
Khat: 77%
Table 6.—Error relative to sampled ground points
Imagery LiDAR-derived All
Forest comission error 10% 0% 0%
Forest omission error 14% 25% 9%
Overall accuracy 93% 91% 97%

Proceedings of the 18th Central Hardwoods Forest Conference GTR-NRS-P-117 274
CONCLUSIONS
Although there was not a signifi cant increase in map accuracy when LiDAR-derived variables, such as elevation diff erence and all returns intensity, were considered, there was merit in including the data. For example, inclusion of LiDAR-derived variables, based on visual inspection, reduced the negative infl uence of shadows and relief displacement on thematic map results. However, diff erentiation of deciduous and coniferous forest was signifi cantly improved by the inclusion of leaf-off imagery in the analysis. If the desired product was a binary result to diff erentiate forest from nonforest, it may be appropriate to utilize only LiDAR-derived data. It should be noted that the results of this analysis only apply to the software tool in question. Other processes may allow for more accurate land cover mapping, such as the methods suggested by Brennan and Webster (2006). We simply compared initial outputs using variable data inputs; as a result, it may be possible to increase thematic map accuracy by implementing additional processing available in the software.
Future research should attempt thematic map creation from LiDAR intensity data and other derived products using other software tools and processes. Also, the inclusion of additional LiDAR parameters, such as the number of multiple returns in a given area, should be explored for their usefulness in creating thematic maps. Later echoes may help isolate deciduous trees in leaf-off data. Although this work supports the importance of imagery in thematic map creation, LiDAR data may help to increase thematic map accuracy when high resolution land cover is required.
ACKNOWLEDGMENTS
Th e researchers would like to thank the Monongalia County Commission and Michael Paugh for providing the source imagery.
LITERATURE CITED
Brandtberg, T. 2007. Classifying individual tree species under leaf-off and leaf-on conditions using airborne LiDAR. ISPRS Journal of Photogrammetry and Remote Sensing. 61: 325-340.
Brennan, R.; Webster, T.L. 2006. Object-oriented land cover classifi cation of LiDAR-derived surfaces. Canadian Journal of Remote Sensing. 32(2): 162-172.
Flood, M. 2001. LiDAR activities and research priorities in the commercial sector. International Archives of Photogrammetry and Remote Sensing. 34(3/W4): 3-7.
Friedl, M.A.; Brodley, C.E. 1997. Decision tree classifi cation of land cover from remotely sensed data. Remote Sensing of Environment. 61: 399-409.
Harvey, N.R.; Th eiler, J.; Brumby, S.P.; Perkins, S.; Szymanski, J.J.; Bloch, J.J.; Porter, R.B.; Galassi, M.; Young, A.C. 2002. Comparison of GENIE and conventional supervised classifi ers for multispectral image feature extraction. IEEE Transactions on Geoscience and Remote Sensing. 40(2): 393-404.

Proceedings of the 18th Central Hardwoods Forest Conference GTR-NRS-P-117 275
Hong, G.; Zhang, Y. 2006. Object-based change detection in high resolution image. In: Proceedings of the ASPRS 2006 annual conference; 2006 May 1-5; Reno, NV. Bethesda, MD: American Society for Photogrammetry and Remote Sensing. [Unpaginated CD-ROM].
Kaasalainen, S.; Ahokas, E.; Hyyppa, J.; Suomalainen, J. 2005. Study of surface brightness from backscattered laser intensity: calibration of laser data. IEEE Geoscience and Remote Sensing Letters. 2: 255-259.
Kaiser, J.V., Jr.; Stow, D.A.; Cao, L. 2004. Evaluation of remote sensing techniques for mapping transborder trails. Photogrammetric Engineering and Remote Sensing. 70(12): 1441-1447.
Lillesand, T.M.; Kiefer, R.W.; Chipman, J.W. 2008. Remote sensing and image interpretation, sixth edition. Hoboken, NJ: John Wiley and Sons. 756 p.
Lin, Y.; Mills, J.P. 2010. Factors infl uencing pulse width of small footprint, full waveform airborne laser scanning data. Photogrammetric Engineering and Remote Sensing. (76): 49-59.
Magnussen, S.; Næsset, E.; Gobakken, T. 2010. Reliability of LiDAR derived predictors of forest inventory attributes: a case study with Norway spruce. Remote Sensing of Envvironment. 114: 700-712.
Næsset, E. 2009. Eff ects of diff erent sensors, fl ying altitudes, and pulse repetition frequencies on forest canopy metrics and biophysical stand properties from small-footprint airborne laser data. Remote Sensing of Environment. 113: 148-159.
Opitz, D. 2003. An automated change detection system for specifi c features. In: Proceedings of the International ESRI user conference, 2003 July 7-11; San Diego, CA. Redlands, CA: Environmental Systems Research Institute. [Unpaginated CD-ROM]. Available at http://proceedings.esri.com/library/userconf/proc03/p0417.pdf.
Ørka, H.O.; Næsset, E.; Bollandsås, O.L. 2009. Classifying species of individual trees by intensity and structure features derived from airborne laser scanner data. Remote Sensing of Environment. 113: 1163-1174.
Popescu, S.C.; Wynne, R.H.; Nelson, R.F. 2003. Measuring individual tree crown diameters with LiDAR and assessing its infl uence on estimating forest volume and biomass. Canadian Journal of Remote Sensing. 29(5): 564-577.
Visual Learning Systems. 2002. User manual, feature analyst 4.2 for ERDAS Imagine. Missoula, MT: Visual Learning Systems.
Wynne, R.H. 2006. LiDAR remote sensing of forest resources as the scale of management. Photogrammetric Engineering and Remote Sensing. 72(12): 1310-1314.
The content of this paper reflects the views of the authors(s), who are responsible for the facts and accuracy of the information presented herein.