Embed Size (px)
Citation preview

HAL Id: hal-00883544https://hal.archives-ouvertes.fr/hal-00883544
Submitted on 1 Jan 2010
HAL is a multi-disciplinary open accessarchive for the deposit and dissemination of sci-entific research documents, whether they are pub-lished or not. The documents may come fromteaching and research institutions in France orabroad, or from public or private research centers.
L’archive ouverte pluridisciplinaire HAL, estdestinée au dépôt et à la diffusion de documentsscientifiques de niveau recherche, publiés ou non,émanant des établissements d’enseignement et derecherche français ou étrangers, des laboratoirespublics ou privés.
Comparison of model forms for estimating stem taperand volume in the primary conifer species of the North
American Acadian RegionRongxia Li, Aaron R. Weiskittel
To cite this version:Rongxia Li, Aaron R. Weiskittel. Comparison of model forms for estimating stem taper and volume inthe primary conifer species of the North American Acadian Region. Annals of Forest Science, SpringerNature (since 2011)/EDP Science (until 2010), 2010, 67 (3), �10.1051/forest/2009109�. �hal-00883544�
Ann. For. Sci. 67 (2010) 302 Available online at:c© INRA, EDP Sciences, 2010 www.afs-journal.orgDOI: 10.1051/forest/2009109
Original article
Comparison of model forms for estimating stem taper and volume inthe primary conifer species of the North American Acadian Region
Rongxia Li*, Aaron R. Weiskittel
School of Forest Resources, University of Maine, Orono, ME 04469-5755, USA
(Received 3 February 2009; accepted 18 August 2009)
Keywords:balsam fir /red spruce /white pine /nonlinear mixed-effects /crown variables
Abstract• The performance of ten commonly used taper equations for predicting both stem form and vol-ume in balsam fir [Abies balsamea (L.) Mill], red spruce[Picea rubens (Sarg.)], and white pine[Pinusstrobus (L.)] in the Acadian Region of North America was investigated.• Results show that the Kozak (2004) and Bi (2000) equations were superior to the other equationsin predicting diameter inside bark for red spruce and white pine, while the Valentine and Gregoire(2001) equation performed slightly better for balsam fir.• For stem volume, the Clark et al. (1991) equation provided the best predictions across all specieswhen upper stem diameter measurements were available, while the Kozak (2004) and compatibletaper equation of Fang et al. (2000) performed well when those measurements were unavailable.• The incorporation of crown variables substantially improved stem volume predictions (mean abso-lute bias reduction of 7–15%; root mean square error reduction of 10–15%) for all three species, buthad little impact on stem form predictions.• The best taper equation reduced the predicted root mean square error by 16, 39, and 45% comparedto estimates from the widely used Honer (1965) regional stem volume equations for balsam fir, redspruce, and white pine, respectively.• When multiple taper equations exist for a certain species, the use of the geometric mean of allpredictions is an attractive alternative to selecting the “best” equation.
Mots-clés :sapin baumier /épinette rouge /pin Weymouth /effets mixtes non linéaires /variables de la couronne
Résumé – Comparaison de formules modèles pour estimer la décroissance de la tige et le vo-lume des principales espèces de conifères dans la région de l’Acadie en Amérique du Nord.• Les performances de dix équations de la décroissance de la tige, couramment utilisées pour prédireà la fois la forme du tronc et le volume pour le sapin baumier [Abies balsamea (L.) Mill], l’Épinetterouge [Picea rubens (Sarg.)], et le pin Weymouth [Pinus strobus (L.)] ont été étudiées dans la régionde l’Acadie en Amérique du Nord.• Les résultats montrent que les équations de Kozak (2004) et de Bi (2000) étaient supérieures auxautres équations pour la prédiction du diamètre sous écorce pour l’épinette rouge et le pin Weymouth,tandis que l’équation de Valentine et Gregoire (2001) était légèrement meilleure pour la forme dutronc du sapin baumier.• Pour le volume de la tige, l’équation de Clark et al. (1991) fourni les meilleures prévisions pourtoutes les espèces lorsque les mesures du diamètre de la partie supérieure de la tige étaient dispo-nibles, tandis que l’équation de Kozak (2004) et l’équation compatible de défilement de Fang et al.(2000) conviennent bien lorsque ces mesures n’étaient pas disponibles.• L’incorporation de variables de couronne a amélioré sensiblement les prédictions du volume destroncs (réduction moyenne des biais absolu de 7–15 % ; réduction de l’erreur quadratique moyennede 10–15 %) pour les trois espèces, mais avait peu d’impact sur les prédictions de la forme du tronc.• La meilleure équation de décroissance a réduit l’estimation de l’erreur quadratique moyenne de 16,39, et 45 % par rapport aux estimations largement utilisées avec les équations régionales d’Honer(1965) pour l’estimation du volume de la tige respectivement pour le sapin baumier, l’épinette rougeet le pin Weymouth.• Lorsque plusieurs équations de défilement existent pour certaines espèces, l’utilisation de lamoyenne géométrique de toutes les prédictions est une alternative intéressante pour la sélection de la“meilleure” équation.
* Corresponding author: [email protected]
Article published by EDP Sciences
Ann. For. Sci. 67 (2010) 302 R. Li and A.R. Weiskittel
1. INTRODUCTION
Taper equations provide diameter inside (dib) or outsidebark (dob) estimates at any given height along a tree bole(Clutter et al., 1983). The ability of taper equations to estimatetotal and merchantable stem volume has long been a subjectin the forestry literature. The advantage of estimating volumethrough taper equations over existing volume tables lies in theability of taper equations to accurately predict the dob or dibat any given height of individual trees, hence allowing the ac-quisition of merchantable volume information to any desiredspecification.
Numerous taper model forms have been presented in theforestry literature over the past several decades. A very com-mon approach in modeling the shape of a tree bole is to dividea tree into several sections, with each section correspondingto a regression function depicting stem diameter changes withincreasing tree height. For example, Max and Burkhart (1976)proposed a segmented polynomial model that uses two joiningpoints to link three stem sections along the bole: the lower sec-tion corresponding to a neiloid shape, the upper section corre-sponding to a conic shape, and the middle section correspond-ing to a parabolic shape. This idea has been widely acceptedand used in many taper applications (Clark et al., 1991; Jianget al., 2007; Leites and Robinson, 2004; Maguire and Batista,1996). Kozak (Kozak 1988; 2004) and other researchers laterintroduced variable-exponent or variable-form taper equationswhich uses a changing exponent or a changing form to con-tinuously describe the shape of a bole from the ground to thetop, exhibiting more flexibility. Other types of taper equationscan also be found in the literature such as polynomial (Kozaket al., 1969), trigonometric (Thomas and Parresol, 1991), andnonparametric (Lappi, 2006) approaches.
A well behaved taper equation should not only give unbi-ased estimates of dib or dob with a minimum variance, but alsohave flexibility to adapt to a wide variety of species and giveaccurate predictions of stem volume (Kozak and Smith, 1993).Most published taper equations were developed for a certainspecies and often their performance is compared to a limitednumber of alternative model forms. Therefore, it is necessaryand beneficial to further study the characteristics of taper pro-file equations and extend their use to other species besides theones for which they were originally developed. For example,Rojo et al. (2005) compared 31 different model forms on mar-itime pine [Pinus pinaster Ait.] in Spain and found variable-form taper functions provided the most accurate predictions ofdob, particularly the Kozak (2004) equation. However, Rojoet al. (2005) did not compare the taper equations’ performancein predicting stem volume. Recent work by Diéguez-Arandaet al. (2006) and Corral-Rivas et al. (2007) have found thatcompatible taper equations such as the one suggested by Fanget al. (2000) work well for predicting both stem form and vol-ume. Our study seeks to test whether these results hold acrossmultiple species of varying shade tolerance levels and standconditions.
The crown of a tree strongly influences its stem formbecause foliage provides carbohydrates for the tree growth
and their vertical distribution influences stem formation(Larson, 1963). Crown size also determines the growth pat-tern along the stem as it influences the degree of wind pres-sure on the tree. However, there is no unified agreement onwhether crown dimensions should be incorporated into taperequations as previous studies have shown mixed results onthe benefits of adding crown variables in the taper models.Muhairwe et al. (1994) reported that the addition of crownratio variable improved the fit and predictive abilities in theKozak (1988) taper equation for lodgepole pine [Pinus con-torta Dougl. ex. Loud], but found no improvement for severalother species including aspen [Populus tremula (L.)], west-ern redcedar [Thuja plicata Donn ex. D. Don] and Douglas-fir [Pseudotsuga menziesii (Mirb.) Franco]. Muhairwe et al.(1994) also tested if an indicator variable for crown class im-proved the taper model and found no improvement for anyof their 4 studied species. Leites and Robinson (2004) founda significant relationship between crown length, crown ratio,and the estimated random effects for the parameters in the Maxand Burkhart (1976) taper equation for loblolly pine [Pinustaeda (L.)]. Jiang et al. (2005) also found that the addition ofcrown ratio as a predictor variable provided modest improve-ments for yellow-poplar [Liriodendron tulipifera (L.)], whileBurkhart and Walton (1985) found no strong relationship be-tween crown ratio and improved predictions for loblolly pinetrees in unthinned stands. In our analysis, we attempt to de-termine if crown dimensions can improve predictions of bothdiameter and volume for several conifer species across a widerange of tree sizes and stand conditions.
In the Acadian Region of North America, which includeseastern Maine and part of eastern Canada, balsam fir [Abiesbalsamea (L.)], red spruce [Picea rubens Sarg.], and easternwhite pine [Pinus strobus (L.)] are the three primary coniferspecies as they currently comprise over 30% of the net growthin Maine (McWilliams et al., 2005). However, a widely usedregional taper equation does not currently exist and the Honer(1965) volume equations developed over four decades agoare still the most common tool used for estimating volume(Zakrzewski, 1999). Pitt and Lanteigne (2008) indicated thatHoner (1965) volume equation tended to underestimate stemvolume by over 11% on average and the bias increased withtree size for balsam fir, particularly in thinned stands. Recently,Weiskittel et al. (2009) found a similar level of bias in theHoner (1965) volume equation as well as several other addi-tional volume equations available in the region for both balsamfir and red spruce.
The goal of this analysis was to develop stem taper equa-tions for balsam fir, red spruce, and white pine in the AcadianRegion. Specific objectives were to: (1) use mixed-effects toassess the amount of within- and between-tree variation instem profiles; (2) evaluate ten widely used stem taper pro-file models for predicting both dib and total stem volume;and (3) assess the level of improvement across a range ofspecies in dib and stem volume predictions with the incorpo-ration of additional crown variables.
302p2

Model forms for estimating stem taper and volume Ann. For. Sci. 67 (2010) 302
Table I. Summary of tree attributes for balsam fir, red spruce, and white pine.
Balsam fir Red spruce White pineD (cm) H (m) HCB (cm) D (cm) H (m) HCB (cm) D (cm) H (m) HCB (cm)
Mean 14.9 13.4 6.9 15.1 12.9 7.5 30.1 20.2 10.5Max 39.8 25.2 14.8 42.8 23.5 15.6 83.4 37.2 27.0Min 4.8 6.4 0.3 4.4 5.9 0.2 5.7 6.1 0.9Std. 5.7 3.3 2.6 6.2 3.2 2.6 13.9 6.6 4.7
D: Diameter outside bark at breast height. H: Total tree height. HCB: Height to live crown base.
Figure 1. Scatter plots of the relative diameter (diameter inside bark/diameter inside bark at breast height) over relative height (stem height/totalheight) for species of balsam fir, red spruce, and white pine.
2. METHODS
2.1. Data
Stem analysis data were obtained from a variety ofsources. For both balsam fir and red spruce, the stem datawere gathered from Honer (1965), Vicary et al. (1984),Gilmore and Seymour (1996), Maguire et al. (1998), Phillips(2002), and Meyer (2005). Stem analysis data for white pineoriginated from Honer (1965) and Pace (2003). In total, therewere 990 balsam fir, 1 086 red spruce, and 949 white pine treesavailable for this analysis (Tab. I, Figs. 1, 2). A variety of sam-pling schemes were used in these studies and are briefly sum-marized below.
The Honer (1965) data were originally gathered for the con-struction of regional form-class volume tables for the OntarioDepartment of Lands and Forests. The trees were sampled invarious sites throughout central and eastern Canada. The indi-vidual tree measurements were taken at stump, breast height,
and every 1/10 section above breast height. Both dib and dobas well as total tree height and height to live crown base wererecorded. The dataset covered a wide range of stand types andages.
The Vicary et al. (1984) data were originally collected be-tween 1970 and 1977. Stands were located throughout east-ern, northern, and western Maine. Most trees were youngerthan 50 years old at breast height and from even-aged spruce-fir stands. The trees were felled and taper data were taken atstump height, breast height, and every 1.22 m (4 ft) abovebreast height with dib and dob measured at each section. Thetrees were systematically sampled to cover the range of diame-ters within a stand with emphasis on dominant and codominantindividuals. Height to live crown base was recorded for mostof the trees.
The Meyer (2005) data were collected during the sum-mer of 2002 from 12 permanent research installations scat-tered throughout northeastern Maine. The trees were from
302p3

Ann. For. Sci. 67 (2010) 302 R. Li and A.R. Weiskittel
Figure 2. Bean plots for diameter inside bark balsam fir, red spruce,and white pine. The dotted line is the mean dib across species, whilethe black solid line is the mean for each individual species. The lengthof white horizontal bars represent the number of observations for acertain dib.
unthinned, even-aged stands of the spruce-fir forest type thatwere ready for either a precommercial or commercial thinningentry. Trees were taken from a variety of crown classes andDBH ranged from 4.9 to 34.3 cm. The trees were felled anddib and dob measurements were made at stump height, breastheight, and every 1 m above breast height.
Gilmore and Seymour (1996) and Pace (2003) study siteswere located on the University of Maine Dwight B. DemerittForest, while the Maguire et al. (1998) and Phillips (2002)were on the nearby United States Forest Service PenobscotExperimental Forest. Both forests are within 10 km of Orono,Maine (44.89 N, 68.69 W) and border the central and southernclimatic zones of the state (Briggs and Lemin, 1992). Stemanalysis data was collected from a range of crown classes.Disks were sectioned from each tree at 0.15 m, 1 m, 1.3 m, 2 mand successive 1 m intervals to the tip of the tree. The standswere generally even-aged, with the exception of the Maguireet al. (1998) dataset.
The Phillips (2002) and Pace (2003) dataset included treesthat were from both thinned and unthinned stands. Althoughthinning can influence stem taper in both balsam fir and redspruce, the impact is relatively minor and can largely be ac-counted for by a proper model form (Weiskittel et al., 2009).
2.2. Taper equations
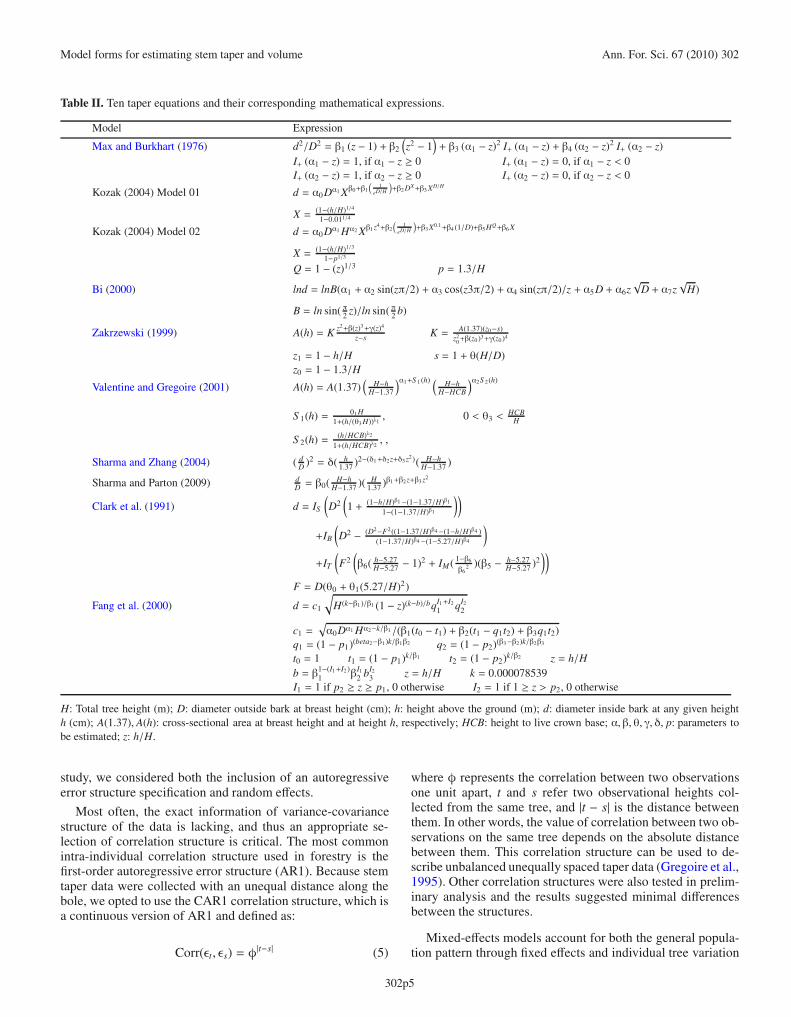
Based on the analysis of Rojo et al. (2005) and Diéguez-Aranda et al. (2006), ten commonly used and well-behavedtaper equations were selected for evaluation. They included:Max and Burkhart (1976), Kozak (2004) model 3 (referred toas Model 01), Kozak (2004) model 4 (referred to as Model 02),Bi (2000), Zakrzewski (1999), Valentine and Gregoire (2001),
Sharma and Zhang (2004), Sharma and Parton (2009), Clarket al. (1991) and Fang et al. (2000). The Max and Burkhart(1976) and Clark et al. (1991) are segmented taper equa-tions, Fang et al. (2000) is a compatible volume-taper modelwith segmented-stem form factors, while all seven other taperequations are either variable exponent (Kozak, 2004; Sharmaand Parton, 2009; Sharma and Zhang, 2004) or variable form(Bi, 2000; Valentine and Gregoire, 2001; Zakrzewski, 1999)(Tab. II).
In the Clark et al. (1991) equation, F represents the dibmeasurement at the height of 5.27 m. Given that taper equa-tions that include upper stem measurements generally outper-form ones that do not (Kozak, 1998), an equation was devel-oped to predict the required upper stem measurements to en-sure compatibility with the other examined taper equations.In the present analysis, diameters at 5.27 m were initially ob-tained through linear interpolation and then predicted for eachtree using the equation forms presented in Jiang et al. (2005)as this measurement is generally not made during routine for-est inventories. The upper diameter values at 5.27 m obtainedfrom both steps (interpolation and prediction) were used in thisstudy. The four identity functions in the Clark et al. (1991)equation were outlined as:
IS =
{1 if h < 1.370 otherwise (1)
IB =
{1 if 1.37 < h < 5.270 otherwise (2)
IT =
{1 if h > 5.270 otherwise (3)
IM =
{1 if h < 5.27 + β5(H − 5.27)0 otherwise. (4)
2.3. Statistical analysis
Ordinary least squares is based on the assumption thatthe residual errors are independent and identically distributed.Stem taper data are hierarchical, collected at multiple points onthe same individual tree. The autocorrelation among observa-tions violates the assumption of independence. Neglect of thisautocorrelation in modeling may incur severe consequencesin statistical inference such as hypothesis tests and confidenceintervals, because standard errors of parameter estimates pro-vide an inappropriate assessment of estimation error (Davidianand Giltinan, 1995). Garber and Maguire (2003) stated thattwo methods are generally used to deal with autocorrelationissues with one method being directly modeling the time se-ries correlation structure in the model fitting process, and theother method is to incorporate individual tree random effectin the model. The former can be implemented through gen-eralized least squares and the latter is built in a mixed-effectsmodel framework. Chi and Reinsel (1989) suggested to useboth methods to address the within subject correlation becauseone method might not be adequate to fully eliminate the exist-ing correlation among observations, which was also supportedby the results of Garber and Maguire (2003). In the present
302p4
Model forms for estimating stem taper and volume Ann. For. Sci. 67 (2010) 302
Table II. Ten taper equations and their corresponding mathematical expressions.
Model Expression
Max and Burkhart (1976) d2/D2 = β1 (z − 1) + β2
(z2 − 1
)+ β3 (α1 − z)2 I+ (α1 − z) + β4 (α2 − z)2 I+ (α2 − z)
I+ (α1 − z) = 1, if α1 − z ≥ 0 I+ (α1 − z) = 0, if α1 − z < 0I+ (α2 − z) = 1, if α2 − z ≥ 0 I+ (α2 − z) = 0, if α2 − z < 0
Kozak (2004) Model 01 d = α0Dα1 Xβ0+β1
(1
eD/H
)+β2 DX+β3 XD/H
X = (1−(h/H)1/4
1−0.011/4
Kozak (2004) Model 02 d = α0Dα1 Hα2 Xβ1z4+β2
(1
eD/H
)+β3 X0.1+β4 (1/D)+β5 HQ+β6 X
X = (1−(h/H)1/3
1−p1/3
Q = 1 − (z)1/3 p = 1.3/H
Bi (2000) lnd = lnB(α1 + α2 sin(zπ/2) + α3 cos(z3π/2) + α4 sin(zπ/2)/z + α5D + α6z√
D + α7z√
H)
B = ln sin( π2 z)/ln sin( π2 b)
Zakrzewski (1999) A(h) = K z2+β(z)3+γ(z)4
z−s K = A(1.37)(z0−s)z2
0+β(z0 )3+γ(z0 )4
z1 = 1 − h/H s = 1 + θ(H/D)z0 = 1 − 1.3/H
Valentine and Gregoire (2001) A(h) = A(1.37)(
H−hH−1.37
)α1+S 1 (h) ( H−hH−HCB
)α2S 2(h)
S 1(h) = θ1 H1+(h/(θ3 H))λ1
, 0 < θ3 <HCB
H
S 2(h) = (h/HCB)λ2
1+(h/HCB)λ2, ,
Sharma and Zhang (2004) ( dD )2 = δ( h
1.37 )2−(δ1+δ2z+δ3 z2)( H−hH−1.37 )
Sharma and Parton (2009) dD = β0( H−h
H−1.37 )( H1.37 )β1+β2z+β3 z2
Clark et al. (1991) d = IS
(D2(1 + (1−h/H)β1−(1−1.37/H)β1
1−(1−1.37/H)β1
))
+IB
(D2 − (D2−F2((1−1.37/H)β4−(1−h/H)β4 )
(1−1.37/H)β4−(1−5.27/H)β4
)+IT
(F2(β6( h−5.27
H−5.27 − 1)2 + IM( 1−β6
β62 )(β5 − h−5.27
H−5.27 )2))
F = D(θ0 + θ1(5.27/H)2)
Fang et al. (2000) d = c1
√H(k−β1 )/β1 (1 − z)(k−b)/bqI1+I2
1 qI2
2
c1 =√α0Dα1 Hα2−k/β1 /(β1(t0 − t1) + β2(t1 − q1t2) + β3q1t2)
q1 = (1 − p1)(beta2−β1 )k/β1β2 q2 = (1 − p2)(β3−β2)k/β2β3
t0 = 1 t1 = (1 − p1)k/β1 t2 = (1 − p2)k/β2 z = h/Hb = β1−(I1+I2 )
1 βI12 bI2
3 z = h/H k = 0.000078539I1 = 1 if p2 ≥ z ≥ p1, 0 otherwise I2 = 1 if 1 ≥ z > p2, 0 otherwise
H: Total tree height (m); D: diameter outside bark at breast height (cm); h: height above the ground (m); d: diameter inside bark at any given heighth (cm); A(1.37), A(h): cross-sectional area at breast height and at height h, respectively; HCB: height to live crown base; α, β, θ, γ, δ, p: parameters tobe estimated; z: h/H.
study, we considered both the inclusion of an autoregressiveerror structure specification and random effects.
Most often, the exact information of variance-covariancestructure of the data is lacking, and thus an appropriate se-lection of correlation structure is critical. The most commonintra-individual correlation structure used in forestry is thefirst-order autoregressive error structure (AR1). Because stemtaper data were collected with an unequal distance along thebole, we opted to use the CAR1 correlation structure, which isa continuous version of AR1 and defined as:
Corr(εt, εs) = φ|t−s| (5)
where φ represents the correlation between two observationsone unit apart, t and s refer two observational heights col-lected from the same tree, and |t − s| is the distance betweenthem. In other words, the value of correlation between two ob-servations on the same tree depends on the absolute distancebetween them. This correlation structure can be used to de-scribe unbalanced unequally spaced taper data (Gregoire et al.,1995). Other correlation structures were also tested in prelim-inary analysis and the results suggested minimal differencesbetween the structures.
Mixed-effects models account for both the general popula-tion pattern through fixed effects and individual tree variation
302p5
Ann. For. Sci. 67 (2010) 302 R. Li and A.R. Weiskittel
through random effects. Therefore, it maintains the flexibilityto account for small between-tree variations without the lossof generality. Further, complicated variance-covariance struc-tures can also be specified and included in the mixed-effectsmodels to compensate the within tree auto-correlations that arenot fully eliminated by random variables.
The mixed-effects model framework was formulized as fol-lows:
yi j = f (θi j, xi j) + εi j (6)
wherei = 1, ...,Kj = 1, ..., ni
θi j = Ai j + Zi jbi
b1, ..., bKiid∼ N(0,Φ)
here, yi j denotes the jth observation on the ith tree where wehave K trees in total, and ni observations in ith group. xi j de-notes a vector of covariates corresponding to response yi j. bi
is a vector of random effects for the ith tree with a variance-covariance matrix Φ. The matrices Ai j and Zi j are model ma-trices for the fixed and random effects, respectively.
Within-tree variance heterogeneity in mixed-effects ta-per equations have been reported in the taper literature(e.g. Trincado and Burkhart (2006); Valentine and Gregoire(2001)). Preliminary analysis also indicated that heteroge-neous variance existed in all fitted taper models, as the vari-ance tended to increase with increasing diameters. To furtherimprove parameter estimation, a power or an exponential vari-ance function was used depending on the model form and thedata, to take into account heteroscedasticity. These two vari-ance functions were defined to be:
Var(εi) = σ2|υi|2δ (7)
Var(εi) = σ2exp(2δυi) (8)
where σ2 is the residual sum of squares, υi is the weightingvariable (relative height in the stem in this study), and δ is thevariance function coefficient.
In short, the statistical analysis techniques of mixed-effectsmodeling were used in the present study with a specified cor-relation structure and a variance function to improve infer-ence validation and increase prediction accuracy. Furthermore,mixed-effects models also depicted variations among differentdatasets, plots, and trees through random effects as well as de-scribing the general population trend. Likelihood ratio testsindicated significant improvements in model fit (p < 0.0001)when both the correlation error structure and variance functionwere added.
2.4. Evaluation criteria
Akaike Information Criterion (AIC) and Bayesian Infor-mation Criterion (BIC) are two widely accepted goodness offit criteria for comparing non-nested models (Gregoire et al.,1995) as they essentially represent a penalized likelihood crite-ria. Unfortunately, in this study they were not appropriate cri-teria for selecting and comparing taper functions, because the
response variable for each taper function was not all the same(i.e. dib vs. dib/D). Therefore, AIC and BIC were only used toselect appropriate submodels using the same taper equationswith different formulations of random effects, covariance, andweight parameters.
Instead of using AIC or BIC, the performance of the taperequations were evaluated using mean absolute bias (MAB),root mean squared error (RMSE), and mean percentage of bias(MPB) as well as residual plots. MAB, RMSE, and MPB werecalculated as:
MAB =1n
n∑i=1
∣∣∣Yi − Yi
∣∣∣ (9)
RMSE =
√√√√√√√ n∑i=1
(Yi − Yi)2
n(10)
MPB = 100 ×
n∑i=1
∣∣∣Yi − Yi
∣∣∣n∑
i=1
Yi
(11)
where, Yi and Yi are actual and predicted values of diameter in-side bark or stem volume of ith observation (ith observation ofdiameter measurement or ith individual tree for stem volumeestimates), and n is the total number of observations (numberof diameter estimates or number of trees for stem volume es-timates). For both dib and volume predictions, only the fixedeffects were utilized. One alternative to selecting the “best”model based solely on its validation statistics is to computethe geometric mean of all predictions (W.T. Zakrzewski, per-sonal communication). For comparison, the MAB, RMSE, andMPB were also calculated using this approach.
2.5. Volume estimation
Most taper equations used in this study either do not havecorresponding closed-form volume equations or their inte-grated volume equations are difficult to derive and calculate. Inorder to obtain an estimated volume for each individual tree,we divided each tree into 100 sections. Smalian’s formula wasthen used to calculate the volume for each section, and thesummation of volumes of all sections resulted in the estimatedindividual tree volumes. Since most trees in our study had atleast 10 observations per tree, a short interval between mea-surements, and observations were along the entire stem, theobserved stem volumes were also derived through Smalian’sformula. Using Smalian’s formula to estimate tree volumehas been reported many times in the literature (Corral-Rivaset al., 2007; Diéguez-Aranda et al., 2006; Hibbs et al., 2007;Maguire et al., 1998; Ozcelik, 2008; Zakrzewski, 1999; Zhanget al., 2002), although it may incur small bias on estimatingthe volumes of the stem tip.
Since it is widely used in the Acadian Region and most ofour observations were from the same dataset, our predictions
302p6
Model forms for estimating stem taper and volume Ann. For. Sci. 67 (2010) 302
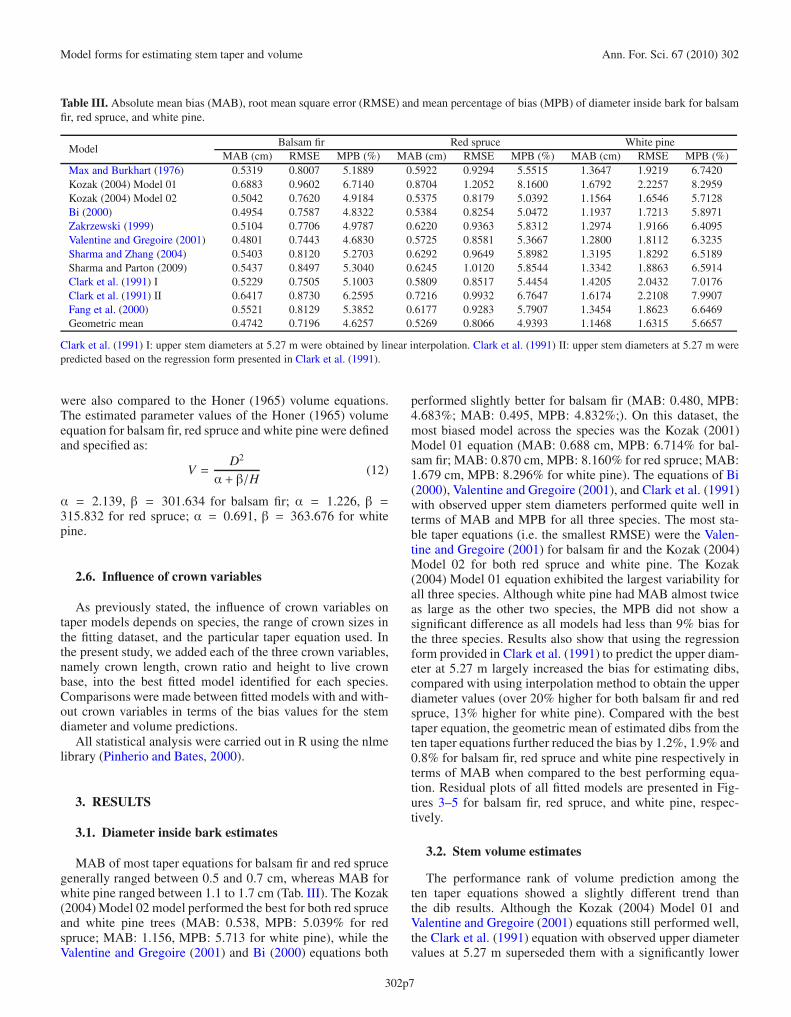
Table III. Absolute mean bias (MAB), root mean square error (RMSE) and mean percentage of bias (MPB) of diameter inside bark for balsamfir, red spruce, and white pine.
ModelBalsam fir Red spruce White pine
MAB (cm) RMSE MPB (%) MAB (cm) RMSE MPB (%) MAB (cm) RMSE MPB (%)Max and Burkhart (1976) 0.5319 0.8007 5.1889 0.5922 0.9294 5.5515 1.3647 1.9219 6.7420Kozak (2004) Model 01 0.6883 0.9602 6.7140 0.8704 1.2052 8.1600 1.6792 2.2257 8.2959Kozak (2004) Model 02 0.5042 0.7620 4.9184 0.5375 0.8179 5.0392 1.1564 1.6546 5.7128Bi (2000) 0.4954 0.7587 4.8322 0.5384 0.8254 5.0472 1.1937 1.7213 5.8971Zakrzewski (1999) 0.5104 0.7706 4.9787 0.6220 0.9363 5.8312 1.2974 1.9166 6.4095Valentine and Gregoire (2001) 0.4801 0.7443 4.6830 0.5725 0.8581 5.3667 1.2800 1.8112 6.3235Sharma and Zhang (2004) 0.5403 0.8120 5.2703 0.6292 0.9649 5.8982 1.3195 1.8292 6.5189Sharma and Parton (2009) 0.5437 0.8497 5.3040 0.6245 1.0120 5.8544 1.3342 1.8863 6.5914Clark et al. (1991) I 0.5229 0.7505 5.1003 0.5809 0.8517 5.4454 1.4205 2.0432 7.0176Clark et al. (1991) II 0.6417 0.8730 6.2595 0.7216 0.9932 6.7647 1.6174 2.2108 7.9907Fang et al. (2000) 0.5521 0.8129 5.3852 0.6177 0.9283 5.7907 1.3454 1.8623 6.6469Geometric mean 0.4742 0.7196 4.6257 0.5269 0.8066 4.9393 1.1468 1.6315 5.6657
Clark et al. (1991) I: upper stem diameters at 5.27 m were obtained by linear interpolation. Clark et al. (1991) II: upper stem diameters at 5.27 m werepredicted based on the regression form presented in Clark et al. (1991).
were also compared to the Honer (1965) volume equations.The estimated parameter values of the Honer (1965) volumeequation for balsam fir, red spruce and white pine were definedand specified as:
V =D2
α + β/H(12)
α = 2.139, β = 301.634 for balsam fir; α = 1.226, β =315.832 for red spruce; α = 0.691, β = 363.676 for whitepine.
2.6. Influence of crown variables
As previously stated, the influence of crown variables ontaper models depends on species, the range of crown sizes inthe fitting dataset, and the particular taper equation used. Inthe present study, we added each of the three crown variables,namely crown length, crown ratio and height to live crownbase, into the best fitted model identified for each species.Comparisons were made between fitted models with and with-out crown variables in terms of the bias values for the stemdiameter and volume predictions.
All statistical analysis were carried out in R using the nlmelibrary (Pinherio and Bates, 2000).
3. RESULTS
3.1. Diameter inside bark estimates
MAB of most taper equations for balsam fir and red sprucegenerally ranged between 0.5 and 0.7 cm, whereas MAB forwhite pine ranged between 1.1 to 1.7 cm (Tab. III). The Kozak(2004) Model 02 model performed the best for both red spruceand white pine trees (MAB: 0.538, MPB: 5.039% for redspruce; MAB: 1.156, MPB: 5.713 for white pine), while theValentine and Gregoire (2001) and Bi (2000) equations both
performed slightly better for balsam fir (MAB: 0.480, MPB:4.683%; MAB: 0.495, MPB: 4.832%;). On this dataset, themost biased model across the species was the Kozak (2001)Model 01 equation (MAB: 0.688 cm, MPB: 6.714% for bal-sam fir; MAB: 0.870 cm, MPB: 8.160% for red spruce; MAB:1.679 cm, MPB: 8.296% for white pine). The equations of Bi(2000), Valentine and Gregoire (2001), and Clark et al. (1991)with observed upper stem diameters performed quite well interms of MAB and MPB for all three species. The most sta-ble taper equations (i.e. the smallest RMSE) were the Valen-tine and Gregoire (2001) for balsam fir and the Kozak (2004)Model 02 for both red spruce and white pine. The Kozak(2004) Model 01 equation exhibited the largest variability forall three species. Although white pine had MAB almost twiceas large as the other two species, the MPB did not show asignificant difference as all models had less than 9% bias forthe three species. Results also show that using the regressionform provided in Clark et al. (1991) to predict the upper diam-eter at 5.27 m largely increased the bias for estimating dibs,compared with using interpolation method to obtain the upperdiameter values (over 20% higher for both balsam fir and redspruce, 13% higher for white pine). Compared with the besttaper equation, the geometric mean of estimated dibs from theten taper equations further reduced the bias by 1.2%, 1.9% and0.8% for balsam fir, red spruce and white pine respectively interms of MAB when compared to the best performing equa-tion. Residual plots of all fitted models are presented in Fig-ures 3–5 for balsam fir, red spruce, and white pine, respec-tively.
3.2. Stem volume estimates
The performance rank of volume prediction among theten taper equations showed a slightly different trend thanthe dib results. Although the Kozak (2004) Model 01 andValentine and Gregoire (2001) equations still performed well,the Clark et al. (1991) equation with observed upper diametervalues at 5.27 m superseded them with a significantly lower
302p7

Ann. For. Sci. 67 (2010) 302 R. Li and A.R. Weiskittel
Table IV. Absolute mean bias (MAB), root mean square error (RMSE) and mean percentage of bias (MPB) of stem volume for balsam fir, redspruce, and white pine.
ModelBalsam fir Red spruce White pine
MAB(m3) RMSE MPB(%) MAB(m3) RMSE MPB(%) MAB(m3) RMSE MPB(%)Max and Burkhart (1976) 0.0110 0.0243 8.1573 0.0115 0.0270 7.9398 0.0951 0.2091 10.9017Kozak (2004) Model 01 0.0100 0.0189 7.3840 0.0098 0.0180 6.7521 0.0624 0.1037 7.1535Kozak (2004) Model 02 0.0090 0.0171 6.6734 0.0087 0.0159 5.9555 0.0574 0.0996 6.5803Bi (2000) 0.0090 0.0172 6.6428 0.0092 0.0174 6.3123 0.0557 0.0997 6.3860Zakrzewski (1999) 0.0091 0.0173 6.7331 0.0100 0.0175 6.8875 0.0557 0.1003 6.3843Valentine and Gregoire (2001) 0.0085 0.0162 6.3062 0.0092 0.0185 6.3125 0.0649 0.1254 7.4402Sharma and Zhang (2004) 0.0104 0.0200 7.6699 0.0109 0.0231 7.5071 0.0723 0.1465 8.2871Sharma and Parton (2009) 0.0108 0.0238 7.9902 0.0118 0.0285 8.1418 0.0875 0.1895 10.0282Clark et al. (1991) I 0.0082 0.0147 6.0595 0.0070 0.0128 4.7888 0.0540 0.1025 6.1865Clark et al. (1991) II 0.0105 0.0200 7.7710 0.0110 0.0220 7.5495 0.0748 0.1516 8.5723Fang and Bailey (2000) 0.0091 0.0169 6.7673 0.0088 0.0158 6.0287 0.0577 0.0964 6.6159Honer equation (1967) 0.0099 0.0176 7.3374 0.0110 0.0231 7.5901 0.0855 0.1671 9.8005Geometric mean 0.0069 0.0137 5.1013 0.0079 0.0162 5.4171 0.0497 0.0848 5.6970
Clark et al. (1991) I: upper stem diameters at 5.27 m were obtained by linear interpolation.Clark et al. (1991) II: upper stem diameters at 5.27 m were predicted based on the regression form presented in Clark et al. (1991).
MAB, RMSE, and MPB for all three species (Tab. IV). TheMAB values for the Clark et al. (1991) taper equation were0.0082, 0.0070, and 0.0540 m3 for balsam fir, red spruce,and white pine, respectively. The second best equation var-ied across the species, which were the Valentine and Gregoire(2001), the Kozak (2004) Model 02 and Zakrzewski (1999) forbalsam fir, red spruce, and white pine, respectively, in terms ofMAB. The corresponding Honer (1965) volume equation pro-duced biases of 0.0099, 0.0110, and 0.0855 m3 for balsam fir,red spruce, and white pine, respectively. The poorest perform-ing taper equation for predicting stem volume on this datasetwas the Max and Burkhart (1976) (MAB: 0.011 m3, MPB:8.157% for balsam fir; MAB: 0.012 m3, MPB: 7.940% for redspruce; MAB: 0.095, MPB: 10.902% for white pine). In gen-eral, white pine trees exhibited more bias and larger variabilityin predicting stem volume than the other two species. In short,the best performing taper equation of Clark et al. (1991) re-duced the stem volume RMSE by 16%, 45%, and 39% whencompared to the commonly used Honer (1965) volume equa-tion for balsam fir, red spruce, and white pine, respectively.When observed upper stem diameter measurements were notavailable, the Fang et al. (2000) equation reduced the stemvolume RMSE by 4%, 32%, and 42% when compared to theHoner (1965) volume equation. On average, most taper equa-tions had less than 8% bias. Similar as dib predictions, the geo-metric mean of estimated volumes from the ten taper equationsfurther reduced the bias by 16% and 8% for balsam fir andwhite pine, but no improvement was observed for red spruce.
3.3. Influence of crown variables
The variable exponent taper equation Kozak (2004)Model 02, the segmented taper equation Clark et al. (1991),and the volume compatible taper equation Fang et al. (2000)were selected for evaluating the effects of the incorporation ofadditional crown variables. Crown ratio (CR), crown length(CL), and height to live crown base (HCB) variables were
added into Kozak Model 02, Clark et al. (1991) and Fanget al. (2000) taper equations. Their corresponding mathemati-cal equations were:
Kozak (2004) Model 02:
di = α0Dα1 Hα2 Xβ1z4
i +β2
(1
eD/H
)+β3X0.1
i +β4(1/D)+β5 HQi+β6Xi+β7CRWN
i(13)
Clark et al. (1991):
d2 =
⎧⎪⎪⎪⎪⎪⎪⎪⎪⎪⎪⎪⎨⎪⎪⎪⎪⎪⎪⎪⎪⎪⎪⎪⎩
IS
(D2(1 + (1−h/H)β1−(1−1.37/H)β1
1−(1−1.37/H)β1
))+IB
(D2 − (D2−F2((1−1.37/H)β4−(1−h/H)β4)
(1−1.37/H)β4−(1−5.27/H)β4
)+IT
(F2(β6
(h−5.27H−5.27 − 1
)2+ IM
(1−β6
β26
) (β5 − h−5.27
H−5.27
)2))+β7CRWN
(14)Fang et al. (2000):
d = c1
√H(k−β1)/β1 (1 − z)(k−b)/bqI1+I2
1 qI22 (15)
c1 =
√(α0 + α3CRWN)Dα1 Hα2−k/β1/(β1(t0 − t1) + β2(t1 − q1t2) + β3q1t2)
(16)where CRWN is the crown variable, which represented eitherCR, CL, or HCB, and β7 and a3 are the parameters relatedto this crown variable that needs to be estimated. All othernotation is the same as defined previously.
For the dib prediction, all three crown variables had posi-tive effects in the Kozak (2004) Model 02 across the species,except for HCB in white pine (Tab. V). The addition of CR im-proved the model performance the most for balsam fir and redspruce trees by reducing MAB 2.2% and 2.5% respectively.
The effects of crown variables in the Clark et al. (1991)equation were mixed across species. For the Clark equationusing interpolated upper diameter values at 5.27 m, CR had
302p8
Model forms for estimating stem taper and volume Ann. For. Sci. 67 (2010) 302
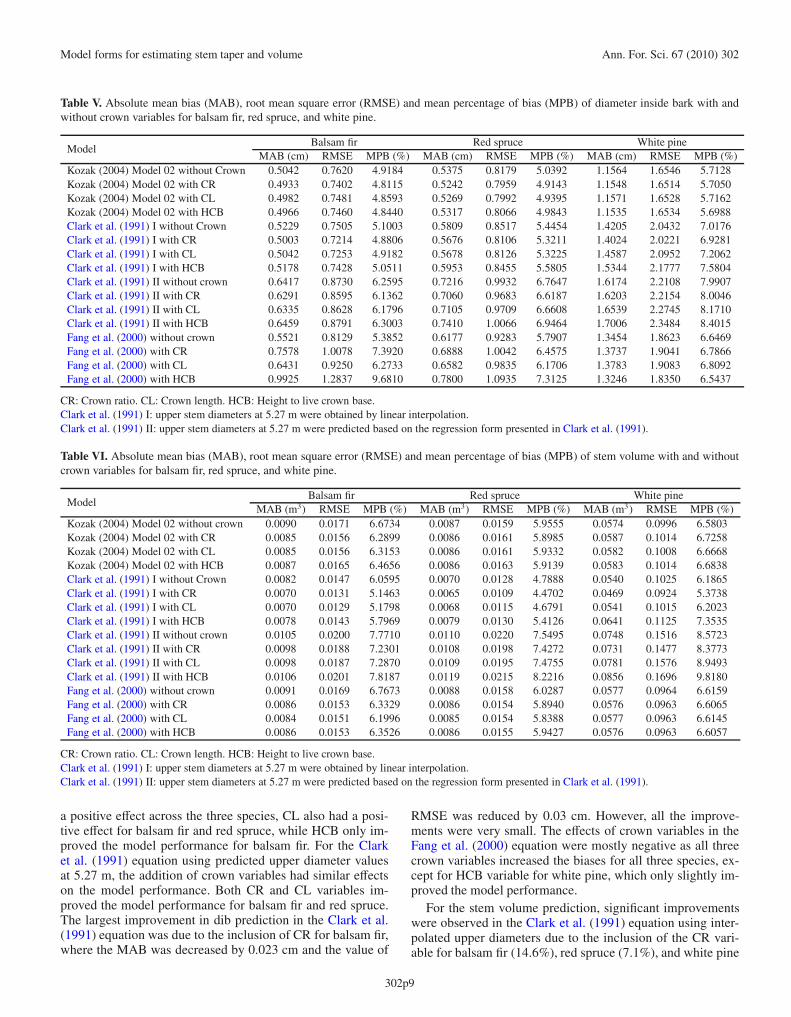
Table V. Absolute mean bias (MAB), root mean square error (RMSE) and mean percentage of bias (MPB) of diameter inside bark with andwithout crown variables for balsam fir, red spruce, and white pine.
ModelBalsam fir Red spruce White pine
MAB (cm) RMSE MPB (%) MAB (cm) RMSE MPB (%) MAB (cm) RMSE MPB (%)Kozak (2004) Model 02 without Crown 0.5042 0.7620 4.9184 0.5375 0.8179 5.0392 1.1564 1.6546 5.7128Kozak (2004) Model 02 with CR 0.4933 0.7402 4.8115 0.5242 0.7959 4.9143 1.1548 1.6514 5.7050Kozak (2004) Model 02 with CL 0.4982 0.7481 4.8593 0.5269 0.7992 4.9395 1.1571 1.6528 5.7162Kozak (2004) Model 02 with HCB 0.4966 0.7460 4.8440 0.5317 0.8066 4.9843 1.1535 1.6534 5.6988Clark et al. (1991) I without Crown 0.5229 0.7505 5.1003 0.5809 0.8517 5.4454 1.4205 2.0432 7.0176Clark et al. (1991) I with CR 0.5003 0.7214 4.8806 0.5676 0.8106 5.3211 1.4024 2.0221 6.9281Clark et al. (1991) I with CL 0.5042 0.7253 4.9182 0.5678 0.8126 5.3225 1.4587 2.0952 7.2062Clark et al. (1991) I with HCB 0.5178 0.7428 5.0511 0.5953 0.8455 5.5805 1.5344 2.1777 7.5804Clark et al. (1991) II without crown 0.6417 0.8730 6.2595 0.7216 0.9932 6.7647 1.6174 2.2108 7.9907Clark et al. (1991) II with CR 0.6291 0.8595 6.1362 0.7060 0.9683 6.6187 1.6203 2.2154 8.0046Clark et al. (1991) II with CL 0.6335 0.8628 6.1796 0.7105 0.9709 6.6608 1.6539 2.2745 8.1710Clark et al. (1991) II with HCB 0.6459 0.8791 6.3003 0.7410 1.0066 6.9464 1.7006 2.3484 8.4015Fang et al. (2000) without crown 0.5521 0.8129 5.3852 0.6177 0.9283 5.7907 1.3454 1.8623 6.6469Fang et al. (2000) with CR 0.7578 1.0078 7.3920 0.6888 1.0042 6.4575 1.3737 1.9041 6.7866Fang et al. (2000) with CL 0.6431 0.9250 6.2733 0.6582 0.9835 6.1706 1.3783 1.9083 6.8092Fang et al. (2000) with HCB 0.9925 1.2837 9.6810 0.7800 1.0935 7.3125 1.3246 1.8350 6.5437
CR: Crown ratio. CL: Crown length. HCB: Height to live crown base.Clark et al. (1991) I: upper stem diameters at 5.27 m were obtained by linear interpolation.Clark et al. (1991) II: upper stem diameters at 5.27 m were predicted based on the regression form presented in Clark et al. (1991).
Table VI. Absolute mean bias (MAB), root mean square error (RMSE) and mean percentage of bias (MPB) of stem volume with and withoutcrown variables for balsam fir, red spruce, and white pine.
ModelBalsam fir Red spruce White pine
MAB (m3) RMSE MPB (%) MAB (m3) RMSE MPB (%) MAB (m3) RMSE MPB (%)Kozak (2004) Model 02 without crown 0.0090 0.0171 6.6734 0.0087 0.0159 5.9555 0.0574 0.0996 6.5803Kozak (2004) Model 02 with CR 0.0085 0.0156 6.2899 0.0086 0.0161 5.8985 0.0587 0.1014 6.7258Kozak (2004) Model 02 with CL 0.0085 0.0156 6.3153 0.0086 0.0161 5.9332 0.0582 0.1008 6.6668Kozak (2004) Model 02 with HCB 0.0087 0.0165 6.4656 0.0086 0.0163 5.9139 0.0583 0.1014 6.6838Clark et al. (1991) I without Crown 0.0082 0.0147 6.0595 0.0070 0.0128 4.7888 0.0540 0.1025 6.1865Clark et al. (1991) I with CR 0.0070 0.0131 5.1463 0.0065 0.0109 4.4702 0.0469 0.0924 5.3738Clark et al. (1991) I with CL 0.0070 0.0129 5.1798 0.0068 0.0115 4.6791 0.0541 0.1015 6.2023Clark et al. (1991) I with HCB 0.0078 0.0143 5.7969 0.0079 0.0130 5.4126 0.0641 0.1125 7.3535Clark et al. (1991) II without crown 0.0105 0.0200 7.7710 0.0110 0.0220 7.5495 0.0748 0.1516 8.5723Clark et al. (1991) II with CR 0.0098 0.0188 7.2301 0.0108 0.0198 7.4272 0.0731 0.1477 8.3773Clark et al. (1991) II with CL 0.0098 0.0187 7.2870 0.0109 0.0195 7.4755 0.0781 0.1576 8.9493Clark et al. (1991) II with HCB 0.0106 0.0201 7.8187 0.0119 0.0215 8.2216 0.0856 0.1696 9.8180Fang et al. (2000) without crown 0.0091 0.0169 6.7673 0.0088 0.0158 6.0287 0.0577 0.0964 6.6159Fang et al. (2000) with CR 0.0086 0.0153 6.3329 0.0086 0.0154 5.8940 0.0576 0.0963 6.6065Fang et al. (2000) with CL 0.0084 0.0151 6.1996 0.0085 0.0154 5.8388 0.0577 0.0963 6.6145Fang et al. (2000) with HCB 0.0086 0.0153 6.3526 0.0086 0.0155 5.9427 0.0576 0.0963 6.6057
CR: Crown ratio. CL: Crown length. HCB: Height to live crown base.Clark et al. (1991) I: upper stem diameters at 5.27 m were obtained by linear interpolation.Clark et al. (1991) II: upper stem diameters at 5.27 m were predicted based on the regression form presented in Clark et al. (1991).
a positive effect across the three species, CL also had a posi-tive effect for balsam fir and red spruce, while HCB only im-proved the model performance for balsam fir. For the Clarket al. (1991) equation using predicted upper diameter valuesat 5.27 m, the addition of crown variables had similar effectson the model performance. Both CR and CL variables im-proved the model performance for balsam fir and red spruce.The largest improvement in dib prediction in the Clark et al.(1991) equation was due to the inclusion of CR for balsam fir,where the MAB was decreased by 0.023 cm and the value of
RMSE was reduced by 0.03 cm. However, all the improve-ments were very small. The effects of crown variables in theFang et al. (2000) equation were mostly negative as all threecrown variables increased the biases for all three species, ex-cept for HCB variable for white pine, which only slightly im-proved the model performance.
For the stem volume prediction, significant improvementswere observed in the Clark et al. (1991) equation using inter-polated upper diameters due to the inclusion of the CR vari-able for balsam fir (14.6%), red spruce (7.1%), and white pine
302p9

Ann. For. Sci. 67 (2010) 302 R. Li and A.R. Weiskittel
(13.1%) (Tab. VI). In the Kozak (2004) Model 02 equation,both CR and CL variables reduced the bias by 5.5% for balsamfir. Modest improvements were also produced for red sprucewith the addition of the CL and HCB variables in both equa-tions of the Kozak (2004) Model 02 and Clark et al. (1991)with predicted upper diameters. However, white pine showedvery little sensitivity to crown variables in both equations. Inthe Fang et al. (2000) equation, CR reduced the bias by 7.7%for balsam fir. Other modest improvements were also observedwith the addition of crown variables for red spruce and whitepine.
4. DISCUSSION
Taper equations are invaluable tools, but selecting an ap-propriate model that works well across multiple species andvarious stand conditions can be difficult because of the varietyof forms that are currently available. In this study, an extensiveregional database for three ecologically distinct conifer specieswas compiled and used to compare ten commonly used ta-per equations. Across the species, the variable-exponent taperequation of Kozak (2004) Model 02 and the segmented taperequation of Clark et al. (1991) were identified as the most re-liable and accurate taper equations for predicting both dib andtotal stem volume, respectively. The Valentine and Gregoire(2001) taper equation, which includes HCB as an input vari-able, performed well for balsam fir in stem form and volumepredictions. The inclusion of crown variables such as crownratio and crown length only slightly improved stem form pre-dictions, despite the large range of crown sizes available inthis analysis. However, inclusion of crown ratio largely im-proved stem volume predictions for balsam fir and red spruce.Compared with the widely used Honer (1965) regional vol-ume equation, most taper equations in our study have a betterpredictive ability for estimating individual tree stem volume.
The Kozak (2004) Model 02 equation has previously beenshown to work well across a range of species and biogeocli-matic zones. In maritime pine in Spain, Rojo et al. (2005) alsofound that the Kozak (2004) Model 02 had the lowest meansquare error (MSE) of 31 different taper equations for predict-ing dob and its MSE was 4.5% lower than the next best per-forming equation. The Clark et al. (1991) taper equation wasalso developed to work well across multiple species as it wasoriginally applied to 58 different tree species in the SouthernUS. In comparison to the Max and Burkhart (1976) equation,Jiang et al. (2005) found the Clark et al. (1991) reduced thestandard error of estimate by 16 to 23% in predicting dob anddib of yellow-poplar. In predicting dib in this present study,the best equation depended on species, as the Kozak (2004)Model 02 equation had a RMSE that was lower than the nextbest performing equation for red spruce and white pine, re-spectively. For balsam fir, the Kozak (2004) Model 02 andValentine and Gregoire (2001) equations performed equallywell as the difference in RMSE was less than 2.3%. This sug-gests that variable exponent equations like the Kozak (2004)Model 02 may have greater flexibility and ease in representingvariation in stem form than significantly more complex equa-tions. In addition, the Kozak (2004) Model 02 equation pro-
vided a smooth continuous taper profile for each tree, whileother taper equations such as Valentine and Gregoire (2001),and Clark et al. (1991) equations described the tree shape inthree segmented sections.
A taper equation not only needs to predict stem formwell, but also provide accurate estimates of stem volume. Arelatively limited number of studies have compared the ac-curacy of stem taper equations in predicting actual stem vol-ume because of the difficulty in measuring the true stem vol-ume. Filho and Schaaf (1999) indicated that the Clark et al.(1991) equation was the best at estimating true stem volume(determined with a xylometer) of the models examined in theirstudy. Most studies must obtain observed stem volume by us-ing either Smalian or Huber’s formula, which often leads to anunderestimation of a taper equation’s true error (e.g. Filho andSchaaf 1999). Although Smalian’s formula can be highly bi-ased, its use in this study was believed justified as the distancebetween observations was taken along the full length of thestem and generally they were less than 2 m apart. The numeri-cal integration of natural cubic splines for each individual treevolume were also tested and the difference between Smalian’sand the derived splines were less than 1% of the average treevolume. Thus, the results of this study further suggest that theClark et al. (1991) equation was significantly superior acrossmultiple species at estimating volume when upper stem diam-eter measurements are available, which supports the resultsof several other studies (e.g. Filho and Schaaf 1999; Jianget al. 2005). In this present study, the Clark et al. (1991) equa-tion reduced the RMSE by 9.3, and 19.5% when comparedto the next best equation for balsam fir and red spruce, re-spectively. For white pine, the Clark et al. (1991) equationstill gave the best predictions of stem volume, but its RMSEwas slightly poorer than that of Bi (2000), Zakrzewski (1999),Kozak (2004) Model 02 and Fang et al. (2000). Clearly, thesegmented form-class approach of Clark et al. (1991) excelsat estimating stem volume. Further, it does not require nu-merical integration like the variable exponent equations. How-ever, the accuracy of predicting upper diameters at 5.27 m wasimportant in determining the model’s performance, as therewas a significant difference in the model performance whenobserved versus predicted upper diameters were used. Whenmeasurements at 5.27 m are not available, other well-behavedtaper equations should be considered. In our study, the Valen-tine and Gregoire (2001), Kozak (2004) Model 02 and Bi(2000) all performed well depending on species.
Compatible taper and volume equations offer several ben-efits such as additivity and flexibility over traditional taperequations (Fang et al., 2000). Diéguez-Aranda et al. (2006)compared 15 different compatible taper equations for Scotspine [Pinus sylvestris (L.)] and found the compatible ta-per/volume system of Fang et al. (2000) provided the bestoverall performance in estimating total stem volume, whileits prediction of stem form was similar to those provided bya continuous variable form equation. A similar result wasrecently found by Corral-Rivas (2007) for five major pinespecies in Durango, Mexico. Although comparing the meritsof compatible and traditional taper equations was not an ex-plicit objective of this present analysis, we did find the Fang
302p10
Model forms for estimating stem taper and volume Ann. For. Sci. 67 (2010) 302
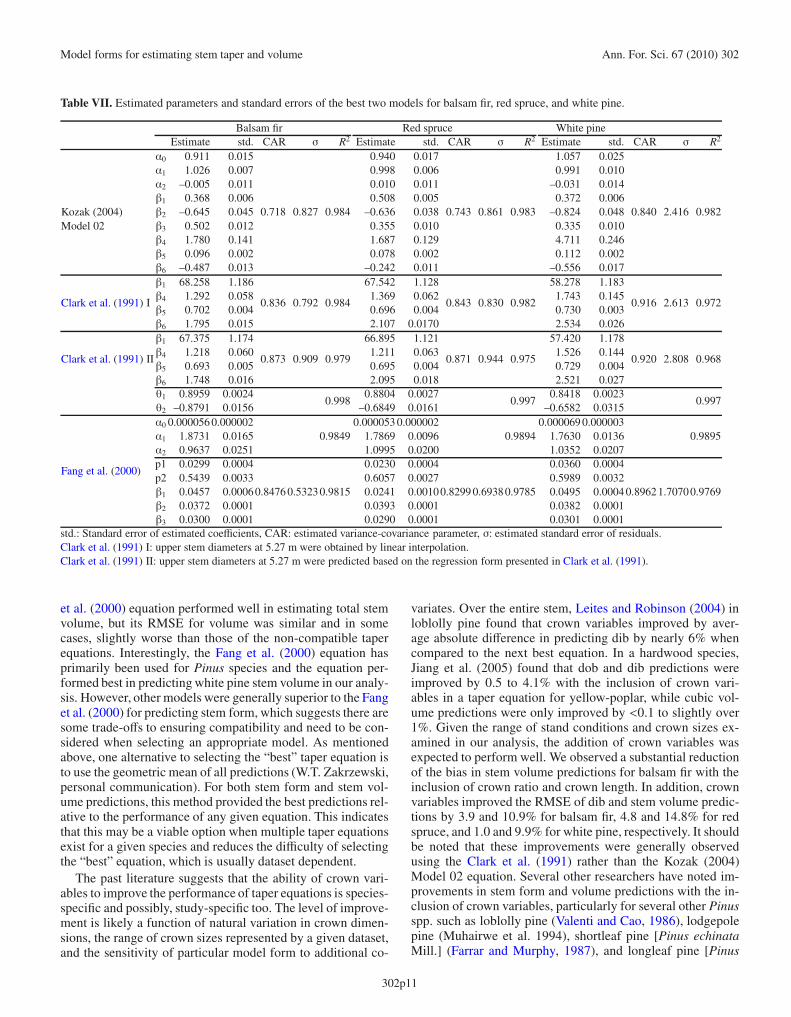
Table VII. Estimated parameters and standard errors of the best two models for balsam fir, red spruce, and white pine.
Balsam fir Red spruce White pineEstimate std. CAR σ R2 Estimate std. CAR σ R2 Estimate std. CAR σ R2
Kozak (2004)
α0 0.911 0.015
0.718 0.827 0.984
0.940 0.017
0.743 0.861 0.983
1.057 0.025
0.840 2.416 0.982
α1 1.026 0.007 0.998 0.006 0.991 0.010α2 –0.005 0.011 0.010 0.011 –0.031 0.014β1 0.368 0.006 0.508 0.005 0.372 0.006β2 –0.645 0.045 –0.636 0.038 –0.824 0.048
Model 02 β3 0.502 0.012 0.355 0.010 0.335 0.010β4 1.780 0.141 1.687 0.129 4.711 0.246β5 0.096 0.002 0.078 0.002 0.112 0.002β6 –0.487 0.013 –0.242 0.011 –0.556 0.017
Clark et al. (1991) I
β1 68.258 1.186
0.836 0.792 0.984
67.542 1.128
0.843 0.830 0.982
58.278 1.183
0.916 2.613 0.972β4 1.292 0.058 1.369 0.062 1.743 0.145β5 0.702 0.004 0.696 0.004 0.730 0.003β6 1.795 0.015 2.107 0.0170 2.534 0.026
Clark et al. (1991) II
β1 67.375 1.174
0.873 0.909 0.979
66.895 1.121
0.871 0.944 0.975
57.420 1.178
0.920 2.808 0.968β4 1.218 0.060 1.211 0.063 1.526 0.144β5 0.693 0.005 0.695 0.004 0.729 0.004β6 1.748 0.016 2.095 0.018 2.521 0.027θ1 0.8959 0.0024
0.9980.8804 0.0027
0.9970.8418 0.0023
0.997θ2 –0.8791 0.0156 –0.6849 0.0161 –0.6582 0.0315
Fang et al. (2000)
α0 0.000056 0.0000020.9849
0.000053 0.0000020.9894
0.000069 0.0000030.9895α1 1.8731 0.0165 1.7869 0.0096 1.7630 0.0136
α2 0.9637 0.0251 1.0995 0.0200 1.0352 0.0207p1 0.0299 0.0004
0.8476 0.53230.9815
0.0230 0.0004
0.8299 0.69380.9785
0.0360 0.0004
0.89621.70700.9769p2 0.5439 0.0033 0.6057 0.0027 0.5989 0.0032β1 0.0457 0.0006 0.0241 0.0010 0.0495 0.0004β2 0.0372 0.0001 0.0393 0.0001 0.0382 0.0001β3 0.0300 0.0001 0.0290 0.0001 0.0301 0.0001
std.: Standard error of estimated coefficients, CAR: estimated variance-covariance parameter, σ: estimated standard error of residuals.Clark et al. (1991) I: upper stem diameters at 5.27 m were obtained by linear interpolation.Clark et al. (1991) II: upper stem diameters at 5.27 m were predicted based on the regression form presented in Clark et al. (1991).
et al. (2000) equation performed well in estimating total stemvolume, but its RMSE for volume was similar and in somecases, slightly worse than those of the non-compatible taperequations. Interestingly, the Fang et al. (2000) equation hasprimarily been used for Pinus species and the equation per-formed best in predicting white pine stem volume in our analy-sis. However, other models were generally superior to the Fanget al. (2000) for predicting stem form, which suggests there aresome trade-offs to ensuring compatibility and need to be con-sidered when selecting an appropriate model. As mentionedabove, one alternative to selecting the “best” taper equation isto use the geometric mean of all predictions (W.T. Zakrzewski,personal communication). For both stem form and stem vol-ume predictions, this method provided the best predictions rel-ative to the performance of any given equation. This indicatesthat this may be a viable option when multiple taper equationsexist for a given species and reduces the difficulty of selectingthe “best” equation, which is usually dataset dependent.
The past literature suggests that the ability of crown vari-ables to improve the performance of taper equations is species-specific and possibly, study-specific too. The level of improve-ment is likely a function of natural variation in crown dimen-sions, the range of crown sizes represented by a given dataset,and the sensitivity of particular model form to additional co-
variates. Over the entire stem, Leites and Robinson (2004) inloblolly pine found that crown variables improved by aver-age absolute difference in predicting dib by nearly 6% whencompared to the next best equation. In a hardwood species,Jiang et al. (2005) found that dob and dib predictions wereimproved by 0.5 to 4.1% with the inclusion of crown vari-ables in a taper equation for yellow-poplar, while cubic vol-ume predictions were only improved by <0.1 to slightly over1%. Given the range of stand conditions and crown sizes ex-amined in our analysis, the addition of crown variables wasexpected to perform well. We observed a substantial reductionof the bias in stem volume predictions for balsam fir with theinclusion of crown ratio and crown length. In addition, crownvariables improved the RMSE of dib and stem volume predic-tions by 3.9 and 10.9% for balsam fir, 4.8 and 14.8% for redspruce, and 1.0 and 9.9% for white pine, respectively. It shouldbe noted that these improvements were generally observedusing the Clark et al. (1991) rather than the Kozak (2004)Model 02 equation. Several other researchers have noted im-provements in stem form and volume predictions with the in-clusion of crown variables, particularly for several other Pinusspp. such as loblolly pine (Valenti and Cao, 1986), lodgepolepine (Muhairwe et al. 1994), shortleaf pine [Pinus echinataMill.] (Farrar and Murphy, 1987), and longleaf pine [Pinus
302p11

Ann. For. Sci. 67 (2010) 302 R. Li and A.R. Weiskittel
Kozak (2004) Model 01 Kozak (2004) Model 02
Figure 3. Residual plots (observed-predicted) of fitted models of diameter inside bark for balsam fir. Solid line is a lowess regression.
palustris Mill.] (Shaw et al., 2003). The results of this study in-dicated modest gains of stem form and relatively large gains ofstem volume for the most shade tolerant and intolerant speciesexamined in this analysis, which suggests that shade tolerancemight be the driving factor for the importance of crown vari-ables in taper equations. The results of Walters and Hann(1986) also indicated that crown ratio significantly improved
predictions of stem form across a wide range of species shadetolerance levels in mixed conifer stands of southwest Oregon.Hence, model form and study species are likely confoundingthe interpretation of the importance of crown variable in ta-per equations and an analysis utilizing a similar model formacross a wider range of species than this present study wouldbe a better test of this hypothesis.
302p12

Model forms for estimating stem taper and volume Ann. For. Sci. 67 (2010) 302
Kozak (2004) Model 01 Kozak (2004) Model 02
Figure 4. Residual plots (observed-predicted) of fitted models of diameter inside bark for red spruce. Solid line is a lowess regression.
White pine trees showed a slightly different trend fromthe other two species in our study (e.g. higher between-treevariation and greater bias in the final equation). A portion ofthis difference can be easily attributed to the greater range oftree sizes available in the white pine dataset in comparison tothe other two species (e.g. Figs. 1, 2 and Tab. I). White pinemay also have higher inherent between-tree variation becauseof the long-term impacts of white pine weevil [Pissodes strobi
(Peck)] in this region, which can cause extensive damage to theleader and severe stem deformities. Although severely dam-aged stems were not utilized in this study, a high proportionof white pines in the eastern US are impacted by the wee-vil to some degree and consequently, subtle changes in thestem form can not entirely accounted for by tree size. For agiven tree size, white pine showed larger inter-tree variationand higher residual standard errors for all examined equations
302p13

Ann. For. Sci. 67 (2010) 302 R. Li and A.R. Weiskittel
Kozak (2004) Model 01 Kozak (2004) Model 02
Figure 5. Residual plots (observed-predicted) of fitted models of diameter inside bark for white pine. Solid line is a lowess regression.
than the other two species (Tab. VII). However, for a tree withthe same size (i.e. same DBH and total height), the taper pro-file of three species did not differ greatly, with the predictedlower section almost identical among three species (Fig. 6).The difference existed in the upper- and mid-portions of thestem, where red spruce was predicted to have a greater rela-tive diameter in the Kozak (2004) Model 02, and white pineshowed a greater relative diameter in the Clark et al. (1991)equation in comparison to the other species.
5. CONCLUSIONS
This analysis represents one of the first attempts to developa regional taper equation for the primary conifer species inthe Acadian Region of North America. Of the ten taper equa-tions evaluated, the Clark et al. (1991) equation proved to bethe best at predicting stem volume across the three specieswhen upper stem diameter measurements are available. TheKozak (2004) Model 02 was the most accurate equation for
302p14

Model forms for estimating stem taper and volume Ann. For. Sci. 67 (2010) 302
Figure 6. Predicted relative diameter over relative height using the Kozak (2004) Model 02 (left) and Clark et al. (1991) (right) taper equationsfor a large tree (upper; total height: 22 m, DBH: 35 cm) and a small tree (bottom; total height: 11.8 m, DBH: 11.6 cm).
predicting red spruce and white pine stem form. The inclusionof additional crown variable generally had a minimal impacton improving predictions of either stem form or volume for theKozak (2004) Model 02. Modest improvements in the Clarket al. (1991) equation were observed for red spruce and whitepine. Compared to the Honer (1965) stem volume equations,these taper equations are a vast improvement with reductionsin the prediction error upwards to 45%. However, selecting the“best” equation is difficult as it depends on species, dataset,and intended use. The use of the geometric mean of all pre-dictions is, therefore, suggested when multiple equations fora certain species exist. The equations performed well acrossa range of stand conditions and will likely help improve esti-mates of standing volume in the region.
Acknowledgements: This study was supported by the University ofMaine Forest Bioproducts Research Initiative, Cooperative ForestryResearch Unit, and School of Forest Resources. Our thanks also goesto Ontario Ministry of Natural Resources, Robert Seymour, LauraKenefic, Leah Phillips, Dan Gilmore, Doug Maguire, Micah Pace,Spencer Meyer, and Bret Vicary for providing access to the data usedin this analysis. Special thanks to Jeff Gove, Dan Binkley, VoyteckZakrzewski, and two anonymous reviewers who helped to improvean earlier draft of this manuscript.
REFERENCES
Bi H., 2000. Trigonometric variable-form taper equations for Australianeucalyptus. For. Sci. 46: 397–409.
Briggs R.D. and Lemin R.C., Jr., 1992. Delineation of climatic regions inMaine. Can. J. For. Res. 22: 801–811.
Burkhart H.E. and Walton S.B., 1985. Incorporating crown ratio into ta-per equations for loblolly pine trees. For. Sci. 31: 478–484.
Chi E.M. and Reinsel G.C., 1989. Models for longitudinal data with ran-dom effects and AR(1) errors. J. Amer. Statistical Assoc. 84: 452–460.
Clark III A.C., Souter R.A., and Schlaegel B.E., 1991. Stem profile equa-tions for southern tree species. USDA For. Serv. South. Res. Pap.SE-282. Asheville, NC. 113 p.
Clutter J.L., Fortson J.C., Pienaar L.V., Brister G.H., and Bailey R.L.,1983. Timber Management, John Wiley & Sons.
Corral-Rivas J.J., Diéguez-Aranda U., Rivas S.C., and Dorado F.C., 2007.A merchantable volume system for major pine species in El Salto,Durango (Mexico). For. Ecol. Manage. 238: 118–129.
Diéguez-Aranda U., Castedo-Dorado F., Álvarez-González J.G., andRojo A., 2006. Compatible taper function for plantations in north-western Spain. Can. J. For. Res. 36: 1190-1205.
Davidian M. and Giltinan D.M., 1995. Nonlinear models for repeatedmeasurement data. Chapman & Hall.
Fang Z., Borders B.E., and Bailey R.L., 2000. Compatible volume-tapermodels for loblolly and slash pine based on a system with segmented-stem form factors. For. Sci. 46: 1–12.
Farrar R.M. and Murphy P.A., 1987. Taper functions for predicting prod-uct volumes in natural shortleaf pine. US For. Serv. Res. Pap. SO-234, Asheville, NC, 9 p.
Filho A.F. and Schaaf L.B., 1999. Comparison between predicted vol-umes estimated by taper equations and true volumes obtained by thewater displacement technique (xylometer). Can. J. For. Res. 29: 451–461.
302p15

Ann. For. Sci. 67 (2010) 302 R. Li and A.R. Weiskittel
Garber S.M. and Maguire D.A., 2003. Modeling stem taper of three cen-tral Oregon species using nonlinear mixed effects models and autore-gressive error structures. For. Ecol. Manage. 179: 507–522.
Gilmore D.W. and Seymour R.S., 1996. Alternative measures of stemgrowth efficiency applied to Abies balsamea from four canopy posi-tions in central Maine. For. Ecol. Manage. 84: 209–218.
Gregoire T.G., Schabenberger O., and Barrett J.P., 1995. Linear mod-elling of irregularly spaced, unbalanced, longitudinal data frompermanent-plot measurements. Can. J. For. Res. 25: 137–156.
Hibbs D.E., Bluhm A.R., and Garber S.M., 2007. Stem taper and volumeof managed red alder. West. J. Appl. For. 22: 61–66.
Honer T.G., 1965. A new total cubic foot volume function. For. Chron.41: 476–493.
Jiang L., Brooks J.R., and Hobbs G.R., 2007. Using crown ratio inyellow-poplar compatible taper and volume equations. North. J.Appl. For. 24: 271–275.
Kozak A., 1988. A variable-exponent taper equation. Can. J. For. Res. 18:1363–1368.
Kozak A., 1998. Effects of upper stem measurements on the predictiveability of a variable-exponent taper equation. Can. J. For. Res. 28:1078–1083.
Kozak A., 2004. My last words on taper equations. For. Chron. 80: 507–514.
Kozak A. and Smith J.H.G., 1993. Standards for evaluating taper estimat-ing systems. For. Chron. 69: 438–444.
Kozak A., Munro D.D., and Smith J.H.G., 1969. Taper functions and theirapplication in forest inventory. For. Chron. 45: 278–283.
Lappi J., 2006. A multivariate, nonparametric stem-curve predictionmethod. Can. J. For. Res. 36: 1017–1027.
Larson B.C., 1963. Stem form development of forest trees. For. Sci.Monogr. 5: 1–42.
Leites L.P. and Robinson A.P., 2004. Improving taper equations ofloblolly pine with crown dimensions in a mixed-effects modelingframework. For. Sci. 50: 204–212.
Maguire D.A., Brissette J., and Gu L., 1998. Crown structure and growthefficiency of red spruce in uneven-aged, mixed species stands inMaine. Can. J. For. Res. 28: 1233–1240.
Maguire D.A. and Batista J.L.F., 1996. Sapwood taper models and im-plied sapwood volume and foliage profiles for coastal Douglas-fir.Can. J. For. Res. 26: 849–863.
Max T.A. and Burkhart H.E., 1976. Segmented polynomial regressionapplied to taper equations. For. Sci. 22: 283–289.
McWilliams W.H., Butler B.J., Caldwell L.E., Griffith D.M., HoppusM.L., Laustsen K.M., Lister A.J., Lister T.W., Metzler J.W., MorinR.S., Sader S.A., Stewart L.B., Steinman J.R., Westfall J.A.,Williams D.A., Whitman A., and Woodall C.W., 2005. The forestsof Maine: 2003. Resource Bulletin NE-164. US Department ofAgriculture, Forest Service, Northeastern Research Station, NewtonSquare, PA, 188 p.
Meyer S.R., 2005. Leaf area as a growth predictor of Abies balsamea andPicea rubens in managed stands in Maine. Master’s thesis, Universityof Maine, Orono, 117 p.
Muhairwe C.K, LeMay V.M., and Kozak A., 1994. Effects of adding tree,stand, and site variables to Kozak’s variable-exponent taper equation.Can. J. For. Res. 24: 252–259.
Ozcelik R., 2008. Comparison of formulae for estimating tree bole vol-umes of Pinus sylvestris. Scand J. For Res. 23: 412–418.
Pace M.D., 2003. Effect of stand density on behavior of leaf area pre-diction models for eastern white pine (Pinus strobus L.) in Maine.Master’s thesis, University of Maine, Orono, 69 p.
Phillips L.M., 2002. Crop tree growth and quality twenty-five years afterprecommercial thinning in a northern conifer stand. Master’s thesis,University of Maine, Orono, 88 p.
Pinherio J.C. and Bates D.M., 2000. Mixed-effects models in S and S-Plus. Springer-Verlag, New York, NY.
Pitt D. and Lanteigne L., 2008. Long-term outcome of precommercialthinning in northwestern new Brunswick: growth and yield of balsamfir and red spruce. Can. J. For. Res. 38: 592–610.
Rojo A., Perales X., Sanchez-Rodriguez F., Alvarez-Gonzalez J.G., andvon Gadow K., 2005. Stem taper functions for maritime pine (Pinuspinaster Ait.) in Galicia (northwestern Spain). Eur. J. For. Res. 25:177–186.
Sharma M. and Parton J., 2009. Modeling stand density effects on taperfor jack pine and black spruce plantations using dimensional analy-sis. For. Sci. 55: 268–282.
Sharma M. and Zhang S.Y., 2004. Variable-exponent taper equations forjack pine, black spruce, and balsam fir in eastern Canada. Can. J. For.Res. 198: 39–53.
Shaw D.J., Meldahl R.S., Kush J.S., and Somers G.L., 2003. A tree tapermodel based on similar triangles and use of crown ratio as a measureof form in taper equations for longleaf pine. Tech. Rep., US ForestService Southern Research Station General Technical Report SRS-66, Asheville, NC, 8 p.
Thomas C.E. and Parresol B.R., 1991. Simple, flexible trigonometric ta-per equations. Can. J. For. Res. 21: 1132–1137.
Trincado G. and Burkhart H.E., 2006. A generalized approach for mod-eling and localizing stem profile curves. For. Res. 52: 670–682.
Valenti M.A. and Cao Q.V., 1986. Use of crown ratio to improve loblollypine taper functions. Can. J. For. Res. 16: 1141–1145.
Valentine H.T. and Gregoire T.G., 2001. A switching model of bole taper.Can. J. For. Res. 31: 1400–1409.
Vicary B.P., Brann T.B., and Griffin R.H., 1984. Polymorphic site indexcurves for even-aged spruce-fir stands in Maine. Maine AgriculturalExperiment Station Bulletin 802. University of Maine, Orono, 33 p.
Walters D.K. and Hann D.W., 1986. Taper equations for six coniferspecies in southwest Oregon. Research Bulletin 56, Forest ResearchLaboratory, Oregon State University, Corvallis, OR. 36 p.
Weiskittel A.R., Kenefic L.S, Seymour R.S, and Phillips L., 2009, Long-term effects of precommercial thinning on the stem dimensions form,volume, and branch characteristics of red spruce and balsam fir croptrees in Maine, USA. Silva Fenn. 43: 397–409.
Zakrzewski W.T., 1999. A mathematically tractable stem profile modelfor jack pine in Ontario. North. J. Appl. For. 16: 138–143.
Zhang Y., Borders B.E., and Bailey R.L., 2002. Derivation, fitting, andimplication of a compatible stem taper-volume-weight system for in-tensively managed, fast growing loblolly pine. For. Sci. 48: 595–607.
302p16